
Abstract
Background:
The expression level and clinical significance of integrin subunit beta 4 (ITGB4) in head and neck squamous cell carcinoma (HNSCC) remain unclear.
Materials and Methods:
Expression of ITGB4 in HNSCC tissues was evaluated by calculating standard mean differences (SMDs) based on gene chips, RNA-seq, and immunohistochemistry data (n = 2330) from multiple sources. Receiver operating characteristic (ROC) curves were used to detect the ability of ITGB4 to distinguish HNSCC from non-HNSCC samples. The relationship between the expression level of ITGB4 and clinical parameters was evaluated by calculating SMDs.
Results:
Identical results of mRNA and protein levels indicated remarkable up-expression of ITGB4 in HNSCC tissues. Further ROC curves showed that ITGB4 could distinguish HNSCC from non-HNSCC samples. Genetic alteration analysis of ITGB4 in HNSCC indicated that overexpression of ITGB4 in HNSCC was likely not owing to genetic alteration of ITGB4. Moreover, ITGB4 overexpression level may be correlated with clinical T stage.
Conclusion:
ITGB4 likely plays an essential role in HNSCC occurrence based on our study and its potential diagnostic value is worthy of further exploration in the future.
Introduction
Head and neck carcinomas (HNCs) generally occur in the oral cavity, nasopharynx, oropharynx, hypopharynx, and larynx. 1 In China, ∼135,100 new cases of HNCs are diagnosed and roughly 70,700 patients die of it each year. 2 Globally, >834,000 new cases are diagnosed annually, and >431,000 HNC patients die. 3 HNCs are of various histopathological types, with head and neck squamous cell carcinomas (HNSCCs) comprising >90%, 4 including laryngeal squamous cell carcinoma (LSCC), nasopharynx cancer (NPC), and oral squamous cell carcinoma (OSCC).
It has been suggested that the pathogenesis of most HNSCCs is possibly related to the consumption of alcohol, the intake of tobacco, and infection with human papillomavirus, 5,6 and uniquely, most NPC patients are infected with Epstein–Barr virus. 7 However, the pathological mechanism of HNSCCs remains complicated, with multiple molecules and pathways involved. 6,8
Treatments differ according to the TNM stage and include surgery, radiotherapy, chemotherapy, immunotherapy, and targeted therapy. 9 –11 Unfortunately, patients with HNSCC often present in advanced stages because of the lack of an effective screening method, and they are prone to local recurrence and distance metastasis after treatment, resulting in a dismal 5-year survival rate. 12,13 To improve the diagnosis, treatment and prevention of HNSCC, researchers have attempted to discover more effective biomarkers in HNSCC development by investigating the molecular mechanisms of cell proliferation, apoptosis, and invasion. 14 –16
Among potential tumor genes, the integrin subunit beta 4 (ITGB4) encodes the integrin beta 4 subunit. This subunit is thought to be important in the biology of invasive cancer; it participates in the adhesion of extracellular matrix and cells, and transduces signals regulating gene expression and cell growth by binding to the α6 subunit. 17
There have been multiple studies related to the expression level of ITGB4 in HNSCC. Our previous study focusing on the protein level of ITGB4 in LSCC found an upregulation of ITGB4 protein level based on tissue microarrays detection. 18 However, it is controversial whether ITGB4 is overexpressed or underexpressed in some HNSCCs. For instance, patients with OSCC have been shown to express higher ITGB4 level than the normal, 19 whereas some scholars thought lower expression of ITGB4 in OSCC samples. 20 And similar contradictions occur in other HNSCCs, such as in NPC. 21,22 Moreover and up to date, few reports on the mechanism of ITBG4 in HNSCCs can be seen. Thus, the clinical significance of ITGB4 in HNSCC requires further analysis.
In this research, we have comprehensively screened and analyzed mRNA expression data from the ArrayExpress database, the Gene Expression Omnibus (GEO) database, the Sequence Read Archive (SRA) database, the Oncomine database, the Cancer Genome Atlas (TCGA) and various other sources of literature, and we have downloaded immunohistochemical data from the Human Protein Atlas (THPA) to explore ITGB4 expression at the protein level in HNSCC. Moreover, we have attempted to discuss the relationship between clinical parameters and expression of ITGB4 in HNSCCs to provide new insights for research on the pathogenesis, development, diagnosis, treatment and prevention of HNSCC.
Materials and Methods
ITGB4- and HNSCC-related microarray data collection and extraction
Several public databases, including the ArrayExpress database (
The inclusion criteria of these microarrays were as follows: (1) the species was Homo sapiens; (2) tissue samples were obtained from the mouth, nasopharynx, pharynx, and throat; (3) tumor samples were diagnosed as SCC; (4) ITGB4 expression profile data were provided; and (5) each microarray contained HNSCC tissue samples and normal control samples, and the sample size of each group was not less than three. The exclusion criteria were as follows: (1) microarrays without cancer or normal control samples; (2) microarrays without ITGB4 expression data; (3) duplicate or incomplete data; and (4) drug-related studies.
ITGB4- and HNSCC-related RNA sequencing data collection and extraction
The mRNA expression of ITGB4 in HNSCC and clinicopathological parameters were extracted in the RNA-seq data from the TCGA database (
Immunohistochemistry data collection and expression calculation criteria
From the pathology atlas of THPA database (
Total Score Criteria of Integrin Subunit Beta 4 Protein Expression Level
For instance, when a patient with “strong” antibody staining intensity and “ > 75%” quantity, then the total score of the patient = 3 × 3, that is 9.
Genetic alteration analysis of ITGB4 in HNSCC
The Catalogue of Somatic Mutations in Cancer (COSMIC;
Statistical analysis
The main designs of this study are given in Figure 1. In this study, the chip data were log2 converted, and the RNA-seq data were in the form of log2(Fragments Per Kilobase of exon model per Million mapped fragments).

Design of the current study. ITGB4, integrin subunit beta 4; HNSCC, head and neck squamous cell carcinoma; TCGA, the Cancer Genome Atlas.
The ggpubr package in R v3.6.1 was used to plot the combination charts of violin and box for comparing the ITGB4 expression of the HNSCC and non-HNSCC samples, and meanwhile, Student's t-test was also used to evaluate different expression of ITGB4 between HNSCC samples and non-HNSCC samples in the process. SPSS 22.0 was utilized to evaluate the mean and standard deviation of ITGB4 expression levels in the HNSCC and non-HNSCC groups, and the Student's t-test was also used to detect whether the difference between the two groups of samples were statistically significant. GraphPad Prism 8.0.1 was used to plot receiver operating characteristic (ROC) curves for evaluating ITGB4 diagnostic power for HNSCC with the value of area under curve (AUC).
Stata 15.0 was used to calculate the standard mean difference (SMD) and corresponding 95% confidence interval (95% CI) of ITGB4 expression in chips and RNA-seq data screened from various databases, to compare the differences in ITGB4 expression level in HNSCC and non-HNSCC samples. When the heterogeneity between the studies was >50%, a random effects model was used; otherwise, a fixed-effects model was used. Stata 15.0 was also used to draw forest plots for SMD, funnel plots with Egger's test, summary ROC (sROC) curves, responsible for calculating ITGB4 expression, evaluating publication bias, assessing the diagnostic power of ITGB4 for HNSCC, respectively. Meanwhile, forest plots for sensitivity and specificity were also drawn in Stata 15.0.
Based on RNA-seq data, GraphPad Prism 8.0.1 was used for survival analysis and to plot the Kaplan–Meier curve. Patients were divided into the high expression group and the low expression group according to median ITGB4 expression level. 25
The 95% CI of SMD does not contain 0 indicates that the corresponding difference of analysis results are statistically significant. A p-value of <0.05 also means that the results are statistically significant. All data in this study were collected from public databases and did not include steps involving humans or animals. Therefore, review from Institutional Review Board is not applicable for the study.
Results
ITGB4 mRNA expression in HNSCC and non-HNSCC tissues
As of August 3, 2019, totally 43 mRNA microarrays on HNSCC were screened in the public databases: 4 for LSCC, 24 for OSCC, 5 for NPC, and 10 for HNSCC with unspecified sites (these were not divided into specific subgroups by original research scholars). Meanwhile, the RNA-seq dataset form TCGA containing 500 HNSCC and 44 non-HNSCC samples was also included in this study. The process of filtering the datasets are given in Figure 2 and the characteristics of these microarrays are summarized in Table 2.
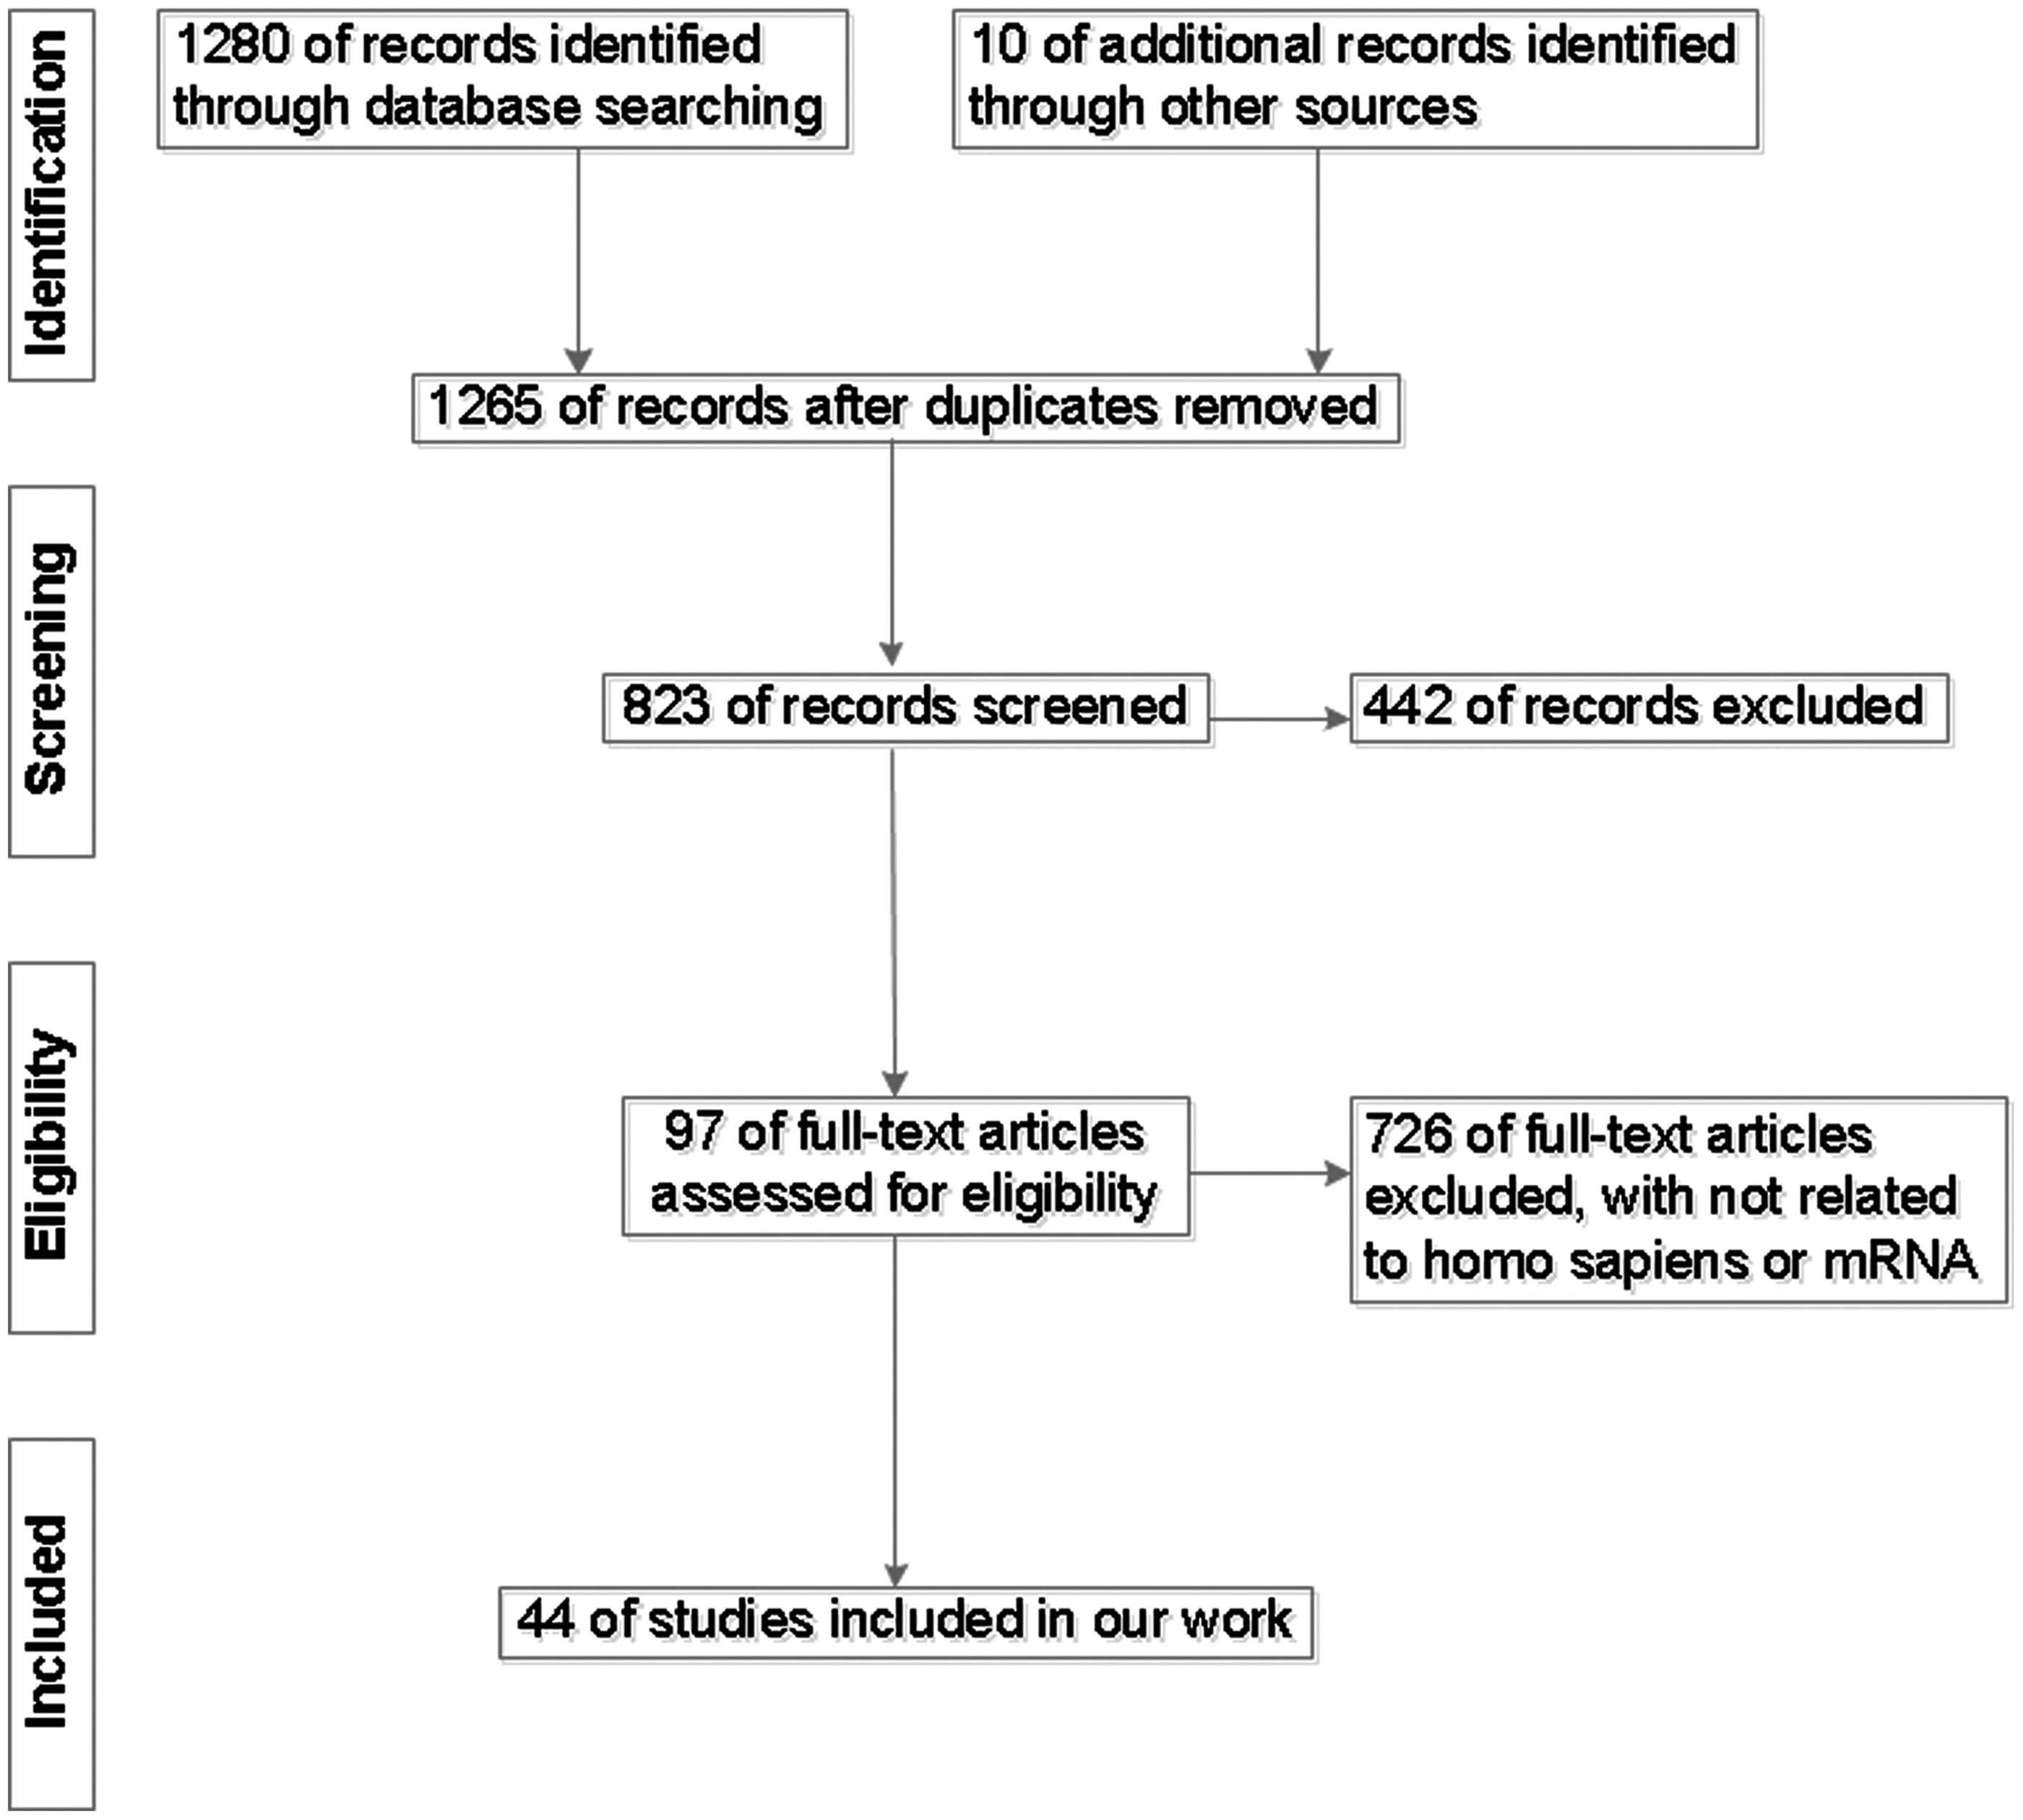
Flow chart of study selection for ITGB4 datasets based on public databases.
The Basic Features of the 44 Datasets of the Integrin Subunit Beta 4 Expression Profiling Included in This Study and Corresponding Data for Diagnostic Test
T-test, Student's t-test.
The link would be
HNSCC, head and neck squamous cell carcinoma; LSCC, laryngeal squamous cell carcinoma; OSCC, oral squamous cell carcinoma; NPC, nasopharynx cancer; TCGA, the Cancer Genome Atlas.
LSCC subgroup
An analysis of the four microarrays (GSE29330, GSE51985, GSE59102 and GSE84957) containing ITGB4-related samples (61 LSCC samples and 37 non-LSCC samples), suggested that the expression level of ITGB4 in the LSCC samples was higher than that in the non-LSCC samples (Fig. 3A–D). The results of all chips related to LSCC had statistical significance (p < 0.05). Meanwhile, the AUC of the ROC curves for each of the LSCC chips was >0.8 (all p < 0.05, shown in Fig. 3E–H), indicating that ITGB4 had a significant effect in distinguishing LSCC from non-LSCC samples.
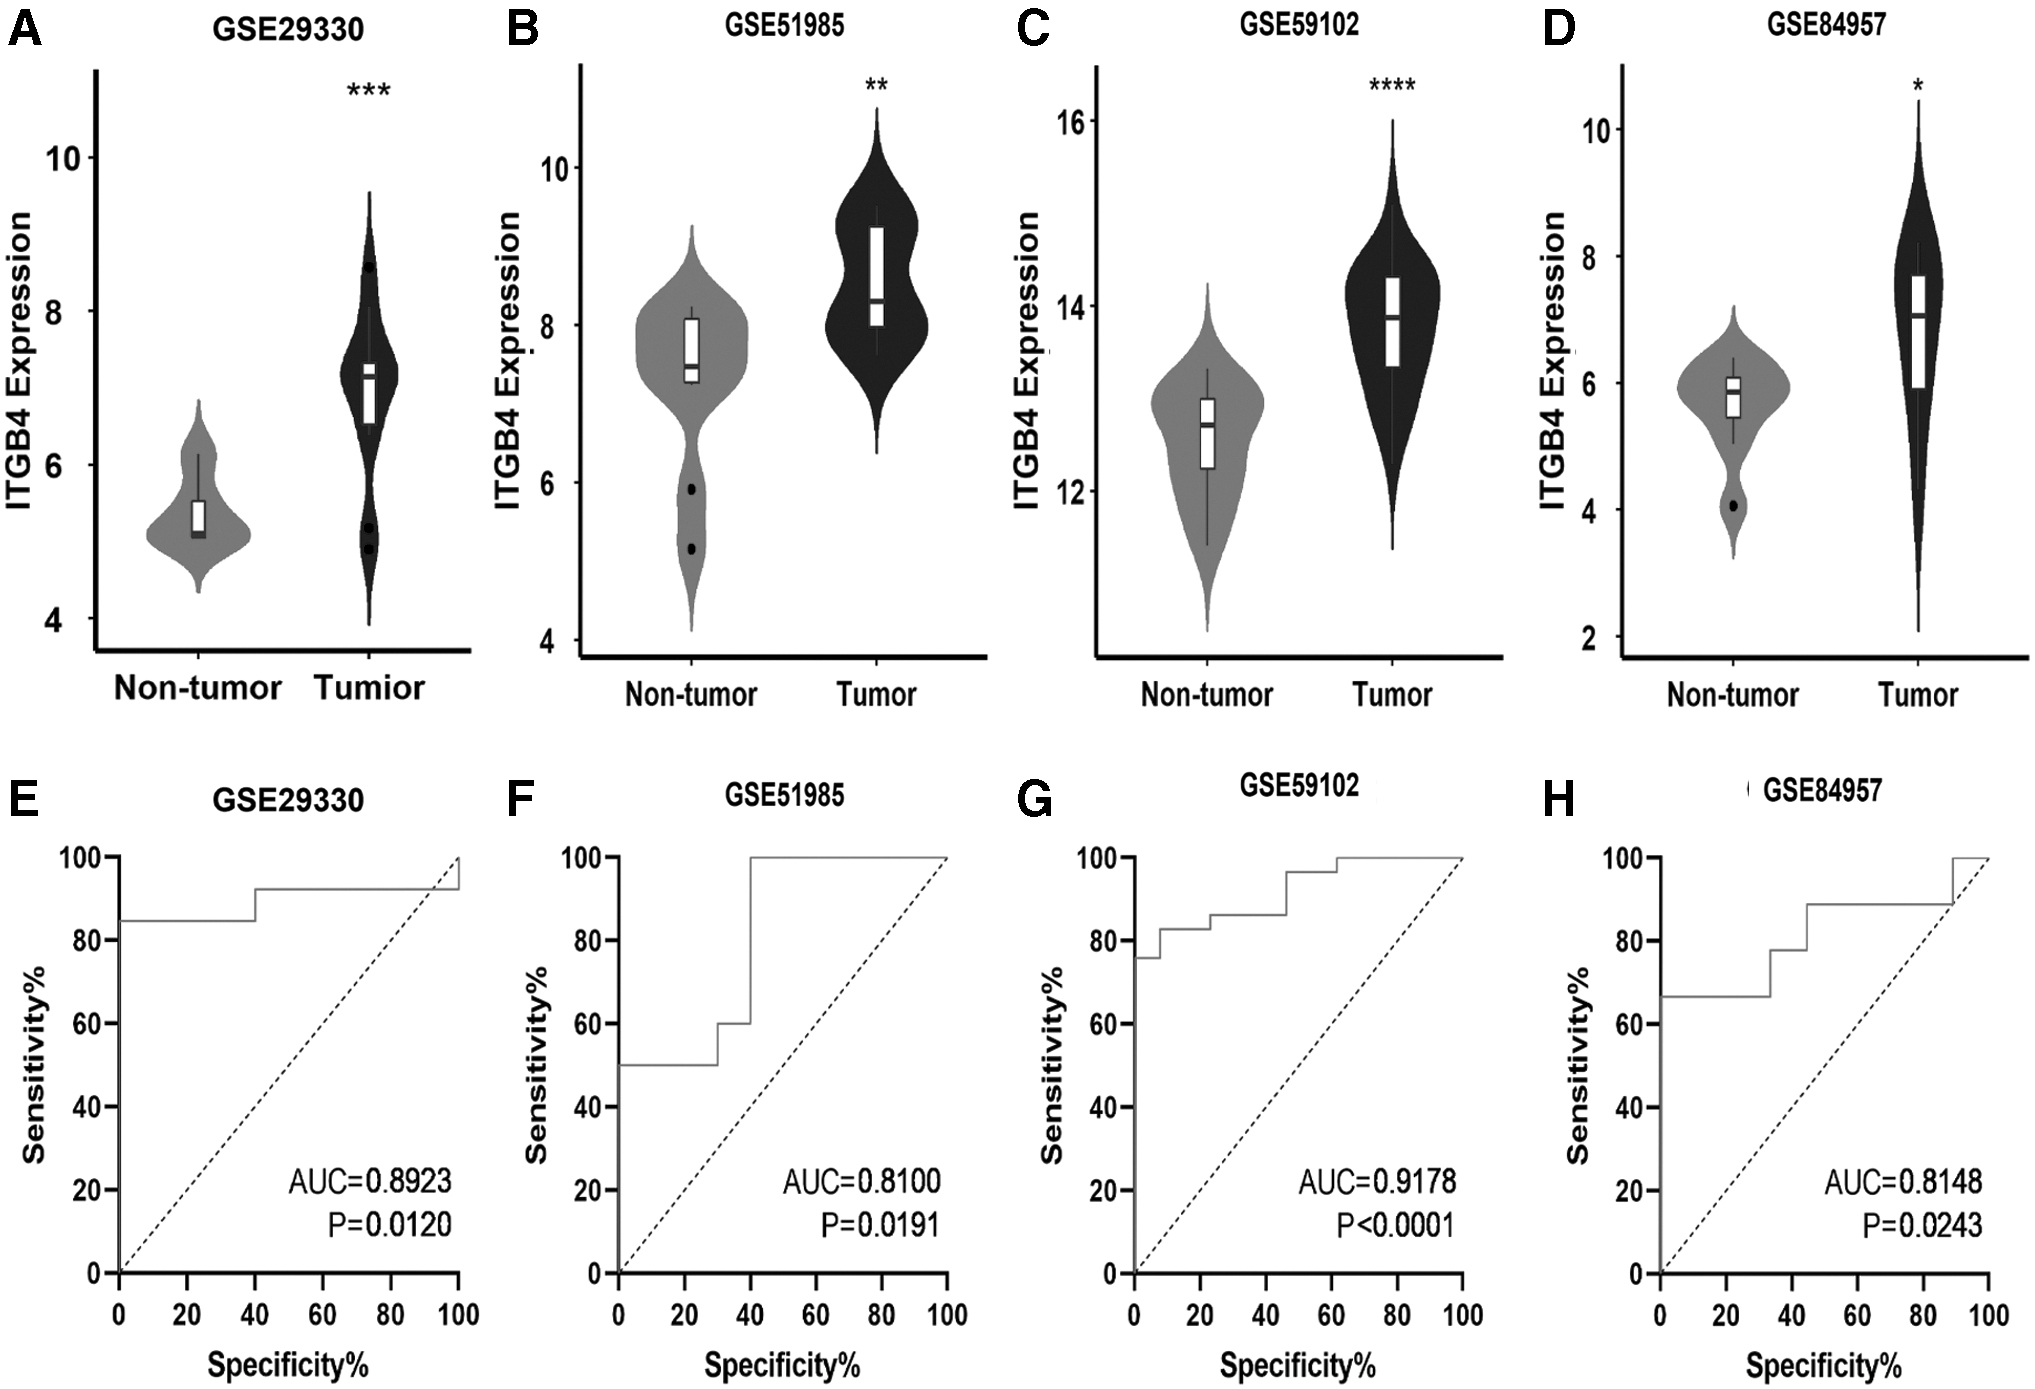
The combination charts of violin and box based on ITGB4 expression level and the ROC curves of ITGB4 in LSCC in four microarrays from GEO database. The expression level of ITGB4 from GSE29330
OSCC subgroup
A total of 24 microarrays (GSE3524, etc.) were included, containing 812 OSCC samples and 372 non-OSCC samples. According to the combination charts of violin and box, data from 18 microarrays (other than GSE3524, GSE19089, GSE46802, GSE51010, GSE74530 and GSE75538) demonstrated that the expression of ITGB4 was higher in HNSCC samples than in non-HNSCC samples (Fig. 4) (p < 0.05). Meanwhile, in addition to GSE3524, GSE34106, GSE46802, GSE51010 and GSE74530, the AUCs of the other 19 ROC curves were >0.7 (all p < 0.05, shown in Fig. 5).
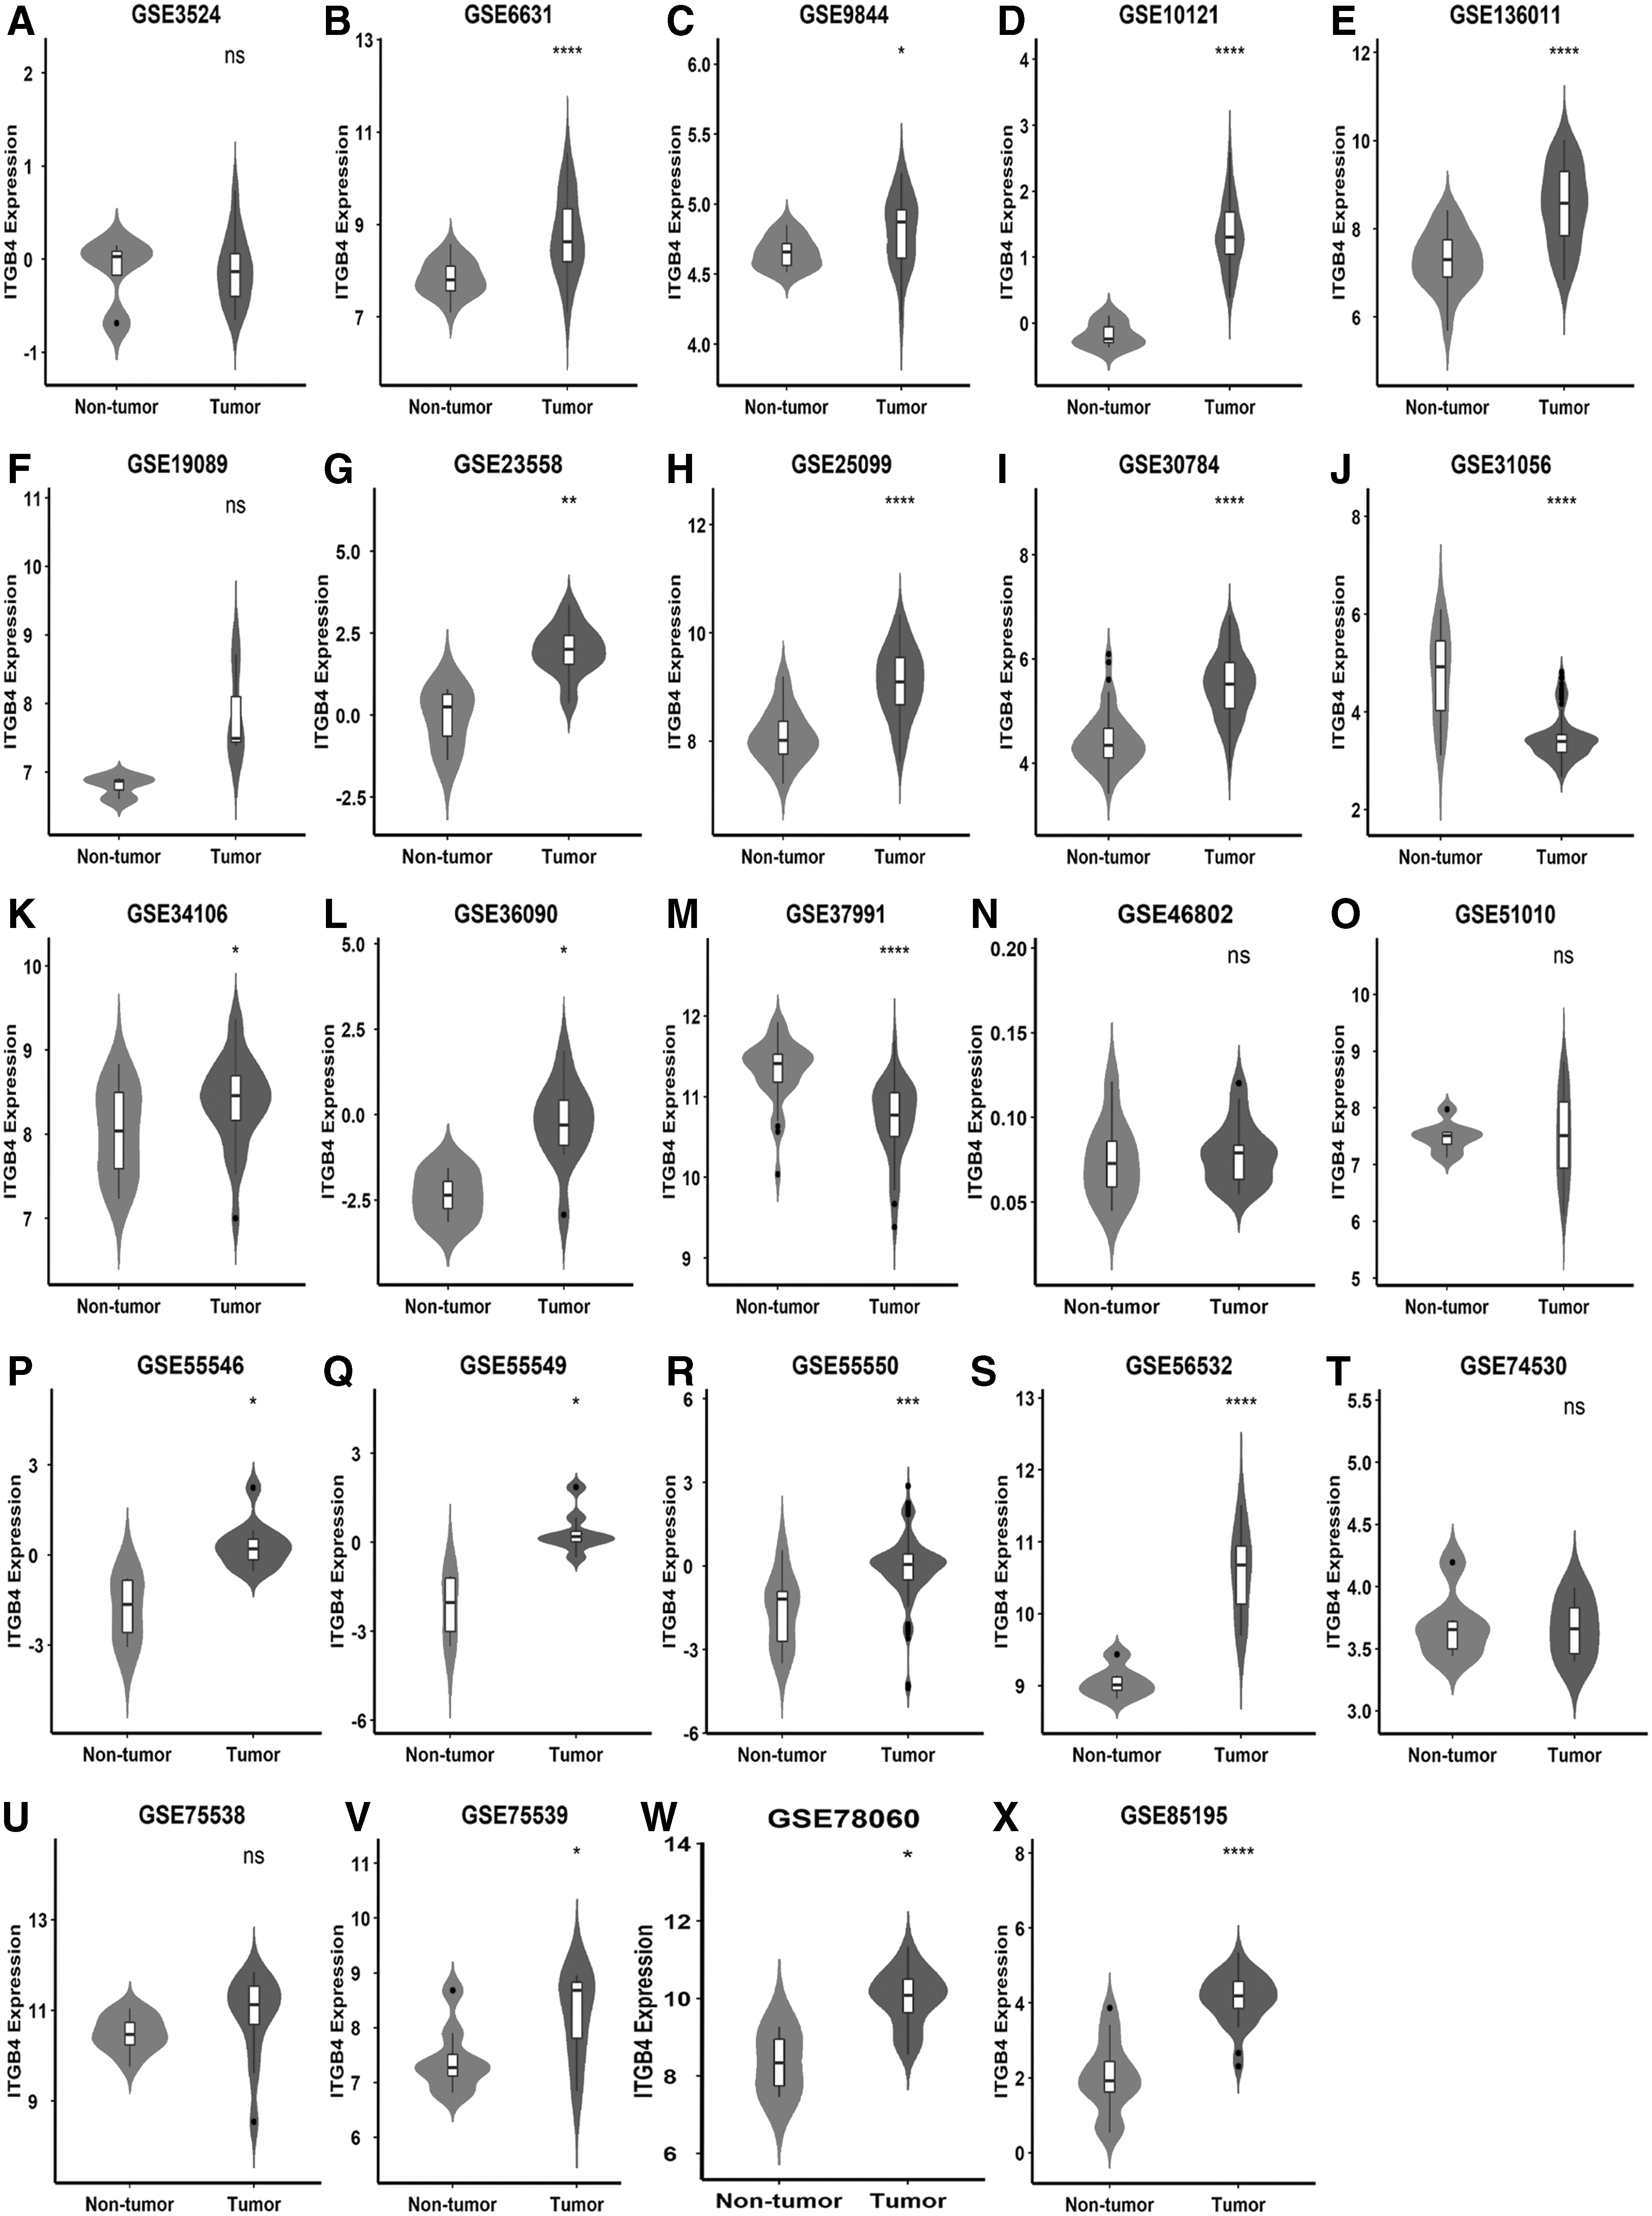
The combination charts of violin and box based on ITGB4 expression level about OSCC in 24 microarrays from GEO database. The expression level of ITGB4 from GSE3524
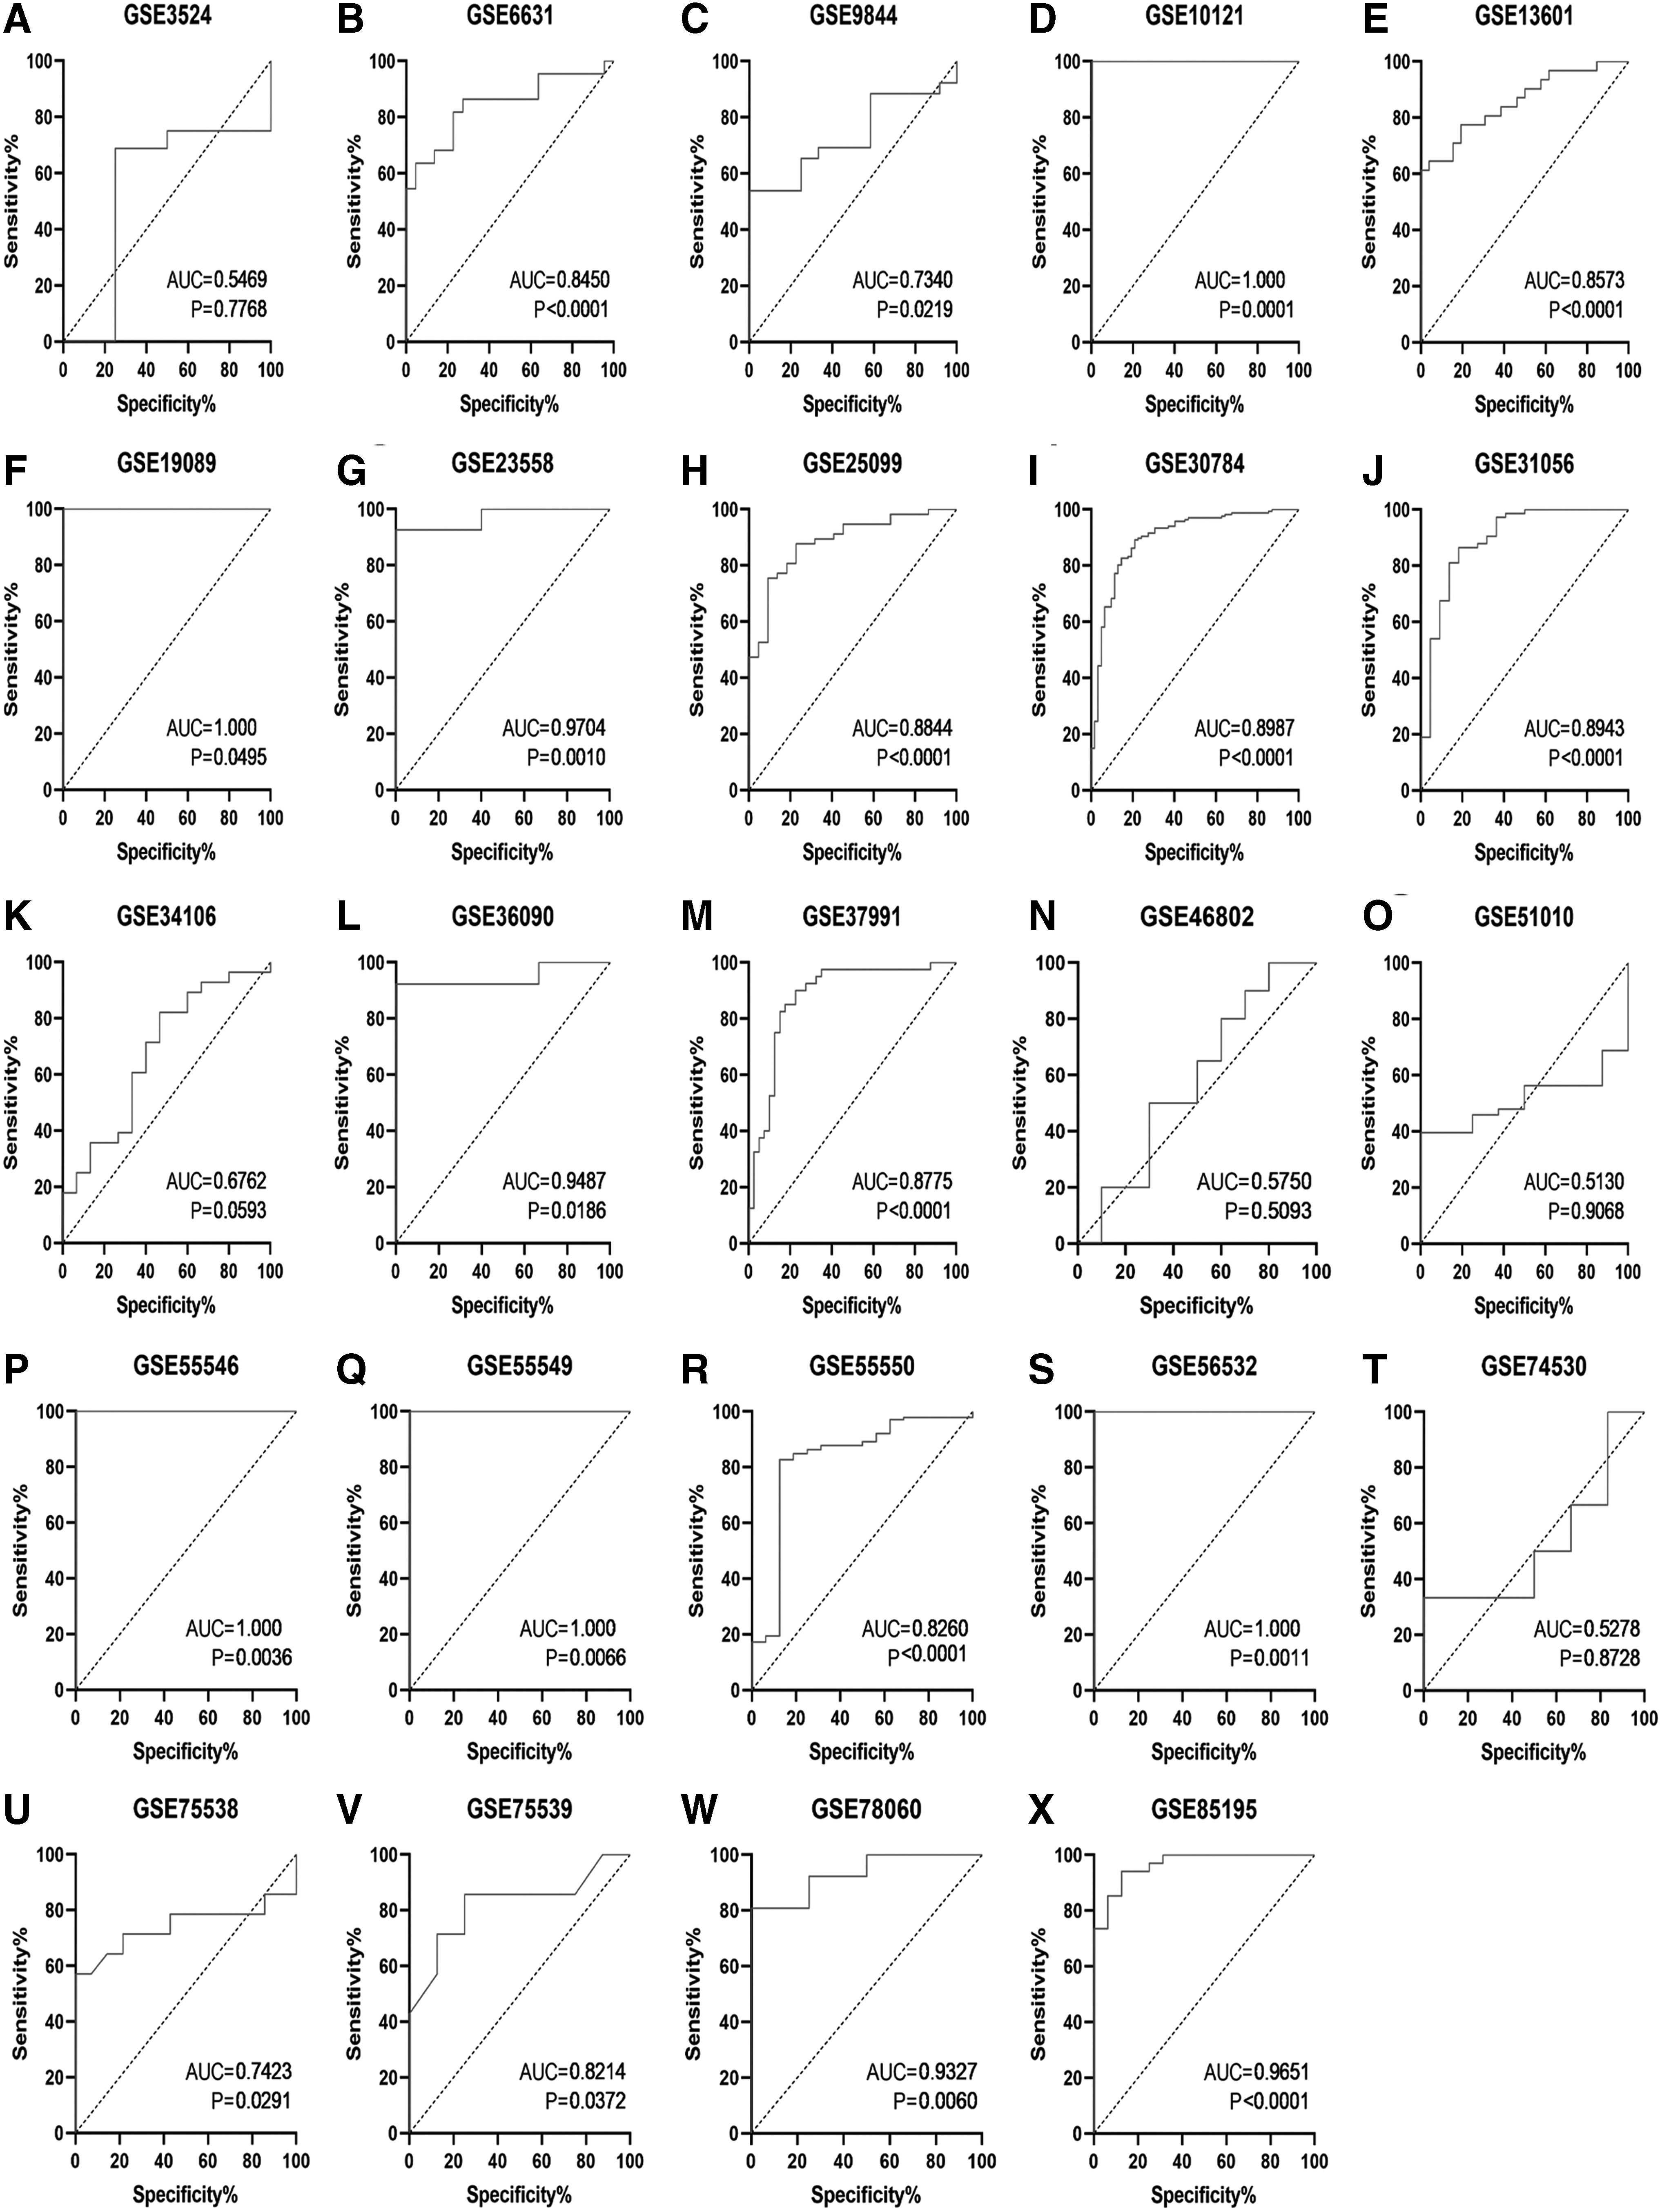
The ROC curves of ITGB4 in OSCC in 24 microarrays from GEO database. The ROC curve of ITGB4 from GSE3524
NPC subgroup
Totally 102 NPC samples and 39 normal non-NPC samples were contained in five microarrays (GSE12452, GSE13597, GSE34573, GSE53819 and GSE64634). The expression of ITGB4 in tumor and nontumor tissues was compared using combination charts of violin and box. The expression of ITGB4 in GSE12452 and GSE34573 was lower in NPC samples than in non-NPC samples (p < 0.05; Fig. 6A, C), whereas other three microarrays (GSE13597, GSE53819 and GSE64634) did not show a statistically significant difference in the expression level of ITGB4 between cancer and normal tissues (p > 0.05; Fig. 6B, D, E). Meanwhile, the AUCs of each ROC curves for the NPC microarrays can be seen in Figure 6F–J.
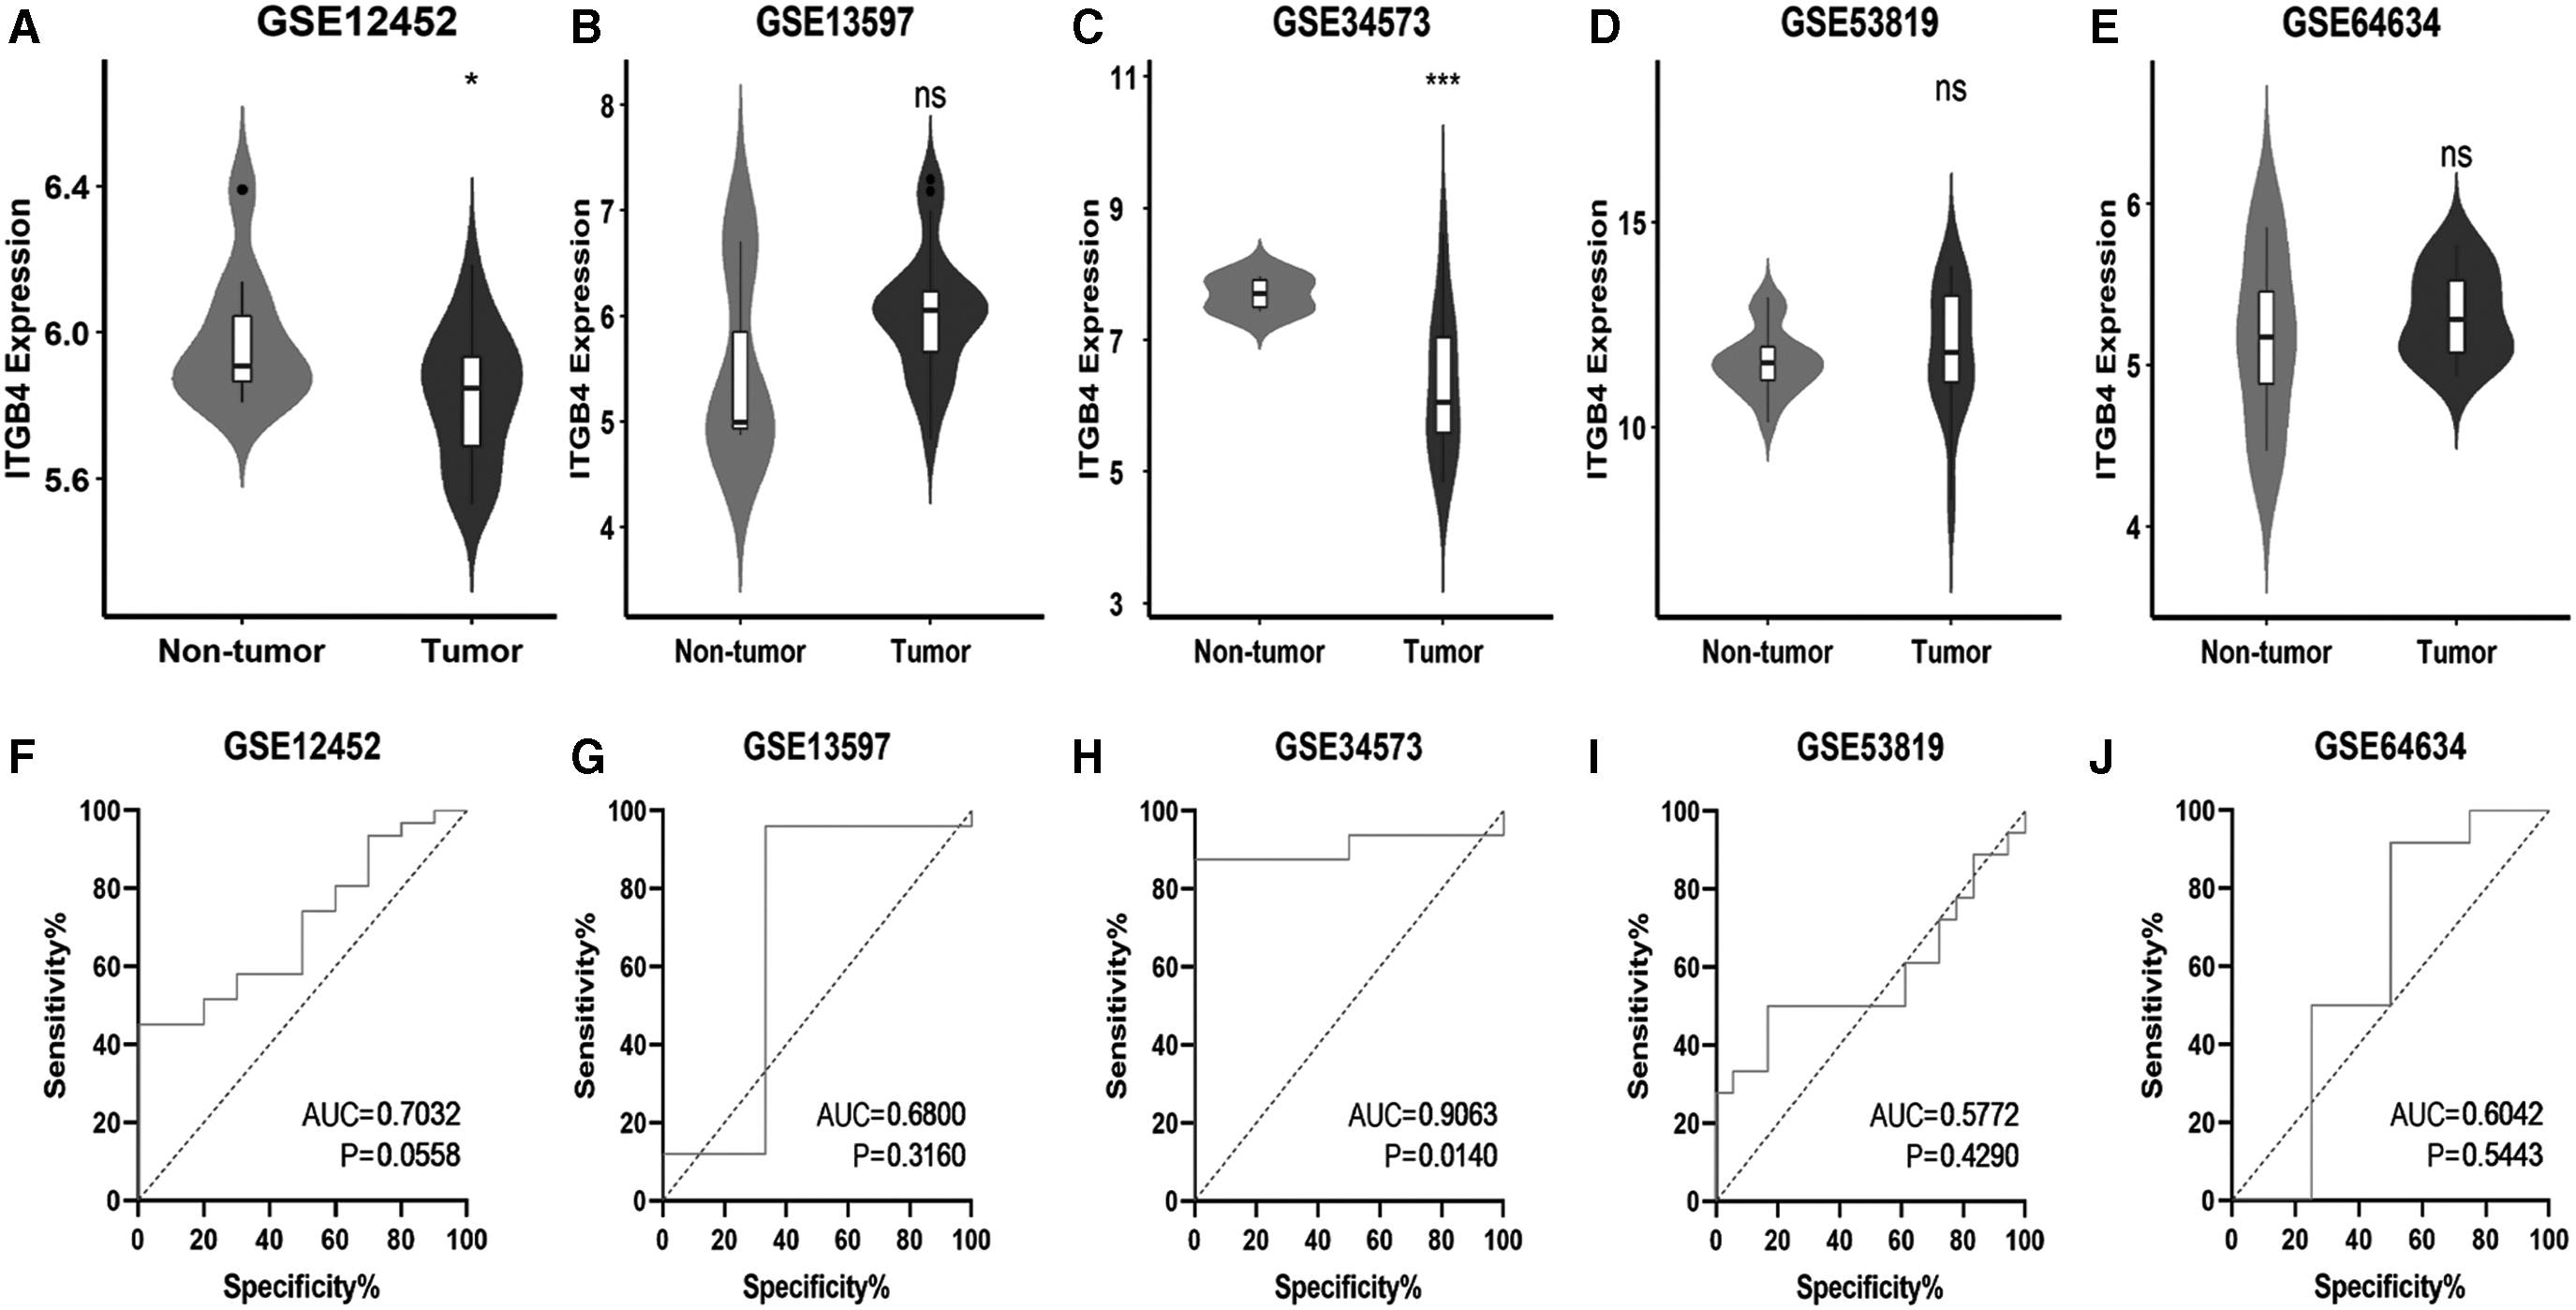
The combination charts of violin and box based on ITGB4 expression level and the ROC curves of ITGB4 in NPC in five microarrays from GEO database. The expression level of ITGB4 from GSE12452
HNSCC subgroups with unspecified sites
A total of 10 microarrays (GSE107591, etc.) were selected from various databases, including 187 HNSCC samples and 148 non-HNSCC samples. Similar to other subgroups of HNSCC, the ITGB4 expression in HNSCC with unspecified sites was higher than in normal tissues based on several microarrays; but these did not include E-MTAB-1516, GSE10774, GSE39400, GSE83519, or GSE107591 (Fig. 7A–J). The AUCs of the ROC curves are given in Figure 7K–T.
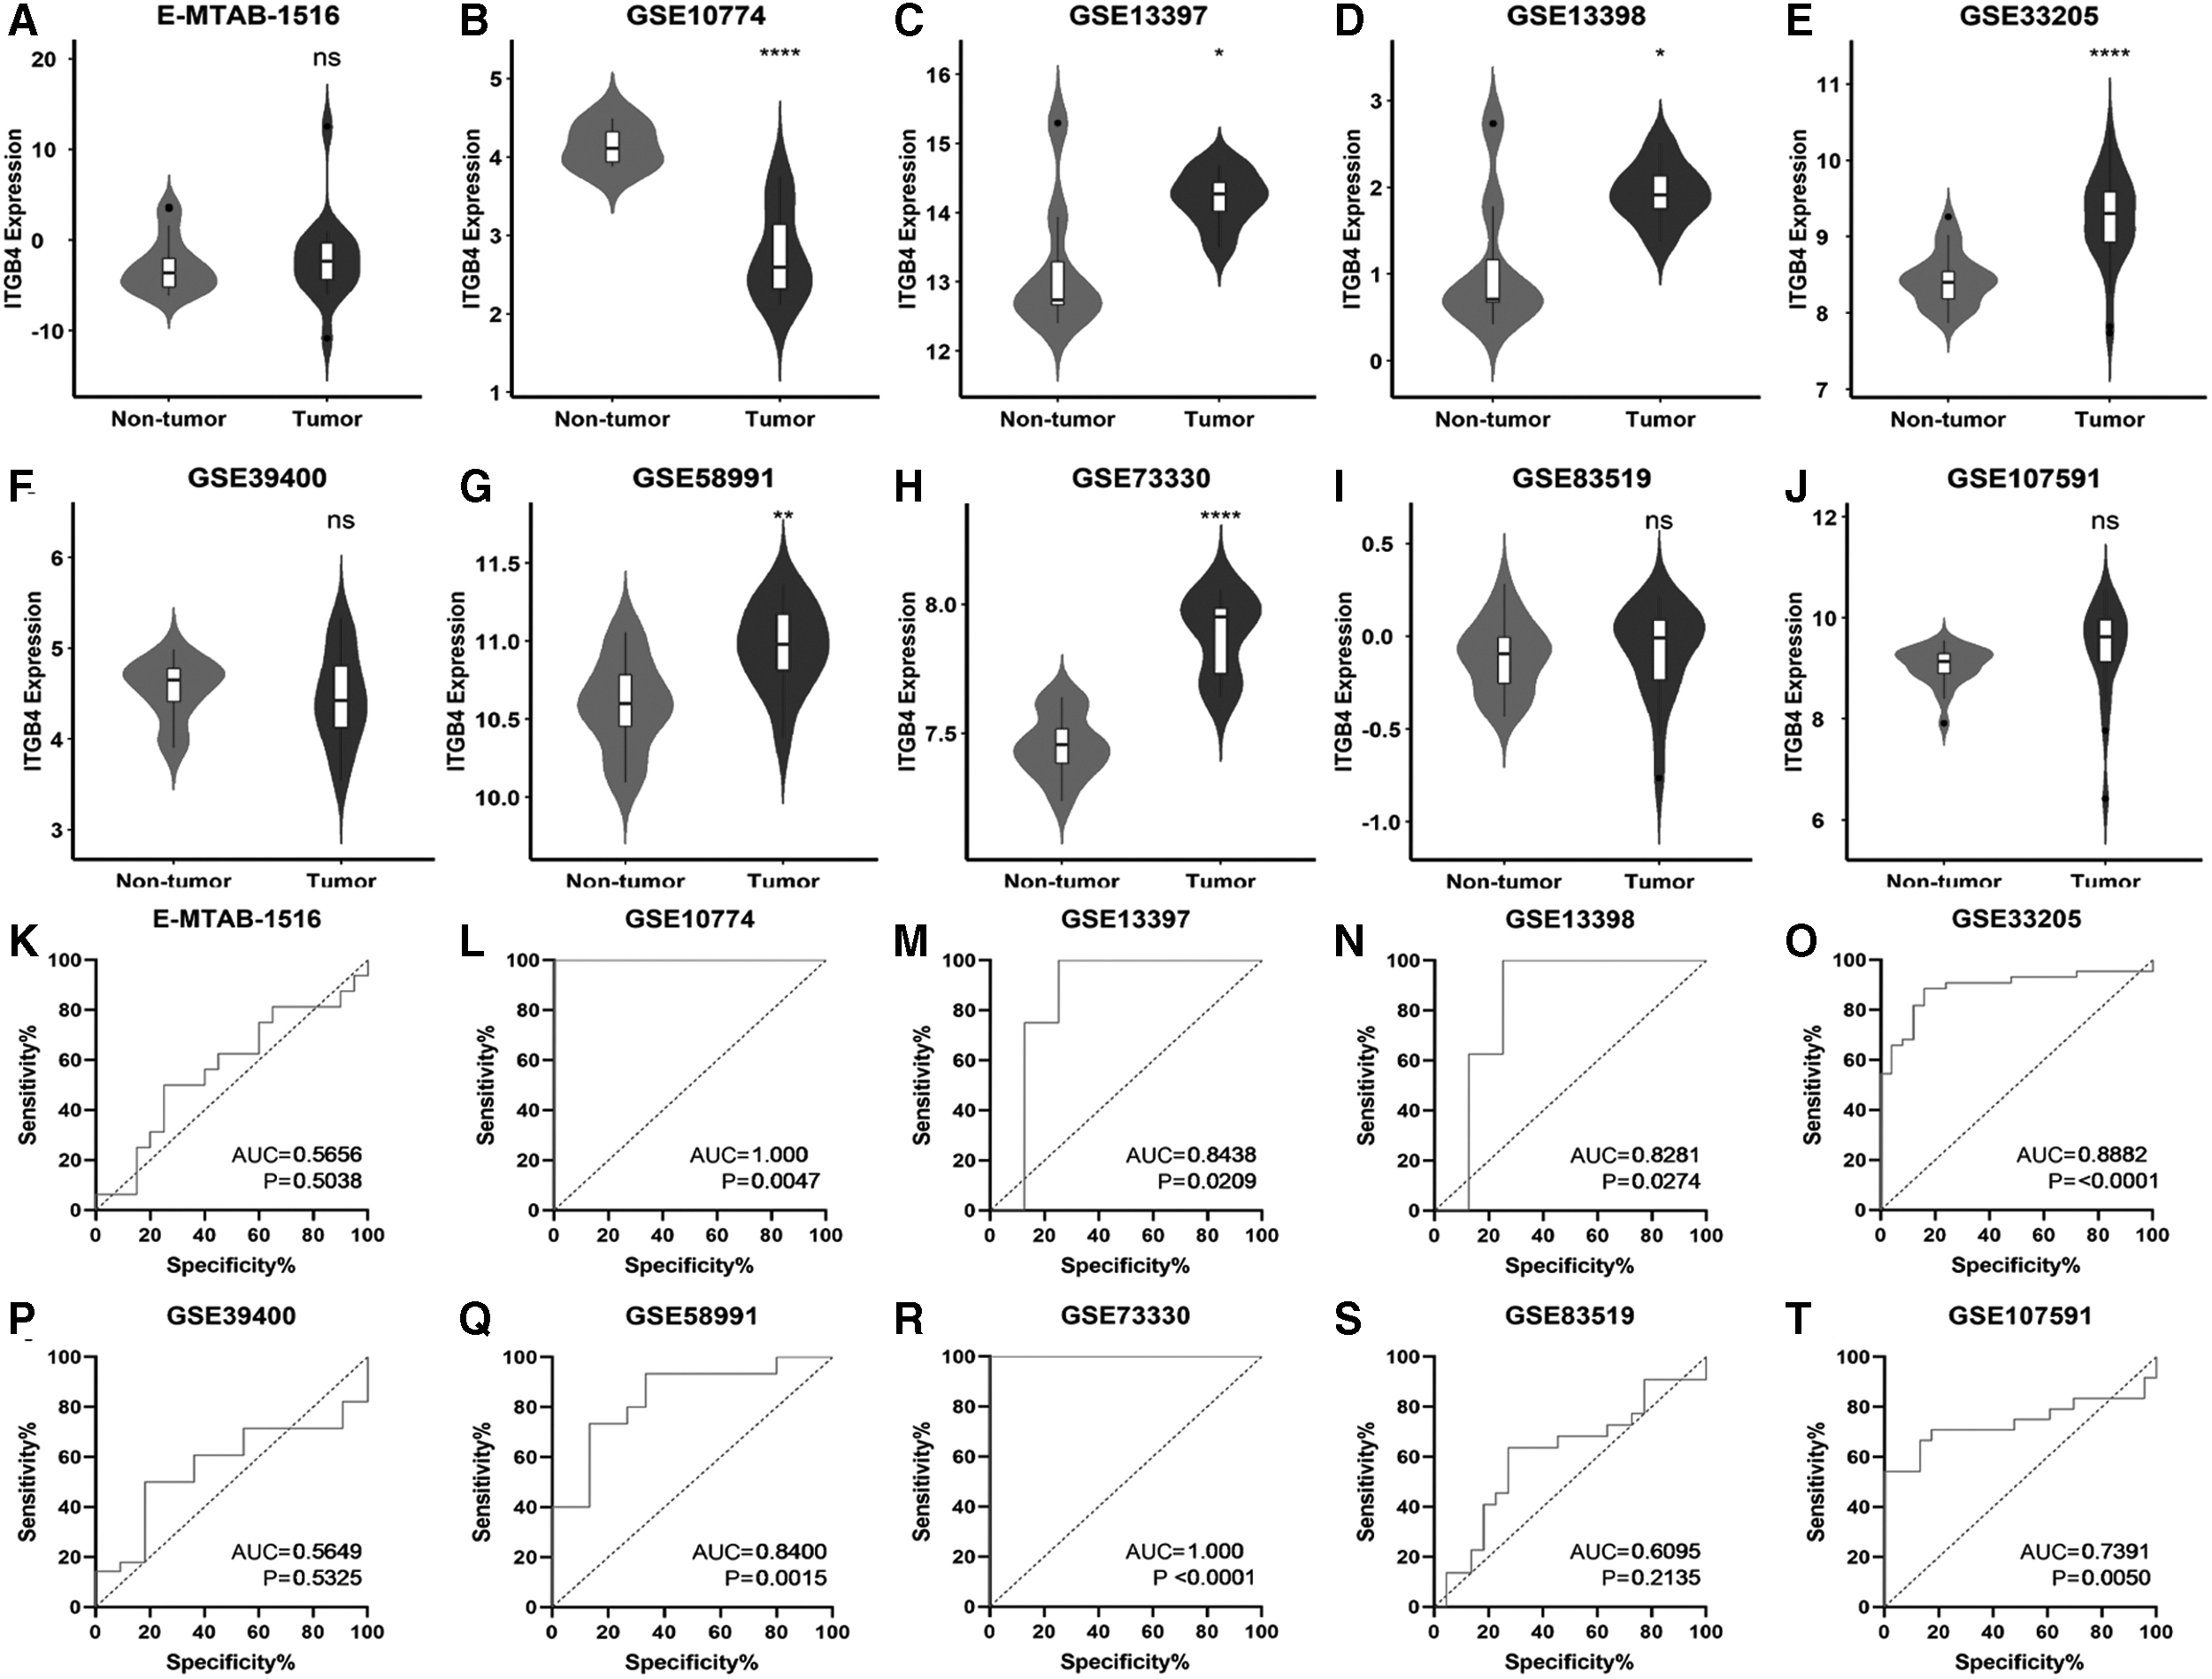
The combination charts of violin and box based on ITGB4 expression level and the ROC curves of ITGB4 in the head and neck squamous cell carcinoma with unspecific sites subgroup in 10 microarrays from ArrayExpress and GEO databases. The expression level of ITGB4 from E-MTAB-1516
RNA-seq of ITGB4
Rather than chips, the RNA-seq data were downloaded from the TCGA database, including up to 500 HNSCC samples and 44 non-HNSCC normal samples. The characteristics of this RNA-seq data were also summarized in Table 2. To compare the expression level of ITGB4 in HNSCC and non-HNSCC samples, combination charts of violin and box were drawn, and they showed an overexpressed level of ITGB4 in HNSCC samples (Fig. 8A); that was statistically significant (p < 0.001). Moreover, the AUC of the ROC curve based on RNA-seq was 0.89, with the p-value <0.0001 (Fig. 8B).

The combination charts of violin and box based on ITGB4 expression level and the ROC curve of ITGB4 in the head and neck squamous cell carcinoma with unspecific sites subgroup in RNA-seq from TCGA.
SMD calculation for all HNSCC subgroups
After the major databases were consulted, a total of 43 microarrays (GSE29330, etc.) and 1 RNA-seq dataset was selected for this research, with 1662 HNSCC samples and 640 non-HNSCC normal samples. The characteristics of these chips and the RNA-seq are summarized in Table 2. The analysis of the HNSCC subgroups showed an SMD of 1.07 (95% CI: 0.74–1.41), suggesting that the expression level of ITGB4 in HNSCC tissues was higher than that in normal control tissues (Fig. 9) (SMD >0 and 95% CI did not contain the value of 0).
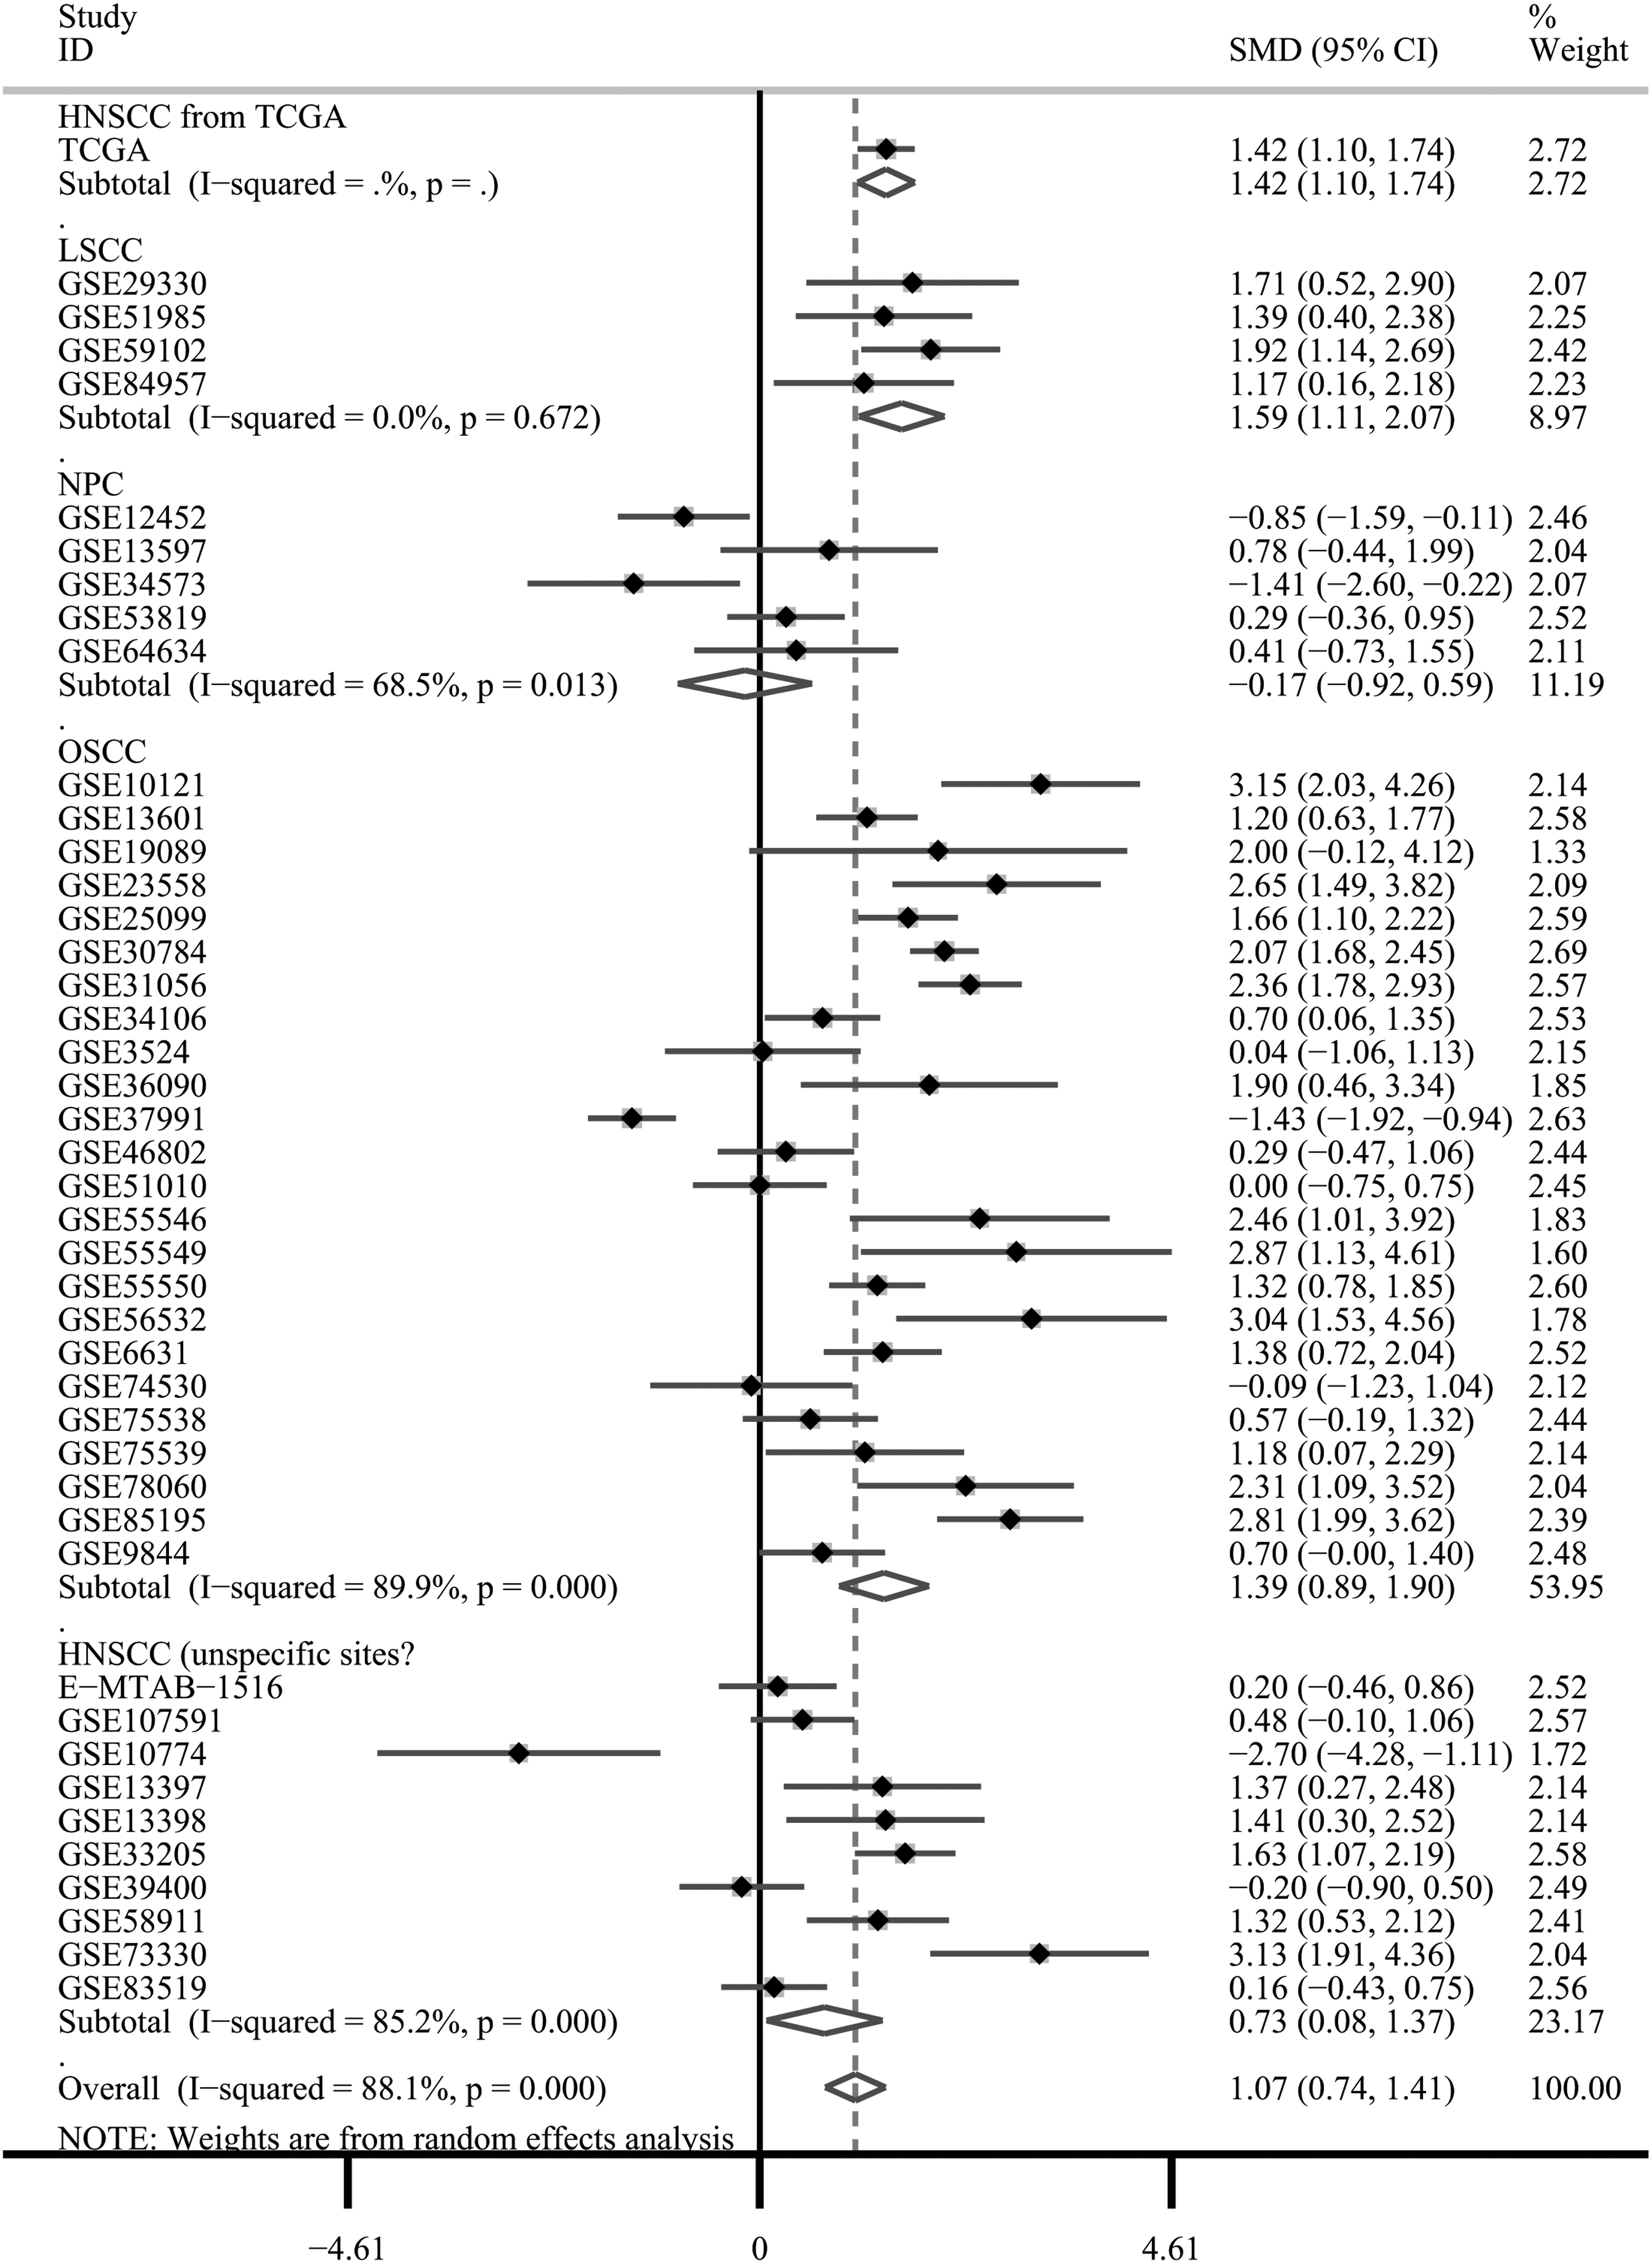
Forest plot of evaluating SMD of ITGB4 expression between head and neck squamous cell carcinoma group and nontumor group based on TCGA and GEO databases. SMD, standard mean difference.
The SMD results varied between subgroups. The SMDs of all subgroups except for the NPC subgroup support overexpression of ITGB4 in HNSCC, with the SMD of LSCC, OSCC and HNSCC in unspecified sites equaling 1.59 (95% CI: 1.11–2.07), 1.39 (95% CI: 0.89–1.90) and 0.73 (95% CI: 0.08–1.37), respectively. Moreover, no publication bias was found through funnel plot with Egger's test (p = 0.925; Fig. 10A).

Publication bias test, sROC curve analysis and sensitivity as well as specificity analysis.
To assess the ability of ITGB4 expression to identify HNSCC cancer tissues and normal tissues, the sROC curve was plotted in Stata 15.0, where AUC and corresponding 95% CI were calculated. As given in Figure 10B, the AUC of sROC was 0.92 (95% CI: 0.90–0.94), indicating that ITGB4 has a high accuracy in diagnosing HNSCC, the sensitivity and specificity were 0.88 (95% CI: 0.79–0.93) and 0.83 (95% CI: 0.68–0.92), respectively. Also, forest plot for specific sensitivity and specificity is given in Figure 10C.
The results of the analysis indicated that the SMD obtained from the NPC subgroup was not statistically significant, so we attempted to calculate the SMD once more after removing the NPC subgroup; the results are given in Figure 11 (SMD = 1.23, 95% CI: 0.88–1.57), without no publication bias (Fig. 12A). Moreover, as given in Figure 12B, the AUC of the sROC after removing the NPC subgroup was 0.93 (95% CI: 0.90–0.95), and the corresponding sensitivity and specificity were 0.87 (95% CI: 0.79–0.93) and 0.85 (95% CI: 0.71–0.93), respectively. Thus, compared with the analysis before removing NPC subgroup, a small change can be seen in the ITGB4 expression SMD between HNSCC and non-HNSCC samples after the NPC subgroup was removed, whereas there was almost no change in AUC. Meanwhile, forest plot for further specific sensitivity and specificity is given in Figure 12C.
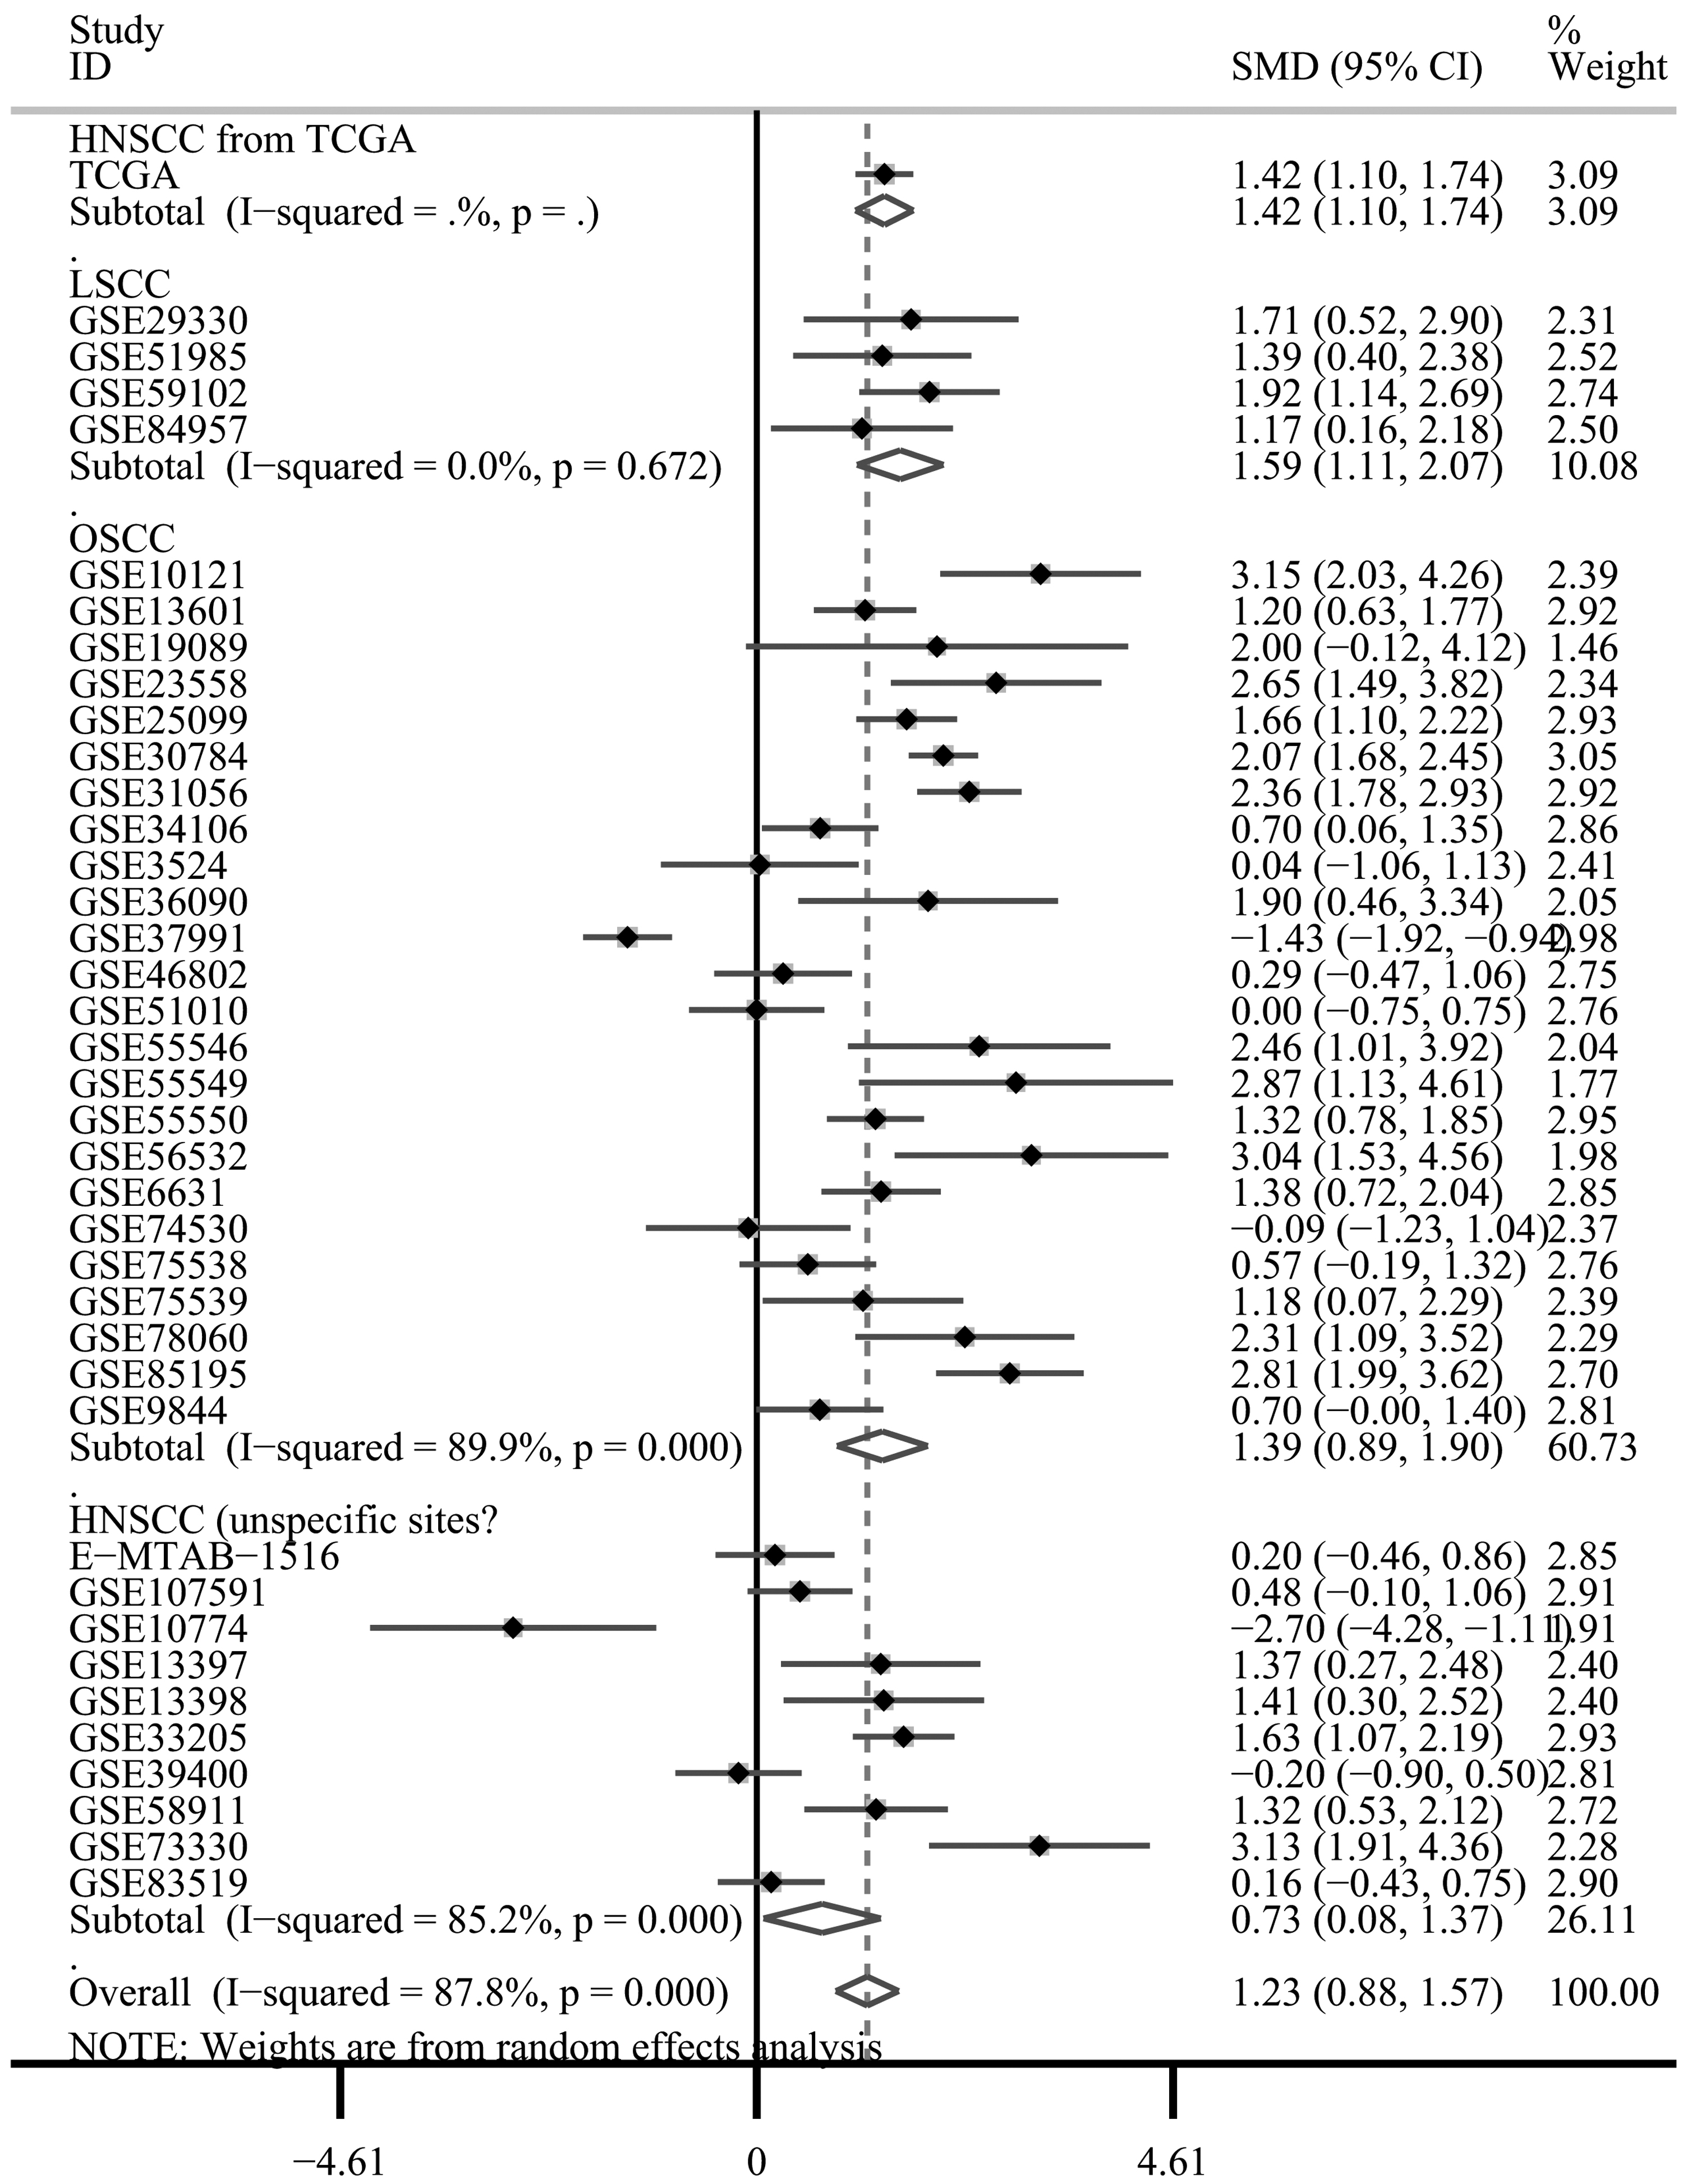
Forest plot of evaluating SMD of ITGB4 expression between head and neck squamous cell carcinoma group and nontumor group based on TCGA and GEO databases after removing NPC subgroup.
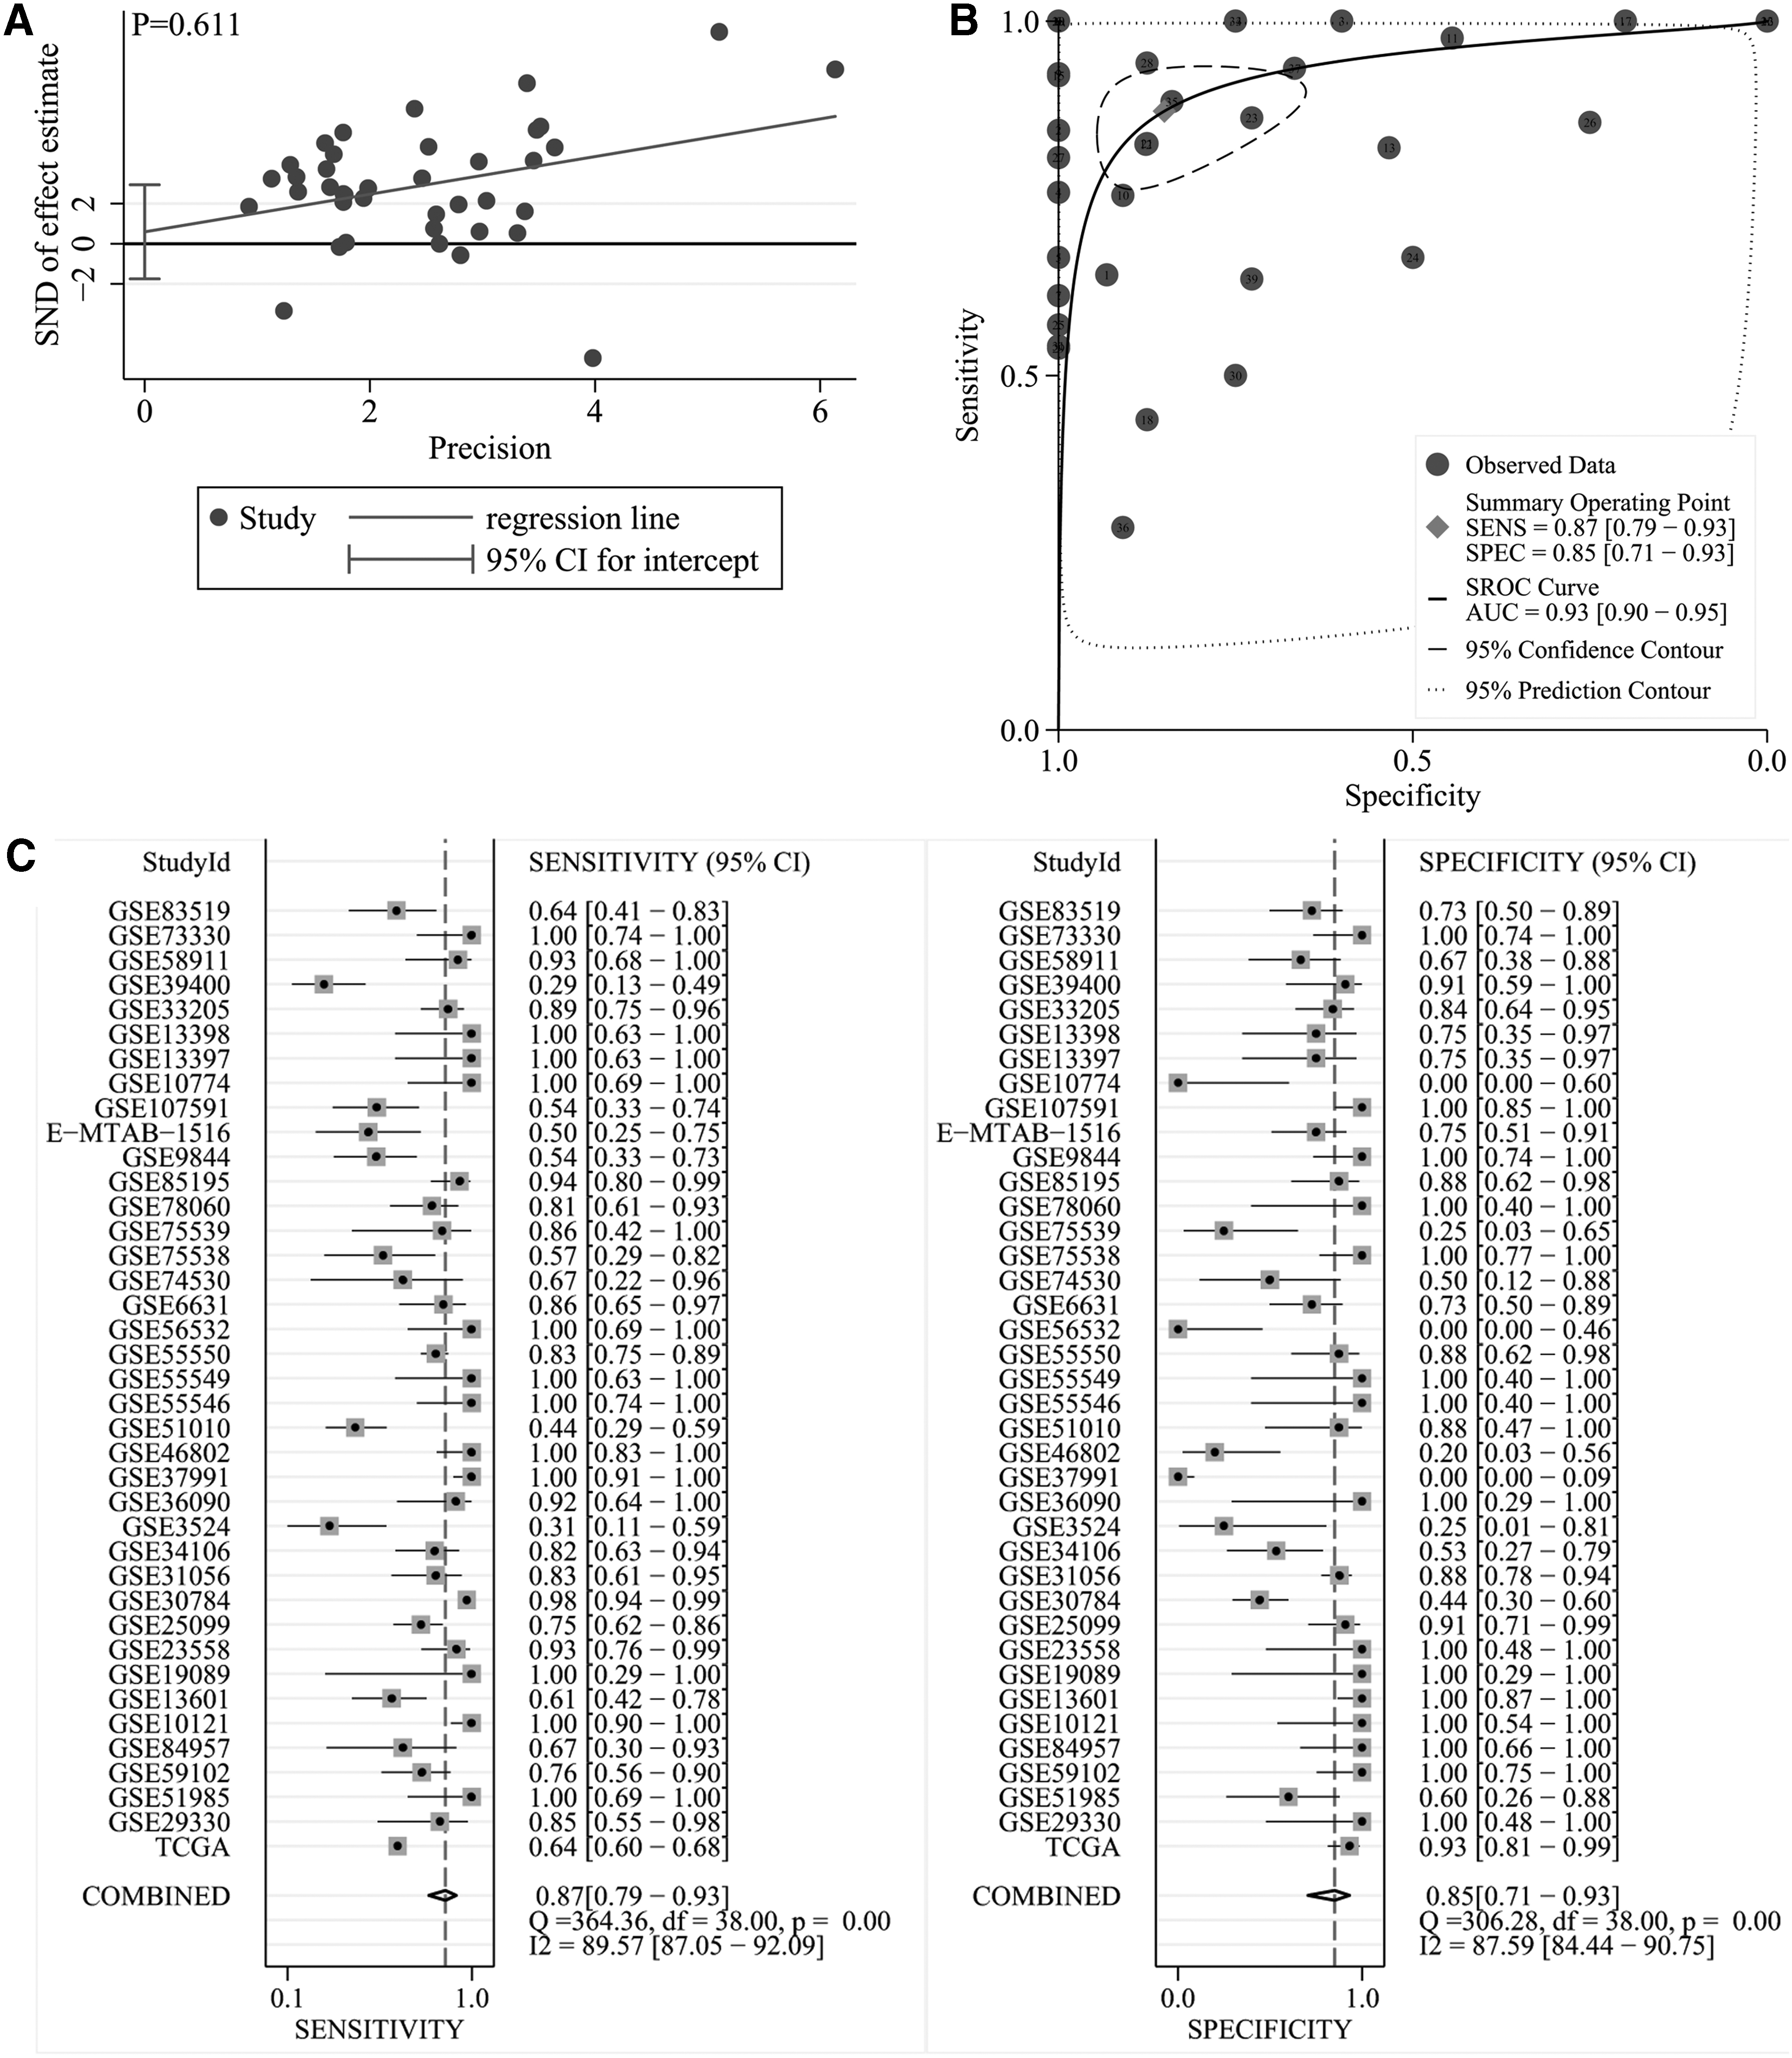
Publication bias test, sROC curve analysis and sensitivity as well as specificity analysis after removing NPC subgroup.
ITGB4 protein expression in HNSCC and non-HNSCC tissues
According to the IHC data collected from the THPA, different antibodies showed different levels of staining, but totally indicated that ITGB4 protein antigen expression was higher in HNSCC tissues than in non-HNSCC tissues. As given in Table 3, except for antibody HPA036348, the rest antibodies (CAB002422, CAB005258, and HPA036349) displayed higher total score in HNSCC tissues instead of non-HNSCC tissues, which overall demonstrated that ITGB4 protein expression tends to be elevated in HNSCC tissues. Thus, at the protein level, ITGB4 was overexpressed in HNSCC, consistent with the results of mRNA level analysis.
Protein Expression of Integrin Subunit Beta 4 in Head and Neck Squamous Cell Carcinoma and Nonhead and Neck Squamous Cell Carcinoma Control Samples
The original sample data of Table 3 were from v92.38.proteinatlas.org, all of which can be found at those links:
The average score of the patient 1711's two samples.
SD, standard deviation.
Genetic alteration analysis of ITGB4 in HNSCC
The subset with the largest number of HNSCC-ITGB4 samples in the COSMIC database was chosen, and the results indicated that in HNSCC with uncertain sites, genetic alterations of ITGB4 contained point mutations (0.80%), copy number variation (0.19%), and gene expression (7.47%), as shown in Table 4. Meanwhile, through the cBioPortal database, some of the HNSCC samples showed ITGB4 missense or truncating mutations in both OSSC and NPC (Supplementary Fig. S1A, B). Although no ITGB4 alterations can be seen in the two HNSCC datasets with unspecified sites (Supplementary Fig. S1C, D), the results of the TCGA cohort showed that 1.9% (10/530) of the tumor samples displayed ITGB4 alteration, including missense mutation, truncating mutation, and amplification (Supplementary Fig. S1E).
Genetic Alterations of Integrin Subunit Beta 4 from COSMIC Database
COSMIC v90, released 30 Jan-2020, the subset with the largest number of head and neck squamous cell carcinoma-integrin subunit beta 4 samples were selected.
ITGB4 expression levels and the clinical parameters of HNSCC patients
To explore the relation between ITGB4 expression level and the clinical parameters, clinical parameters included in three datasets and above were extracted from the screened chips and RNA-seq data, and then data about gender, age, T stage, N stage and stage were chosen, which are listed in Table 5. The SMDs of ITGB4 expression level that fit into certain classifications (male vs. female; ≥60 years old vs. <60 years old; T3 or T4 stage vs. T1 or T2 stage; N2, N3, or N4 stage vs. N0 or N1 stage; stage III or IV vs. stage I or II) were calculated, and the forest plots combined with SMD were drawn.
Clinical Parameters of Samples Involved in the Study
According to Supplementary Figure S2A, although male HNSCC patients seemed to express higher levels of ITGB4 than female patients, the difference was not statistically significant. Younger HNSCC patients (<60 years old) seemed to express higher levels of ITGB4 than older patients (≥60 years old); HNSCC patients in N2, N3, or N4 stage seemed to express higher levels of ITGB4 than patients in N0 or N1 stage; HNSCC patients in stage III or IV seemed to express higher levels of ITGB4 than patients in stage I or II. However, all the CIs of the SMD in these clinical parameters included 0 (Supplementary Figs. S3–S5), indicating that the differences were not statistically significant; corresponding funnel plots with Egger's test, sROC curves and forest plots for sensitivity and specificity also were put in these figures.
Interestingly, ITGB4 expression in HNSCC patients in T3 or T4 stage was higher than that of patients in T1 or T2 stage (Fig 13A), and the difference in gender was statistically significant (SMD = 0.44, 95% CI: 0.07–0.81). It should be noted that there was a certain publication bias through the funnel plot with Egger's test (p < 0.05), but we cannot assess whether publication bias here was owing to the small number of included studies (n < 10). In addition, the AUC of the sROC was 0.82 (95% CI: 0.78–0.85; Fig. 13B) and the sensitivity and specificity were 0.72 (95% CI: 0.34–0.93) and 0.78 (95% CI: 0.37–0.96; Fig. 13B, C), respectively.
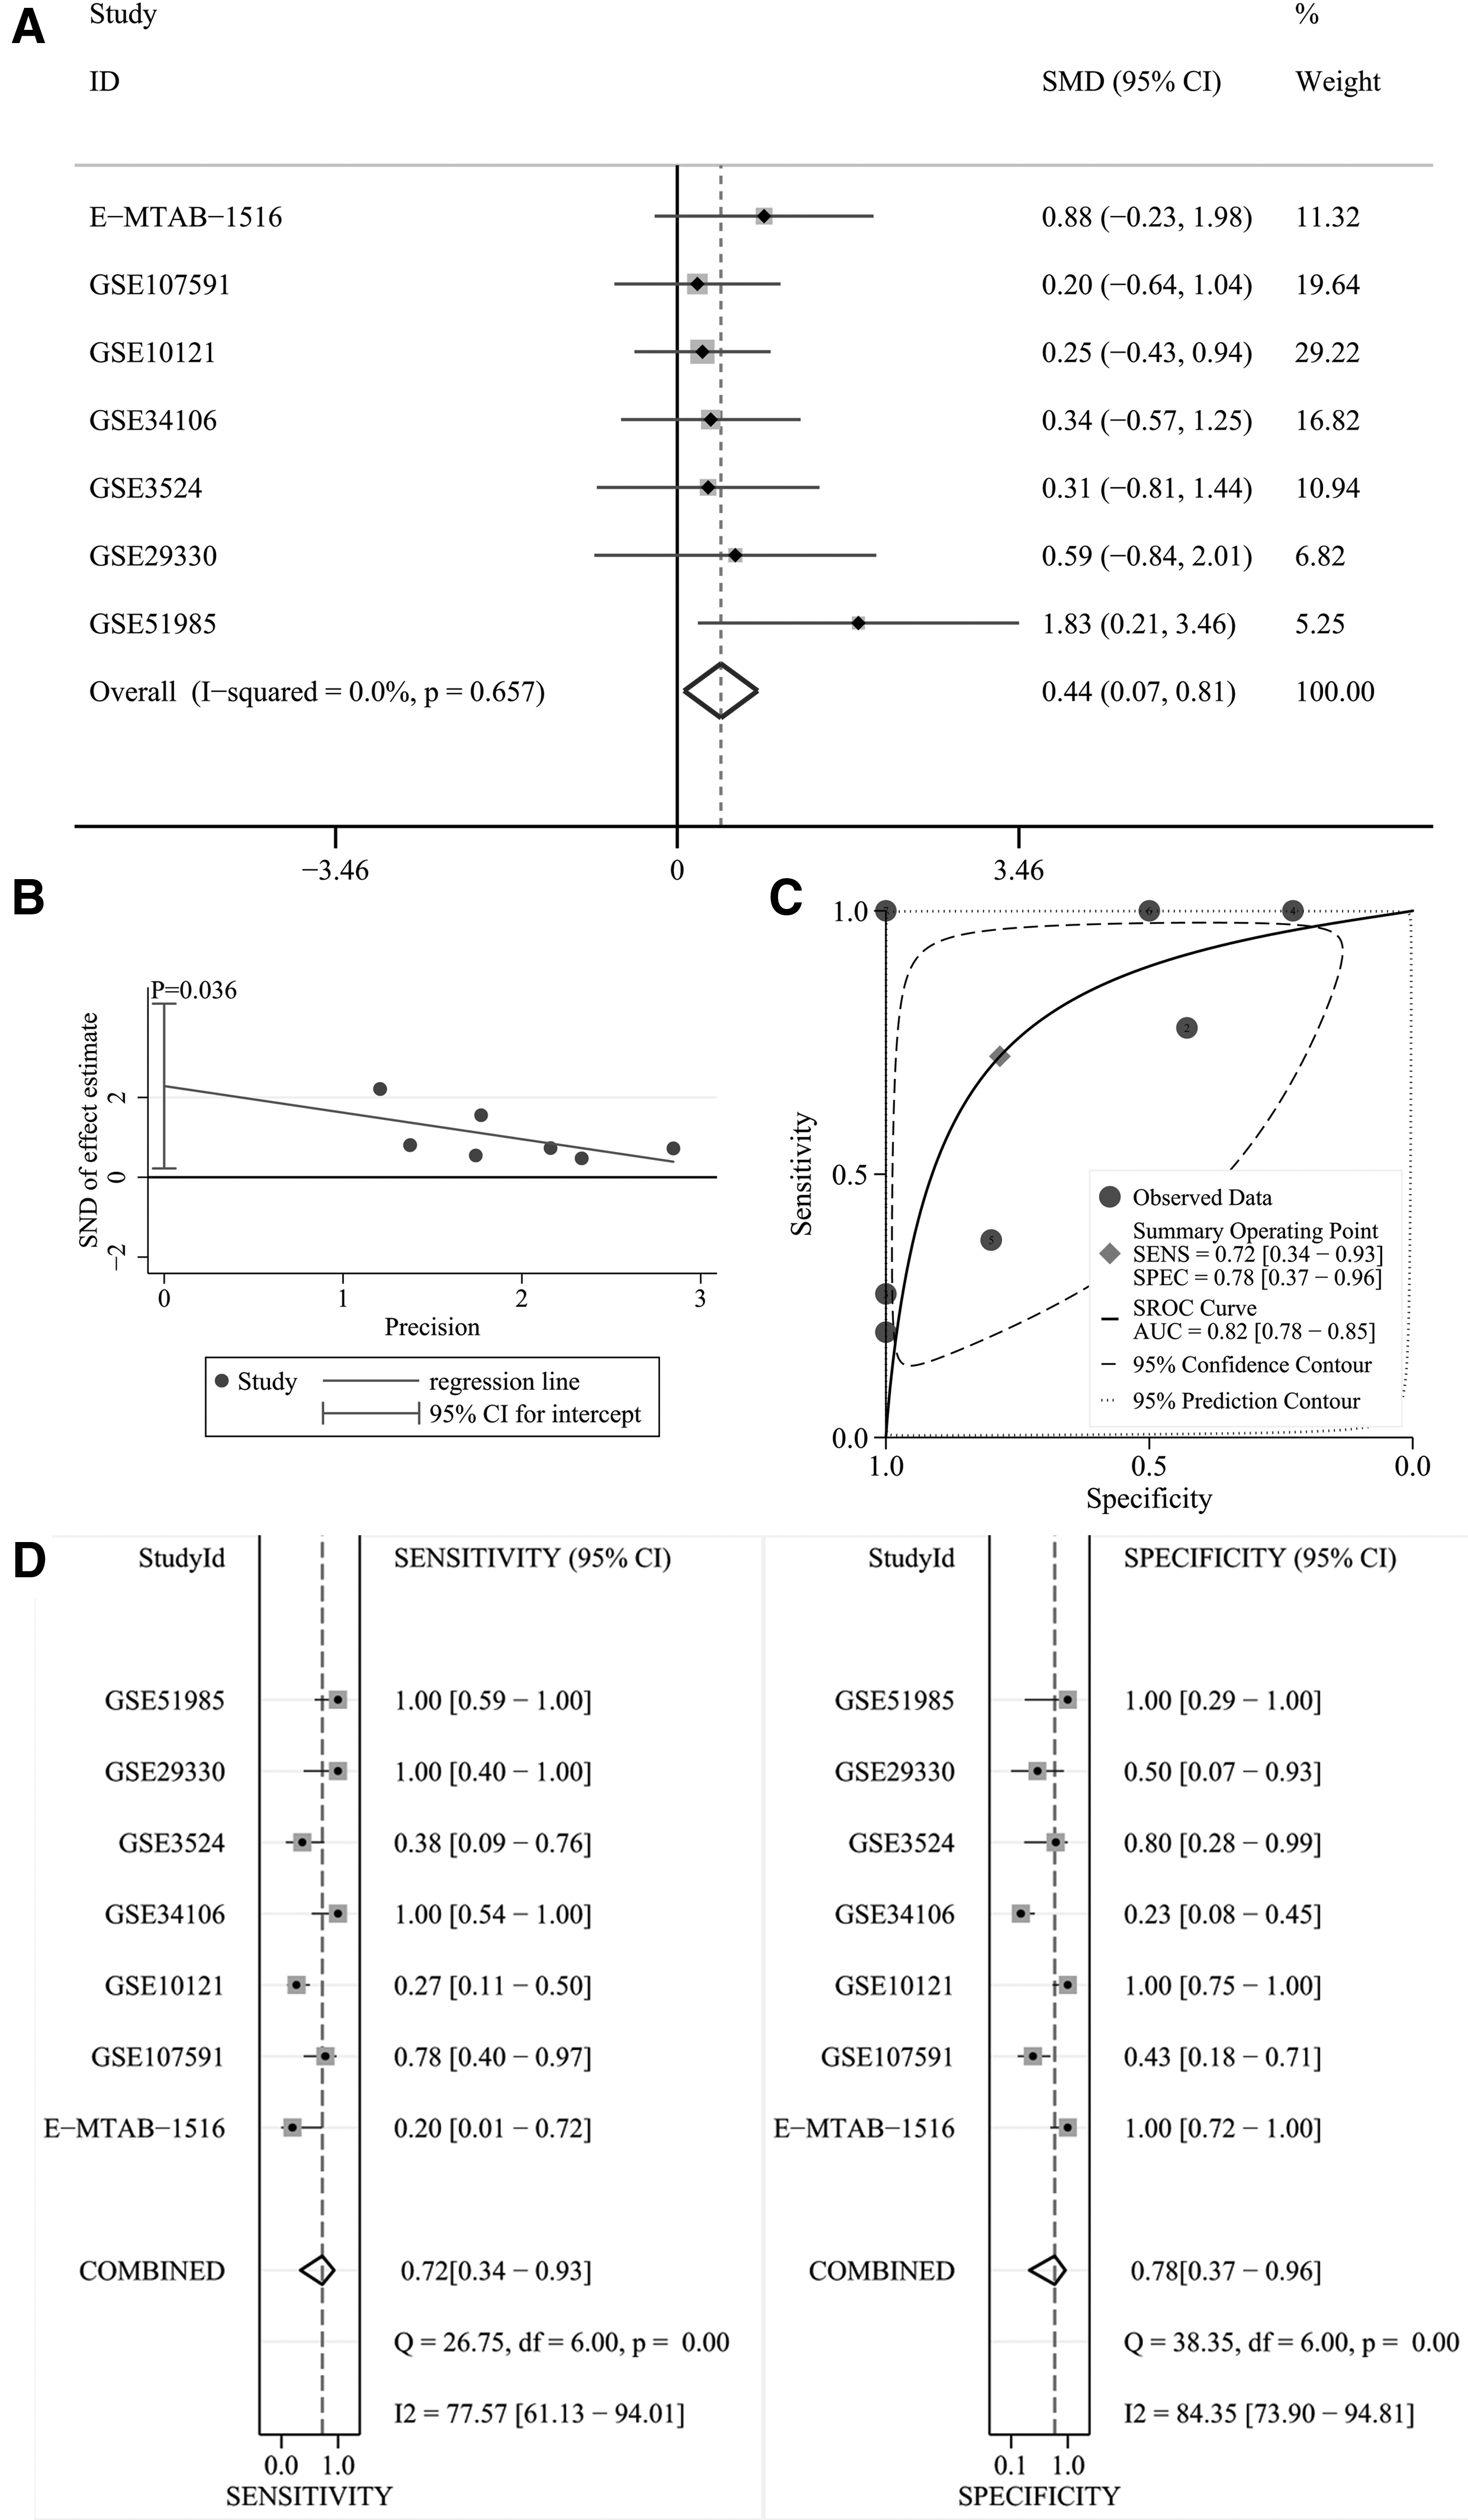
The relationship between ITGB4 expression level and T stage in HNSCC patients, evaluation of ITGB4 expression in discriminating patients with T3 or T4 stage and patients with T1 or T2 stage and sensitivity as well as specificity analysis based on GEO database.
Survival analysis
Based on the data for survival analysis from TCGA, the visual Kaplan–Meier curves (Supplementary Fig. S6) were plotted, and the hazard ratio was 1.226 (log-rank p = 0.271).
Discussion
In this study, we have comprehensively explored the clinical significance of ITGB4 in HNSCC, which has not been performed before. Identical results of mRNA and protein levels in our study indicated up-expression of ITGB4 in HNSCC through gene chips, RNA-seq, and IHC data (n = 2330) from multiple sources. Further ROC curve analysis and sROC curve analysis showed that ITGB4 could distinguish HNSCC from non-HNSCC samples. Moreover, for the first time, we found that ITGB4 expression level may be correlated with clinical T stage by evaluating SMDs. Thus, ITGB4 may play an important role in HNSCC.
As a laminin receptor, the integrin β4 subunit is encoded by ITGB4, often forms integrin α6β4 heterodimers with integrin α6, and participates in the adhesion of extracellular matrix and cells, transducing signals regulating gene expression and cell growth. 17 Existing research indicates that ITGB4 may play a special role in different tumors. For instance, several studies have demonstrated ITGB4 overexpression in various tumor tissues, including breast cancer, 26 hepatocellular carcinoma, 27 pancreatic cancer 28 and bladder cancer. 29 In addition, research on SCC reveals not only that lung SCC tissues express higher ITGB4 levels than normal tissues 30 but also that a higher expression of ITGB4 can be seen in skin SCC tissues 31 and that ITGB4 expression is closely related to the metastasis and invasion of SCC cells. 32
However, unlike known elevated ITGB4 expression in the tumors listed previously based on current studies, whether high or low expression of ITGB4 in some cancers is still controversial, such as prostatic cancer, 33,34 colon cancer, 35,36 OSCC 19,20,37 and NPC. 21,22 As a result, some reports suggest that the high expression of ITGB4 increases the possibility of tumor invasion and metastasis to surrounding tissues and promotes the development of tumors, 38,39 whereas other scholars hold the view that ITGB4 may play a positive role in suppressing cancer. 22,40 Therefore, the role that ITGB4 plays in tumors remains controversial.
In this study, we found high levels of expression of ITGB4 in HNSCC samples at both mRNA and protein levels compared with non-HNSCC samples by evaluating SMDs and AUCs from ROC and sROC, and by searching the THPA database. The analysis of this study is therefore more reliable. The current findings support the fact that ITGB4 may play an accelerating role in the carcinogenesis of HNSCC.
However, there are various subtypes of HNSCC based on tumor sites. To correctly understand the relationship between ITGB4 mRNA expression and various types of HNSCCs, four subgroups (containing LSCC, OSCC, NPC and HNSCC with unspecified sites) were analyzed in this study.
First, in the LSCC subgroup, we found an elevated mRNA expression of ITGB4 in tumor samples compared with nontumor samples, consistent with the upregulating protein level as we previously reported. 18 The results of all datasets included in this study were identical in showing significant overexpression of ITGB4 in LSCC. The loss of cell polarity may be one of the features of epithelial tumors, while integrin α6β4 is likely related to the loss of LSCC cell polarity, and thus the integrin β4 subunit may promote the development of LSCC. 41 Meanwhile, the AUCs of ROC curves suggested that ITGB4 distinguished LSCC patients from nonpatients. Therefore, an elevated expression of ITGB4 may be an outstanding diagnostic indicator and a treatment target for LSCC.
Second, the OSCC subgroup showed a high expression of ITGB4 compared with the non-OSCC samples. Although elevated ITGB4 expression in OSCC has been found in previous research (n < 300), 19,38 our analysis of the OSCC subgroup included a larger number of samples (tumor, n = 812; control, n = 372) and analyzed the expression of ITGB4 in HNSCC at both mRNA and protein levels, which more reliably illustrates the overexpression of ITGB4 in OSCC patients. It was reported that overexpression of ITGB4 could be seen mainly in highly invasive SCC tongue cells, 42 suggesting a positive relation between ITGB4 and the aggressiveness of the tongue SCC. Zhao Xin et al. 19 also thought that elevated ITGB4 expression was associated with OSCC cell migration. These studies suggest that the overexpression of ITGB4 may be a risk factor for OSCC.
However, some scholars have pointed out that the low expression of ITGB4 is related to the invasion and migration of OSCC cells. For instance, the loss of integrin β4 subunit in lip SCC cells can be seen in the tumor's incipient stage, and the invasion of lip SCC cells can be facilitated owing to the downregulated expression of integrin β4. 43 But in fact, lip SCC is just one of the OSCCs, and whether decreased expression of ITGB4 exists in other OSCCs may need further investigation. In addition, some researchers also suggested that OSSC cells were more invasive and migratory owing to the downregulated expression of integrin β4 subunit with the lack of normal adhesion function, indicating that ITGB4 can inhibit cell migration to some extent.
In fact, as an important component of the hemidesmosomes (HDs) responsible for adhesion between normal epithelial cells and basement membranes, 44 integrin α6β4 may reduce cell migration. But contrary to adhesion function in normal epithelia, integrin α6β4 can be released from HDs in cancers and stimulate the development of cancers in adhesion, migration, invasion, and proliferation by activating molecules like epidermal growth factor receptor and signaling pathways like PI3K. 31 Thus, the overexpression of ITGB4 is likely a risk factor for OSCC overall. Moreover, the ROC curve analysis and sROC curve analysis for OSCC in our study indicated that ITGB4 could distinguish OSCC from non-OSCC samples.
Therefore, recent studies have shown that OSCC cells overexpress ITGB4, which is consistent with our findings from more samples. In a word, ITGB4 may play an essential role in OSCC.
Third, based on our analyses for the NPC subgroup and previous studies by some scholars, the expression level of ITGB4 in NPC remains controversial. Although the analysis of some chips included in our study showed a trend for low expression of ITGB4 in NPC, the final SMD of the NPC subgroup showed no statistically significant difference in ITGB4 expression between NPC and controls. And to date, researchers have failed to reach an agreement on higher, 21 lower, 22 and not significantly different 45 expression of ITGB4 in NPC cells compared with normal nasopharyngeal cells.
According to previous studies, one of the reasons why the expression level of ITGB4 in NPCs is different from other HNSCCs may be related to Epstein–Barr virus (EBV) infection or at least to the LMP2A protein encoded by EBV. NPC often occurs with EBV, whereas EBV-encoded LMP2A protein competes with ITGB4 for the Syk tyrosine kinase, resulting in a change in the expression of ITGB4 in NPC cells. Knockdown of ITGB4 expression reduces NPC cell motility, 45 indicating that ITGB4 may promote the development of NPC. Meanwhile, some investigators consider ITGB4 cleavage as one contributor to NPC motility; the LMP2A can positively regulate the calpain-dependent cleavage of ITGB4 and therefore supports migration of NPC cells. 46 In fact, other than LMP2A, low expression of p21 (a cell cycle inhibitor that inhibits cell growth) was reported in NPC cells, consistent with ITGB4. 22,47
Downregulated α6β4 may also promote cancer cell growth by inhibiting the function of p21, 47 but this remains a hypothesis and may require further specific research. Moreover, in our ROC curve analysis conducted for NPC for the first time, only a few of the chip results showed that ITGB4 could distinguish NPC from controls well, which is significantly different from the other HNSCCs. This seems to further reflect the differences between NPC and other HNSCCs, at least in the level of ITGB4 expression. Put simply, the clinical significance of ITGB4 in NPC remains elusive, and it will be interesting to solve this mystery.
Fourth, the results of the HNSCC subgroup with unspecified sites showed that, compared with non-HNSCC samples, an elevated expression of ITGB4 can be seen in HNSCC samples. In previous research, tissues located at the margins of stratifying colonies of HNSCC tissues showed a high level of expression of ITGB4, although little ITGB4 expression was detected in the central areas. 48 Of interest, an earlier study on HNSCC cell lines reported a higher level of expression of ITGB4 at the edge of layered colonies than in the central colonies. 49 Both studies above indicated that there may be some regularity in the distribution of upregulated expression of ITGB4 in HNSCC cells, but more research may be needed to prove that further.
In addition, one point that should be noted in the research on ITGB4 is that ITGB4 may be lost during the preparation of some specimens if the specimens are not fixed fast. 48 This suggests that different research techniques may contribute to different expressions of ITGB4 in various studies on HNSCC. We feel confident, however, that this problem is not an issue in our research because the subgroup analysis is not only based on data from multiple groups showing a high level of expression of ITGB4 in HNSCC tissues but the analysis is also based on large samples of RNA-seq data (including 500 HNSCC samples and 44 control samples). These samples all supported our conclusions.
Furthermore, the AUCs of ROC curves and sROC curve based on the HNSCC subgroup with unspecified sites and RNA-seq from TCGA suggested that ITGB4 performed well in distinguishing HNSCC from non-HNSCC. All in all, according to the above points, ITGB4 may be a target for identification and treatment of HNSCC.
In fact, to further explore the clinical significance of ITGB4 in HNSCC, other analyses in addition to the subgroup analysis on the mRNA level were performed. In terms of protein level, previous IHC studies targeting one of the HNSCCs (i.e., OSCC) showed up-expression of ITGB4 in OSCC. 19,37 In our study, at protein level, HNSCC IHC samples from THPA overall expressed higher ITGB4 than the corresponding non-HNSCC samples, which is to some extent consistent with our findings at mRNA level.
In addition, we used the COSMIC database and the cBioPortal database for corresponding analyses to investigate whether the different expression levels of ITGB4 in the HNSCC group and the control group were related to gene mutations. As given in this research, which involved a vast number of samples, genetic alterations of ITGB4 in HNSCC were not common. These results showed that the increase of ITGB4 mRNA expression in HNSCC was not because of genetic alterations—at least not owing to point mutation, copy number variation, missense mutation, truncating mutation or amplification.
Moreover, we attempted to explore the relation between ITGB4 expression level and the clinical parameters of HNSCC patients to more fully understand the clinical significance of ITGB4 in HNSCCs. Previous IHC studies revealed that ITGB4 expression level was not correlated with any clinicopathological parameters. 19 But in this study, for the first time, we found that HNSCC patients with high T stage tended to have a high expression of ITGB4, whereas no relationship can be established between ITGB4 expression and other clinical parameters. This indicated that ITGB4 was likely to promote the growth of HNSCC primary foci.
A previous review has pointed out that a high level of expression of ITGB4 in HNSCC is often associated with p53 mutations, 31 therefore, we speculated that ITGB4 may help HNSCC cells escape apoptosis and thus the tumor of HNSCC can keep growing. For this reason, further exploration is required. Although the relationship between the poor prognosis of HNSCC patients and the expression of ITGB4 has been previously reported, 42 we did not find a statistically significant difference between these two factors from the survival analysis in the larger samples. Despite this, as mentioned previously, the expression level of ITGB4 can be related to the clinical parameters of HNSCC patients, at least to the T stage.
To sum up, based on our research, ITGB4 is highly expressed in HNSCCs (except for NPC, which needs further verification because of its complexity) and plays an important role in promoting the development of HNSCC. The expression level of ITGB4 is related to the T stage of HNSCC. In our study, although there was no statistically significant difference between HNSCC patients with high expression of ITGB4 and that with low expression of ITGB4 in terms of prognosis, we did find a positive correlation between ITGB4 expression levels and poor prognosis; this was also confirmed by numerous previous studies.
The mechanism of ITGB4 in HNSCC is complex. ITGB4 is one of the constituent subunits of integrin α6β4, and the latter, as a component of HDs, participates in adhesion and in the stabilization of cell structure. However, when the ITGB4 cytoplasmic region is phosphorylated, integrin α6β4 can be released from HDs and HDs are also disrupted, thereby promoting cancer cell migration and invasion. 50 Integrin α6β4 released from HDs binds to RTs, lamin protein ligands, and growth factor receptors and then promotes the occurrence and progression of HNSCCs by activating RHO GTPases Rac1, protein kinase C, PI3K, and extracellular-regulated protein kinases signaling pathways. 50,51 Integrin α6β4 can stimulate wild-type p53, resulting in the apoptosis of cells containing wild-type p53; 52 nevertheless, integrin α6β4 contributes to facilitate the survival of cancer cells lacking p53, which may be triggered by its activation for Akt/PKB. 31
It should be emphasized that the change of α6β4 localization may be as important as its overexpression in tumors. That is, ITGB4 may promote the occurrence and progression of HNSCCs through changes in expression levels and changes in localization in cells. 31 All in all, ITGB4 is clinically significant in HNSCCs.
However, some limitations exist in this study. For instance, although the sample size for the mRNA level analysis is large, that of the protein level analysis is quite small and thus we cannot perform a significance test. Meanwhile, there was a certain publication bias in comparing relationship between T stage and ITGB4 expression through the funnel plot with Egger's test (p < 0.05), and whether this was because of the small number of included studies (n < 10) needs further researches containing T stage. We also failed to confirm the early diagnostic value of ITGB4 for HNSCCs in body fluid detection. Moreover, we were not able to complete corresponding in vitro experiments for our study. Resolution of all of these limitations are worthy of further research in the future..
Conclusion
In summary, the elevated ITGB4 expression level in HNSCCs at both mRNA and protein levels can play a role in promoting cancer, especially in LSCC and OSCC. Furthermore, the elevation of ITBG4 may promote the growth and invasion of HNSCC cells, as suggested by the positive relationship between upregulation of ITGB4 and the clinical T stage. That is, our research suggests that ITGB4 may be an outstanding target for the diagnosis and treatment of HNSCCs. However, the clinical significance and potential molecular mechanism of ITGB4 in HNSCC still require further research.
Footnotes
Authors' Contributions
W.H., G.C., Z.-G.H., Y.-W.D., Q.-H.L., H.-Y.W., R.-Q.L., and H.-Y.W. conceived and designed the research, directed statistical analysis and modified article. G.-S.L., Y.-X.Y., X.-Y.C., X.-G.Z., Y.L., and M.-X.L. performed raw data analyses, chart production, article writing.
Author Confirmation Statement
The corresponding authors declare that all coauthors have reviewed and approved of the article before submission.
Disclosure Statement
No competing financial interests exist.
Funding Information
The study was supported by the funds of National Natural Science Foundation of China (31760319), Guangxi Medical University Education and Teaching Reform Project (2019XJGZ04), Guangxi First-class Discipline Project for Basic medicine Sciences (No. GXFCDP-BMS-2018), Promoting Project of Basic Capacity for Young and Middle-Aged University Teachers in Guangxi (Grant No. 2019KY0102), Guangxi First-class Discipline Project for Pharmaceutical Sciences (No. GXFCDP-PS-2018) and Guangxi Zhuang Autonomous Region Health and Family Planning Commission Self-financed Scientific Research Project (Z20180979). The results shown in the study are in part based upon data generated by the TCGA Research Network:
Supplementary Material
Supplementary Figure S1
Supplementary Figure S2
Supplementary Figure S3
Supplementary Figure S4
Supplementary Figure S5
Supplementary Figure S6