
Abstract
Background:
Patients with osteoblastic bone metastases are candidates for radium-223 (223RaCl2) therapy and may undergo sodium fluoride-18 (18F-NaF) positron emission tomography-computed tomography imaging to identify bone lesions. 18F-NaF has been shown to predict 223RaCl2 uptake, but intratumor distributions of these two agents remain unclear. In this study, the authors evaluate the spatial distribution and relative uptakes of 18F-NaF and 223RaCl2 in Hu09-H3 human osteosarcoma mouse xenograft tumors at macroscopic and microscopic levels to better quantify their correlation.
Materials and Methods:
18F-NaF and 223RaCl2 were co-injected into Hu09-H3 xenograft tumor severe combined immunodeficient mice. Tumor content was determined from in vivo biodistributions and visualized by PET, single photon emission computed tomography, and CT imaging. Intratumor distributions were visualized by quantitative autoradiography of tumor tissue sections and compared to histology of the same or adjacent sections.
Results:
18F and 223Ra accumulated in proportional amounts in whole Hu09-H3 tumors (r 2 = 0.82) and in microcalcified regions within these tumors (r 2 = 0.87). Intratumor distributions of 18F and 223Ra were spatially congruent in these microcalcified regions.
Conclusions:
18F-NaF and 223RaCl2 uptake are strongly correlated in heterogeneously distributed microcalcified regions of Hu09-H3 xenograft tumors, and thus, tumor accumulation of 18F is predictive of 223Ra accumulation. Hu09-H3 xenograft tumors appear to possess certain histopathological features found in patients with metastatic bone disease and may be useful in clarifying the relationship between administered 223Ra dose and therapeutic effect.
Introduction
Prostate cancer, breast cancer, and osteosarcoma commonly metastasize to the bone and other organs to form metastatic bone and visceral disease. 1 –4 Radium-223 (223RaCl2), an α particle-emitting radionuclide and calcium mimetic, is a bone-seeking radiopharmaceutical that targets the hydroxyapatite matrix in osteoblastic lesions, particularly with rapid bone remodeling. 5 –10
Radium-223 has been routinely used in the treatment of metastatic castration-resistant prostate cancer and is currently under investigation for the treatment of breast cancer patients with bone metastases and osteosarcoma patients with or without bone metastases. 11 –27 Several clinical trials have demonstrated that 223RaCl2 improves patient survival compared to standard of care; however, the therapeutic responses and quality of life of patients with metastatic disease receiving 223RaCl2 alone or 223RaCl2 in combination with other therapies have varied. 10,12,13,15,17,18,20 –24,28 –31 Thus, there is a need to refine patient selection for 223RaCl2 treatment and, if possible, tailor therapeutic doses to reduce patient morbidity.
223RaCl2 dosing is currently based on patient body weight (BW) (as opposed to total tumor burden or number of individual lesions). Thus, a noninvasive diagnostic imaging modality that reliably predicts 223Ra uptake in individual osteoblastic lesions before and throughout treatment may allow adjustment of the administered 223RaCl2 dose to concomitantly maximize the therapeutic effect, while minimizing patient morbidity. The bone-seeking positron emission tomography (PET) imaging agent sodium fluoride-18 ( 18 F-NaF), has proven superior to technetium-99m methylene diphosphonate (99mTc-MDP), in localizing bone metastases in prostate cancer patients. 16,32 –36 Moreover, 18 F-NaF uptake in bone lesions has been related to 223Ra absorbed dose and therapeutic responses. 37 –40
In recent clinical trials evaluating newly diagnosed metastatic prostate cancer patients with low metastatic burden, 223RaCl2 therapy in combination with standard of care showed overall survival benefits with partial responses in a subset of patients as assessed by decreased tumor burdens using either 18 F-NaF PET/computed tomography (CT) or 99mTc-MDP bone scintigraphy. 41,42 In breast cancer patients with bone-dominant metastases, a recent phase II clinical trial investigating 223RaCl2 in combination with hormonal therapy demonstrated progression-free survival with complete, partial, or stable responses in over half of the patients as determined by reduced lesion uptake with 18 F-FDG PET/CT. 24
In a recent phase I dose escalation trial in patients with recurrent or metastatic osteosarcoma showed that higher administered doses of 223RaCl2 (100 kBq/kg) had no significant toxicity and variable responses as monitored by CT/magnetic resonance imaging, 18 F-NaF PET/CT, and 18 F-FDG PET/CT, with 18 F-NaF PET/CT the preferred modality for disease staging. 26 This variability in treatment responses may be expected since 223Ra targets hydroxyapatite regions of osteoblastic lesions, which are heterogeneous in their histopathologies. 43 Therefore, there is a need for clinical imaging surrogates that quantitatively predict the amount and location of potential 223Ra accumulation among multiple bone lesions in patients.
In this study, the authors sought to assess the quantitative macroscopic and microscopic uptake and spatial distribution of 18 F-NaF and 223RaCl2 in an osteoblastic Hu09-H3 human osteosarcoma xenograft tumor mouse model with the hypothesis that 18 F-NaF would predict 223RaCl2 uptake both in amount and distribution. Both 18 F-NaF and 223RaCl2 accumulate in hydroxyapatite, especially in regions with high bone turnover, implying that such a predictive relationship should exist. They compared the total tumor uptake of 18 F-NaF and 223RaCl2 administered individually and by co-injection on a macroscopic scale using in vivo biodistribution and PET, single photon emission computed tomography (SPECT), and CT imaging methods and on a microscopic scale using ex vivo autoradiography of tumor tissue sections with confirmatory histology. Throughout this work, 223Ra is assumed to be in secular equilibrium with its daughter decay products. Unless otherwise described, the authors use the notation 223Ra and 18 F to specify 223RaCl2 and 18 F-NaF, respectively.
Materials and Methods
Radioisotope purification
Sodium fluoride-18, 18 F-NaF, was purchased from Cardinal Health (Greenbelt, MD) and diluted in 0.9% saline before animal experiments. The 18 F-NaF activity was measured with a dose calibrator (Capintec, CRC-25W). Radium-223 was purchased from Oak Ridge National Laboratory (Oak Ridge, TN) as eluent from a thorium-227/radium-223 (227Th/223Ra) generator and was repurified (Supplementary Data A) as 223Ra-dichloride, 223RaCl2, and dissolved in 0.9% saline before animal experiments. All 223Ra was handled according to NRC safety guidelines. 44 The 223Ra activity was measured with a high-purity germanium detector (Ortec, Oak Ridge, TN) for biodistribution studies or with a microdose calibrator 45 for imaging studies.
Cell culture and mouse tumor models
The human osteosarcoma cell line, Hu09-H3 (obtained from Dr. J. Yokota, National Cancer Center Research Institute, Tokyo, Japan), used in these studies has been previously characterized to form microcalcifications throughout the tumor tissue and to express multiple osteoblast markers upon intramuscular injection. 46 Cells were cultured at 37°C in a 5% CO2 environment in RPMI-1640 media (Gibco Life Technologies, Carlsbad, CA) supplemented with 10% fetal bovine serum (Gibco Life Technologies), 2 mM L-glutamine (Gibco Life Technologies), and 1% penicillin/streptomycin/amphotericin B (ThermoFisher Scientific, Waltham, MA). Hu09-H3 cells (2 × 10⁶ cells, Hank's balanced salt solution) were injected intramuscularly next to the tibia into female severe combined immunodeficient (SCID) mice (SCID beige; NCI-Frederick, MD; 5 weeks). Studies were performed in mice 16–17 weeks of age when tumors attained volumes between 0.5 and 2 cm3 (11–12 weeks of tumor growth). In addition, Hu09-H3 cells and PC3 cells (prostate cancer cell line that does not form microcalcifications) were injected into older and younger female athymic nude mice, respectively (Supplementary Data B). All animal studies were performed in accordance with NIH IACUC-approved protocols.
Biodistribution in mouse tumor models
Animals were injected intraperitoneally (IP) for biodistribution or intravenously (IV, tail vein) for imaging as a single injection or co-injection of
18
F-NaF (3.7 MBq [100 μCi]) and/or 223RaCl2 (3.7 kBq [0.10 μCi]). Mice were euthanized at 1 h postinjection and necropsies were performed. Blood and tissues were excised and the radioactivity concentrations were determined by γ counting (Perkin Elmer 2480, Wizard2) using a 450–1200 keV window for
18
F and a 60–500 keV window for 223Ra. Tissues from co-injected animals were counted for
18
F the same day as removal and for 223Ra following
18
F decay (13 half-lives). Aliquots (10% total dose) of the injected doses were collected in triplicate and counted as standards. Quantification of both agents in the blood and tissues were expressed as percent injected dose per gram of tissue (% ID/g), normalized to an animal BW of 20 g. CPM stands for sample counts per minute:
Tissue-to-blood (tissue % ID/g:blood % ID/g, T:B) ratios were determined to normalize for differences in blood tracer concentration. Parallel control studies were performed in older Hu09-H3 (positive control) or younger PC3 (negative control) xenograft tumor athymic nude mice (Supplementary Data C). A positive control study in age-matched healthy SCID mice was performed to compare differences in biodistribution, which might exist between IP and IV injection routes (Supplementary Data D).
Ex vivo autoradiography
Following biodistribution, excised Hu09-H3 tumors were cut in half (obtaining a representative cross section of the entire tumor), fast frozen in isopentane, sectioned (20 μm sections; Leica CM3050 S, Leica Biosystems, Inc., Buffalo Grove, IL), fixed in acetone, and exposed to phosphor-imaging plates (Fuji BAS-SR2025). The plates were read using a Fujifilm FLA-5100 scanner (FUJIFILM Life Science, Stamford, CT) to produce digitized autoradiographs. Tumor sections from singly injected animals (i.e., 223Ra only or 18 F only) were used to verify the methodology for co-injected animals (Supplementary Data E).
Before each of three phosphor-imaging sessions, tumor sections from co-injected animals containing both 223Ra and 18 F were exposed according to the following schedule: (1) 18 h to obtain a total 223Ra + 18 F signal, (2) a second 18 h (13 half-lives of 18 F decay) to obtain a 223Ra signal contributing to the 223Ra + 18 F signal, and (3) an additional 5–7 d (23 half-lives of 18 F decay) to obtain a clear 223Ra signal for image processing purposes. A signal for 18 F only was obtained by subtracting decay and background-corrected signals of (2) from (1).
The autoradiograph digital image signal was expressed in photo-stimulated luminescence (PSL) units. Regions of interest (ROIs) were drawn to obtain PSL values, which were background corrected, using Image Gauge v4.0 software (Fujifilm 2004, Tokyo, Japan) (Supplementary Data E). A calibration factor (C, CPMsection/PSLsection) was determined from the slope of the best fit line obtained by plotting the CPM of a section adjacent to the section used for autoradiography (CPMsection) and the corresponding PSL values from the autoradiography section (PSLsection) for at least three different sections. These factors were applied for each section to calculate percent injected dose per square millimeter (% ID/mm2) normalized to an animal BW of 20 g:
where PSL is the exposure of radioactivity to the phosphor-imaging plate, A is the area in mm2 of ROIs drawn within or around tumor sections, C is the calibration factor, CPMsection/PSLsection, CPMinjected dose is the total count rate of the injected dose, and BW is the animal BW in grams.
The mean % ID/mm2 value for each tumor was determined from ROIs encompassing the whole tumor section (WS) in 5 to 6 consecutive center-cut sections. In addition, ROIs were subjectively drawn within tumor sections of the 223Ra + 18 F image (exposure 1) and these same ROIs were applied to the decay-corrected 223Ra only image (exposure 2) to quantify regions with high radiotracer uptake (darker, high density [HD]; mean value of 5–6 sections) and representative regions with low radiotracer uptake (lighter, low density [LD]; mean value of 5–6 sections). HD regions averaged nine times the mean WS uptake and LD regions averaged one-fifth of the mean WS uptake.
In addition to the numerical estimates, the decay corrected, long-exposure 223Ra only image (exposure 3) was subtracted from the spatially registered 223Ra + 18 F image (exposure 1) to visualize the intratumor spatial distributions of 18 F only and 223Ra only. The image registration step was necessary since small changes in position of the tumor sections relative to the phosphor-imaging plate occurred during multiple exposures.
Whole-body PET, SPECT, and CT imaging
Whole-body PET, SPECT, and CT images were obtained in one Hu09-H3 xenograft tumor SCID mouse co-injected with 18 F-NaF (6.66 MBq [180 μCi]) and 223RaCl2 (0.37 MBq [10 μCi]). The mouse was euthanized after 1 h and then secured to an imaging bed (Supplementary Data F) compatible with a BioPET/CT small animal scanner 47 and a NanoSPECT/CT scanner. 48 The animal was imaged for 40 min with PET (two bed positions, 20 min/position) using an energy window of 250–700 keV followed by imaging for 8.5 min with CT (two bed position, step-and-shoot) at 50 kVp. Allowing 24 h for 18 F to decay, the animal was then imaged with CT (continuous 5-min helical whole-body data collection) at 45 kVp followed by imaging for 18 h with SPECT (combined step-and-shoot helical whole-body data collection) using two energy windows (67–101 keV and 121–177 keV). The extended SPECT imaging period was necessary due to the relatively low 223Ra activity and the reduced sensitivity of the multi-pinhole SPECT scanner. The dual energy windows were selected to detect X-ray emissions (51% abundance) and gamma ray emissions (9% abundance) emitted by 223Ra.
PET images were reconstructed (6 iterations, 20 subsets) with the 3D OSEM algorithm available on the BioPET/CT. SPECT images were reconstructed with the multi-pinhole reconstruction algorithm available on the NanoSPECT/CT. The PET and SPECT image stacks were scaled to the same image voxel size (Supplementary Data F) and spatially registered with one another across all three modalities.
Histology
Tumor tissues were either used from acetone-fixed autoradiography sections or processed as formalin-fixed paraffin-embedded (FFPE) tissues before histological staining. FFPE tissues and acetone-fixed sections were evaluated with hematoxylin and eosin (H&E) to determine cellular morphology (Supplementary Data G), and with Von Kossa and Alizarin Red S special stains to determine microcalcified tumor regions. Quantification was performed using positive pixel analysis reported as % positive pixels by tumor area using QuPath software. 49 Alizarin Red S formed red staining on tissue sections in the presence of calcium; Von Kossa formed black staining on tissue sections containing calcium bound to anions such as phosphate in hydroxyapatite.
Statistical analyses
Statistical analyses were performed in Prism 7 (GraphPad Software, Version 7.05, La Jolla, CA) using an unpaired Student's t-test. A 95% confidence interval (p < 0.05) was determined to be statistically significant. Results are shown as mean ± standard deviation.
Results
Biodistribution
The biodistributions of 223RaCl2 and/or 18 F-NaF were determined in Hu09-H3 xenograft tumor SCID mice at 1 h postinjection of each agent alone and co-injected together (Fig. 1A and Table 1). Both the 223Ra only and combination injection demonstrated that 223Ra uptake (% ID/g) was higher in the tumor (5%–6% ID/g) and femur (16%–18% ID/g) compared to most nontarget tissues, except for the spleen (40%–49% ID/g), kidney (31%–34% ID/g), and intestines (5%–6% ID/g) (Fig. 1A). In contrast, 18 F uptake was highest in the tumor (6%–10% ID/g) and femur (28%–30% ID/g), whereas all nontarget tissue uptake was lower (<2% ID/g). Whole tumor uptakes (% ID/g) of 18 F and 223Ra were positively correlated (r 2 = 0.82) (Fig. 2A).
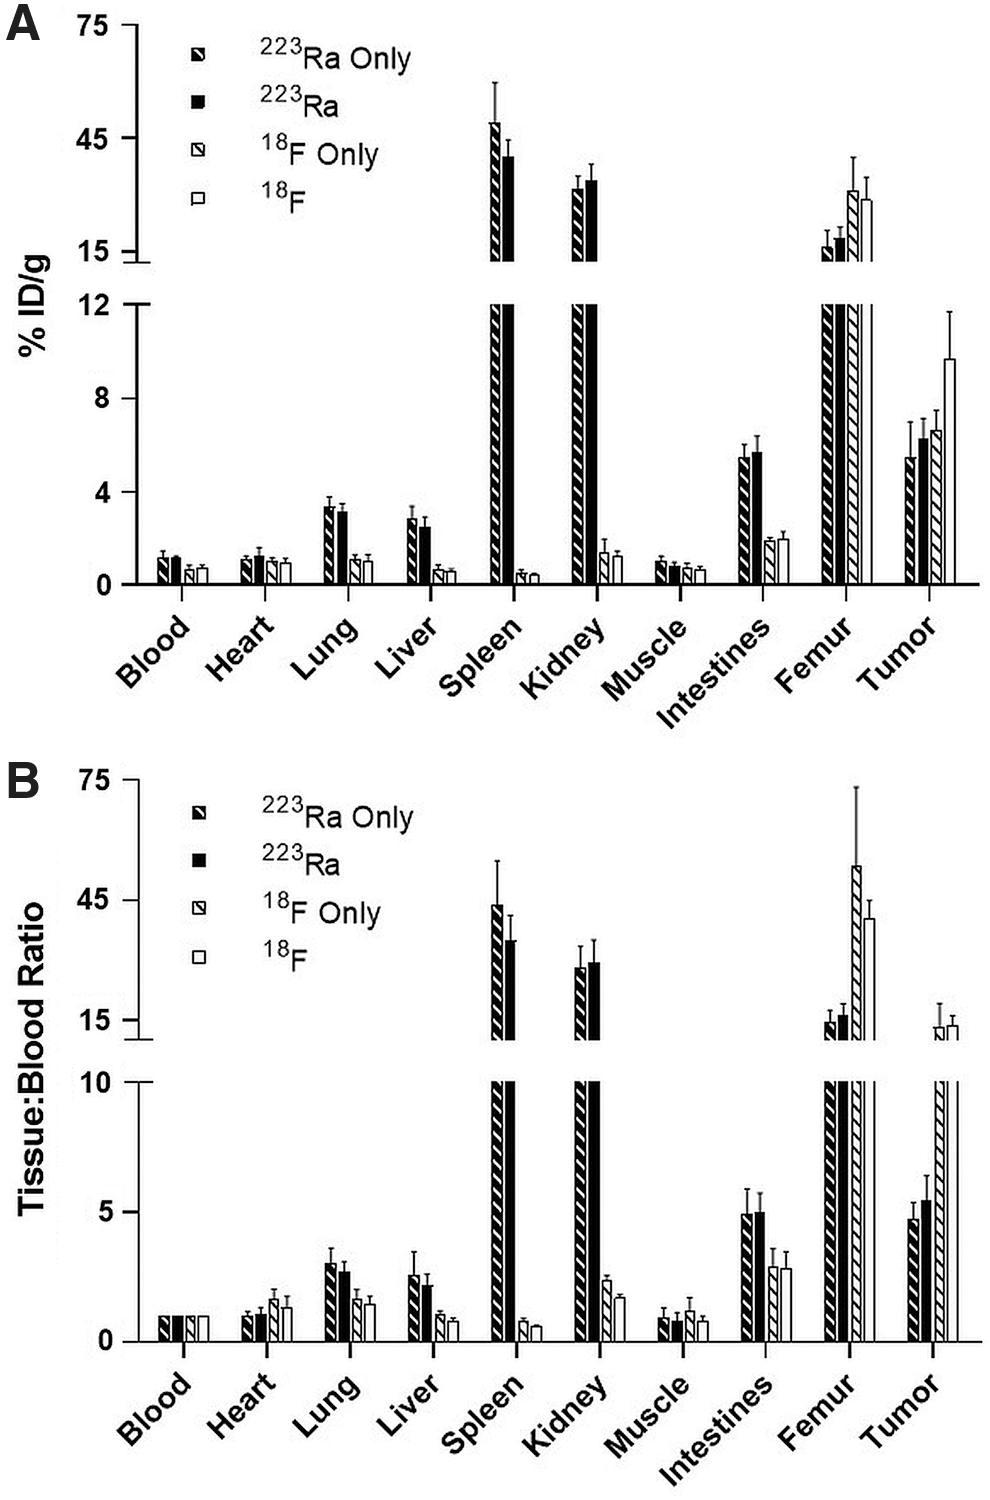
Biodistributions of 223Ra and
18
F in Hu09-H3 xenograft tumor SCID mice at 1 h postinjection.
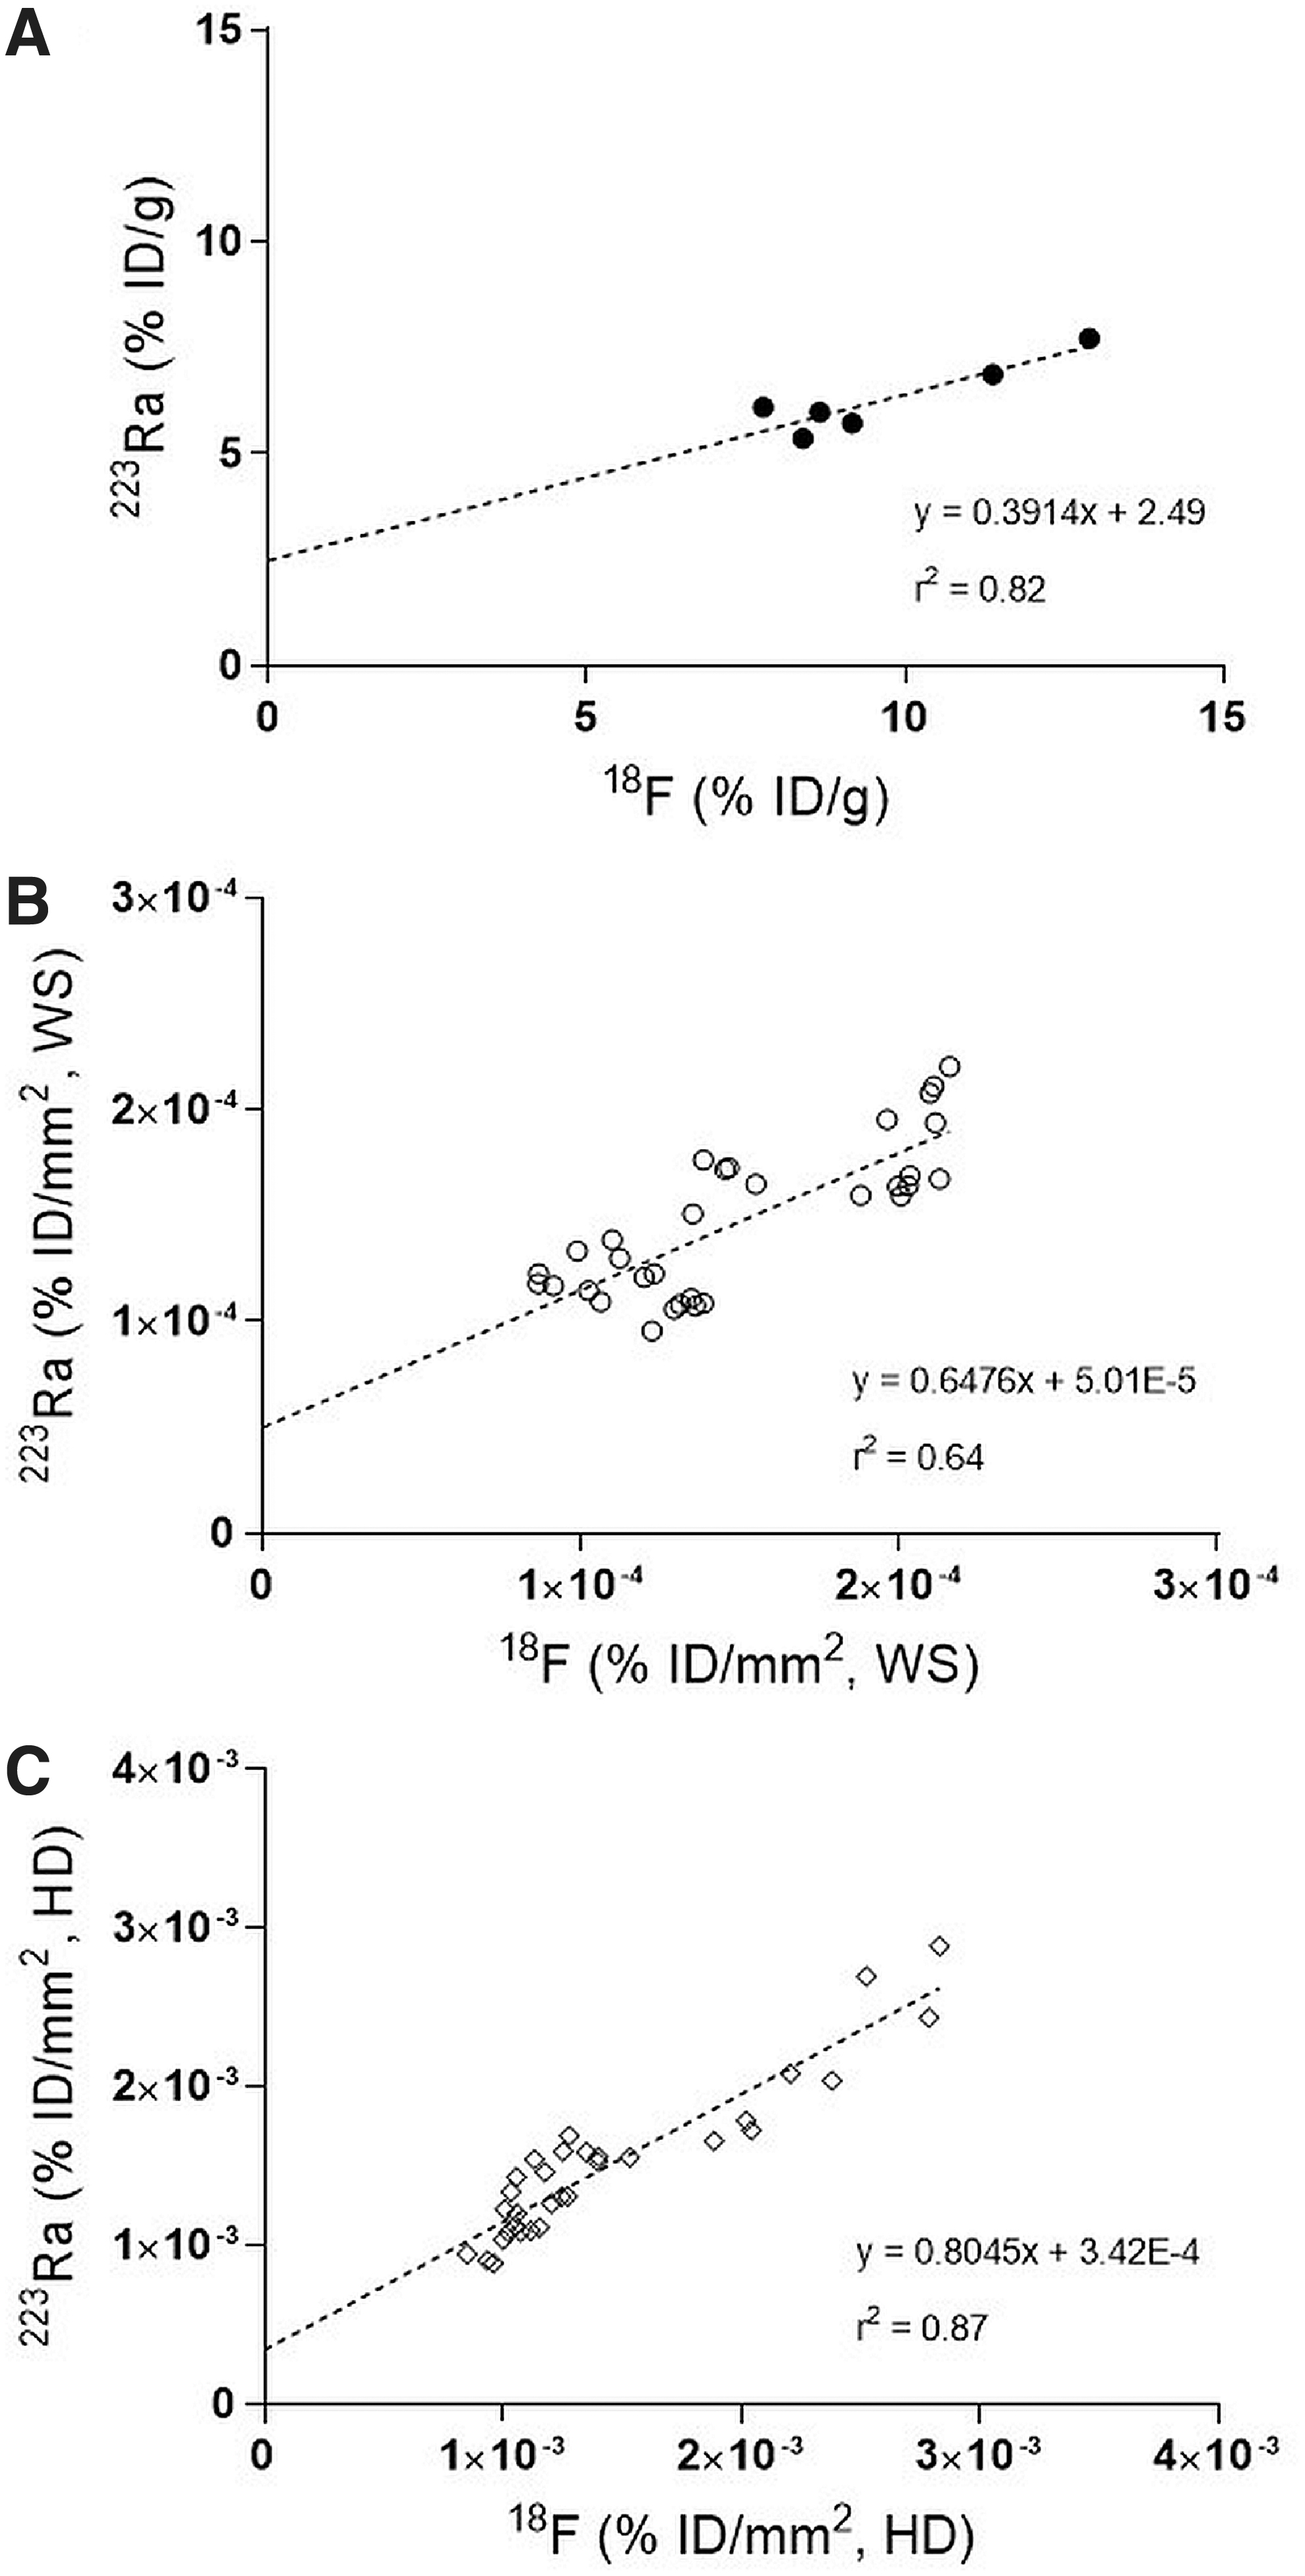
Correlations between 223Ra and
18
F tumor uptake in Hu09-H3 xenograft tumor SCID mice at 1 h post-co-injection of 223RaCl2 (3.7 kBq [0.10 μCi]) and
18
F-NaF (3.7 MBq [100 μCi]) in
Biodistribution of 223RaCl2 and 18 F-NaF in Hu09-H3 Xenograft Tumor Severe Combined Immunodeficient Mice
Percent injected dose per gram (mean ± SD; n = 5 for singly injected 223Ra; n = 7 for singly injected 18 F; n = 6 for co-injected 223Ra and 18 F).
Denotes a significant difference (p < 0.05) in tumor uptake of 18 F between co-injected or singly injected groups.
SD, standard deviation.
The biodistributions of 223Ra in all tissues when injected singly or in combination were not significantly different; the biodistributions of 18 F when singly injected or co-injected were not significantly different in all tissues, except in the tumor (Table 1). These differences in tumor uptakes are likely attributable to the inherent variability associated with the tumors in each group (i.e., size, microcalcification density, and heterogeneity) as opposed to a difference resulting from the agents injected alone or in combination. Since the blood uptakes of 223Ra and 18 F were dissimilar, indicating different input functions and altered pharmacokinetics, the uptakes were normalized using T:B ratios. The T:B ratios, including the tumor, of each agent injected alone were not significantly different (p > 0.05) compared to the respective agent in the combination group (Fig. 1B).
The biodistribution of 223Ra uptake compared to 18 F uptake, irrespective of whether the agents were injected alone or in combination, demonstrated clear differences in nearly all tissues. The T:B ratios between 223Ra and 18 F were significantly different (p < 0.05) in all tissues, except for the heart and muscle (Fig. 1B). These differences may be expected since the 223Ra and 18 F uptakes in nontarget tissues may represent other cellular absorption mechanisms unique for divalent cations compared to monovalent anions such as 223Ra and 18 F, respectively.
A separate positive control study with older Hu09-H3 xenograft tumor athymic nude mice (Supplementary Fig. S1) confirmed the 223Ra and 18 F biodistribution observed in Hu09-H3 xenograft tumor SCID mice. In contrast, a negative control study with younger PC3 xenograft tumor athymic nude mice (Supplementary Fig. S2) showed lower tumor uptake of 223Ra and 18 F (<1.5% ID/g) indicating that the tumor type and calcification density influence 223Ra and 18 F biodistributions. In addition, no differences in the biodistributions were observed when the radioactive doses were administered IV rather than IP (Supplementary Fig. S3).
Ex vivo autoradiography
The distribution of 223Ra and 18 F in Hu09-H3 tumor sections indicated colocalization in microcalcified regions. Autoradiographs of tumor sections from individually injected mice (Supplementary Fig. S4) and mice co-injected with 223Ra and 18 F (Fig. 3) showed a heterogeneous distribution in which specific high-uptake regions of 223Ra and 18 F (HD regions) corresponded to microcalcified tissue. The HD regions could be distinguished from lower uptake regions (LD regions) corresponding to noncalcified tissue.
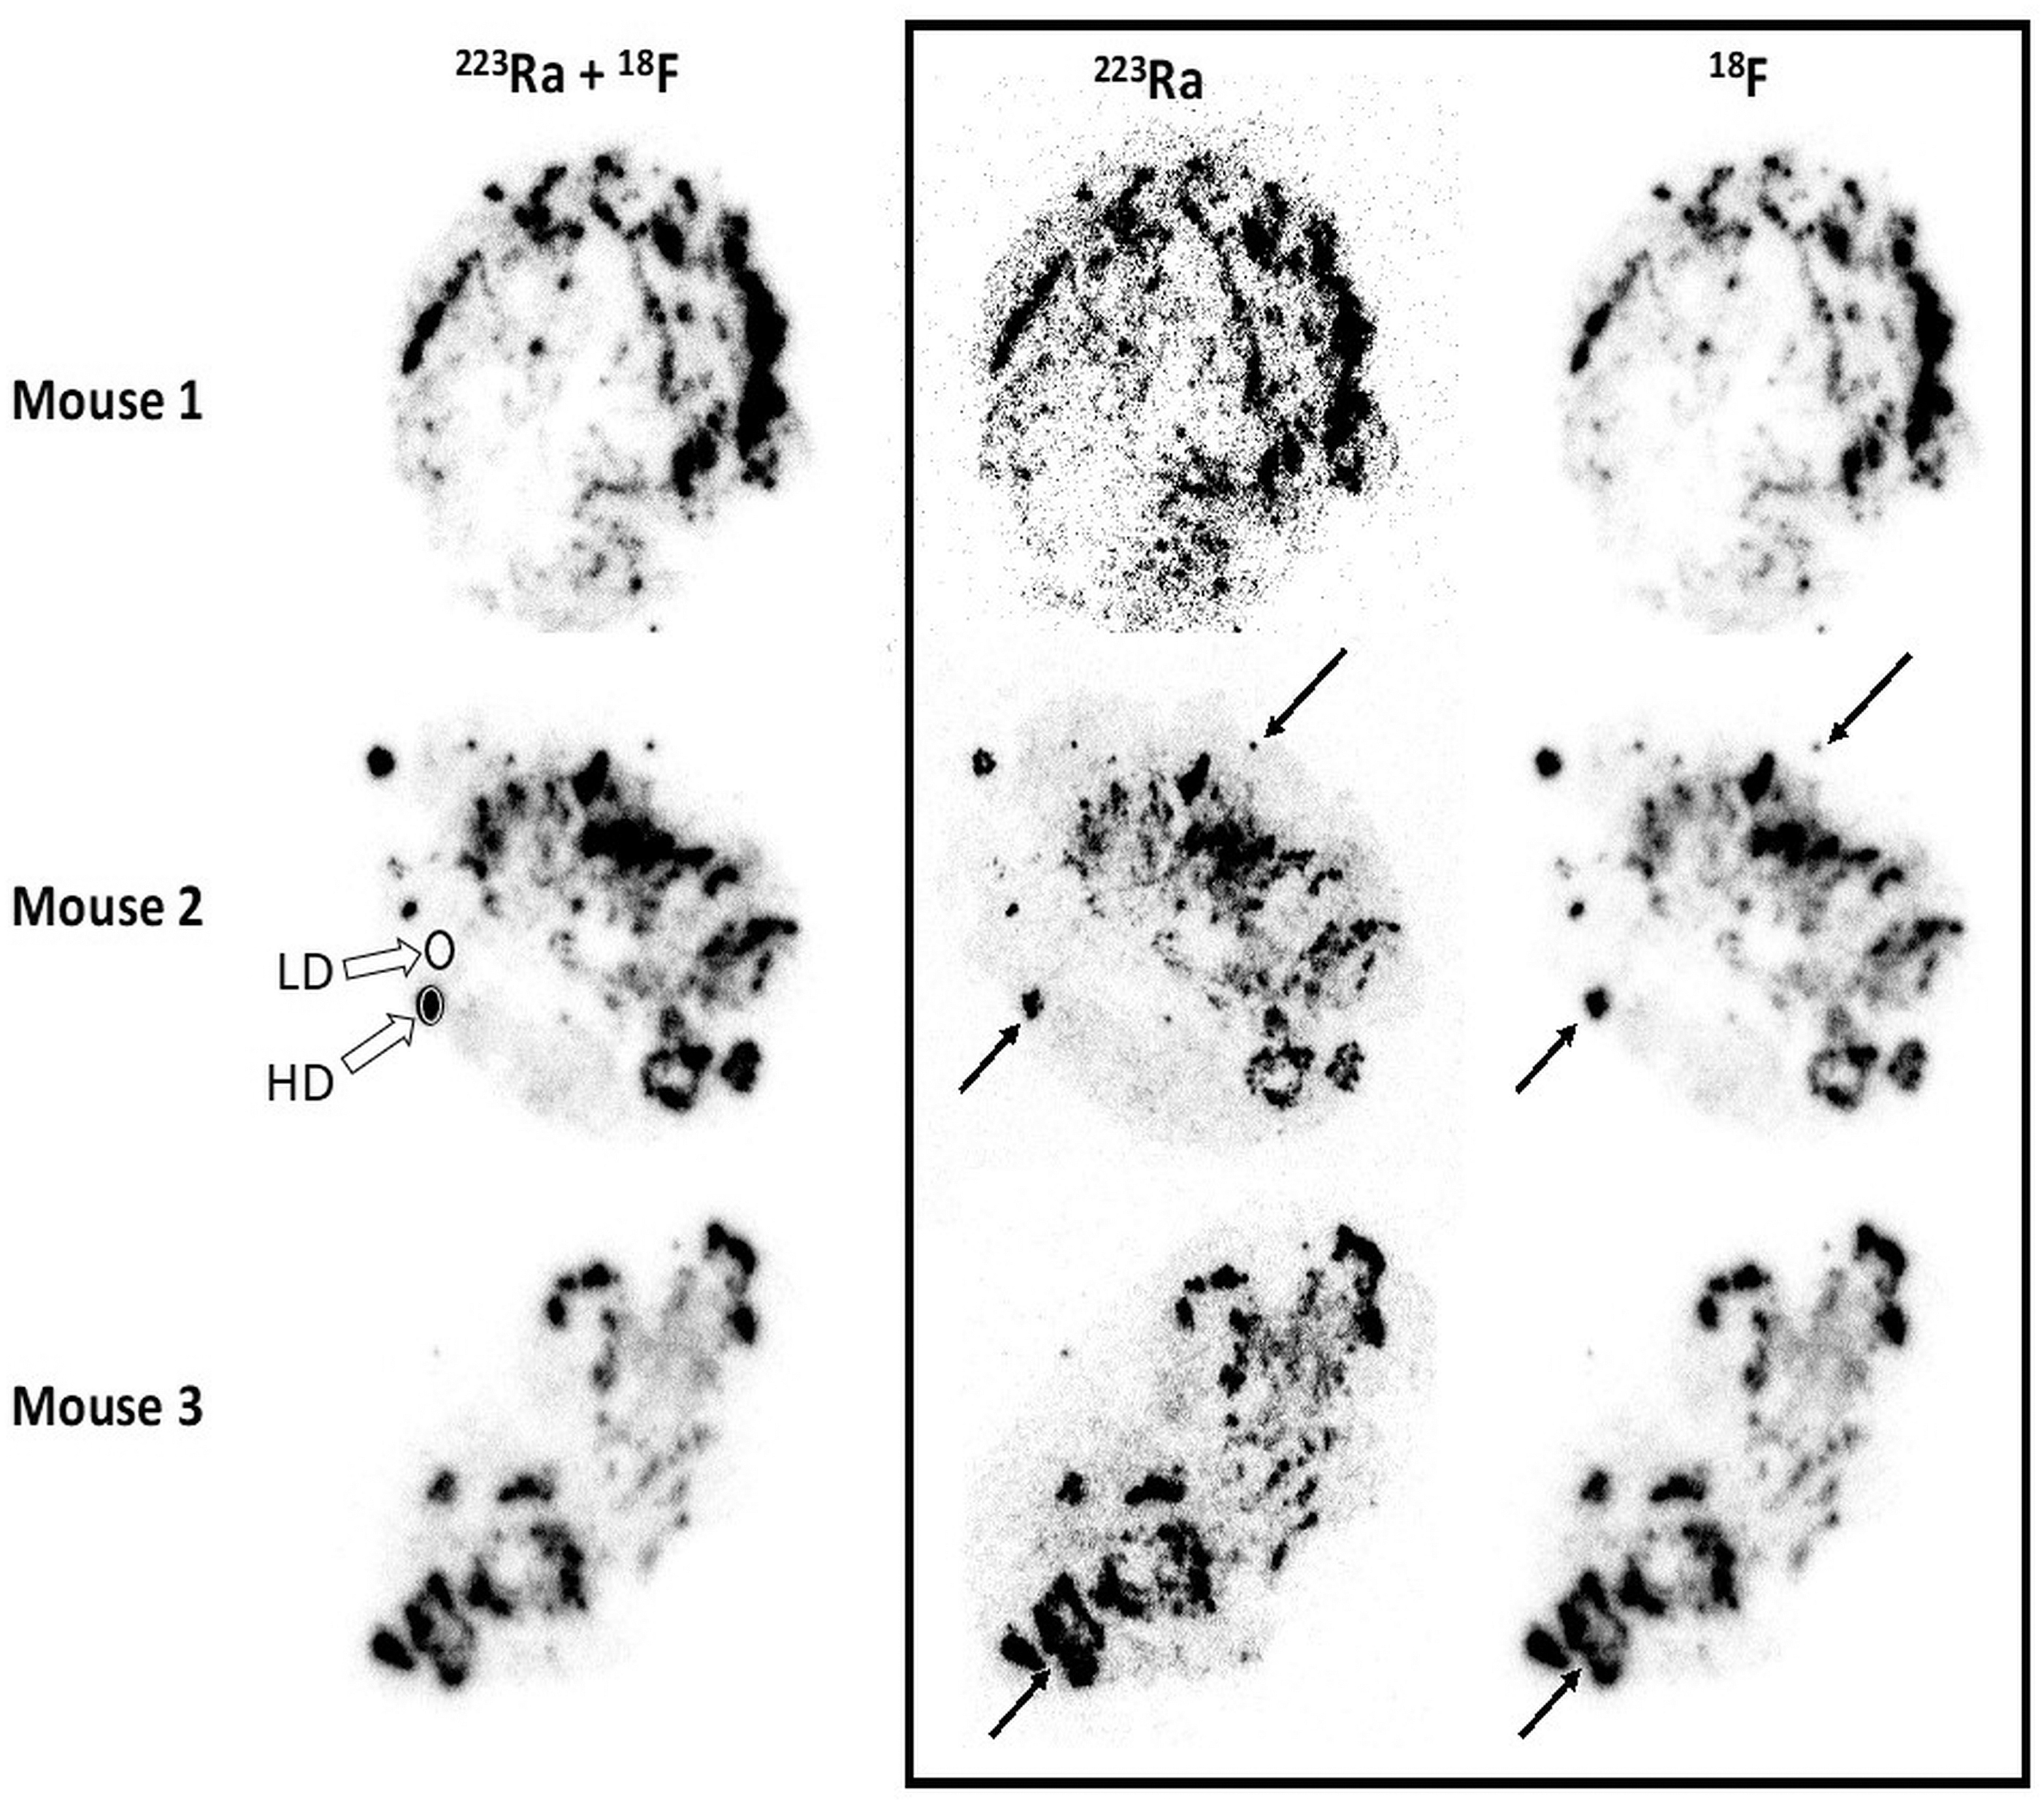
Autoradiographs showing the spatial distribution of 223Ra and 18 F in the same Hu09-H3 tumor tissue section (20 μm) from three different SCID mice 1 h after co-injection of 223RaCl2 (3.7 kBq [0.10 μCi]) and 18 F-NaF (3.7 MBq [100 μCi]). Images from 18-h autoradiograph exposures (first column) show the spatial distribution of the combination of 223Ra and 18 F. Images from 5–7 d autoradiograph exposures (second column) show the spatial distribution of 223Ra only (following 18 F decay). Images in the third column show the spatial distribution of 18 F only obtained by subtracting (after decay corrections) the images in the second column from the images in the first column. Uptake of 223Ra and 18 F in microcalcifications appears spatially congruent across all visible distance scales (black arrows). ROIs (open circles) locate typical HD and LD uptake regions within tumor tissue sections. LD, low density; ROIs, regions of interest.
Proportional uptake (% ID/mm2) of co-injected 18 F and 223Ra in WSs revealed that nearly equivalent amounts of both agents were present ( 18 F:223Ra ratio = 1.01 ± 0.20) (Supplementary Fig. S5B) and were positively correlated (r 2 = 0.64), but varied between sections (Fig. 2B). Moreover, proportional uptake of 18 F and 223Ra in microcalcified regions within WSs (HD) revealed similar amounts of both agents ( 18 F:223Ra ratio = 0.95 ± 0.13) (Supplementary Fig. S5B) with a highly positive correlation (r 2 = 0.87) (Fig. 2C). The uptake of 18 F and 223Ra within these microcalcified regions of tumor sections was, on average, ∼50-fold higher compared to noncalcified regions (Supplementary Fig. S5A), but large variations (range = 15–128) are likely due to mineralization heterogeneity between tumors and systematic errors in the ROIs. Although no significant differences were found (p > 0.05) when comparing 18 F:223Ra ratios measured by autoradiography methods (WS vs. HD), significant variations (p < 0.05) were present between autoradiography and biodistribution measurement methods (Supplementary Fig. S5B).
Whole-body PET, SPECT, and CT imaging
Whole-body PET, SPECT, and CT images were obtained in the same co-injected Hu09-H3 xenograft tumor mouse (Fig. 4). In the PET image, 18 F uptake was present in the skeleton (spine, hip and shoulder joints, femur, and skull) with minimal uptake in non-osseous tissues. In the SPECT image, 223Ra uptake was present not only in the skeleton but also the kidneys, spleen, and intestines. Thus, these imaging distributions are in general qualitative agreement with the co-injected biodistribution results (Fig. 1). Similarly, the intratumor distributions of 18 F and 223Ra in the PET and SPECT images and the microcalcified regions in the CT image of Figure 4 all share some common spatial features, but the large differences in spatial resolutions between methods make exact comparison problematic. The authors note that a faint spiral artifact near the edge of the field of view in the original SPECT image has been removed from the SPECT image in Figure 4.
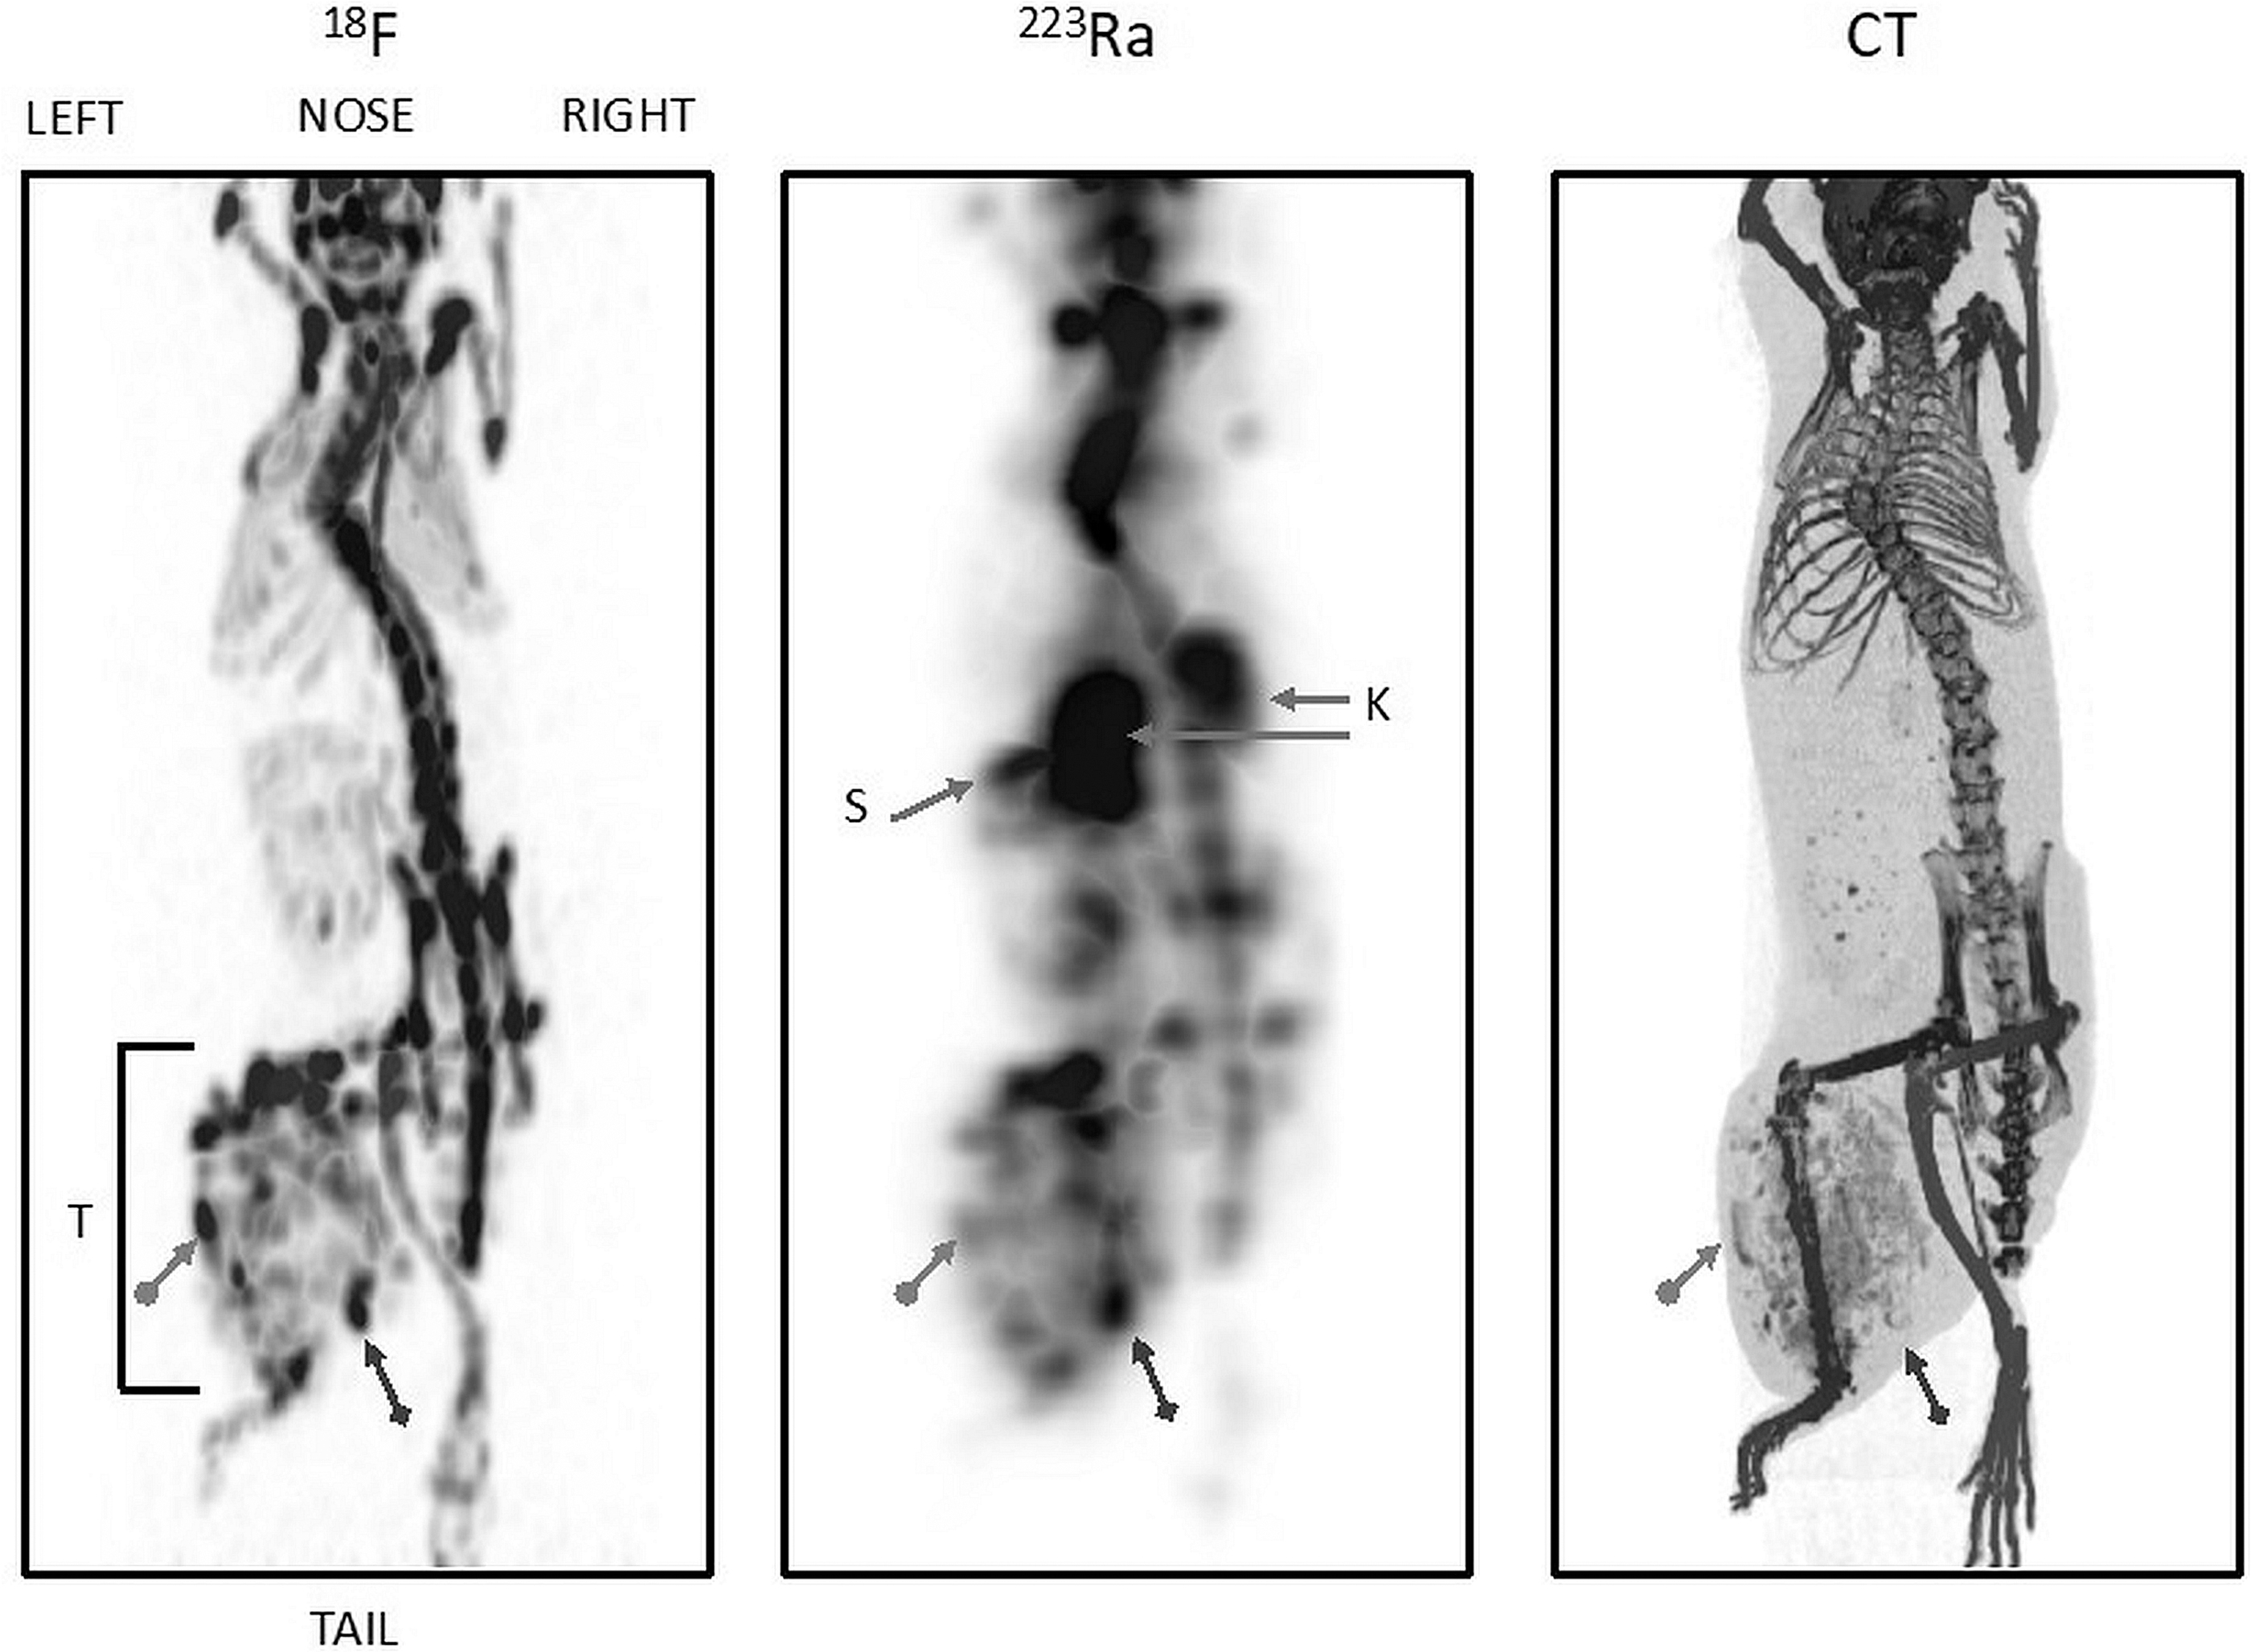
Spatially registered, left posterior oblique view, maximum intensity PET ( 18 F), SPECT (223Ra), and CT projection images of the same mouse 1 h after co-injection of 223RaCl2 (0.37 MBq [10 μCi]) and 18 F-NaF (6.66 MBq [180 μCi]). T, tumor; K, kidneys; S, spleen. The same two structures in the tumor region (bracket) are identified in all three images by dot-arrows and diamond-arrows, respectively. Vertical dimension of the bracketed area is ∼2 cm. Note that in the CT image, the tumor demonstrates multiple microcalcifications in tumor parenchyma and evidence of osteolytic destruction of the proximal tibia. Note that this tibia does not appear as an anatomical structure in the PET and SPECT images. CT, computed tomography; PET, positron emission tomography; SPECT, single photon emission computed tomography.
Histology
A representative Hu09-H3 tumor tissue section autoradiograph containing both 18 F and 223Ra (Fig. 5A) or 223Ra only following 18 F decay (Fig. 5B) was compared to the same tumor section after Von Kossa staining (Fig. 5C) and an immediately adjacent Alizarin Red S stained tumor section (Fig. 5D). Von Kossa staining had positive calcium phosphate mineralization (black staining, 1.45% ± 0.41% positive pixel, n = 10) and Alizarin Red S staining had positive calcium mineralization (red staining, 2.47% ± 0.58% positive pixel, n = 10). The ratio of calcium to phosphate was 1.70:1 in these microcalcifications and agrees with the expected 1.67:1 ratio associated with hydroxyapatite. 50 Furthermore, calcified regions determined with Von Kossa and Alizarin Red S staining corresponded to areas with higher 18 F and 223Ra uptake on the autoradiographs (Fig. 5A and B). Magnification of an Hu09-H3 tumor section demonstrated that Von Kossa and Alizarin Red S staining spatially matched the mineralized osteoid observed with H&E (Supplementary Fig. S6). In contrast, Von Kossa and Alizarin Red S staining showed no mineralization in PC3 tumors (Supplementary Fig. S7), which correspondingly did not have any regionally discrete 18 F or 223Ra uptake.
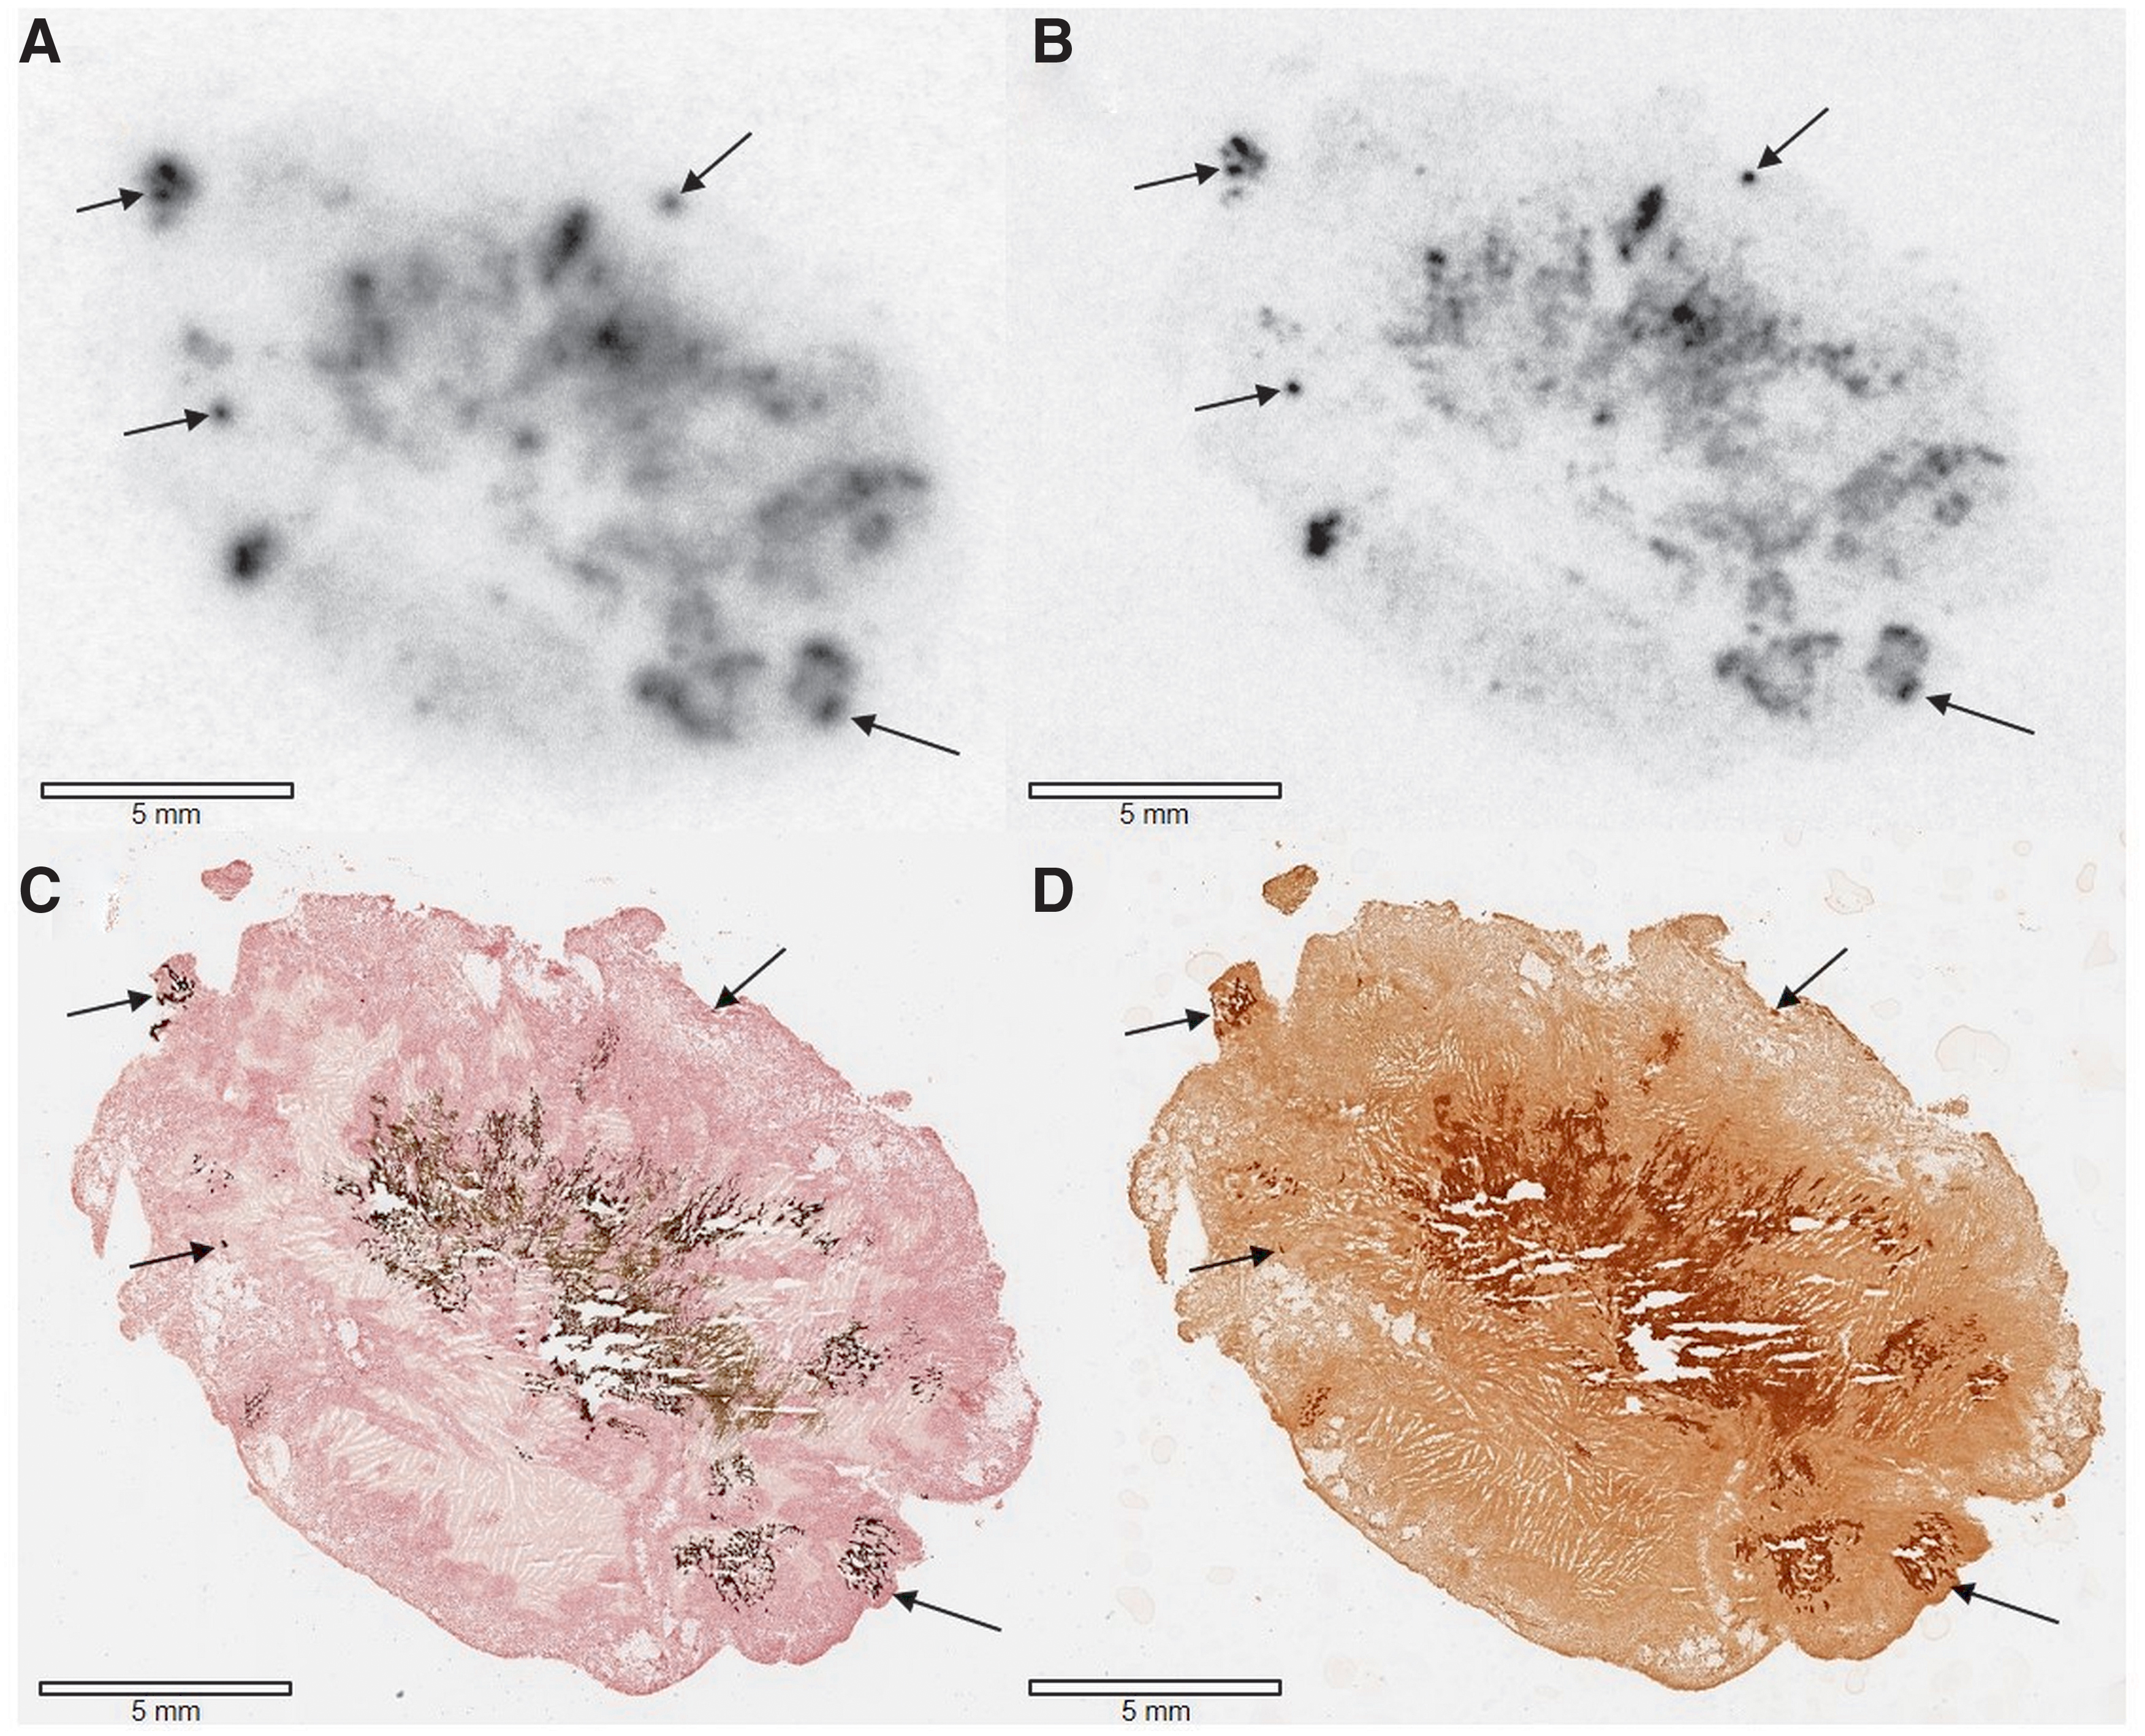
Autoradiographs and histology of Hu09-H3 tumor sections (20 μm) from the same mouse co-injected with 223RaCl2 (3.7 kBq [0.10 μCi]) and
18
F-NaF (3.7 MBq [100 μCi]).
Discussion
223RaCl2 is currently administered to patients with metastatic bone disease based only on patient BW, yet patients differ in the extent of metastatic disease, the degree of uptake of the agent, and, ultimately, the therapeutic response. Since the efficacy of α particle therapy depends on both the amount and the spatial distribution of the alpha-emitting agent within a tumor, the authors sought to determine whether 18 F-NaF might be a surrogate marker for these factors. If so, this information might allow therapeutic doses of 223RaCl2 to be adjusted for each patient with a positive 18 F-NaF PET/CT to maximize treatment effect, while reducing morbidity, and to identify patients with a negative or weakly positive 18 F-NaF PET/CT, who would not benefit from 223RaCl2 therapy.
Thus, the authors directly compared the amount of uptake and the spatial distribution of 18 F-NaF and 223RaCl2 using the Hu09-H3 osteoblastic human osteosarcoma xenograft tumor mouse model. Biodistributions demonstrated that the uptake of 18 F and 223Ra in whole tumors was positively correlated (r 2 = 0.82) and comparable to previous clinical findings. 37,38 Autoradiography further demonstrated that the correlation between 18 F and 223Ra uptake was strongly positive in microcalcified regions (r 2 = 0.87), which suggests that 18 F predicts 223Ra uptake with precision in bony lesions. The slopes of the regression lines in Figure 2 and the results portrayed in Supplementary Figure S5 indicate that 18 F uptake in these regions systematically exceeds that of 223Ra by a small amount. Although the ratio of 18 F to 223Ra may differ from unity, these small variations may also be explained by systematic experimental errors that arise when measuring two different types of particle emissions with autoradiography (beta and alpha) and comparing them to gamma-based measurements.
In addition to positively correlated 18 F and 223Ra tumor uptakes, the imaging results (Figs. 3–5) are consistent with the hypothesis that 18 F and 223Ra have congruent spatial distributions in regions of hydroxyapatite mineralization, but that these regions themselves are distributed heterogeneously throughout the xenografts. The uptakes of 18 F and 223Ra in these high-density, microcalcified regions were ∼65 and 44 times higher, respectively, than the uptakes of these agents in LD noncalcified regions (Supplementary Fig. S5A). Also, note that the tibia undergoing osteolytic destruction within the tumor region of the CT scan (Fig. 4) is not visible as an anatomical structure in the 18 F PET and 223Ra SPECT images, suggesting that osteoblastic processes are primarily targeted by these agents. 14 In contrast to previous reports showing that uptake of 223Ra in immunocompetent tumor mice occurred at areas of active bone remodeling, 51 the absence of visible 18 F or 223Ra uptake in the osteolytic tibia of these studies may be associated with this particular xenograft tumor model, which uses immunocompromised mice.
As previously shown with histopathology of metastatic prostate cancer lesions, 43 and in this study with histology and imaging of Hu09-H3 tumors (Figs. 3–5), the spatial distribution of osteoblastic target sites is heterogeneous and varies between animals (Fig. 3). Given the short path length of alpha emissions by 223Ra and its daughters (≤100 μm), 52 a mean tumor absorbed dose model would overestimate absorbed doses in regions without osteoblastic activity and underestimate absorbed doses in regions with dense osteoblastic activity, 53 potentially by large factors. This result suggests that the precise spatial distribution of 223Ra must be known within the whole lesion if therapeutic effect is to be related to administered activity. The Hu09-H3 human osteosarcoma cell line is a potentially useful tumor model in this regard by virtue of the distributed spatial distribution of bone deposits within a lesion that is amenable to study with contemporary imaging methods. 53
Metastatic disease, however, is complex and likely progresses through a variety of pathways. 3 Metastatic bone lesions develop when tumor cells from the peripheral blood enter into the bone marrow niche and interact with normal osteoid through growth factors that in turn induce rapid bone remodeling and promote osteoblastic or osteolytic metastasis. 3,10,54,55 Histopathology of metastatic prostate cancer bone lesions consist of a mixture of osteoblastic and osteolytic features, which have variable calcification densities, 43 seen in this study by autoradiography (Fig. 3), histology (Fig. 5), and the CT image (Fig. 4). Thus, the Hu09-H3 model, while not replicating the growth of metastatic bone lesions in humans, exhibits many features of human metastatic tumor growth in a way that makes it amenable to experimental study.
A principle limitation of current 223Ra imaging studies in mice is that therapeutic doses of 223Ra are very small compared to the amounts of activity normally used in conventional diagnostic small animal imaging studies. As a result, relatively low sensitivity imaging procedures, that is, SPECT, may require a lengthy imaging session for each animal, which limits the number of animals that can be studied per unit time. However, as shown in this study, 18 F can be used in much larger amounts as a PET imaging surrogate for 223Ra at both macroscopic and microscopic levels to avoid this problem. Consequently, 18 F could be administered to mice in longitudinal, therapeutic studies to quantify and visualize both the amount and spatial distribution of the administered dose of 223Ra and potentially monitor its therapeutic effect on the osteoblastic lesions. Such longitudinal studies could also extend the 223Ra measurement interval beyond the 1h uptake time point used in this study. However, several limitations exist when applying these results to a clinical setting. 18 F-NaF PET/CT preclinical studies may establish that 18 F tumor uptake is predictive of 223Ra tumor uptake and, potentially, its therapeutic efficacy, but the biodistribution of 18 F-NaF does not reflect that of 223Ra in nontarget organs. That is, while 18 F-NaF PET/CT imaging may indicate that increasing administered 223RaCl2 doses in patients with metastatic bone disease has therapeutic advantages based on the number of 18 F “responsive” lesions, off-target intestinal toxicity as well as other nontarget organ toxicities may limit the 223RaCl2 dose despite favorable 18 F-NaF bone lesion uptake. 13,19
Furthermore, although CT has shown low sensitivity in monitoring metastatic disease and a “flare” response has been observed in some patients during treatment, which can confound 18 F image interpretation, the use of both CT and 18 F PET imaging, together with this model, might provide the spatial distribution information needed by advanced Monte Carlo physics models of the tumor microenvironment to relate administered dose to therapeutic effect in these lesions. 34 This human xenograft model, however, would only account for therapeutic efficacy based on tumor cell death from alpha emissions and would not take into account the contribution of immune cells in the tumor microenvironment. 10
Conclusion
18 F-NaF and 223RaCl2 spatially colocalize in regions of hydroxyapatite microcalcifications in osteoblastic Hu09-H3 xenograft tumors with uptakes that are positively correlated at both macroscopic (r 2 = 0.82) and microscopic (r 2 = 0.87) levels. These results are thus in accord with clinical findings where pretreatment 18 F-NaF PET/CT imaging is used in patients at risk of metastatic bone disease to identify those most likely to benefit from 223Ra therapy as well as predict patients not expected to benefit from 223Ra therapy. This study also suggests that the Hu09-H3 xenograft tumor model may prove useful in studying the relationship between 223Ra administered dose and its therapeutic effect.
Footnotes
Acknowledgments
The authors wish to express their gratitude to Dr. J. Yokota (National Cancer Center Research Institute, Tokyo, Japan) for providing the Hu09-H3 human osteosarcoma cell line.
Authors' Contributions
Concept and design: A.K.L., P.L.C., and E.M.J. Development of experimental methodology: T.E.P., J.R., M.V.G., J.S., K.E.B., S.A., E.F.E., D.B., S.H., L.R., A.K.L., and E.M.J. Performed the experiments: T.E.P., J.R., M.V.G., J.S., K.E.B., S.A., E.F.E., D.B., J.L.M., A.T.T., K.W., S.H., L.R., and E.M.J. Analyzed the data: T.E.P., M.V.G., J.S., S.A., and E.F.E. Writing and revision of the article: T.E.P., M.V.G., P.L.C., and E.M.J. Conceptual advice provided by M.V.G, J.S., S.A., A.K.L, P.L.C., and E.M.J. All coauthors have reviewed and approved the article before submission.
Disclosure Statement
No competing financial interests exist.
Funding Information
This project has been funded, in whole or in part, with federal funds from the National Cancer Institute, National Institutes of Health, under Contract No. HHSN261200800001E and Contract No. 75N910
Supplementary Material
Supplementary Data
Supplementary Figure S1
Supplementary Figure S2
Supplementary Figure S3
Supplementary Figure S4
Supplementary Figure S5
Supplementary Figure S6
Supplementary Figure S7
References
Supplementary Material
Please find the following supplemental material available below.
For Open Access articles published under a Creative Commons License, all supplemental material carries the same license as the article it is associated with.
For non-Open Access articles published, all supplemental material carries a non-exclusive license, and permission requests for re-use of supplemental material or any part of supplemental material shall be sent directly to the copyright owner as specified in the copyright notice associated with the article.