
Abstract
Background:
Breast cancer (BC) occurs in the epithelial tissues of the breast gland, which is the most common cancer in women. This study is implemented to construct a risk score system for BC.
Materials and Methods:
The methylation data of BC from The Cancer Genome Atlas database (the training set) and GSE37754 from Gene Expression Omnibus database (the validation set) were downloaded. The differentially methylated RNAs (DMRs) between BC and normal samples were screened by limma package, and the correlations between the expression levels and methylation levels of the DMRs were analyzed to calculate their Pearson correlation coefficients (PCCs) using the cor.test function. To build the risk score system, the optimal RNAs were identified by penalized package. Subsequently, the nomogram survival model was established using the rms package. The lncRNA-mRNA comethylation network was constructed by Cytoscape software, and then enrichment analysis was performed using DAVID tool.
Results:
From the 1170 DMRs between BC and normal samples, 800 DMRs with significant negative PCCs were screened. For building the risk score system, the 15 optimal RNAs were selected. Afterward, the nomogram survival model based on four independent clinical prognostic factors (including age, radiation therapy, tumor recurrence, and RS model status) was constructed. In the comethylation network, the long noncoding RNA (lncRNA) PRNT was comethylated with FAM19A5 and RBM24. For the mRNAs in the comethylation network, angiogenesis and pathways in cancer were enriched.
Conclusion:
The risk score system and the nomogram survival model might be of great importance for the prognosis prediction of BC patients.
Background
Breast cancer (BC) is the most common cancer in women, which has the symptoms of breast lump, breast deformation, skin dimpling, and nipple discharge. 1 The main risk factors of BC include family history, ionization radiation, obesity, lack of exercise, excessive alcohol and cigarette consumption, early menstruation, and later birth or infertility. 2 BC takes up 25% of all tumor cases in women, which was responsible for ∼459,000 deaths worldwide in 2015. 3,4 The curative effects of BC are mainly related to tumor stage and onset age, and early diagnosis is an important way to improve prognosis and reduce mortality of BC. 5 Therefore, more studies should be conducted to promote the diagnosis and prognosis of BC.
DNA methylation can promote carcinogenesis and tumor progression through inducing abnormal gene expression and genomic instability, and methylation detection is valuable for screening tumor susceptible people. 6,7 The promoter methylation of cadherin 1 (CDH1) is related to estrogen receptor status and lymph node metastasis of BC patients, which independently predicts unfavorable outcome in the tumor. 8 Ras association domain family member 2 (RASSF2) hypermethylation in luminal tumors is more frequent and is correlated with favorable prognosis, and thus methylation status of RASSF2 can serve as a marker for prognosis in BC. 9,10 The promoter methylation of the long noncoding RNA (lncRNA) long intergenic nonprotein coding RNA 472 (LINC00472) has an influence on LINC00472 expression in BC, and its expression indicates the recurrence of grade 2 BC patients. 11 The lncRNA maternally expressed 3 (MEG3) acts as a tumor suppressor in the metastasis of BC, and the miR-506/SP3/SP1/DNA methyltransferase 1 (DNMT1)/MEG3 axis plays roles in mediating the invasion and migration of BC cells. 12 Nevertheless, the roles of lncRNA and mRNA methylation in the prognosis of BC have not been fully understood.
The polygenic risk score involving multiple single nucleotide polymorphisms can improve the predictive ability of the Breast Cancer Surveillance Consortium risk model, which contributes to select the appropriate treatment modalities for BC patients. 13 –15 However, the risk score system based on the methylation levels of lncRNAs and mRNAs has not been established. In this study, the differentially methylated RNAs (DMRs) between BC and normal samples in The Cancer Genome Atlas (TCGA) dataset were explored. Then, the independent prognosis-associated DMRs were further screened for constructing the risk score system. Moreover, nomogram survival model was built based on the independent clinical prognostic factors. In addition, lncRNA-mRNA comethylation network analysis and enrichment analysis were conducted to explore the potential functions of the RNAs. The findings from this study might help to improve the accuracy of prognostic prediction in BC patients.
Materials and Methods
Data source
From TCGA (
Differential analysis
The methylated sites in the TCGA dataset were annotated according to the platform annotation information, and only the methylated sites involving specific genes and lncRNAs were retained. Using the R package limma (version 3.34.7), 16 the DMRs were screened from the BC samples and normal samples. The false discovery rate (FDR) <0.05 and |log2 fold change (FC)| > 1 were selected as the thresholds.
Correlation analysis
The BC samples with both methylation data and expression data were selected, and then the expression levels and methylation levels of the identified DMRs were obtained. Using the cor.test function 17 in R, correlation analysis was conducted for the overall expression levels and methylation levels of the DMRs to calculate their Pearson correlation coefficients (PCCs). After that, PCC was calculated for the expression level and methylation level of a single DMR. Finally, only the DMRs with significant negative PCCs were retained for further analysis.
Construction of risk score system
Combined with the clinical prognosis information of the 776 BC samples in the training set, the DMRs with methylation levels significantly correlated with prognosis were screened using the univariate Cox regression analysis in the R package survival. 18 Afterward, the independent prognosis-associated DMRs were further selected using the multivariate Cox regression analysis in the survival package. 18 The log-rank p-value <0.05 was selected as the threshold of significant correlation.
Using the Cox-Proportional Hazards (Cox-PH) model in the R package penalized 19 (version 0.9.50), the optimal combination of the independent prognosis-associated DMRs was selected based on their methylation levels. The optimized parameter “lambda” in the model was obtained through 1000 times of cycle calculation using crossvalidation likelihood (cvl). 20
On the basis of the prognostic coefficients and methylation levels of the DMRs in the optimal combination, the following risk score system was established:

Here, βDMRs and Methylation DMRs separately represent the prognostic coefficients and methylation levels of the optimal DMRs in the training set.
The RS of each sample in the training set was calculated, and then the samples were classified into high-risk and low-risk groups based on the RS median value. Using the Kaplan–Meier (KM) method in survival package, 18 the correlation between high- and low-risk grouping and actual survival prognosis information was evaluated. Similarly, the methylation levels of the optimal DMRs were extracted from the samples in the validation set, and the samples were divided into high- and low-risk groups according to their RS median value. Finally, the correlation between the high- and low-risk grouping and the actual survival prognosis information of the samples in the validation set was assessed using KM method in survival package. 18
Construction of nomogram survival model
Using the univariate and multivariate Cox regression analyses in survival package, 18 the independent clinical prognostic factors in the training set were screened. The threshold was defined as the log-rank p-value <0.05. To explore the correlation between the independent clinical prognostic factors and survival prognosis, the R package rms (version 5.1–2) 21 was used to build the nomogram survival model combined with the risk information discriminated by the risk score system.
Moreover, the model based on the independent clinical prognostic factors and the model based on both the independent clinical prognostic factors and the optimal DMRs were constructed. In addition, area under the receiver operating characteristic (ROC) curve (AUROC) based on pROC package 22 (version 1.14.0) and C-index based on survcomp package 23 (version 1.34.0) were calculated to compare the efficiencies of the two kinds of models with that of the risk score system.
LncRNA-mRNA comethylation network analysis and enrichment analysis
The methylation levels of the DMRs significantly correlated with prognosis were extracted from the training set, and then the PCCs of the methylation levels of the lncRNAs and mRNAs among these DMRs were calculated by the cor.test function.
17
The lncRNA-mRNA pairs with |PCC| > 0.4 were selected. Using Cytoscape software
24
(version 3.6.1), lncRNA-mRNA comethylation network was constructed. Under the cutoff criterion of p-value <0.05, Gene Ontology (GO)_Biology Process (BP) and Kyoto Encyclopedia of Genes and Genomes (KEGG) enrichment analyses for the mRNAs in the comethylation network were performed using DAVID tool
25
(version 6.8,
Results
Differential analysis
Based on the platform annotation information, a total of 14,005 methylated sites involving specific genes and lncRNAs were obtained. There were 1170 DMGs (including 16 lncRNAs and 1154 mRNAs) between BC samples and normal samples (Fig. 1A, B). After the top 50 hypermethylated and hypomethylated RNAs were selected according to the ascending order of log2FC, the bidirectional hierarchical clustering heatmap was drawn based on their methylation levels. The clustering heatmap indicated that the samples were clearly divided into two different groups (Fig. 1C).

The results of differential analysis.
Correlation analysis
Correlation analysis showed that the overall expression levels and methylation levels of the DMRs had significant negative correlation (Cor. = −0.2549, p-value <2.20e-16) (Fig. 2). Through calculating the PCC for the expression level and methylation level of a single DMR, 800 DMRs with significant negative PCCs were selected for the subsequent analysis.

The scatter diagram showing the correlation between the overall expression levels and methylation levels of the DMRs in the training set. The gray dashed indicates the distribution trend of the dots.
Construction of risk score system
Combined with univariate Cox regression analysis, 175 DMRs significantly correlated with prognosis were selected. From the 175 DMRs, 31 independent prognosis-associated DMRs (including four lncRNAs and 27 mRNAs) were further screened by multivariate Cox regression analysis.
Based on the 31 DMRs, the optimal combination involving 15 independent prognosis-associated DMRs (one lncRNAs and 14 mRNAs) was identified using the Cox-PH model (protective RNAs: prion locus lncRNA, testis expressed, PRNT; tuftelin 1, TUFT1; zinc finger protein 462, ZNF462; chromobox 5, CBX5; solute carrier family 25 member 33, SLC25A33; and TOX; risky RNAs: acetyl-CoA carboxylase beta, ACACB; glutathione S-transferase mu 1, GSTM1; family with sequence similarity 19 (chemokine (C-C motif)-like), member A5, FAM19A5; zinc finger protein 804B, ZNF804B; RNA-binding motif protein 24, RBM24; potassium voltage-gated channel modifier subfamily V member 1, KCNV1; sarcoglycan beta, SGCB; cysteine-rich secretory protein LCCL domain-containing 1, CRISPLD1; and cell adhesion molecule L1 like, CHL1) (Fig. 3A and Table 1). Then, the risk score system based on the prognostic coefficients and methylation levels of the optimal DMRs was built. According to the RS median values, the samples in the training set and validation set were classified into high-risk group and low-risk group. The RSs, overall survival time, and the methylation levels of the optimal DMRs are also presented (Fig. 3B, C).
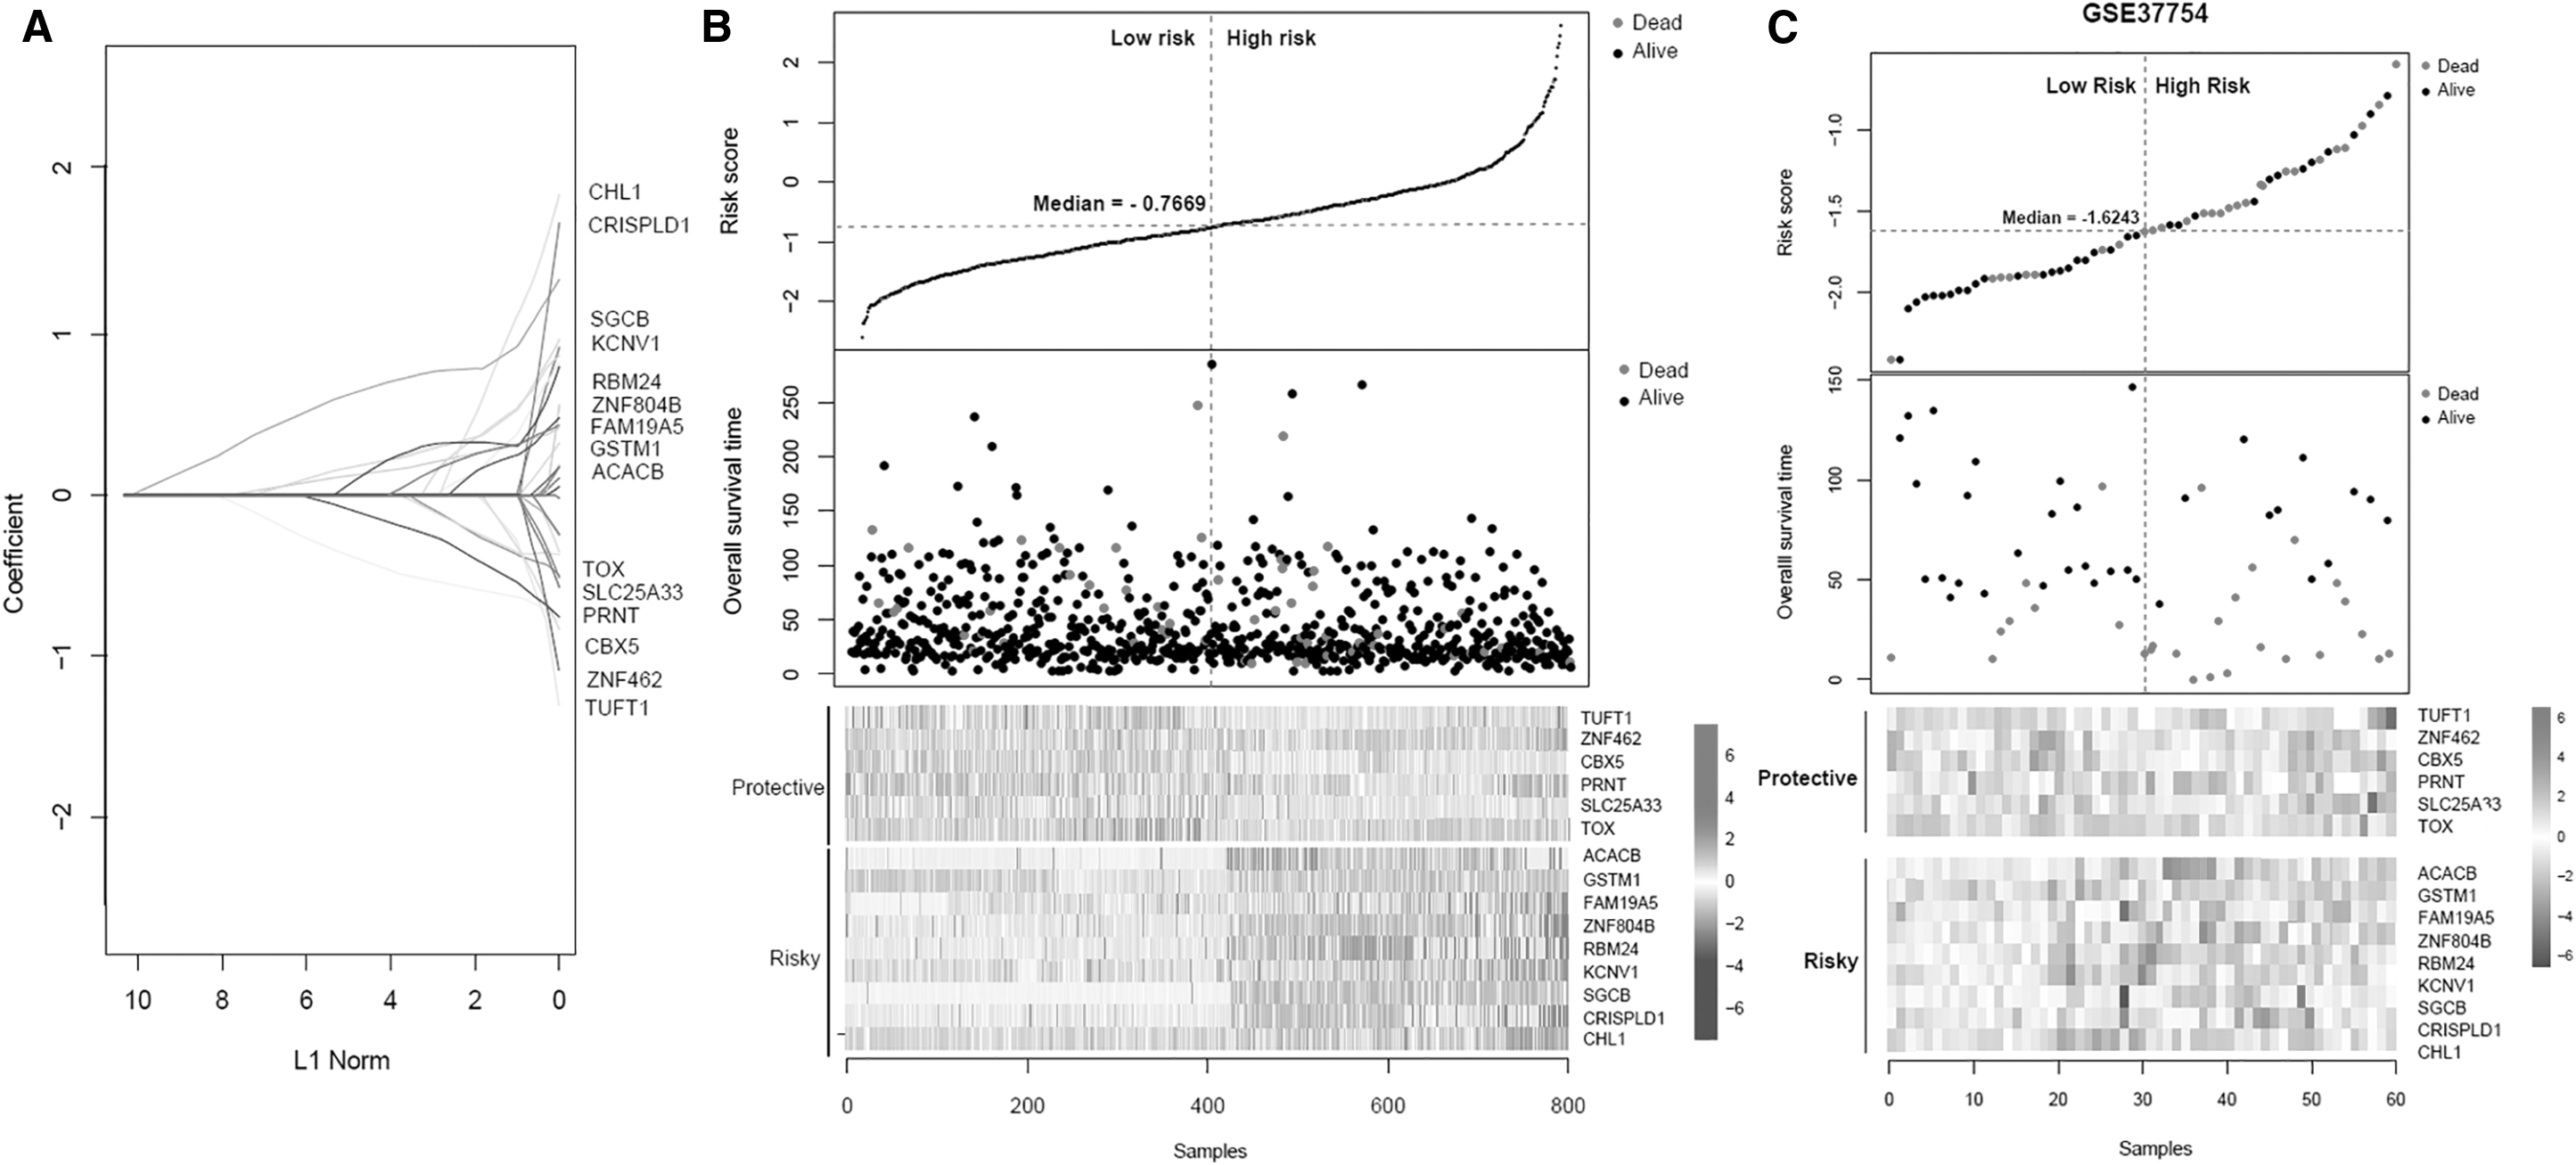
The coefficients and methylation levels of the optimal RNAs, and the risk scores and OS time of the samples in the training set.
The Differentially Methylated RNAs Involved in the Optimal Combination
ID, identification; HR, Hazard Ratio; CI, confidence interval.
Combined with KM method, the correlation between the risk grouping and actual survival prognosis information was evaluated in both the training set and the validation set. KM curves suggested that the risk groups divided by the risk score system and actual survival prognosis information had significant correlation in both the training set (Fig. 4A) and the validation set (Fig. 4B).
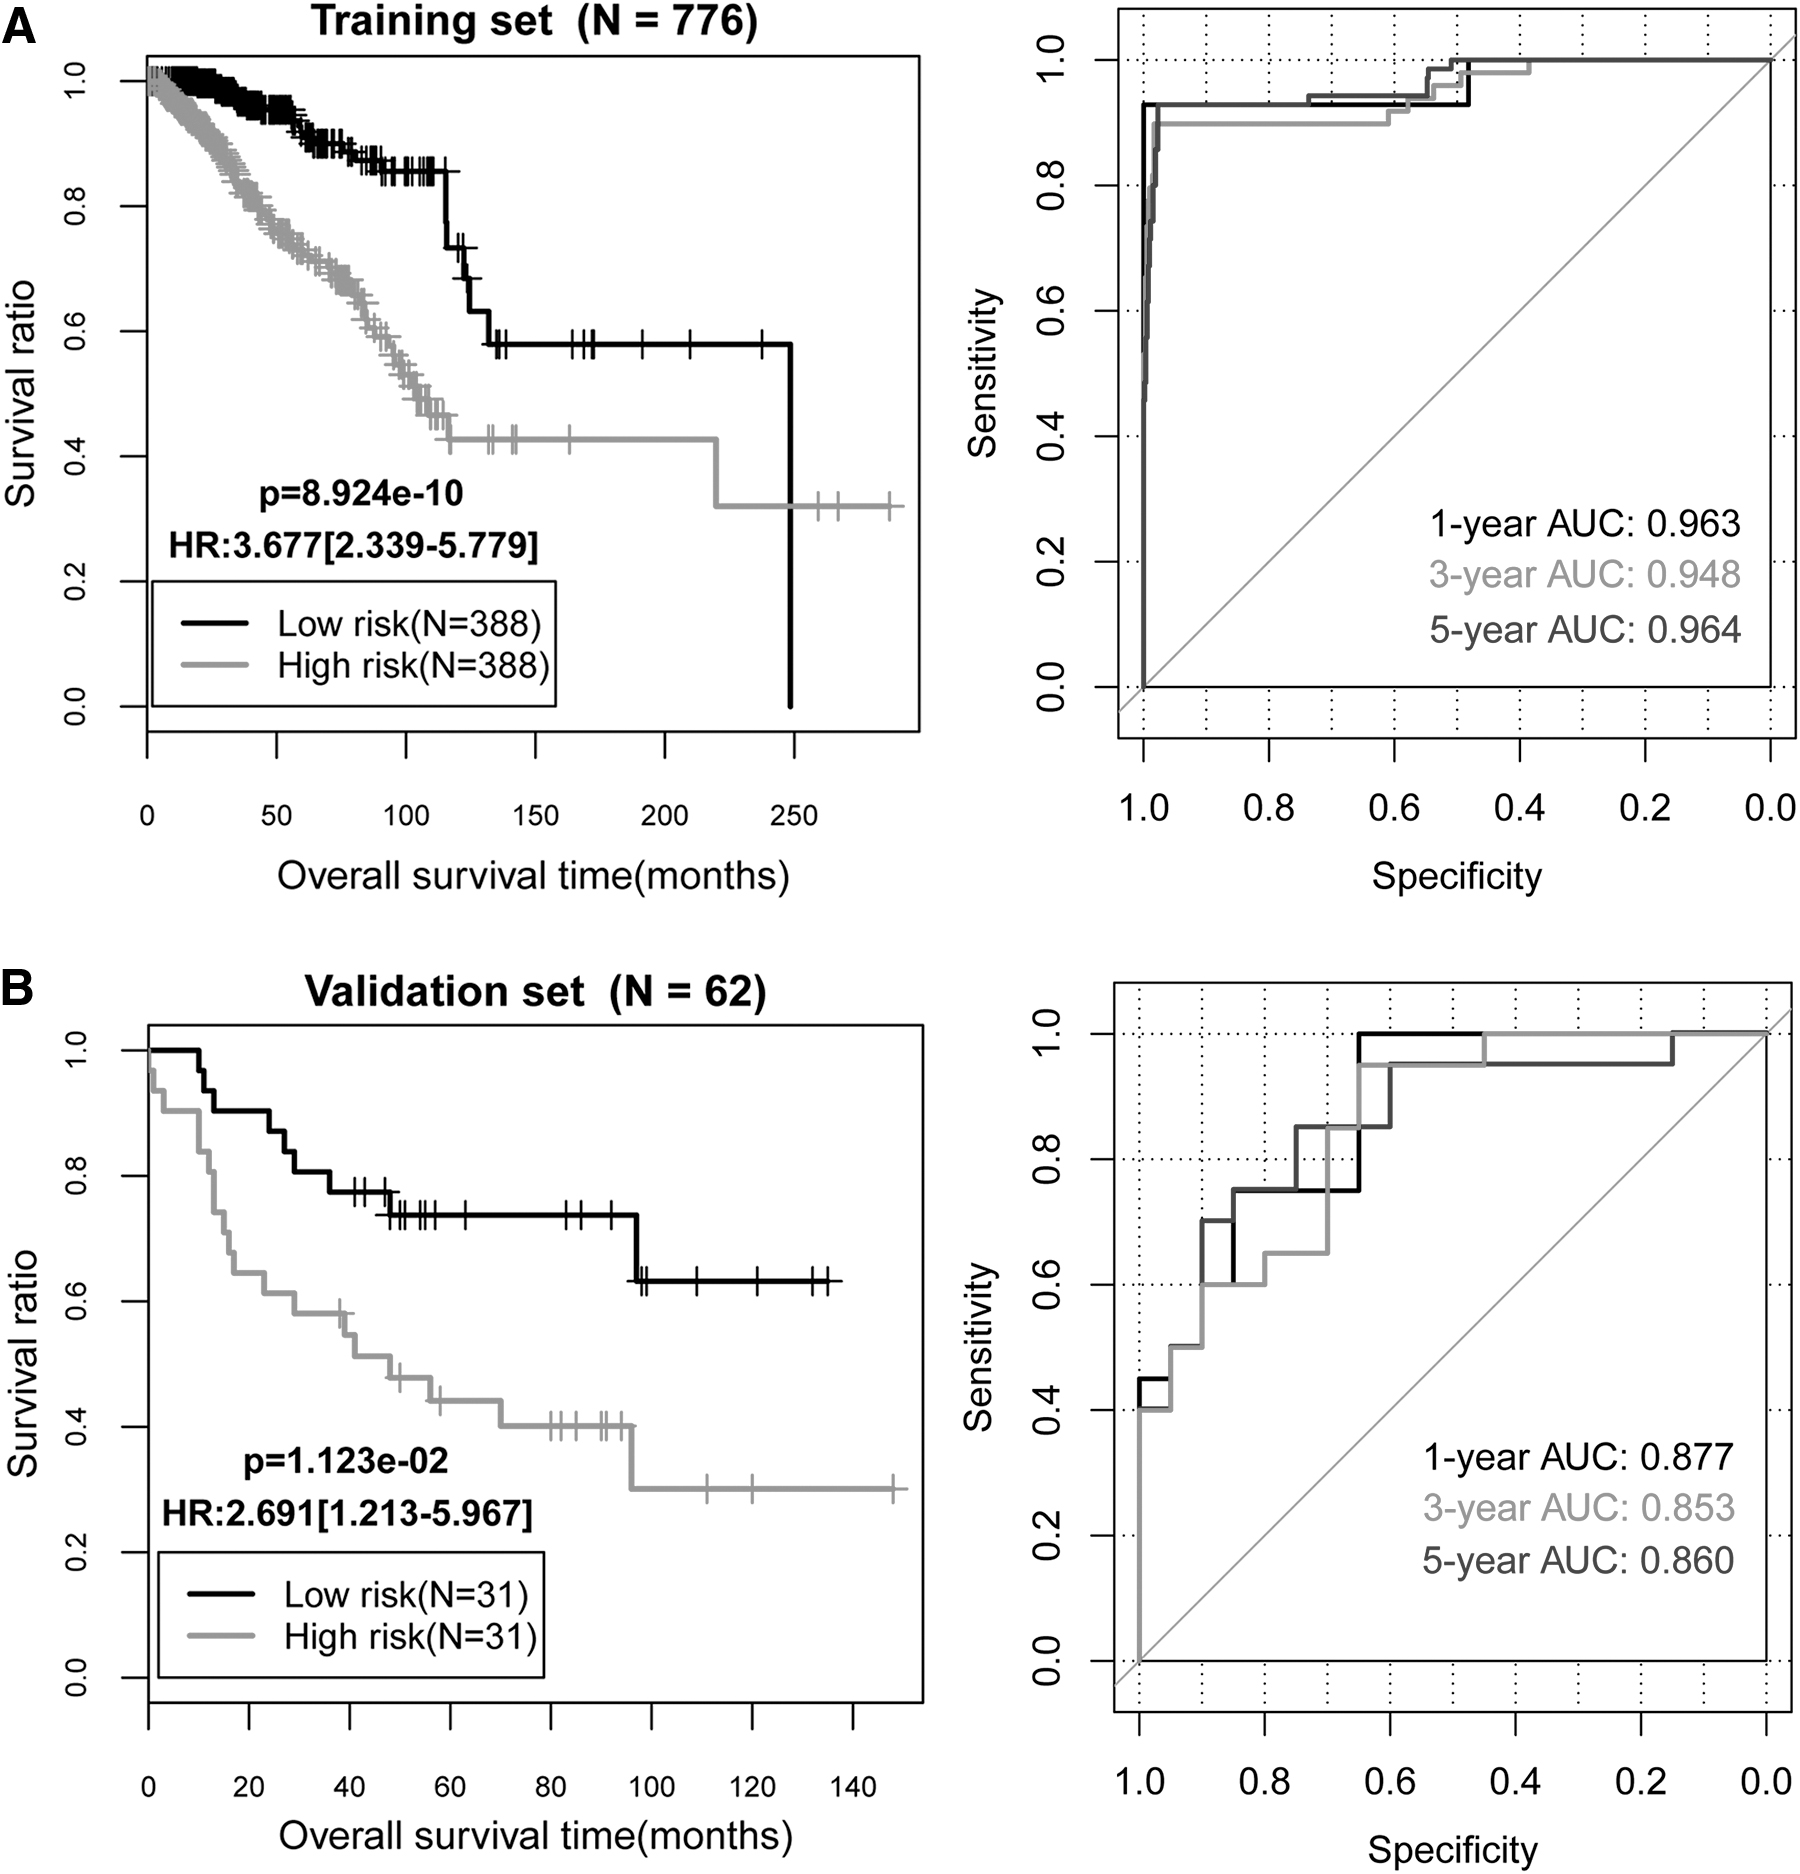
The KM curves and ROC curves.
Construction of nomogram survival model
Based on Cox regression analysis, four independent clinical prognostic factors (including age, radiation therapy, tumor recurrence, and RS model status) in the training set were identified (Table 2). The KM curves for age, tumor recurrence, and radiation therapy are shown in Figure 5. The prognosis of the BC patients with lower age, without tumor recurrence, and receiving radiation therapy was better, which was consistent with the actual situation.
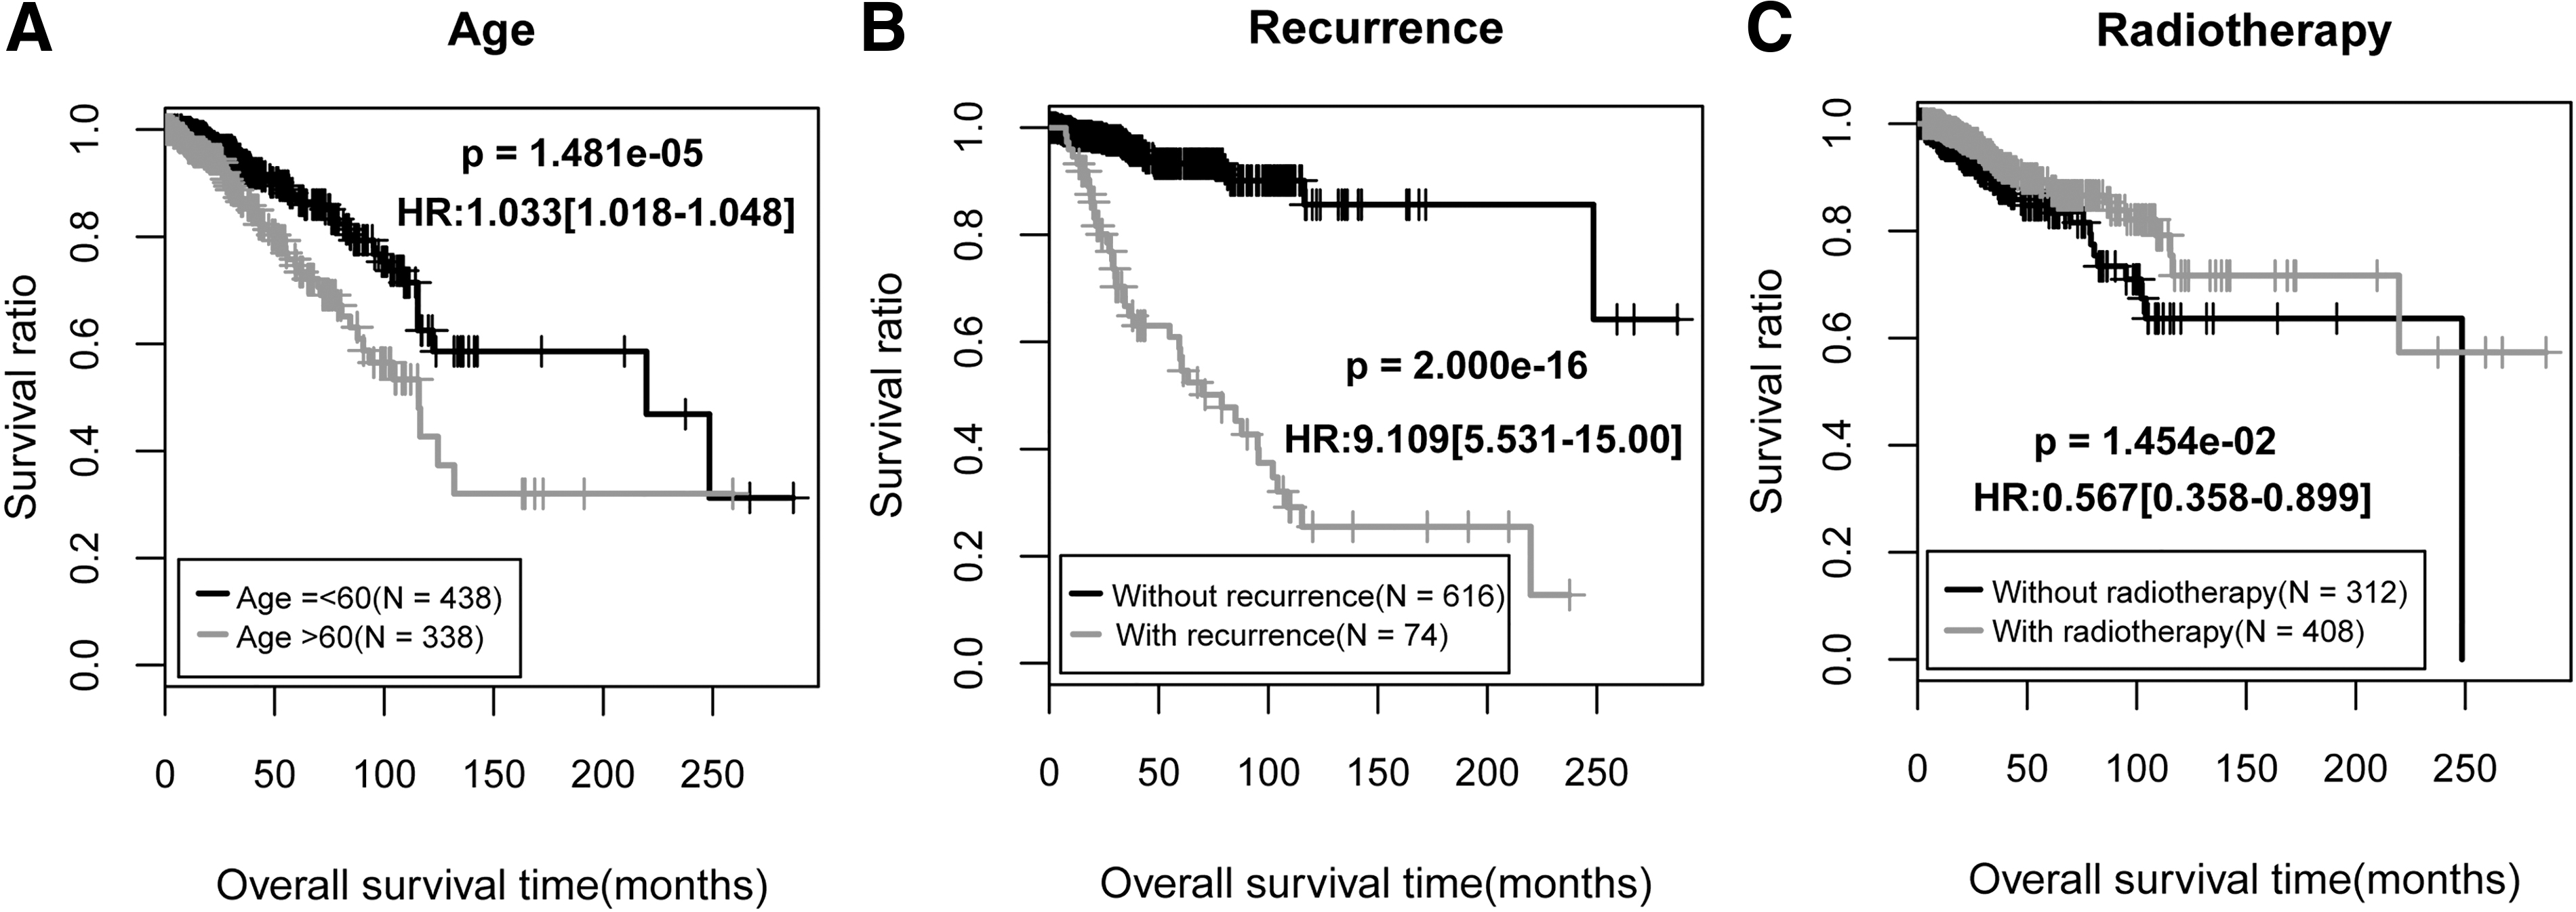
The KM curves.
The Screening Results of Independent Clinical Prognostic Factors
TCGA, The Cancer Genome Atlas; HR, hazard ratio; CI, confidence interval.
Besides, a nomogram survival model was constructed based on the independent clinical prognostic factors (Fig. 6). In the nomogram survival model, the “Total points” axis was used to integrate various clinical indicators to perform survival prediction for the samples. Each independent clinical prognostic factor could be aligned to a point and the total points equal the sum of points of each clinical prognostic factor. The 3-year survival probability and 5-year probability could be predicted based on the total points of each prognostic factor. For example, the total points of a woman 72 years of age (point = 27), did not receive radiation (point = 0), suffered from recurrence (point = 0) and with a RS of 1 (point = 33) is 61. Her 3-year survival probability is around 0.54 and her 5-year survival probability is around 0.37. Furthermore, the predicted 3-year and 5-year survival rates based on the nomogram survival model was compared with the actual survival rates to obtain their consistencies (Fig. 7A). In addition, the efficiencies of the model based on the independent clinical prognostic factors and the model based on both the independent clinical prognostic factors and the optimal DMRs were compared with that of the risk score system. The results showed that the efficiency of the model based on both the independent clinical prognostic factors and the optimal DMRs was the best (AUROC = 0.966, C-index = 0.881) (Fig. 7B).
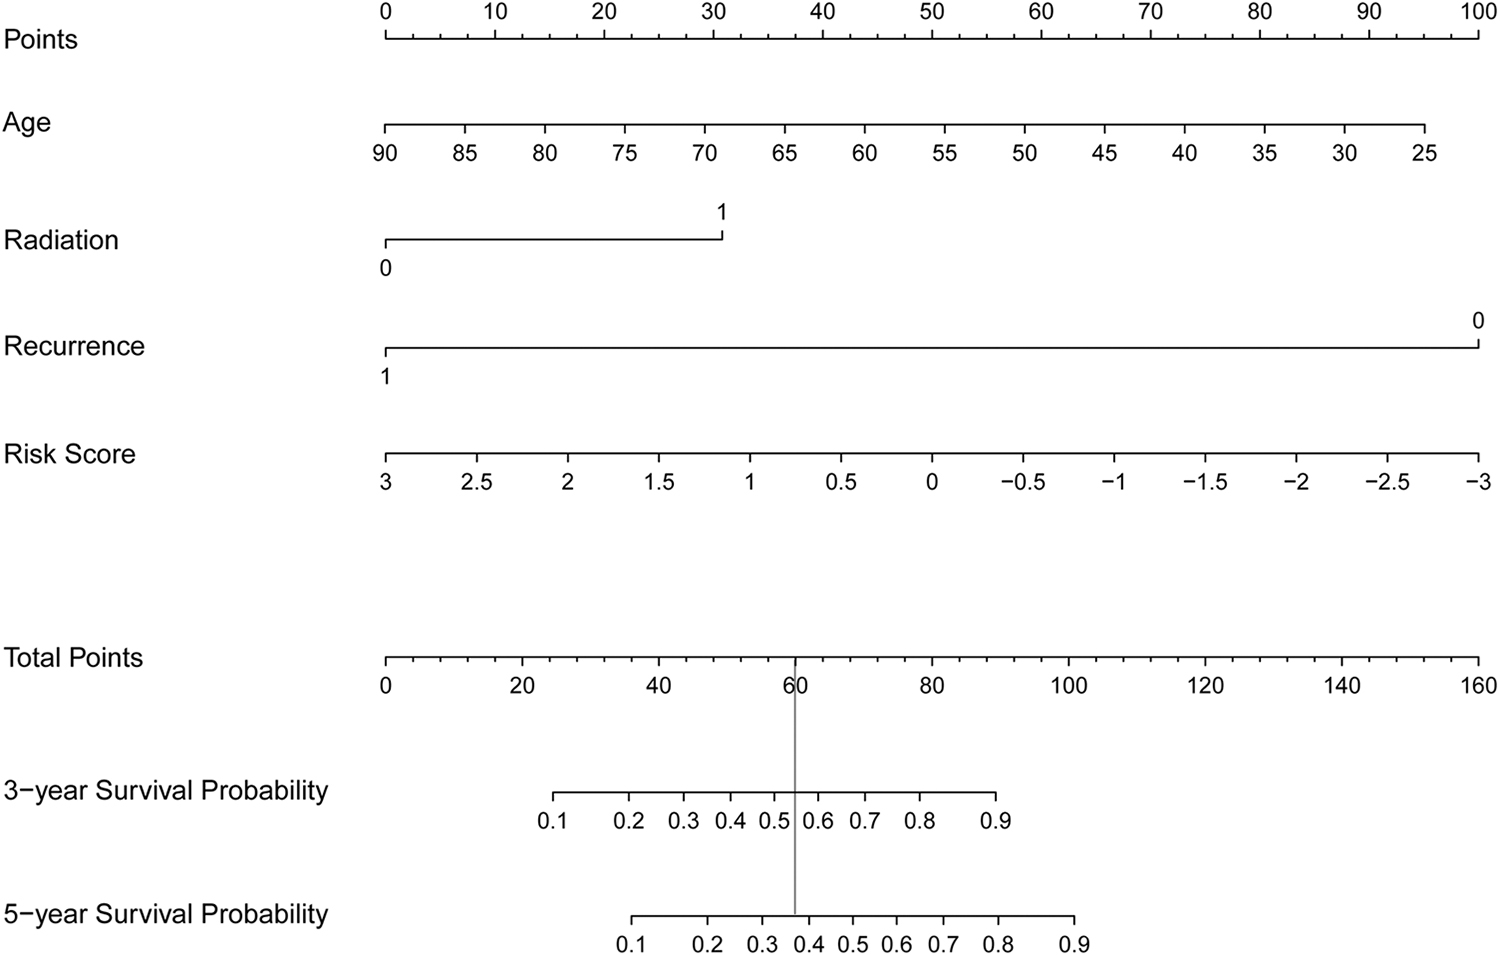
The nomogram survival model based on the independent clinical prognostic factors, including age, radiation therapy, tumor recurrence, and RS model status. Each independent clinical prognostic factor could be aligned to a point and the total points equal the sum of points of each clinical prognostic factor. The 3-year survival probability and 5-year survival probability could be predicted based on the total points. The vertical line illustrates the correspondence between the total points and the survival probability. RS, risk score.
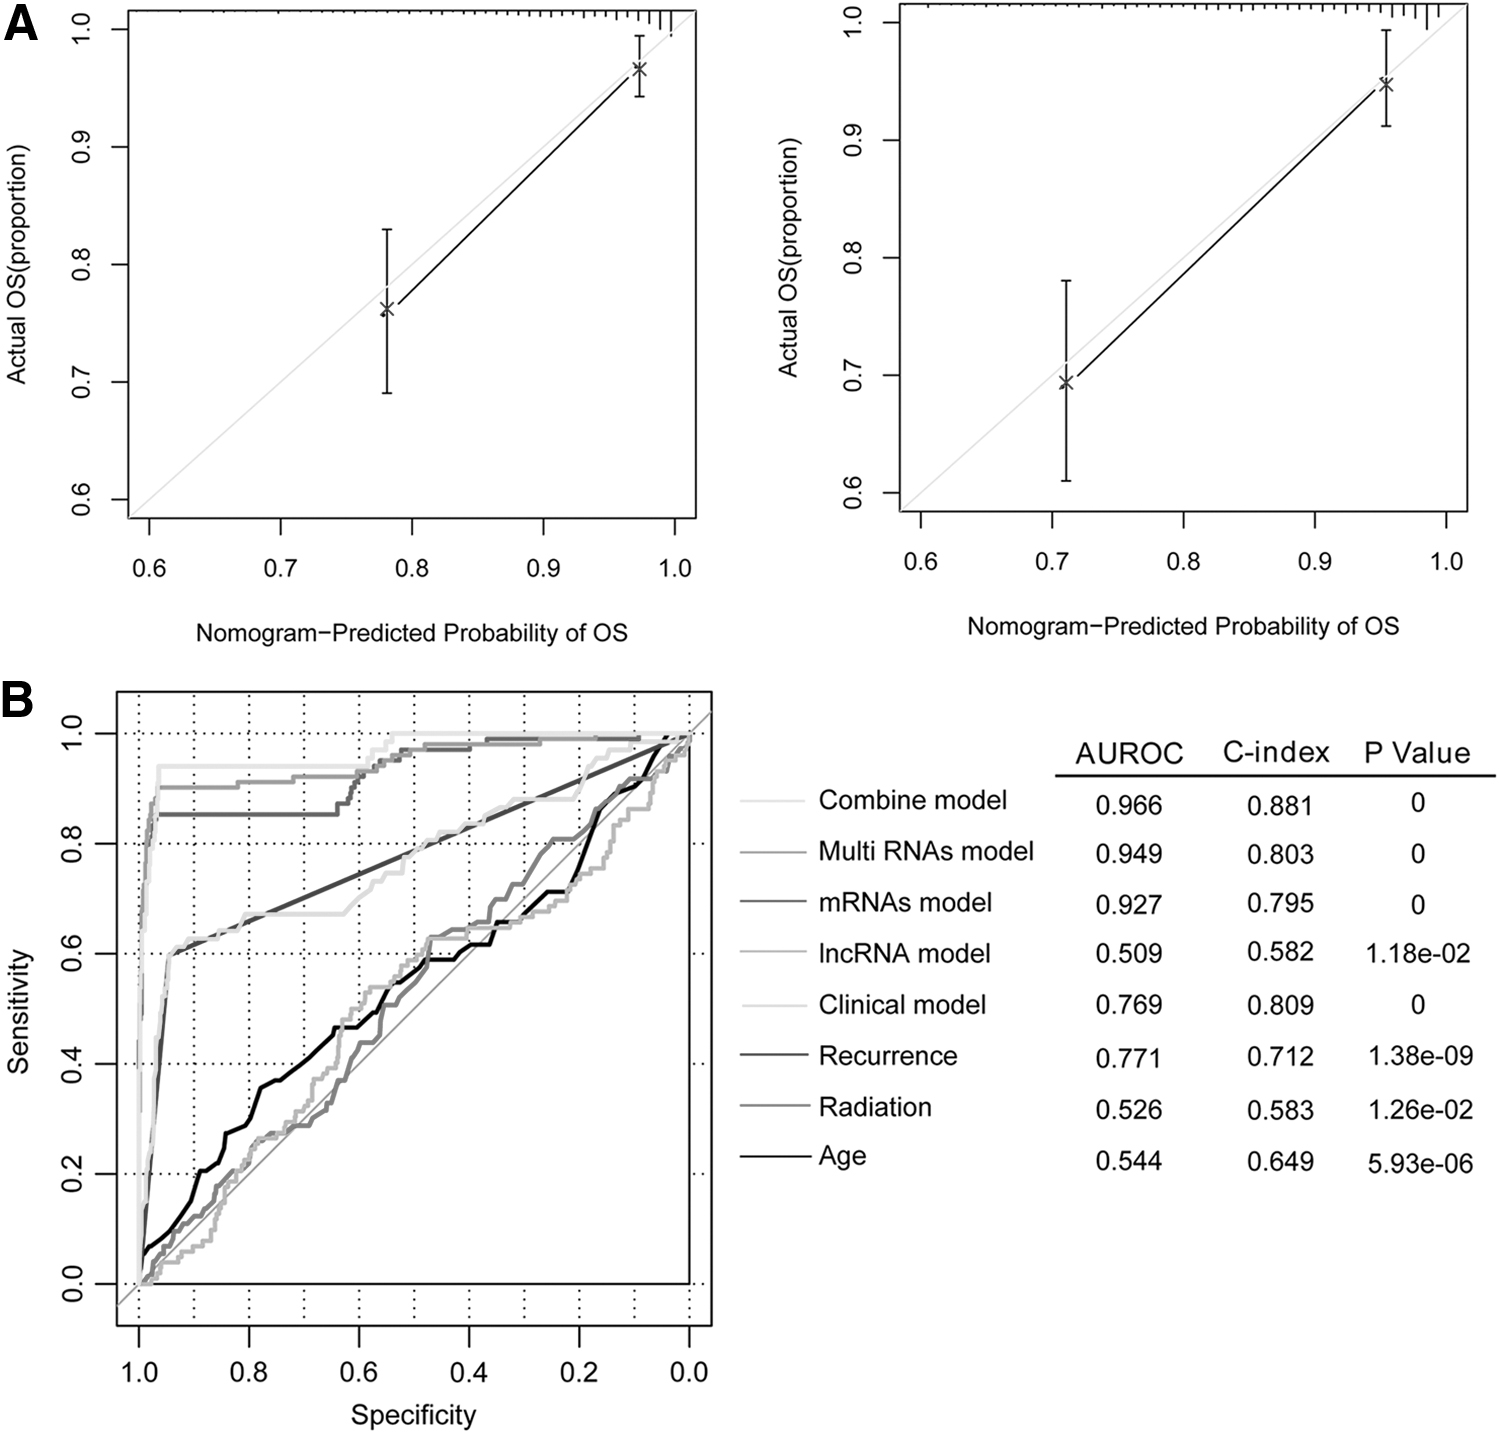
The consistency diagrams of survival rates and the comparison of different kinds of models.
LncRNA-mRNA comethylation network analysis and enrichment analysis
After 157 eligible lncRNA-mRNA pairs were obtained, the lncRNA-mRNA comethylation network (involving 98 nodes and 157 edges) was constructed (Fig. 8). In the network, the lncRNA PRNT was comethylated with FAM19A5 and RBM24. For the mRNAs in the comethylation network, 15 GO_BP terms (such as positive regulation of transcription from RNA polymerase II promoter, p-value = 5.84E-06; adult locomotory behavior, p-value = 6.00E-06; and angiogenesis, p-value = 5.21E-03) and three KEGG pathways (such as neuroactive ligand–receptor interaction, p-value = 3.36E-04; calcium signaling pathway, p-value = 1.12E-02; and pathways in cancer, p-value = 4.21E-02) were enriched (Table 3).
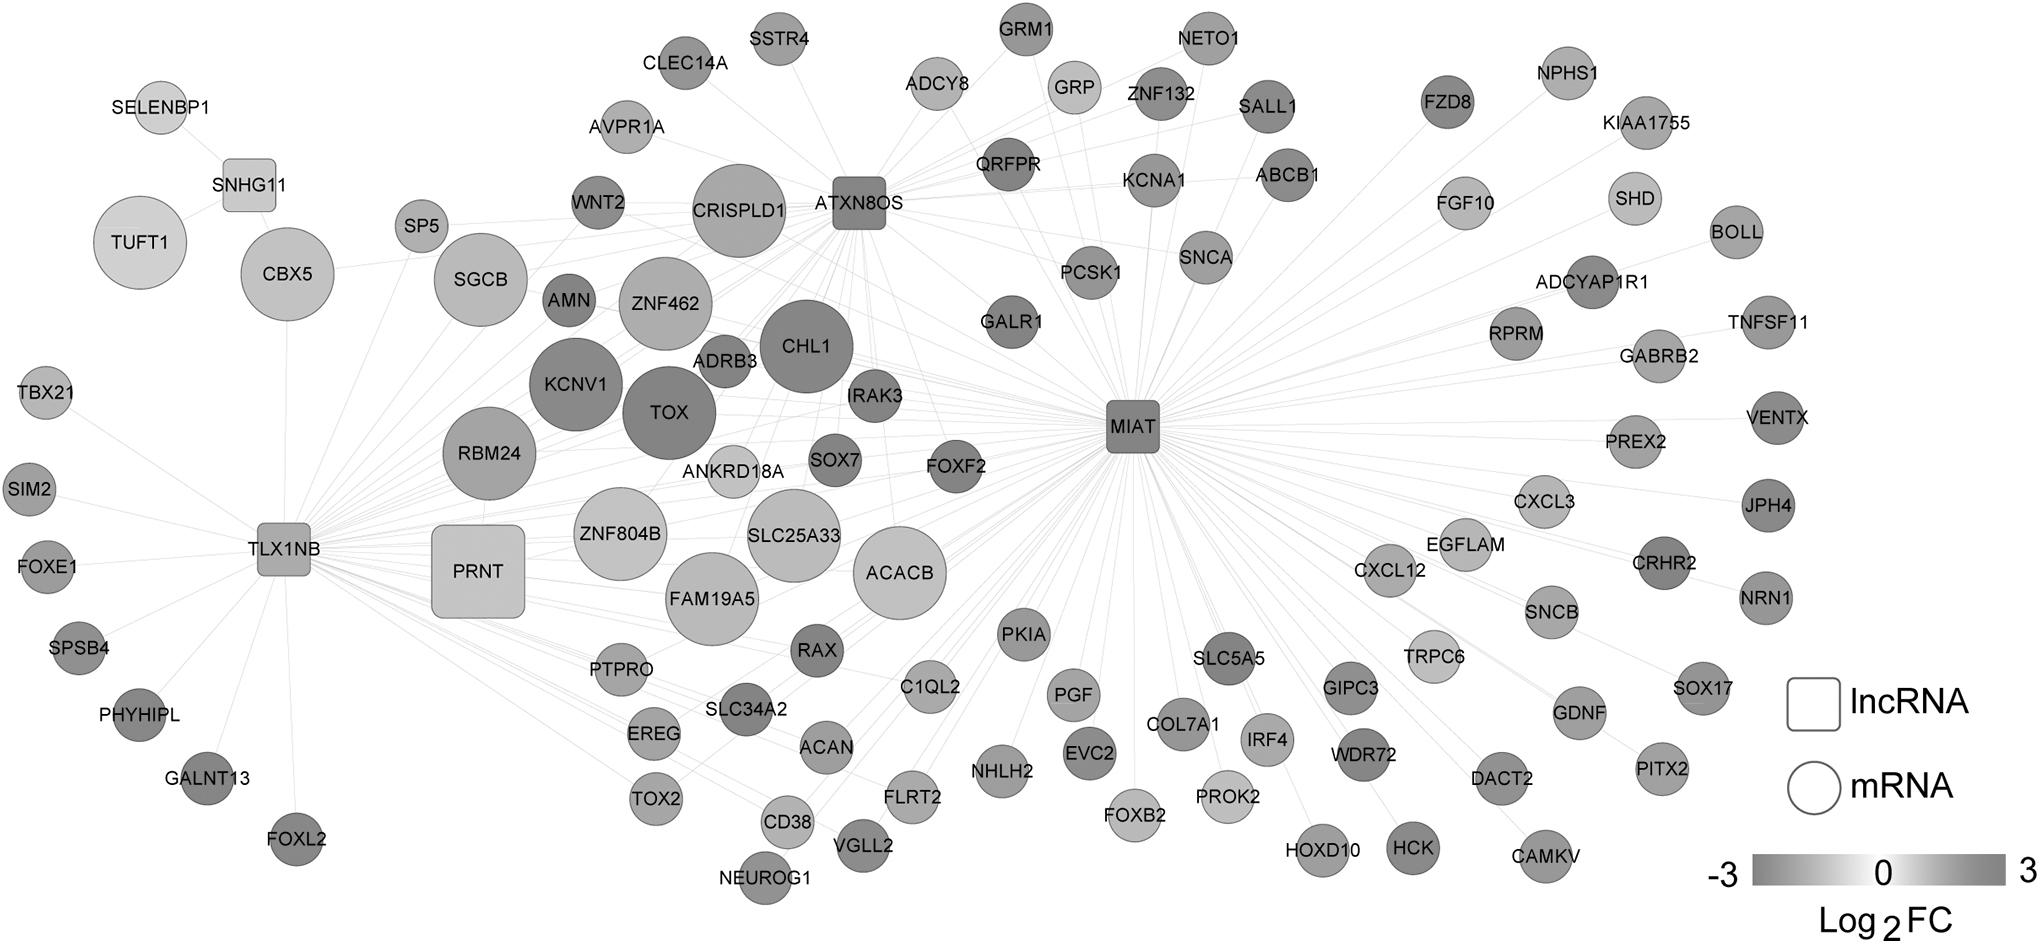
The lncRNA-mRNA comethylation network. Squares and circles represent lncRNAs and mRNAs, respectively. Fold change represents the changes of methylation level. The enlarged nodes represent the optimal RNAs.
The Biological Process Terms and Pathways Enriched for the mRNAs in the Comethylation Network
GO, gene ontology.
Discussion
In this study, 1170 DMGs between BC samples and normal samples were screened, from which 800 DMRs with significant negative PCCs were selected. After the optimal combination involving 15 independent prognosis-associated DMRs (protective RNAs: PRNT, TUFT1, ZNF462, CBX5, SLC25A33, and TOX; risky RNAs: ACACB, GSTM1, FAM19A5, ZNF804B, RBM24, KCNV1, SGCB, CRISPLD1, and CHL1) was identified, the risk score system was built. Based on the four independent clinical prognostic factors (including age, radiation therapy, tumor recurrence, and RS model status), the nomogram survival model was established. Moreover, the efficiency of the model based on both the independent clinical prognostic factors and the optimal DMRs was better. For the mRNAs in the comethylation network, 15 GO_BP terms (such as angiogenesis) and three KEGG pathways (such as pathways in cancer) were enriched. Uncontrolled angiogenesis is implicated in tumor growth, invasion, and metastasis, and mast cells may affect the adjuvant therapy of BC through inhibiting angiogenesis. 26 Thus, angiogenesis and pathways in cancer might be implicated in the prognosis of BC patients.
Although FAM19A5, RBM24, ZNF462, and KCNV1 have not been reported to be correlated with BC, they play roles in other tumors. FAM19A5 is differentially expressed between cholangiocarcinoma (CCA) and benign biliary tract diseases (BBTDs), which may be novel serum marker for distinguishing CCA from BBTDs. 27 Through increasing miR-25 expression, RBM24 functions as a tumor suppressor gene in nasopharyngeal carcinoma. 28 The lncRNA PRNT was comethylated with FAM19A5 and RBM24 in the lncRNA-mRNA comethylation network, indicating that PRNT might act in BC through comethylating with FAM19A5 and RBM24. ZNF462 is a potential target of miR-210 in pancreatic cancer (PC), and miR-210 expression can be promoted by hypoxia through the HIF-1 alpha-dependent pathway in PC cells. 29 KCNV1 is a diagnostic signature for the early screening of bladder cancer, and the methylation of LIM homeobox transcription factor 1 alpha (LMX1A) and ventral anterior homeobox 1 (VAX1) is correlated with the recurrence of the tumor. 30 Therefore, the authors speculated that FAM19A5, RBM24, ZNF462, and KCNV1 might affect the prognosis of BC.
The coexpression of TUFT1 and Rab5 indicates poor outcome in triple-negative breast cancer (TNBC) patients receiving chemotherapy, and the TUFT1/Rab5/Rac1 axis may provide promising targets for the therapy of TNBC. 31,32 CBX5 transcriptional and protein levels are reduced in metastatic BC compared with nonmetastatic BC, and the negative relationship between STET and HP1α coding CBX5 mRNA levels is detected in BC. 33,34 Solute carrier family 25A member 43 (SLC25A43) is found to be a putative tumor suppressor gene in epidermal growth factor receptor 2 (HER2)-positive BC, and its methylation is involved in gene silencing in the absence of loss of heterozygosity. 35 TOX high-mobility group box family member 3 (TOX3) rs3803662 polymorphism has a significant correlation with the BC risk, which can increase the risk of the tumor. 36 These suggested that the protective RNAs, TUFT1, CBX5, SLC25A33, and TOX, might have influences on the prognosis of BC.
ACACB, cyclin B2 (CCNB2), cyclin-dependent kinase 1 (CDK1), mitotic arrest-deficient 2 like 1 (MAD2L1), and peroxisome proliferator-activated receptor gamma (PPARG) are possible diagnosis markers in breast ductal carcinoma, and the complementarity between CDK1 and aminophenazone, rosoxacin, and pomalidomide induces novel pharmacological effects in the tumor. 37 Glutathione S-transferase theta 1 (GSTT1)/GSTM1 double null and GSTM1 null polymorphisms in BC may be related to an enhanced tumor response, whereas the GSTM1 null genotype may be correlated with a decreased overall survival. 38 CHL1 hypermethylation is detected in BC, which is correlated with downregulated CHL1 expression and shorter progression-free survival in the patients with BC. 39 Thus, the risky RNAs ACACB, GSTM1, and CHL1 might be correlated with the prognosis of BC.
Conclusion
In summary, 1170 DMGs between BC samples and normal samples were identified. Besides, the 15 RNA-based risk score system and the nomogram survival model might be valuable for predicting the prognosis of BC patients. Nevertheless, further experiments should be designed and implemented to support these results.
Ethics Approval and Consent to Participate
This study was approved by the Ethics Committee of Beijing Shijitan Hospital, Capital Medical University.
Availability of Data and Materials
Not applicable. This study was only the primary research, and further study has been in progress.
Footnotes
Authors' Contributions
Conception of the research and drafting the article: Y.S. and R.W.; Acquisition of data: Y.S and R.W.; Analysis and interpretation of data: Y.S. and R.W.; Statistical analysis: Y.S. and R.W.; Revision of article for important intellectual content: Y.S. and R.W.
Disclosure Statement
The authors declare that they have no competing interests.
Funding Information
No funding was received for this article.