




Abstract
Background:
As one of the three malignant genital tumors, mortality in women with ovarian cancer is consistently high worldwide. It is of great importance to find prognostic markers for diagnosis and treatment of ovarian cancer. In this study, the authors utilized the bioinformatics analysis to identify the potential key genes to reveal the potential mechanism for ovarian cancer.
Materials and Methods:
The authors used the gene expression profile (GSE14407) to perform differentially expressed gene (DEG) analysis and the weighted gene co-expression network analysis. They selected the key module and performed the gene ontology (GO) annotation and Kyoto Encyclopedia of Genes and Genomes (KEGG) pathway enrichment analysis for the genes in the hub module. Then they screened the key genes in the hub module, and further validated their expression level.
Results:
A total of 3124 DEGs were detected after differential gene expression analysis; of these, 433 were upregulated genes and 2691 were downregulated genes. The authors selected the brown module that is significantly associated with the BRCA gene expression. Then they selected 30 hub genes from the protein-protein interaction network. The authors identified the PDZ binding kinase (PBK) as the prognosis-associated hub gene whose expression was significantly high in the ovarian cancer tissue.
Conclusions:
The bioinformatics analysis for the DEGs could be important to understand the pathogenesis for ovarian cancer. In this study, PBK is identified as a potential marker that might improve the understanding of the molecular mechanism and the diagnosis level for ovarian cancer.
Introduction
Ovarian cancer is a common gynecological tumor that is the fifth leading cause of death among women worldwide. 1 Notably, ovarian cancer is associated with a high mortality rate because patients experience no or nonspecific symptoms during the early stages of the disease, resulting in delayed diagnosis. More than 75% of patients with ovarian cancer are diagnosed at an advanced stage, limiting treatment efficiency. 2,3 Therefore, early screening and diagnosis of patients with ovarian cancer are essential.
At least 5%–10% of ovarian cancer cases exhibit a genetic predisposition to the disease, and most are carriers of breast cancer susceptibility gene (BRCA) 1 or BRCA2 mutations. 4 The risk of developing ovarian cancer varies considerably in women with BRCA1/2 mutations, that is, 39%–58.9% for BRCA1 and 11%–34.5% for BRCA2. Thus, women with BRCA1 mutations have a higher risk of developing ovarian cancer. 5 –7 Meanwhile, previous studies have shown that cancer is caused by combinations of several genes and pathways, and not just by a single gene.
Accordingly, in this study, the authors obtained messenger RNA (mRNA) expression profiles from the Gene Expression Omnibus (GEO) and identified differentially expressed genes (DEGs) in ovarian cancer. Furthermore, they performed construct protein-protein interaction (PPI) networks to identify key module genes for elucidation of novel biomarkers in ovarian cancer.
Materials and Methods
Identification of DEGs from the GEO database
The authors chose the ovarian cancer dataset GSE14407 from the GEO database. GSE14407, which was based on the GPL570 platform (HG-U133_Plus_2; Affymetrix Human Genome U133 Plus 2.0 Array), contained 12 paired normal ovarian epithelia and ovarian cancer samples. They converted probe names to gene symbols according to the Whole Human Genome Microarray 4x44K G4112F (Probe Name Version). However, many probes can correspond to the same gene symbol, so the authors selected the probes with the most significant p-value for the following analysis. Then, they used the limma package in R 8 –10 to identify DEGs in normal ovarian tissues and paired ovarian tumor tissues. Genes that met the following criteria were chosen as DEGs: |log2-fold change| ≥ 1.0 and adjusted p-value <0.05. The research had been approved by Ethics Committee of Shengjing Hospital of China Medical University.
Weighted gene co-expression network construction
Expression data of DEGs (3125 genes) were applied to identify co-expression gene modules that were constructed by weighted gene co-expression network analysis (WGCNA). 11 The authors set the soft threshold power as 14, which was the lowest power based on scale-free topology. 12 A topological overlap matrix (TOM) was calculated by adjacency transformation, and the value (1—TOM) was designated as the distance for identification of hierarchical clustering genes and modules. The minimum module size was set to 100.
Module clinical feature associations
To identify modules that were significantly associated with the designated clinical trait (BRCA1 expression level), the authors selected the module with the most significant p-value form the heatmap of the module/trait relationships for downstream analysis.
Gene ontology and Kyoto Encyclopedia of Genes and Genomes pathway enrichment analyses
The authors used the Database for Annotation, Visualization and Integrated Discovery (DAVID) website to perform the gene ontology (GO) annotation and Kyoto Encyclopedia of Genes and Genomes (KEGG) pathway enrichment analysis for DEGs; results with p-values of <0.05 were considered significant. 13,14 They plotted the results using a bar map for the top 10 significant biological processes, cellular components, and molecular functions using the ggplot2.R package based on the p-value. The top five significant pathways were visualized using the GOplot.R package.
Establishment of a PPI network
The authors used the Search Tool for the Retrieval of Interacting Genes (STRING) to identify key proteins and construct PPI networks. 15 They uploaded the module genes to the STRING database and set the threshold for the interaction score at 0.9 (the highest confidence). In addition, the authors used Cytoscape software to visualize the PPI networks 16 and to analyze key modules by the Molecular Complex Detection (MCODE) function. The k score ≥10 was taken as the criterion to define the key module.
Validation of candidate genes
Hub genes from the MCODE analysis were chosen as potential biomarkers for deep analysis and validation. The authors validate the expression levels of hub genes by the Gene Expression Profiling Interactive Analysis (GEPIA) website (
Oncomine database extraction
The Oncomine database (
Immunostaining
The authors obtained a total of 80 ovarian tissues from Shengjing Hospital of China Medical University from 2014 to 2016. The corresponding clinical data were uploaded in the Supplementary Table S1. All tissues were embedded in paraffin for use. Written informed consent was obtained from all participants. This study was approved by the local ethics committee of China Medical University. All pathological sections were assessed by pathologists and yielded a clear diagnosis. Patients who were diagnosed with ovarian cancer had never received any therapies before, including chemotherapy, radiotherapy, targeted therapy, or surgical therapy. The patients were divided into two groups, including malignant tumor group (n = 40) and normal ovary group (n = 40). No significant difference was observed in age between these groups (p > 0.05). The ovarian tissue paraffin blocks were processed into 2.5 μm slices for immunostaining. The experiment was performed using the streptavidin–peroxidase method. They finally performed the semiquantitative analysis using Image Pro-Plus.
Bioinformatics analysis
Ovarian cancer methylation data were downloaded from Xena (
Results
Identification of DEGs
In the study, the authors carried out DEG analysis of normal ovarian tissues and paired ovarian tumor tissues from the GSE14407 dataset. They identified upregulated and downregulated genes between the two sample types and found a total of 3124 genes that met the cutoff criteria (433 upregulated genes and 2691 downregulated genes) (Fig. 1B). The DEG heatmap is shown in Figure 1A.

DEGs form the dataset GSE14407.
Weighted gene co-expression network analysis
The expression values of 3124 DEGs from the 12 paired normal and cancer tissues were used to construct the co-expression module using the WGCNA tool. One of the most important steps was choosing the appropriate soft-threshold power that affected the independence and average connectivity of gene co-expression modules. When the power value was selected as 14, the independence was equal to 0.8, and the average connectivity degree of modules was higher (Fig. 2A). As shown in Figure 2B, a power value of 14 was selected to produce different co-expression modules.
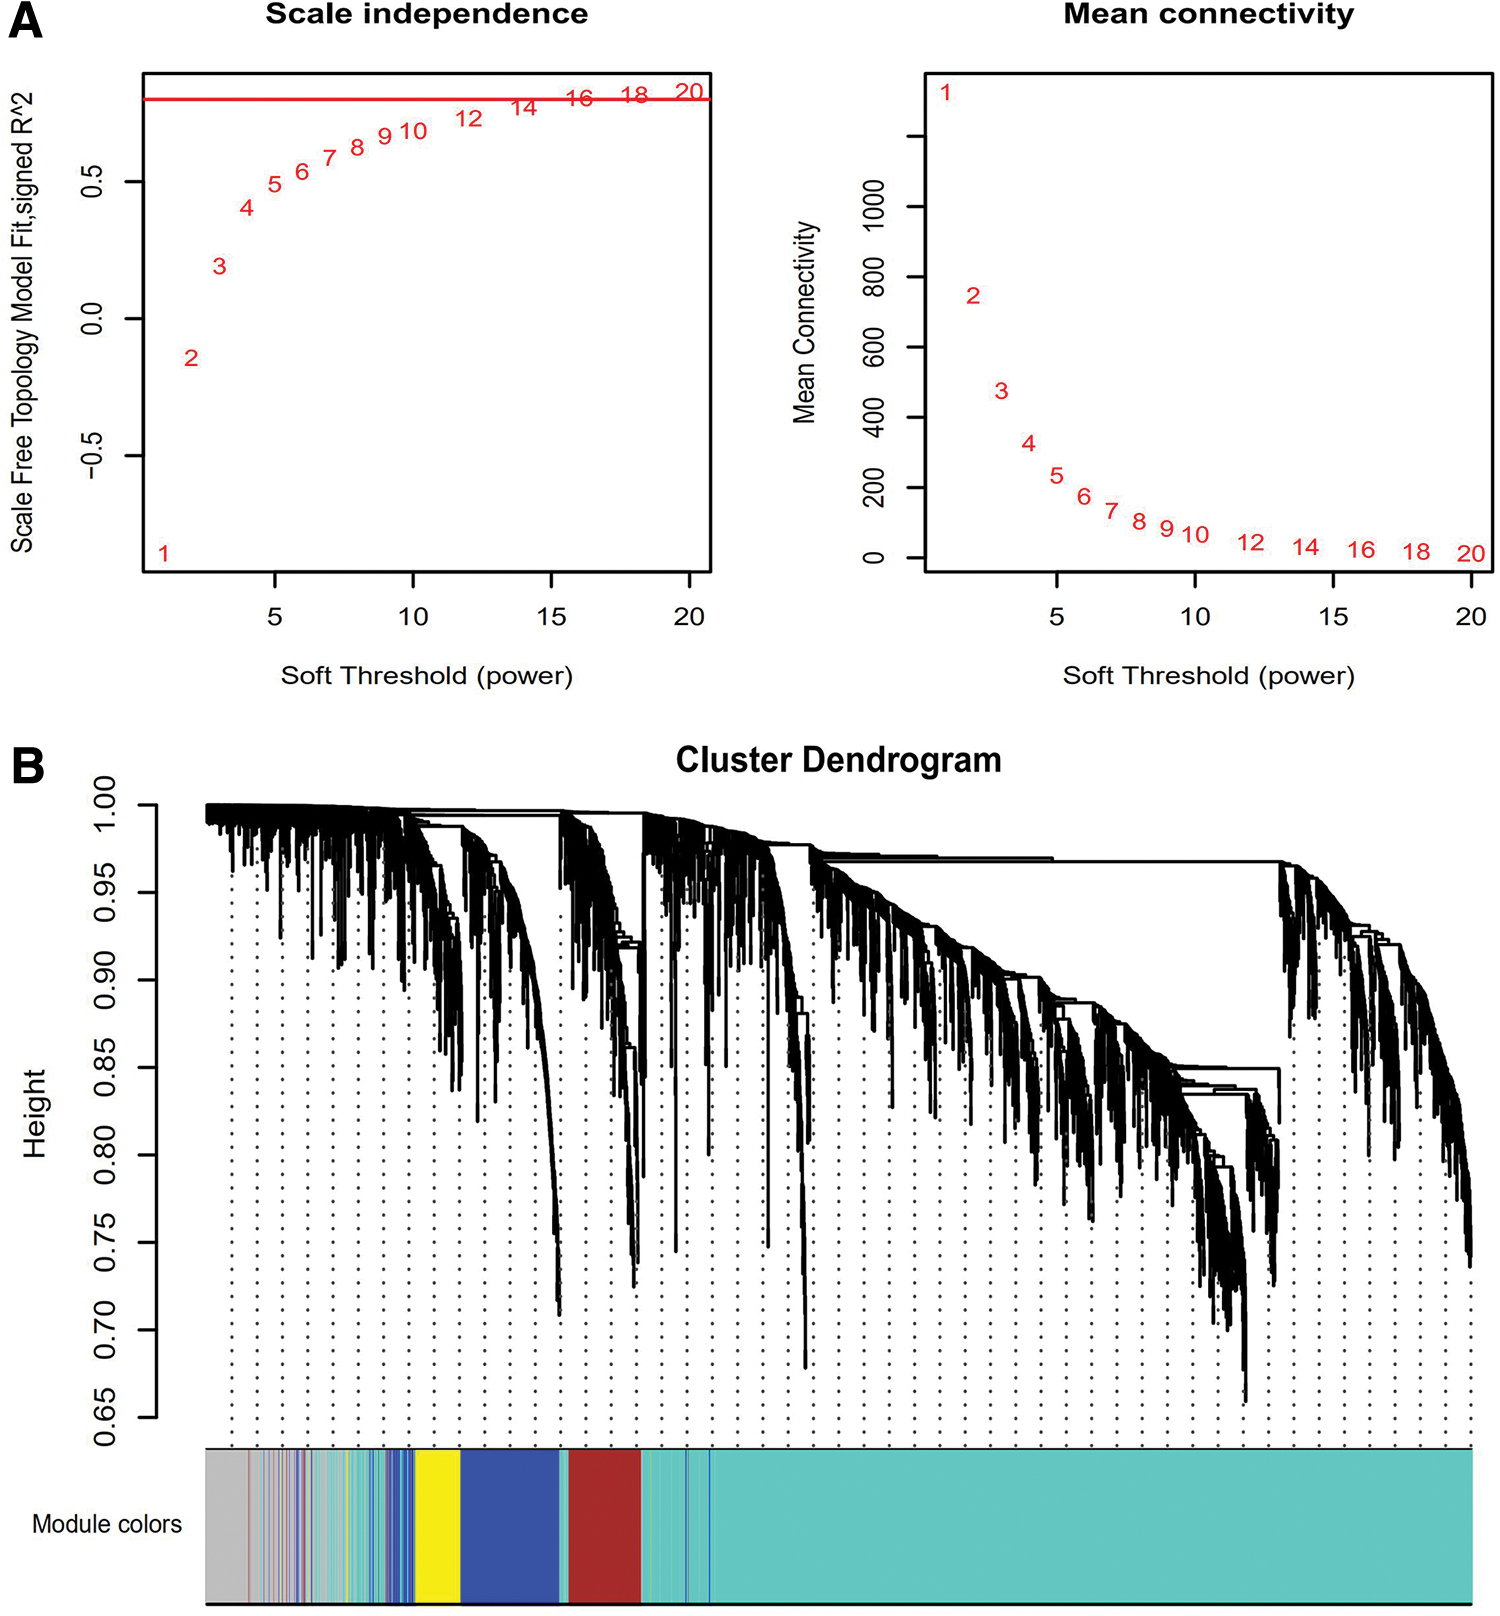
The clustering of samples and selection of soft-thresholding power.
Modules corresponding to clinical traits
The authors identified the co-expression modules with the most significant associations based on correlations between the module eigengene and clinical traits (e.g., BRCA1 expression level). The result indicated that the brown module (183 genes) was the most positively associated with BRCA1 expression level (Fig. 3A). In addition, they found that the brown modules and BRCA1 expression level were highly related according to the results of hierarchical clustering of eigengenes and the heatmap plot of eigengene adjacencies for the expression of BRCA1 (Fig. 3B). Scatter plot analysis of gene significance versus module membership is shown for the brown modules in Figure 3C.

Heatmap of module-trait relationships.
GO and KEGG pathway enrichment analysis
To improve their understanding of the brown module genes involved in the molecular mechanisms of ovarian cancer, the authors carried out GO annotation and KEGG pathway enrichment analysis. GO analysis revealed that the module genes were enriched in biological processes, including GO:1903047 (mitotic cell cycle process), GO:0000278 (mitotic cell cycle), GO:0022402 (cell cycle process), GO:0007059 (chromosome segregation), and GO:0051301 (cell division), as shown in Figure 4A. The module genes were enriched in cellular components, including GO:0005819 (spindle), GO:0000779 (condensed chromosome, centromeric region), GO:0000775 (chromosome, centromeric region), GO:0000777 (condensed chromosome kinetochore), and GO:0000776 (kinetochore), as shown in Figure 4B. The modules genes were also enriched in molecular functions, including GO:0008017 (microtubule binding), GO:0097367 (carbohydrate derivative binding), GO:0015631 (tubulin binding), GO:0035639 (purine ribonucleoside triphosphate binding), and GO:0032550 (purine ribonucleoside binding), as shown in Figure 4C. For pathway enrichment analysis, the module genes were enriched for genes involved in the cell cycle and p53 signaling pathway (Fig. 4D).
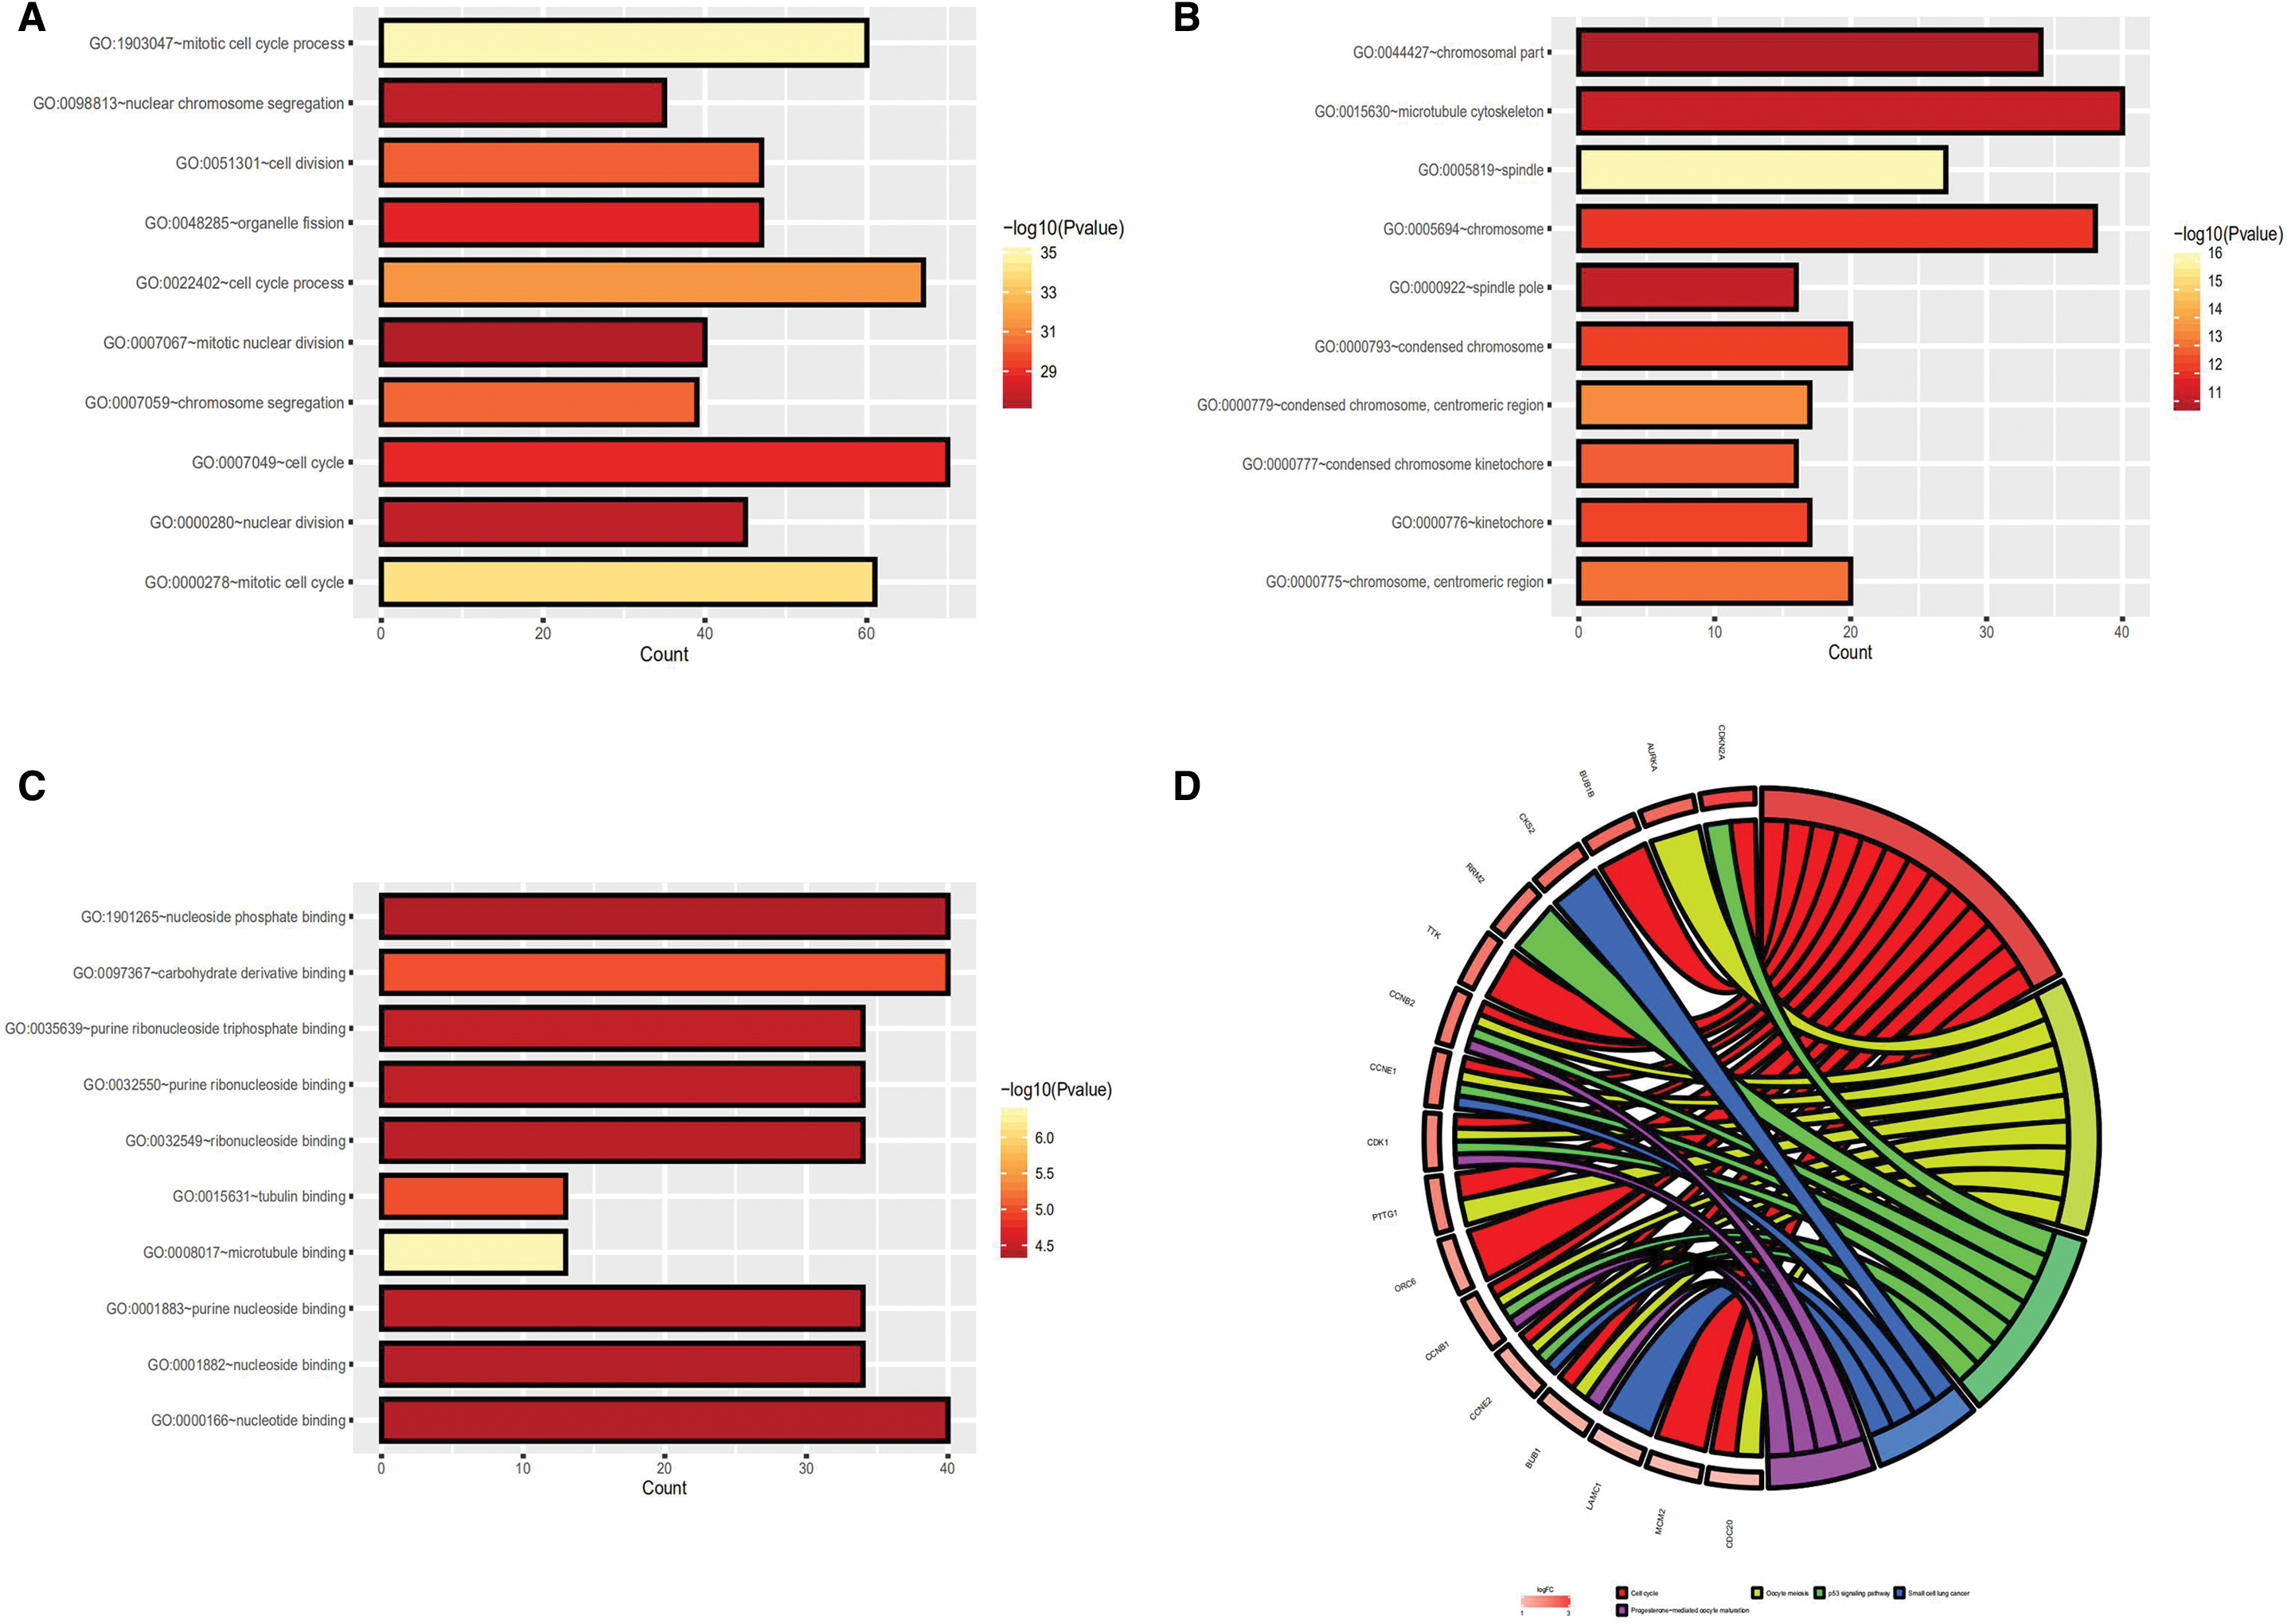
The plot of GO function and KEGG pathway enrichment.
PPI network construction
After PPI network construction, the authors found that the network (score >0.900) had 88 nodes and 721 edges (Supplementary Fig. S1A). The most significant module consisted of 30 nodes and 398 edges (Supplementary Fig. S1B). This result suggested that the identified 30 hub genes could play critical roles in ovarian cancer.
Validation of hub genes
To validate the gene expression levels of a large number of samples to assess whether gene expression was concordant between samples from the GSE14407 and OV (TCGA/GTEx) datasets, the authors uploaded genes in the module to the GEPIA website. They found that the expression levels of 28 of 30 genes in the OV dataset (from TGCA/GTEx) were consistent with gene expression changes in the GSE14407 dataset. The gene expression plots of these genes are shown in Supplementary Table S2. The authors then further explored whether these genes were involved in overall survival; the survival prognosis forest map is shown in Figure 5.
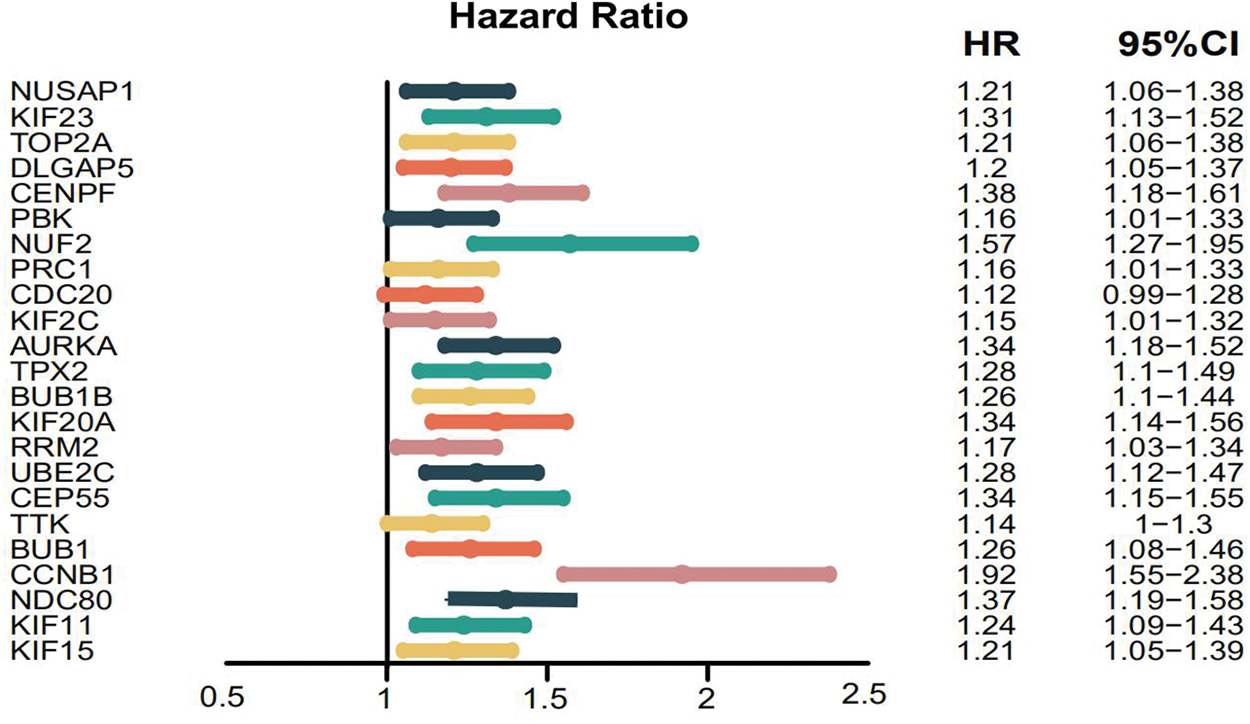
Survival prognosis forest map of hub genes. Each point indicates the hazard ratio of the gene. The line on both sides of the point indicates a 95% confidence interval, and the line in the middle of the abscissa represents hazard ratio = 1. Color images are available online.
Analysis of the PBK gene in the Oncomine
In this study, Oncomine analysis revealed that PBK expression was significantly different in 66 tumor studies (upregulated in 55 studies and downregulated in 11 studies) (Fig. 6A). In addition, the authors further showed that PBK expression was upregulated in all ovarian cancer samples (Fig. 6B–D).

Expression of PBK in Oncomine database.
PBK expression in ovarian cancer tissue based on immunostaining
The authors validated 40 pairs of OV tissues and corresponding normal ovarian tissues by immunohistochemistry. PBK staining was localized in the nuclei of OV cells, and representative immunochemistry staining is illustrated in Figure 7A and B. The results of semiquantitative analysis revealed that the expression of PBK in ovarian cancer tissues was significantly increased than that in normal ovarian tissues (Fig. 7C, p < 0.01).

Representative images of immunostaining for PBK expression in OV tissues and normal ovary tissues.
Molecular mechanisms of PBK expression in ovarian cancer
The methylation data were downloaded from Xena (
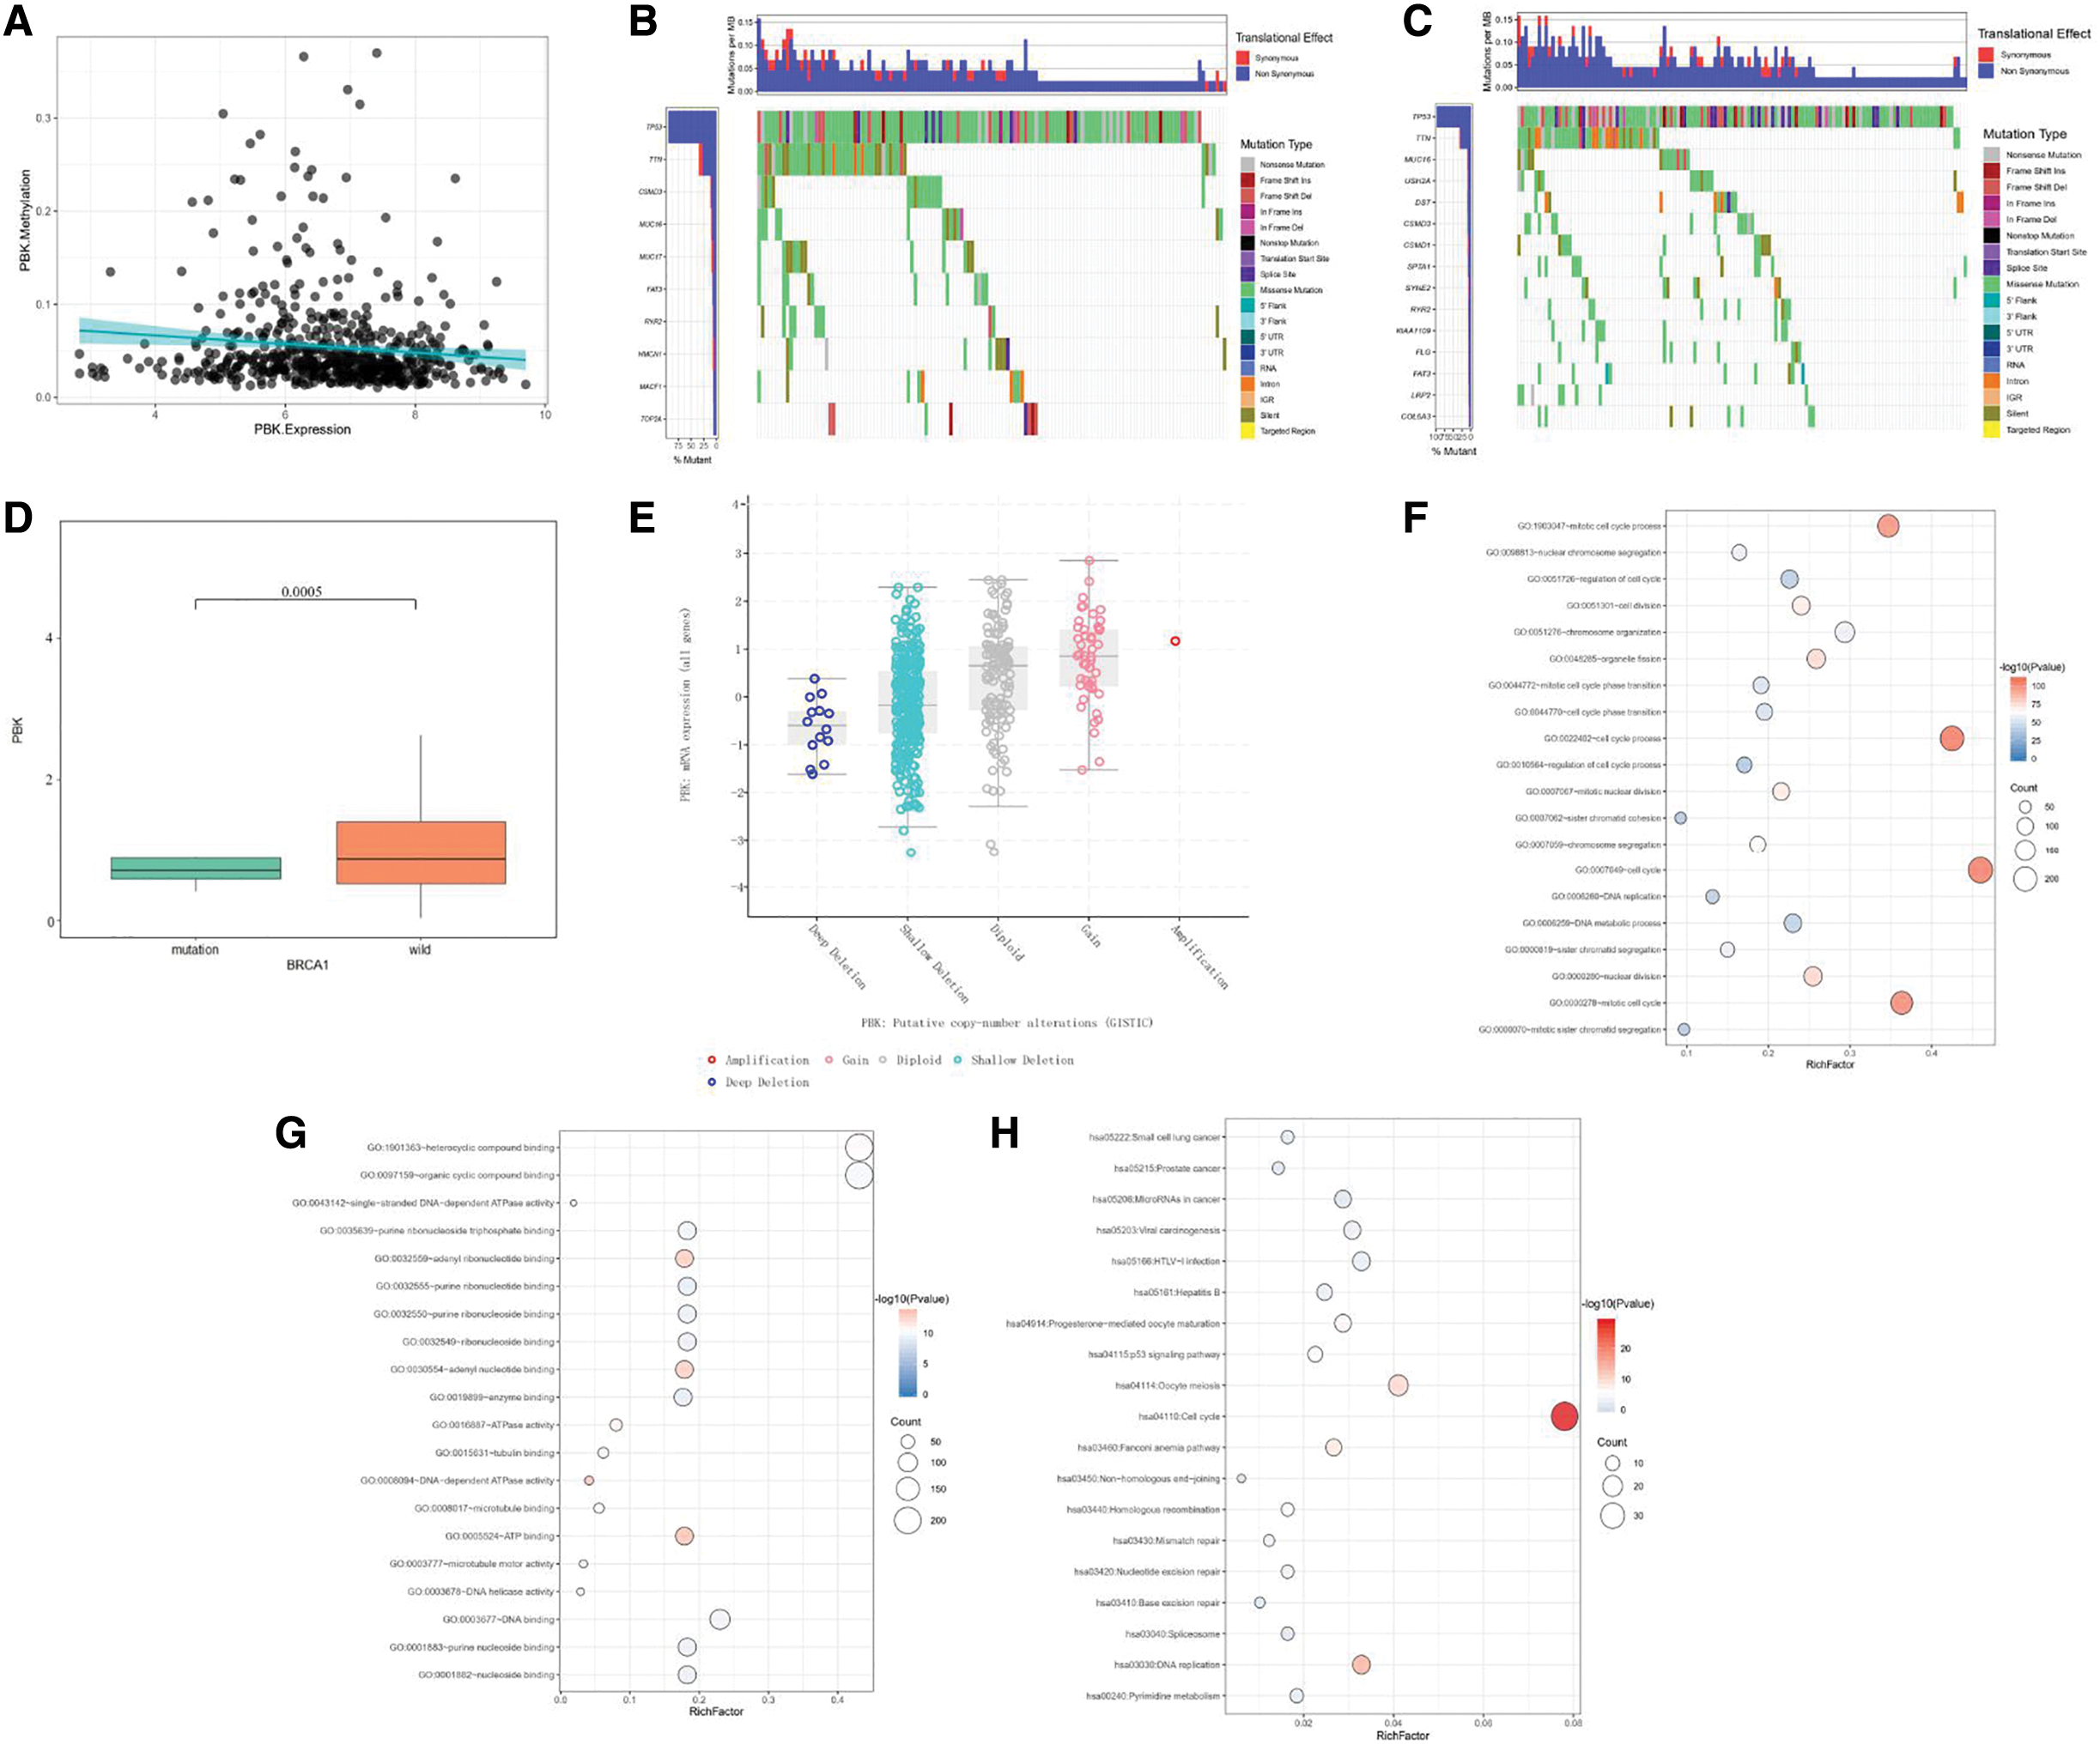
The molecular mechanisms of PBK in ovarian cancer.
Discussion
Despite advances in medical technology in recent years, the mortality rate of patients with ovarian cancer has not significantly changed, and ovarian cancer remains the leading cause of gynecological tumor-related deaths. Because ovarian cancer tends to metastasize and exhibits tumor heterogeneity, most patients are diagnosed only at an advanced stage. Therefore, identification of more reliable biomarkers and exploration of the underlying molecular mechanisms of ovarian cancer will improve the overall survival rate and prognosis of patients with ovarian cancer.
BRCA1 is a tumor-suppressor gene that contributes to DNA repair and transcriptional regulation in response to DNA damage. Carriers with mutations in the BRCA1 gene are at high risk of breast cancer, ovarian cancer, pancreatic cancer, and prostatic cancer. 19 The specific mechanism that mutations in BRCA1 can result in increased susceptibility to ovarian cancer is still unclear, although it is expected that many genes may play important roles in this process.
In this study, the authors identified 3124 DEGs between normal tissues and ovarian cancer tissues and showed that the genes in modules identified by WGCNA were involved in specific biological process, cellular components, and molecular functions. Further pathway enrichment analysis showed that the module genes were enriched in cell cycle and the p53 signaling pathway. From the results of enrichment analysis, they found that these genes were involved in regulating the biological behaviors of ovarian cancer cells and affected the occurrence and development of ovarian cancer.
To further find key genes that played important roles in the occurrence and development of ovarian cancer, the authors constructed PPI networks and screened the key networks. From this analysis, they identified PBK as contributing to the overall survival in patients with ovarian cancer. PBK is a serine-threonine kinase that regulates cell cycle-related processes, including cell growth, immune responses, and DNA damage repair, and can accelerate tumorigenesis in various types of cancer, including gastric cancer, oral cancer, prostate cancer, and cervical cancer. 19 Subsequent analysis showed that PBK was strongly associated with ovarian cancer and that the expression of PBK in ovarian cancer tissues was significantly higher than that in normal tissues. Overall, these findings indicated that PBK may contribute to clinical prognosis in patients with ovarian cancer.
PBK has been studied as a potential biomarker in various types of cancers, including gastric cancer, colorectal cancer, lung adenocarcinoma, hepatocellular carcinoma, and breast cancer. Overexpression of PBK protein is frequently detected in gastric cell lines and primary gastric tumor samples and is related to gastric tumor occurrence, metastasis, and invasion. Ohashi et al. found that knockdown of PBK in PBK-overexpressing gastric cell lines inhibits cell proliferation by activating p53 in a TP53 mutation-dependent manner and inhibits cell migration/invasion by upregulating phosphatase and tensin homolog (PTEN) in a TP53 mutation-independent manner. 20 In addition, Su et al. found that the 5-year survival rate was higher in patients with high PBK expression than in patients with low PBK expression in a study of colorectal cancer. 21 Lei et al. also reported that PBK overexpression affected the survival times of patients with lung adenocarcinoma, 22 and Shih et al. found that PBK promoted cell migration by activating the phosphatidylinositol 3-kinase/PTEN/AKT signaling pathway in lung cancer. 23 Moreover, Yang et al. showed that PBK can be a potential diagnostic biomarker and therapeutic target for patients with hepatocellular carcinoma and can promote cell migration and invasion by activating the ETV4-uPAR signaling pathway. 24 Finally, Park et al. found that PBK acted as a cancer/testis antigen with oncogenic activity in breast cancer. 25
To further explore the molecular mechanisms underlying the action of PBK in ovarian cancer, the authors analyzed somatic cell mutation data and found that TP53, CSMD3, and TTN mutations were significantly enriched in both high and low expression groups. Also, the expression levels of PBK were found to be positively associated with copy number variations, suggesting that samples with copy number amplification may have high PBK expression. DNA methylation is a critical type of DNA modification occurring at the epigenetic level and is modulated by DNA methyltransferases. 26 During cancer development, abnormal methylation often occurs, resulting in abnormal expression of multiple key genes. 27 In this study, hypomethylation of PBK resulted in higher expression of PBK and could be related to poor prognosis in patients with ovarian cancer, suggesting that PBK may act as a biomarker and therapeutic target in ovarian cancer. To identify the molecular function of PBK expression in ovarian cancer, the first 500 genes significantly associated with PBK were selected from the cBioportal database for further analysis. The GO function analysis indicated that these genes were involved in cell cycle process, nuclear division, DNA metabolic process, and DNA replication. The molecular functions of these genes were mainly associated with ATP binding, DNA-dependent ATPase activity, and DNA binding. The pathways analysis was related to the p53 signaling pathway, small cell lung cancer, and prostate cancer. However, further studies are necessary to fully elucidate the molecular functions of PBK in ovarian cancer.
Conclusions
In summary, the authors used DEG analysis and WGCNA to identify key module genes closely associated with clinical traits (e.g., BRCA1 expression). Further analysis showed that the PBK gene was associated with prognosis in patients with ovarian cancer. Bioinformatics analysis was used to elucidate the potential molecular mechanisms through which PBK contributed to ovarian cancer. In the future, more in-depth studies are needed to confirm association between PBK expression and ovarian cancer.
Footnotes
Acknowledgment
Thanks to Bin Zhao (Official Wechat Account: SCIPhD) of Xiamen University for suggestions on the article.
Authors' Contributions
S.Y., Ca.L., and Y.L. conceived and designed the study. Ch.L. wrote the article.
Disclosure Statement
The authors have declared no actual or potential conflicts of interests.
Funding Information
This study was supported by the National Key Research Program (2018YFC1002900).
Supplementary Material
Supplementary Table S1
Supplementary Table S2
Supplementary Figure S1
References
Supplementary Material
Please find the following supplemental material available below.
For Open Access articles published under a Creative Commons License, all supplemental material carries the same license as the article it is associated with.
For non-Open Access articles published, all supplemental material carries a non-exclusive license, and permission requests for re-use of supplemental material or any part of supplemental material shall be sent directly to the copyright owner as specified in the copyright notice associated with the article.
