
Abstract
Background:
Laryngeal squamous cell carcinoma (LSCC) has poor prognosis, and the mechanism underlying the pathogenesis of LSCC remains unclear. Recently, a study has shown that long nonprotein coding RNA ferritin heavy chain 1 pseudogene 3 (FTH1P3) plays a crucial role in tumor pathogenesis. This study explored the potential role of FTH1P3 in LSCC.
Materials and Methods:
The expression of E2F1 and FTH1P3 in LSCC was analyzed by quantitative real time-polymerase chain reaction assay. The direct targets of FTH1P3 and miR-377-3p were predicted, followed by functional validation. The functional role of FTH1P3 was investigated in AMC-HN-8 and TU686 cells using 3-(4,5-dimethylthiazol-2-yl)-2,5-diphenyltetrazolium bromide assays and the measurement of glucose uptake and L-lactate production.
Results:
The results showed that overexpression of FTH1P3 promoted cell viability and glycolysis in LSCC cells, but knockdown of FTH1P3 suppressed this behavior. Upregulated FTH1P3 was associated with increased E2F1 expression in LSCC patients. E2F1 was proved to induce FTH1P3 expression in LSCC cells. FTH1P3 modulated miR-377-3p expression by targeting miR-377-3p. Interestingly, LDHA was identified to be a target of miR-377-3p, and FTH1P3 promoted LDHA expression by suppressing miR-377-3p. In addition, knockdown of FTH1P3 mitigated E2F1-induced cell viability and glycolysis through miR-377-3p/LDHA in AMC-HN-8 cells. More importantly, knockdown of E2F1 inhibited tumor growth and FTH1P3 expression in vivo.
Conclusion:
In conclusion, these findings revealed that E2F1-induced FTH1P3 promoted cell viability and glycolysis through miR-377-3p/LDHA axis in LSCC, which could provide a promising novel strategy for LSCC treatment.
Introduction
Laryngeal squamous cell carcinoma (LSCC) is a common head and neck squamous cell carcinoma. 1 The causes leading to LSCC are complex, including smoking, excessive drinking, chronic inflammation, air pollution, etc. 2 The treatment of LSCC in clinic is surgical resection of tumor combined with chemotherapy and radiotherapy. Despite the innovation of diagnostic and therapeutic strategies, the survival rate of LSCC patients remains poor. 3,4 To improve the clinical management of LSCC patients, identification of novel molecular targets for clinical treatment is important to improve diagnosis, prognosis, and prediction of LSCC recurrence.
Long noncoding RNAs (lncRNAs) are noncoding RNAs that do not encode proteins. They play vital roles in gene regulation in a wide range of biological processes, including cell migration, proliferation, differentiation, cell cycle, and apoptosis. 5,6 Although a large number of lncRNAs have been implicated in cancers, the potential roles of lncRNAs in the development of LSCC are still poorly understood. It was previously reported that lncRNA UCA1 promotes invasion, migration, and proliferation of LSCC cells by activating Wnt/β-catenin signaling. 7 Ferritin heavy chain 1 pseudogene 3 (FTH1P3) is a newly-identified lncRNA and has been found to be aberrantly expressed in different diseases. FTH1P3 is upregulated in oral squamous cell carcinoma (OSCC) and facilitates OSCC progression by sponging miR-224-5p. 8 Similarly, FTH1P3 is overexpressed in uveal melanoma, promoting cell growth and invasion through sponging miR-244-5p. 9 In LSCC, increased lncRNA FTH1P3 is associated with poor prognosis and enhanced aggressiveness of LSCC through modulating cell migration, invasion, proliferation, apoptosis, and cell cycle. 10 However, the expression and mechanism of FTH1P3 in LSCC require further investigation.
Glycolysis is a fundamental biological process in living cells, and inhibition of glycolysis in cancer cells has been used as a novel therapy. 11 Previous findings have shown that small molecules involved in glycolysis modulate the aggressiveness of LSCC. 12,13 However, the relationship between FTH1P3 and glycolysis remains unknown. E2F1 is upregulated in LSCC and is connected with the prognosis of LSCC, suggesting that E2F1 can be a specific diagnostic biomarker. 14 In the present study, the authors evaluated the expression of FTH1P3 in LSCC in vitro and in vivo. Interestingly, high expression of FTH1P3 was positively correlated with the expression of E2F1. Furthermore, the authors demonstrated that E2F1-induced FTH1P3 promoted cell viability and glycolysis through miR-377-3p/LDHA using target prediction and functional validation. This study aimed to elucidate the effect of E2F1-induced FTH1P3 on glycolysis in LSCC, and their findings indicate that FTH1P3 may be an effective biomarker for the diagnosis of LSCC.
Materials and Methods
The use of patients tissues and animal experiments were in accordance with the Declaration of Helsinki and the Guide for the Care and Use of Laboratory Animals, and approved by Ethics Committee of Sir Run Run Shaw Hospital, Medical College of Zhejiang University (Approval no. 20200903/42).
Patient samples
Sixty-eight tumor tissues and corresponding normal tissues from LSCC patients were collected from Sir Run Run Shaw Hospital, Medical College of Zhejiang University. Each patient volunteered to provide their written informed consent to participate in the study. All tissues were processed in accordance with the Declaration of Helsinki and approved by the Ethics Committee of Sir Run Run Shaw Hospital, Medical College of Zhejiang University.
Cell culture
The LSCC cell lines, AMC-HN-8 and TU686 (ATCC), were grown in Dulbecco's modified Eagle's medium (Invitrogen) supplemented with 10% fetal bovine serum (Gibco) at 37°C in 5% CO2.
Plasmid construction and transfection
The shNC and shFTH1P3 were designed and constructed by GenePharma (China), and the sequences of shFTH1P3 are as follows: 5′-CACCGCCAGCCCTCCGTCACCTCTTCGAAAAGAGGTGACGGAGGGCTGGC-3′ (top strand), 5′-AAAAGCCAGCCCTCCGTCACCTCTTTTCGAAGAGGTGACGGAGGGCTGGC-3′ (bottom strand). The miR-377-3p mimic and NC mimic were purchased from RiboBio (China). The full-length cDNA of FTH1P3 or E2F1 was synthesized by GenScript (Nanjing, China) and inserted into the pcDNA3.1 vector (Invitrogen). For cotransfection, 6 × 10⁵ cells/well were seeded onto a 6-well plate and transfected with sh-NC or shFTH1P3. Subsequently, pcDNA-E2F1 and pcDNA-NC were transfected into AMC-HN-8 cells with Lipofectamine 2000 (Invitrogen). Transfection with pcDNA-NC/pcDNA-FTH1P3 and miR-377-3p mimic/NC mimic into AMC-HN-8 and TU686 cells was also performed using Lipofectamine 2000.
3-(4,5-dimethylthiazol-2-yl)-2,5-diphenyltetrazolium bromide
After transfection, cell medium was removed, and AMC-HN-8 or TU686 cells were cultured for further 48 h. To monitor cell viability, cells were incubated with 0.5 mg/mL of 3-(4,5)-dimethylthiahiazo (-z-y1)-3,5-di-phenytetrazoliumromide (MTT) (Sigma-Aldrich) for 4 h and resuspended with 150 μL of dimethyl sulfoxide (Sigma-Aldrich). Finally, the absorbance at 490 nm was recorded.
Glucose uptake and L-lactate production
Glucose uptake and lactate production were measured using a Glucose Uptake Assay Kit (Abcam, United Kingdom) and an L-lactate Assay Kit (Bioassay Systems), respectively. The results were normalized to control.
Lactic dehydrogenase activity assay
The lactic dehydrogenase (LDH) activity was detected using the LDH Assay Kit (Nanjing Jiancheng, China) according to the manufacturer's instructions.
Chromatin immunoprecipitation assay
Chromatin immunoprecipitation (ChIP) assays were performed using the Thermo Scientific Pierce Magnetic ChIP Kit (Thermo Scientific). Briefly, ChIP involved protein-DNA complex crosslinking, chromatin preparation, and immunoprecipitation, and then the DNA was purified. Immunoprecipitated DNA was amplified by polymerase chain reaction.
RNA immunoprecipitation assay
RNA immunoprecipitation (RIP) assay was used to verify the interaction between FTH1P3 and miR-377-3p and was performed using a Magna RIP RNA-Binding Protein Immunoprecipitation Kit (Millipore) according to the manufacturer's protocols. AMC-HN-8 and TU686 cells were lysed and incubated with RIP buffer supplemented with anti-Ago2 antibody or immunoglobulin G (IgG, negative control; Abcam, United Kingdom) magnetic beads. Finally, the relative enrichment of FTH1P3 and miR-377-3p was analyzed by real time-polymerase chain reaction (RT-PCR) assay.
Dual-luciferase reporter gene assay
FTH1P3 or LDHA sequences containing the putative miR-377-3p binding sites or mutated miR-377-3p binding sites were inserted into the pmirGL3 vector (Promega) to construct pGL3-FTH1P3-wt or pGL3-LDHA-wt and pGL3-FTH1P3-mut or pGL3-LDHA-mut, respectively. Cells were seeded onto 96-well plates and cotransfected with pGL3-FTH1P3-wt/pGL3-FTH1P3-mut or pGL3-LDHA-wt/pGL3-LDHA-mut vector and miR-377-3p mimic/NC mimic. After 24 h, cells were collected, and relative luciferase activity was recorded and quantified.
Quantitative RT-PCR assay
Total RNA was isolated using TRIzol reagent (Invitrogen). A total of 20 ng RNA was reverse transcribed with a Reverse Transcriptase Kit (LMAI Bio, China). Quantitative RT-PCR was performed using the SYBR Premix EX Taq (Takara, Japan). β-actin or U6 was used as references. Relative expression levels were analyzed using the 2−ΔΔCt method. Primers used in this study are as follows: β-actin-F: 5′-CTGGAACGGTGAAGGTGACA-3′, β-actin-R: 5′-CGGCCACATTGTGAACTTTG-3′; U6-F: 5′-CTCGCTTCGGCAGCACA-3′, U6-R: 5′-AACGCTTCACGAATTTGCGT-3′; FTH1P3-F: 5′-TGACTACAGTCTTACCCCATCCT-3′, FTH1P3-R: 5′-CTGATAGCCACCTGAAATGCG-3′; LDHA-F: 5′-TCTCTGTAGCAGATTTGGCAGA-3′, LDHA-R: 5′-AAGACATCATCCTTTATTCCGTAAA-3′; miR-377-3p-F: 5′-GGGAGGCAGTGTATTGTTA-3′, and miR-377-3p-R: 5′-CAGTGCGTGTCGTGGAGT-3′.
Western blot
Total protein was extracted using RIPA buffer (Sigma-Aldrich), separated by sodium dodecyl sulfate–polyacrylamide gel electrophoresis, and transferred onto polyvinylidene fluoride membranes (Millipore). Next, membranes were washed with Tris Buffered Saline Tween thrice and incubated with 5% skimmed milk and primary antibodies overnight at 4°C. Primary antibodies used in this study are as follows: anti-E2F1 (1:800 dilution; Abcam, United Kingdom), anti-LDHA (1:800 dilution; Abcam), or anti-β-actin (1:1000 dilution; Cell Signaling Technology). Then, membranes were incubated with goat anti-rabbit IgG H&L [horseradish peroxidase (HRP)] (1:5000 dilution; Beyotime, China) for 2 h at room temperature. Immunodetection was performed using a BeyoECL Plus Kit (Beyotime, China).
Animal experiments
ShNC and shE2F1 were purchased from RiboBio (Guangzhou, China). AMC-HN-8 cells were seeded onto 6-well plates, and transfection was performed using Lipofectamine 2000 (Invitrogen). A total of 10 healthy 5-week-old male BALB/c nude mice (∼20 g each) were randomly divided into two groups as follows: shE2F1 group and shNC group (n = 5 per group). Each mouse received a subcutaneous injection of AMC-HN-8 cell suspension (1 × 10⁶) transfected with shE2F1 or shNC into the dorsal scapula region. Tumor volume was analyzed every week using the following formula: 1/2 × length × width 2 . After 5 weeks of injections, mice were sacrificed under ether anesthesia, and the tumors were dissected for further analysis. The tumor weight was recorded.
Immunohistochemistry assay
The xenograft tumors were isolated, embedded with paraffin, cut into slices, deparaffinized, rehydrated, and then immersed in 3% hydrogen peroxide. Then, tumor sections were incubated with anti-E2F1, Ki67, or LDHA antibody (1:500; Abcam) at 4°C overnight. Incubation with the secondary streptavidin-HRP-conjugated antibody staining (1:1000; Beyotime) was performed for 1 h. Next, sections were counterstained with hematoxylin and visualized under a microscope.
Statistical analysis
All the data in this study are shown as mean ± standard deviation. Data were analyzed with Prism software 7.0. The comparison between two groups was analyzed using t-test, whereas one-way analysis of variance was used for comparison of more than two groups. All experiments were performed thrice. p-Value <0.05 was considered statistically significant.
Results
Knockdown of FTH1P3 suppressed cell viability and glycolysis in LSCC cells
To elucidate the role of FTH1P3 in LSCC, the effects of overexpression and knockdown of FTH1P3 on cell viability of AMC-HN-8 and TU686 cells were investigated. A significant increase or decrease in FTH1P3 level was observed in AMC-HN-8 and TU686 cells transfected with FTH1P3 or shFTH1P3, respectively, confirming the transfection efficiency of FTH1P3 and shFTH1P3 (Fig. 1A). As illustrated in Figure 1B, cell viability of AMC-HN-8 and TU686 cells was markedly enhanced by overexpression of FTH1P3 and suppressed by shFTH1P3 compared to corresponding controls. More importantly, to validate the function of FTH1P3 on glycolysis, glucose uptake, lactate production, and LDH activity were measured. As shown in Figure 1C, overexpression of FTH1P3 increased glucose uptake, lactate production, and LDH activity, whereas shFTH1P3 caused opposite effects in AMC-HN-8 and TU686 cells. Thus, these findings concluded that overexpression of FTH1P3 promoted but knockdown of FTH1P3 suppressed cell viability and glycolysis in LSCC cells.
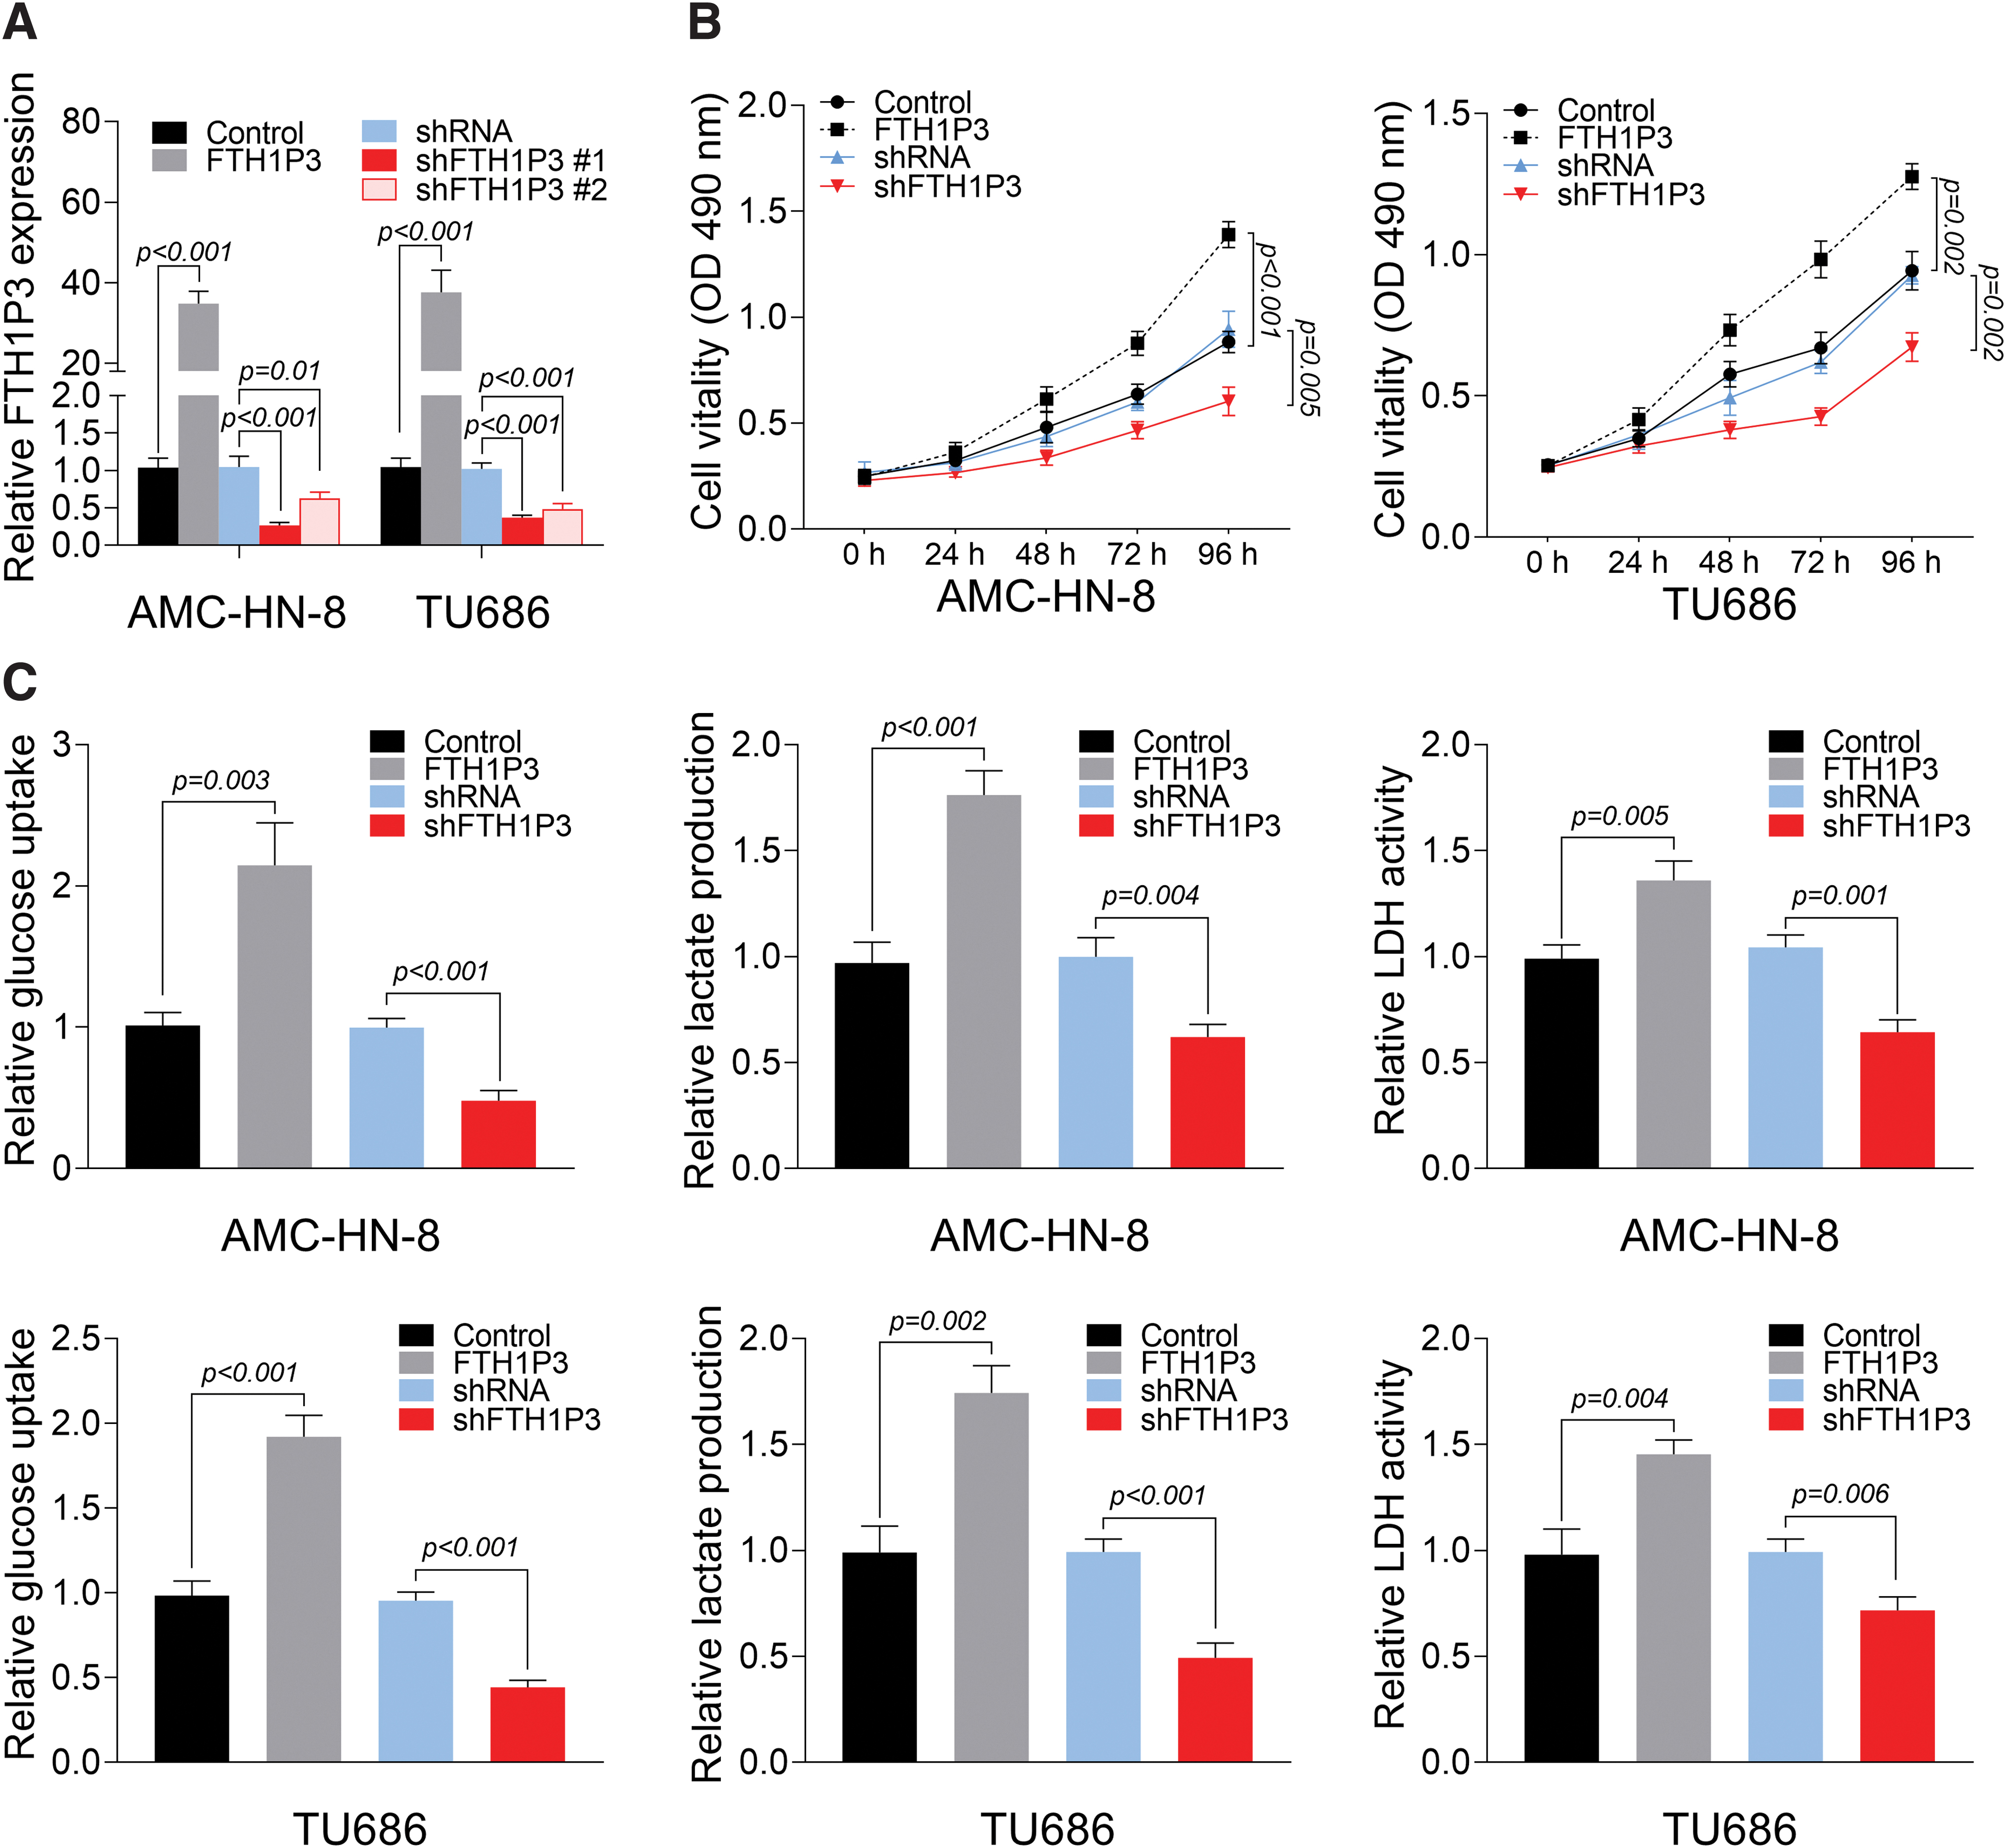
Knockdown of FTH1P3 suppresses cell viability and glycolysis in LSCC cells.
Increased FTH1P3 expression was associated with E2F1 upregulation in LSCC patients
To explore the correlation between FTH1P3 and E2F1 in LSCC, the expression levels of FTH1P3 were assessed in the LSCC tissues (n = 68) and corresponding normal tissues (n = 68). As shown in Figure 2A, qRT-PCR assays demonstrated that FTH1P3 expression was significantly upregulated in the LSCC tissues compared to corresponding normal tissues. Interestingly, E2F1 expression was also markedly enhanced in the LSCC tissues compared to corresponding normal tissues. Moreover, a correlation analysis between FTH1P3 and E2F1 expression showed that FTH1P3 levels were positively correlated with E2F1 levels in the LSCC patients (Fig. 2B). Consistently, Western blot assays confirmed increased E2F1 protein levels in LSCC tissues (Fig. 2C). These data indicated that upregulated FTH1P3 was associated with increased E2F1 expression in LSCC patients.
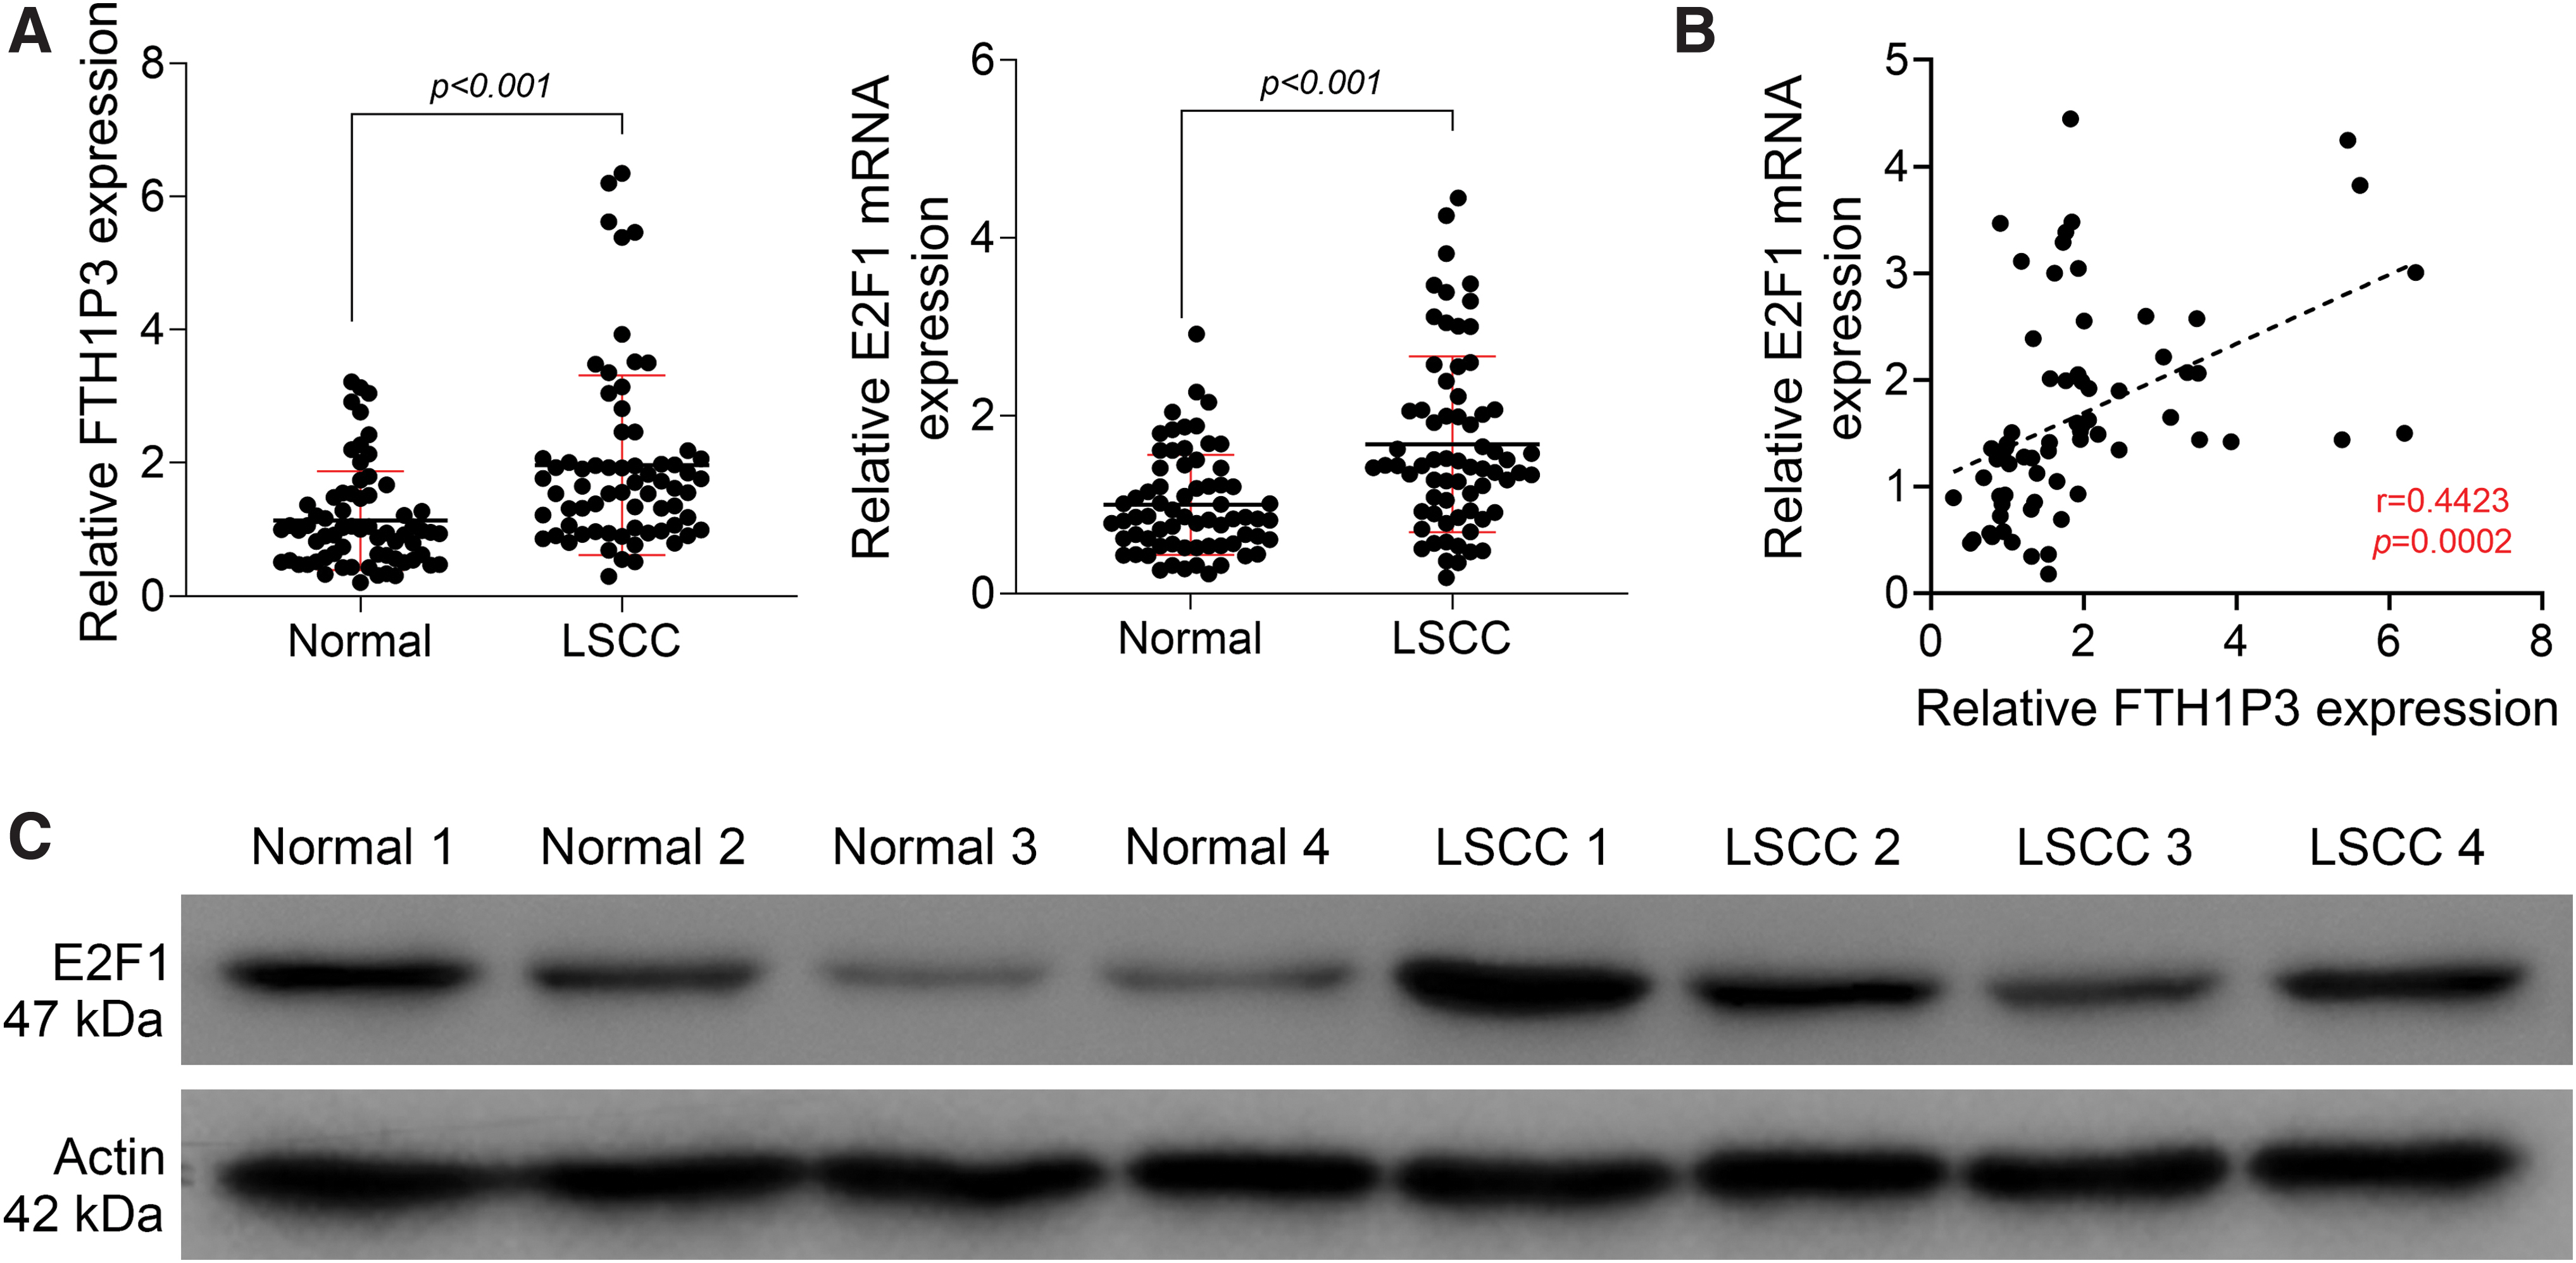
Increased FTH1P3 expression is associated with E2F1 upregulation in LSCC patients.
E2F1 induced FTH1P3 expression in LSCC cells
To investigate the relationship between FTH1P3 and E2F1, the recognition site of E2F1 was analyzed and predicted by JASPAR (Fig. 3A). As shown in Figure 3B, in HEK-293T cells, overexpression of E2F1 enhanced the enrichment of E2F1 in FTH1P3 promoter, whereas knockdown of E2F1 could reduce the enrichment of E2F1 in FTH1P3 promoter. The entire FTH1P3 promoter was divided into three segments (called E1, E2, and E3) (Fig. 3C). To detect the segment of promoter to which E2F1 binds to, luciferase reporter assays were performed. PF and P2 significantly increased the luciferase activities in HEK-293T cells, suggesting that E2F1 binds to the FTH1P3 promoter at the E2 segment (Fig. 3D). As shown in Figure 3E, transfection of AMC-HN-8 and TU686 cells with E2F1 or shE2F1 led to increased or decreased protein levels of E2F1, respectively. Expectedly, overexpression of E2F1 induced FTH1P3 expression, and shE2F1 inhibited FTH1P3 expression in AMC-HN-8 and TU686 cells (Fig. 3F). These findings revealed that E2F1 induced FTH1P3 expression in LSCC cells.
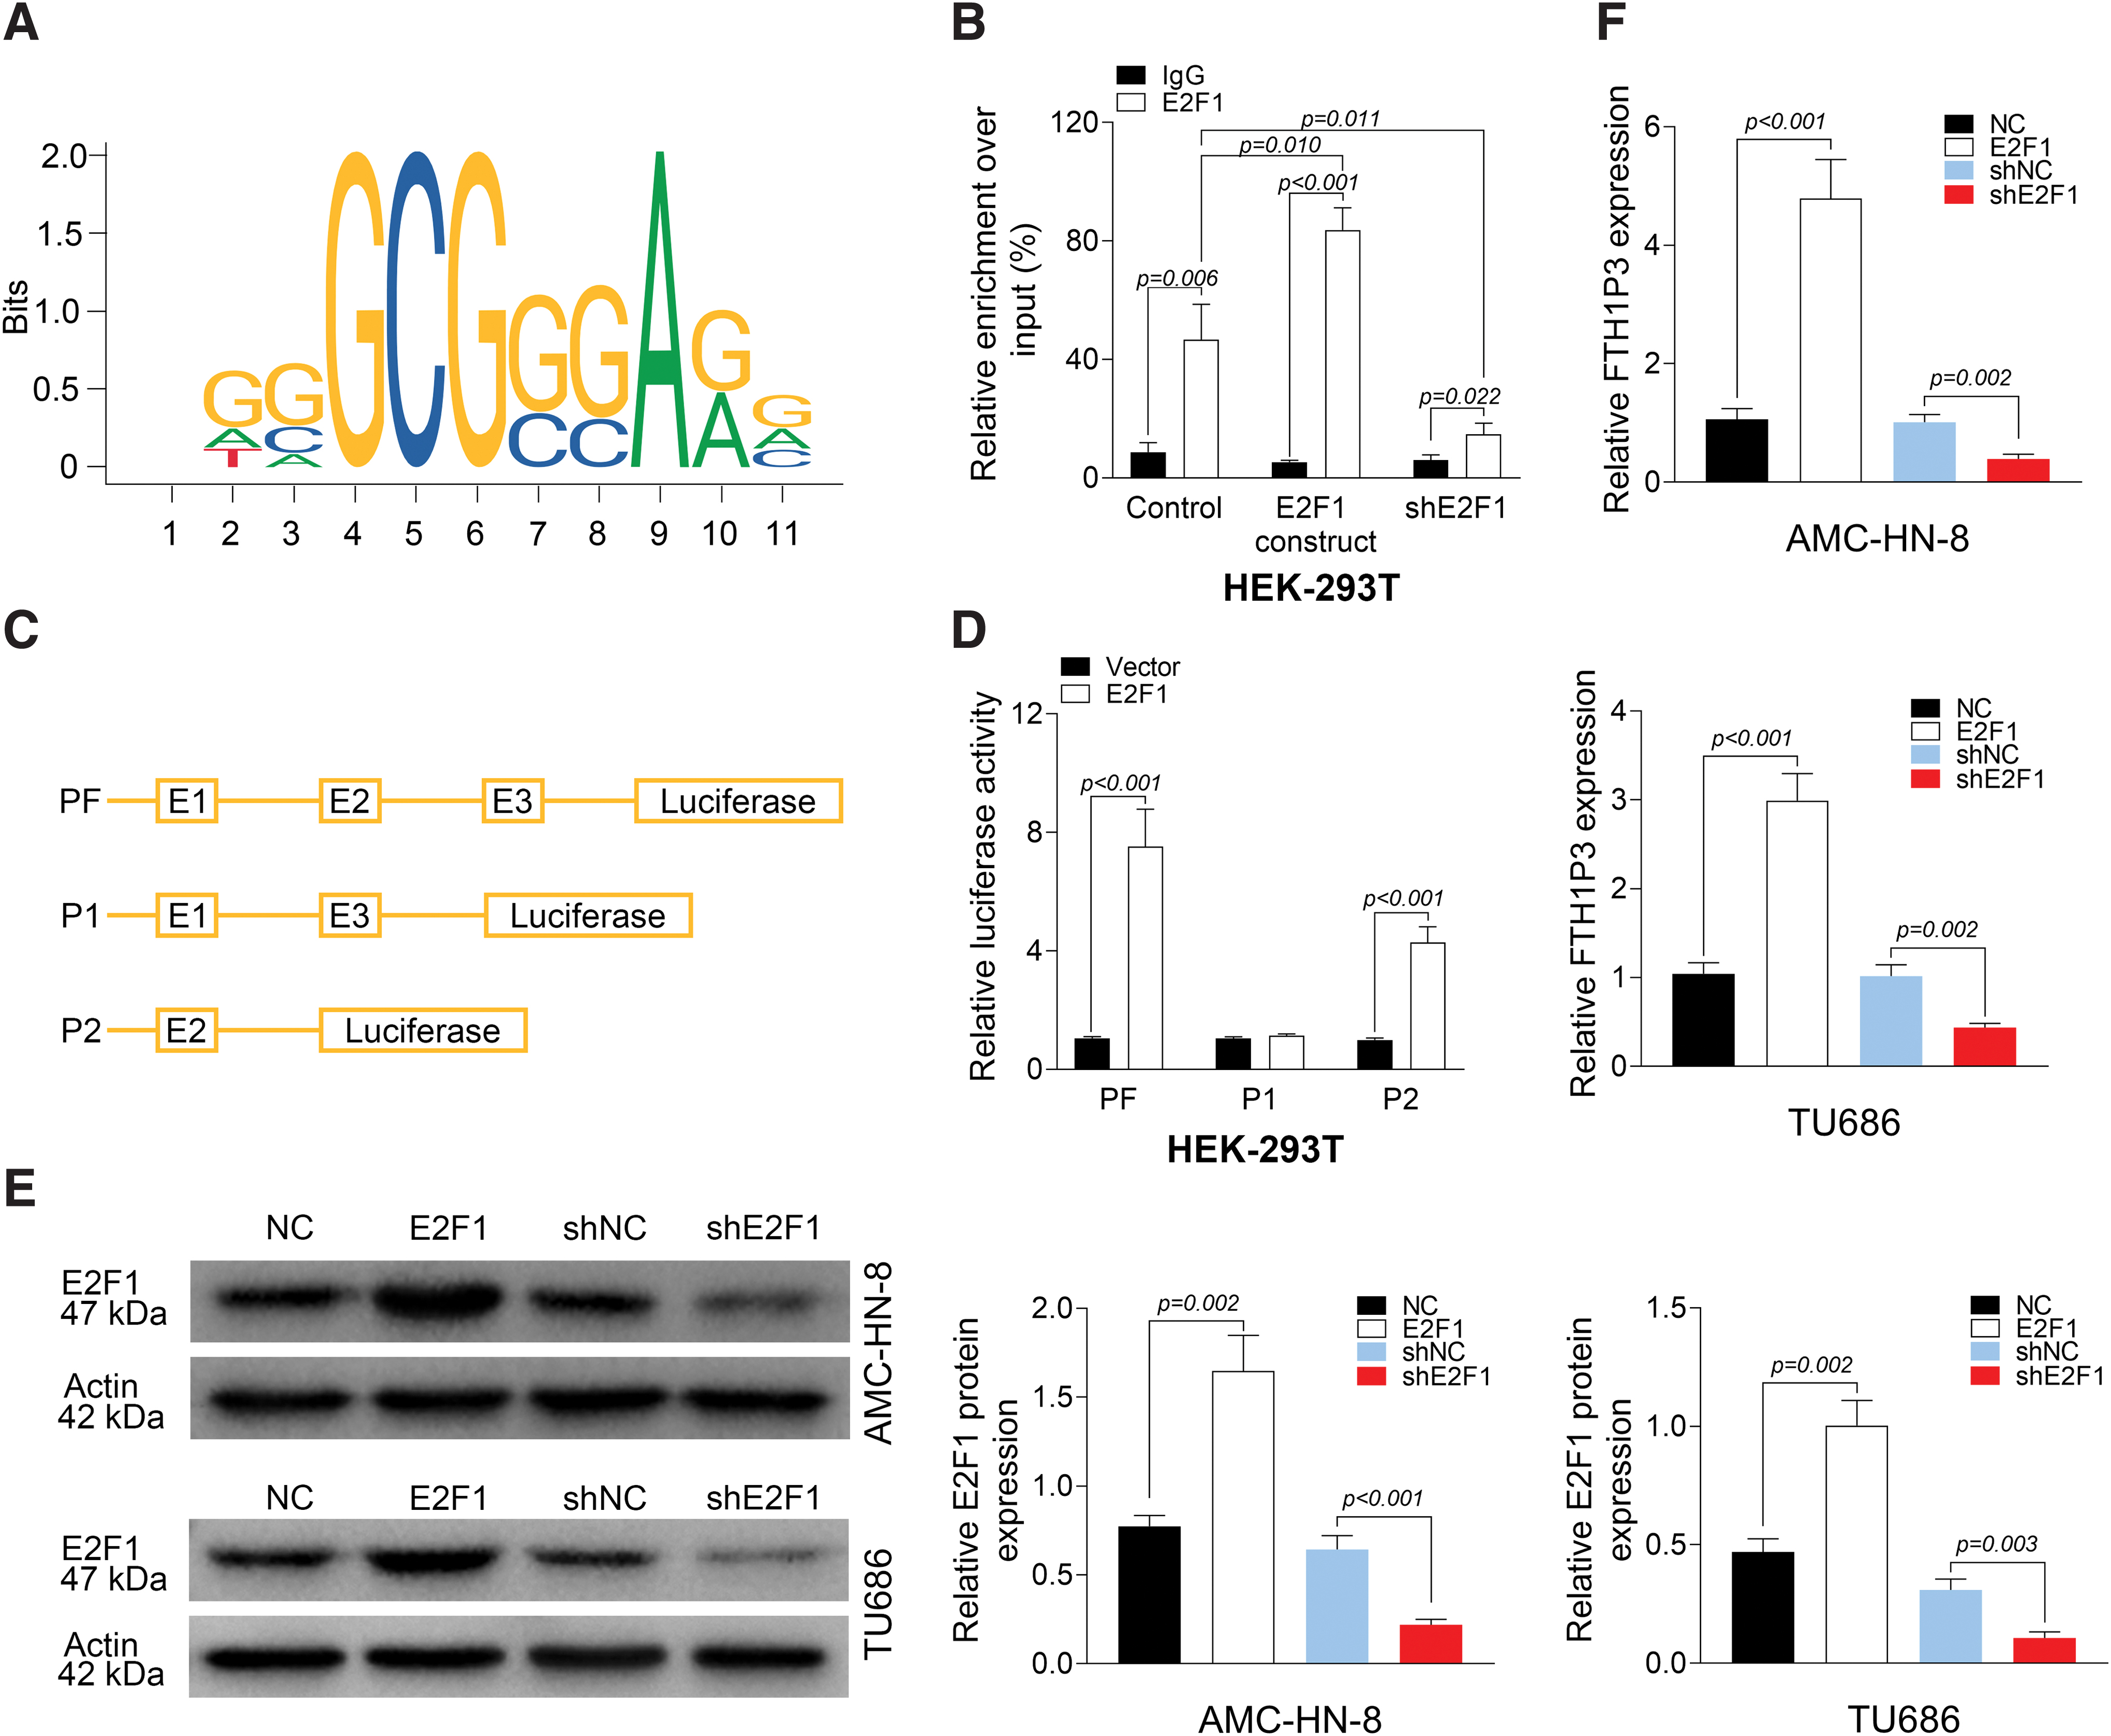
E2F1 induces FTH1P3 expression in LSCC cells.
MiR-377-3p is a direct target of FTH1P3
To elucidate the role of FTH1P3 in LSCC, the authors next sought to identify the direct target of FTH1P3. Using miRDB, FTH1P3 was predicted to specifically bind to miR-377-3p (Fig. 4A). Luciferase reporter assays confirmed that miR-377-3p reduced the luciferase activity of FTH1P3-wt in HEK-293T cells, but had no effect on FTH1P3-mut (Fig. 4B). As shown in Figure 4C, in AMC-HN-8 and TU686 cells, compared to IgG, Ago2 beats enriched more FTH1P3 or miR-377-3p. This result suggested that FTH1P3 could bind to miR-377-3p through Ago2 protein. Finally, the qRT-PCR assay indicated that overexpression of FTH1P3 increased miR-377-3p level, and knockdown of FTH1P3 decreased miR-377-3p level in AMC-HN-8 and TU686 cells (Fig. 4D). These findings concluded that FTH1P3 modulated miR-377-3p expression by targeting miR-377-3p.
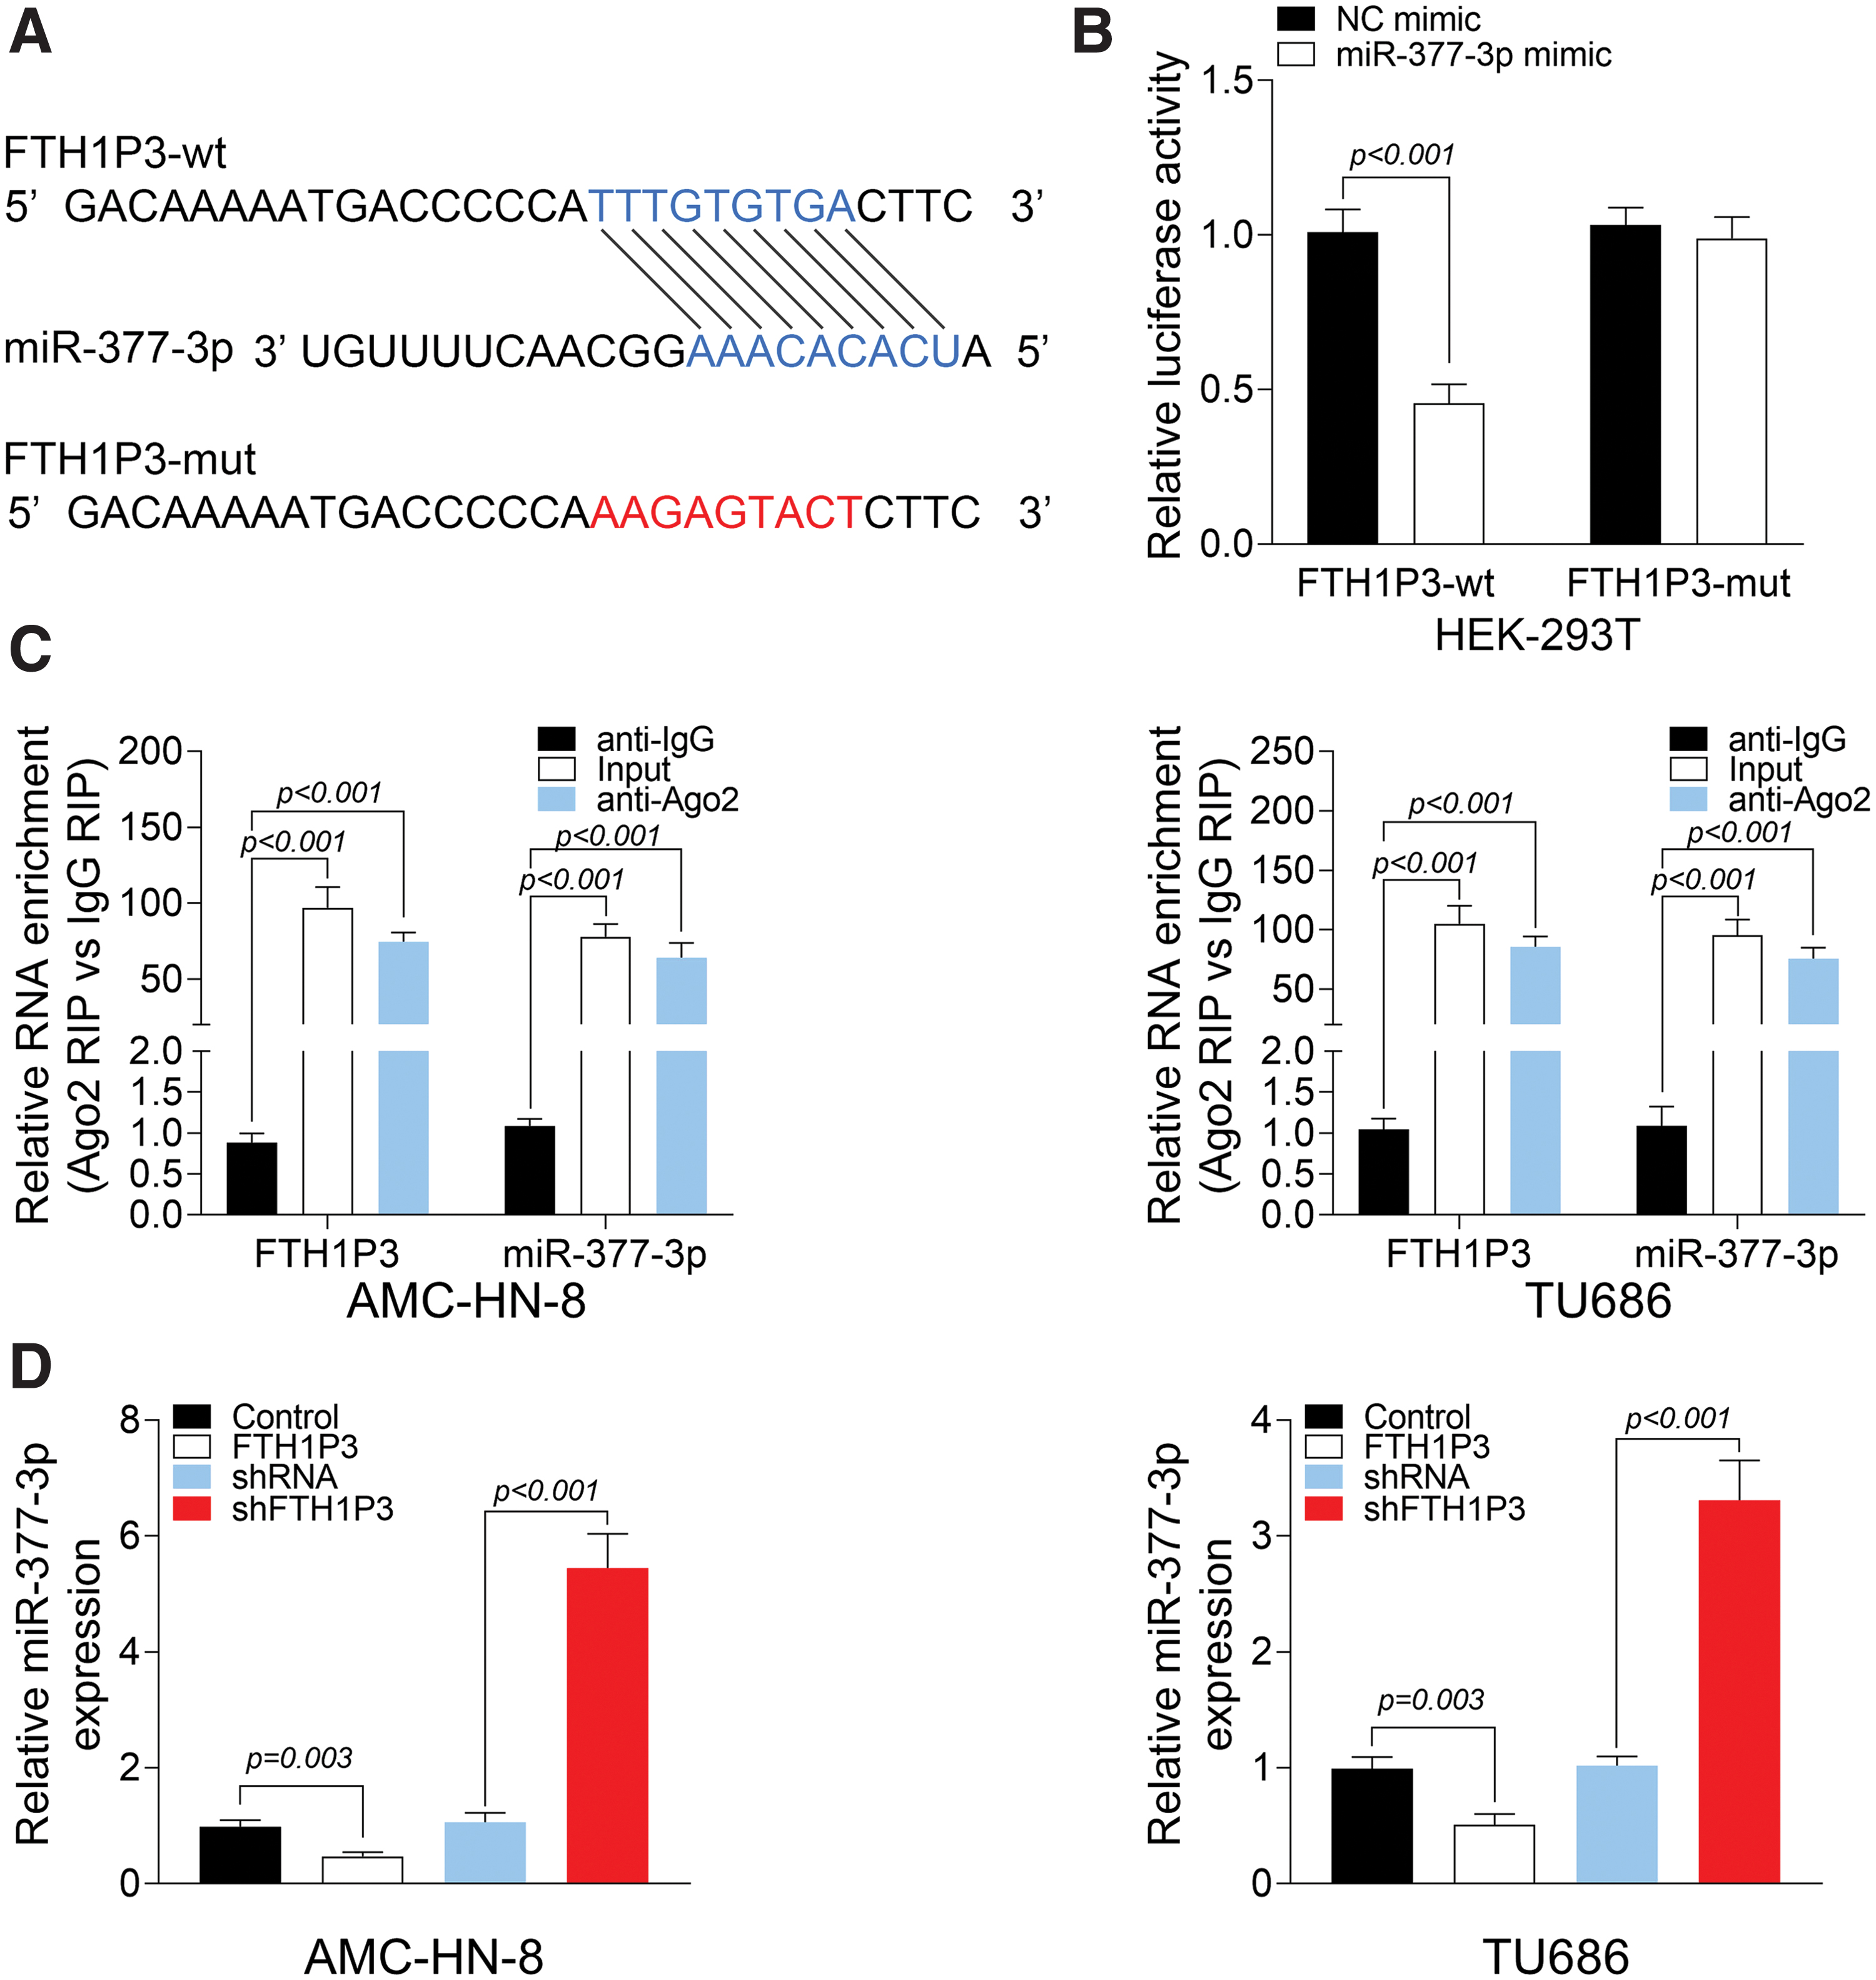
MiR-377-3p is a direct target of FTH1P3.
FTH1P3 promoted LDHA expression by suppressing miR-377-3p
StarBase database was used in this study to identify the target of miR-377-3p, which predicted LDHA to be a potential target of miR-377-3p (Fig. 5A). HEK-293T cells were cotransfected with LDHA-wt or LDHA-mut and miR-377-3p mimic or NC mimic. The results from luciferase reporter assays demonstrated that cotransfection of LDHA-wt and miR-377-3p mimic markedly reduced the luciferase activity in HEK-293T cells, indicating that LDHA is a target of miR-377-3p (Fig. 5B). Moreover, Western blot assays confirmed that miR-377-3p mimic inhibited LDHA expression in AMC-HN-8 and TU686 cells (Fig. 5C). Interestingly, the authors found that FTH1P3 induced LDHA expression, which could be partially reversed by miR-377-3p mimic (Fig. 5D). These findings revealed that LDHA is a target of miR-377-3p, and FTH1P3 promoted LDHA expression by suppressing miR-377-3p.
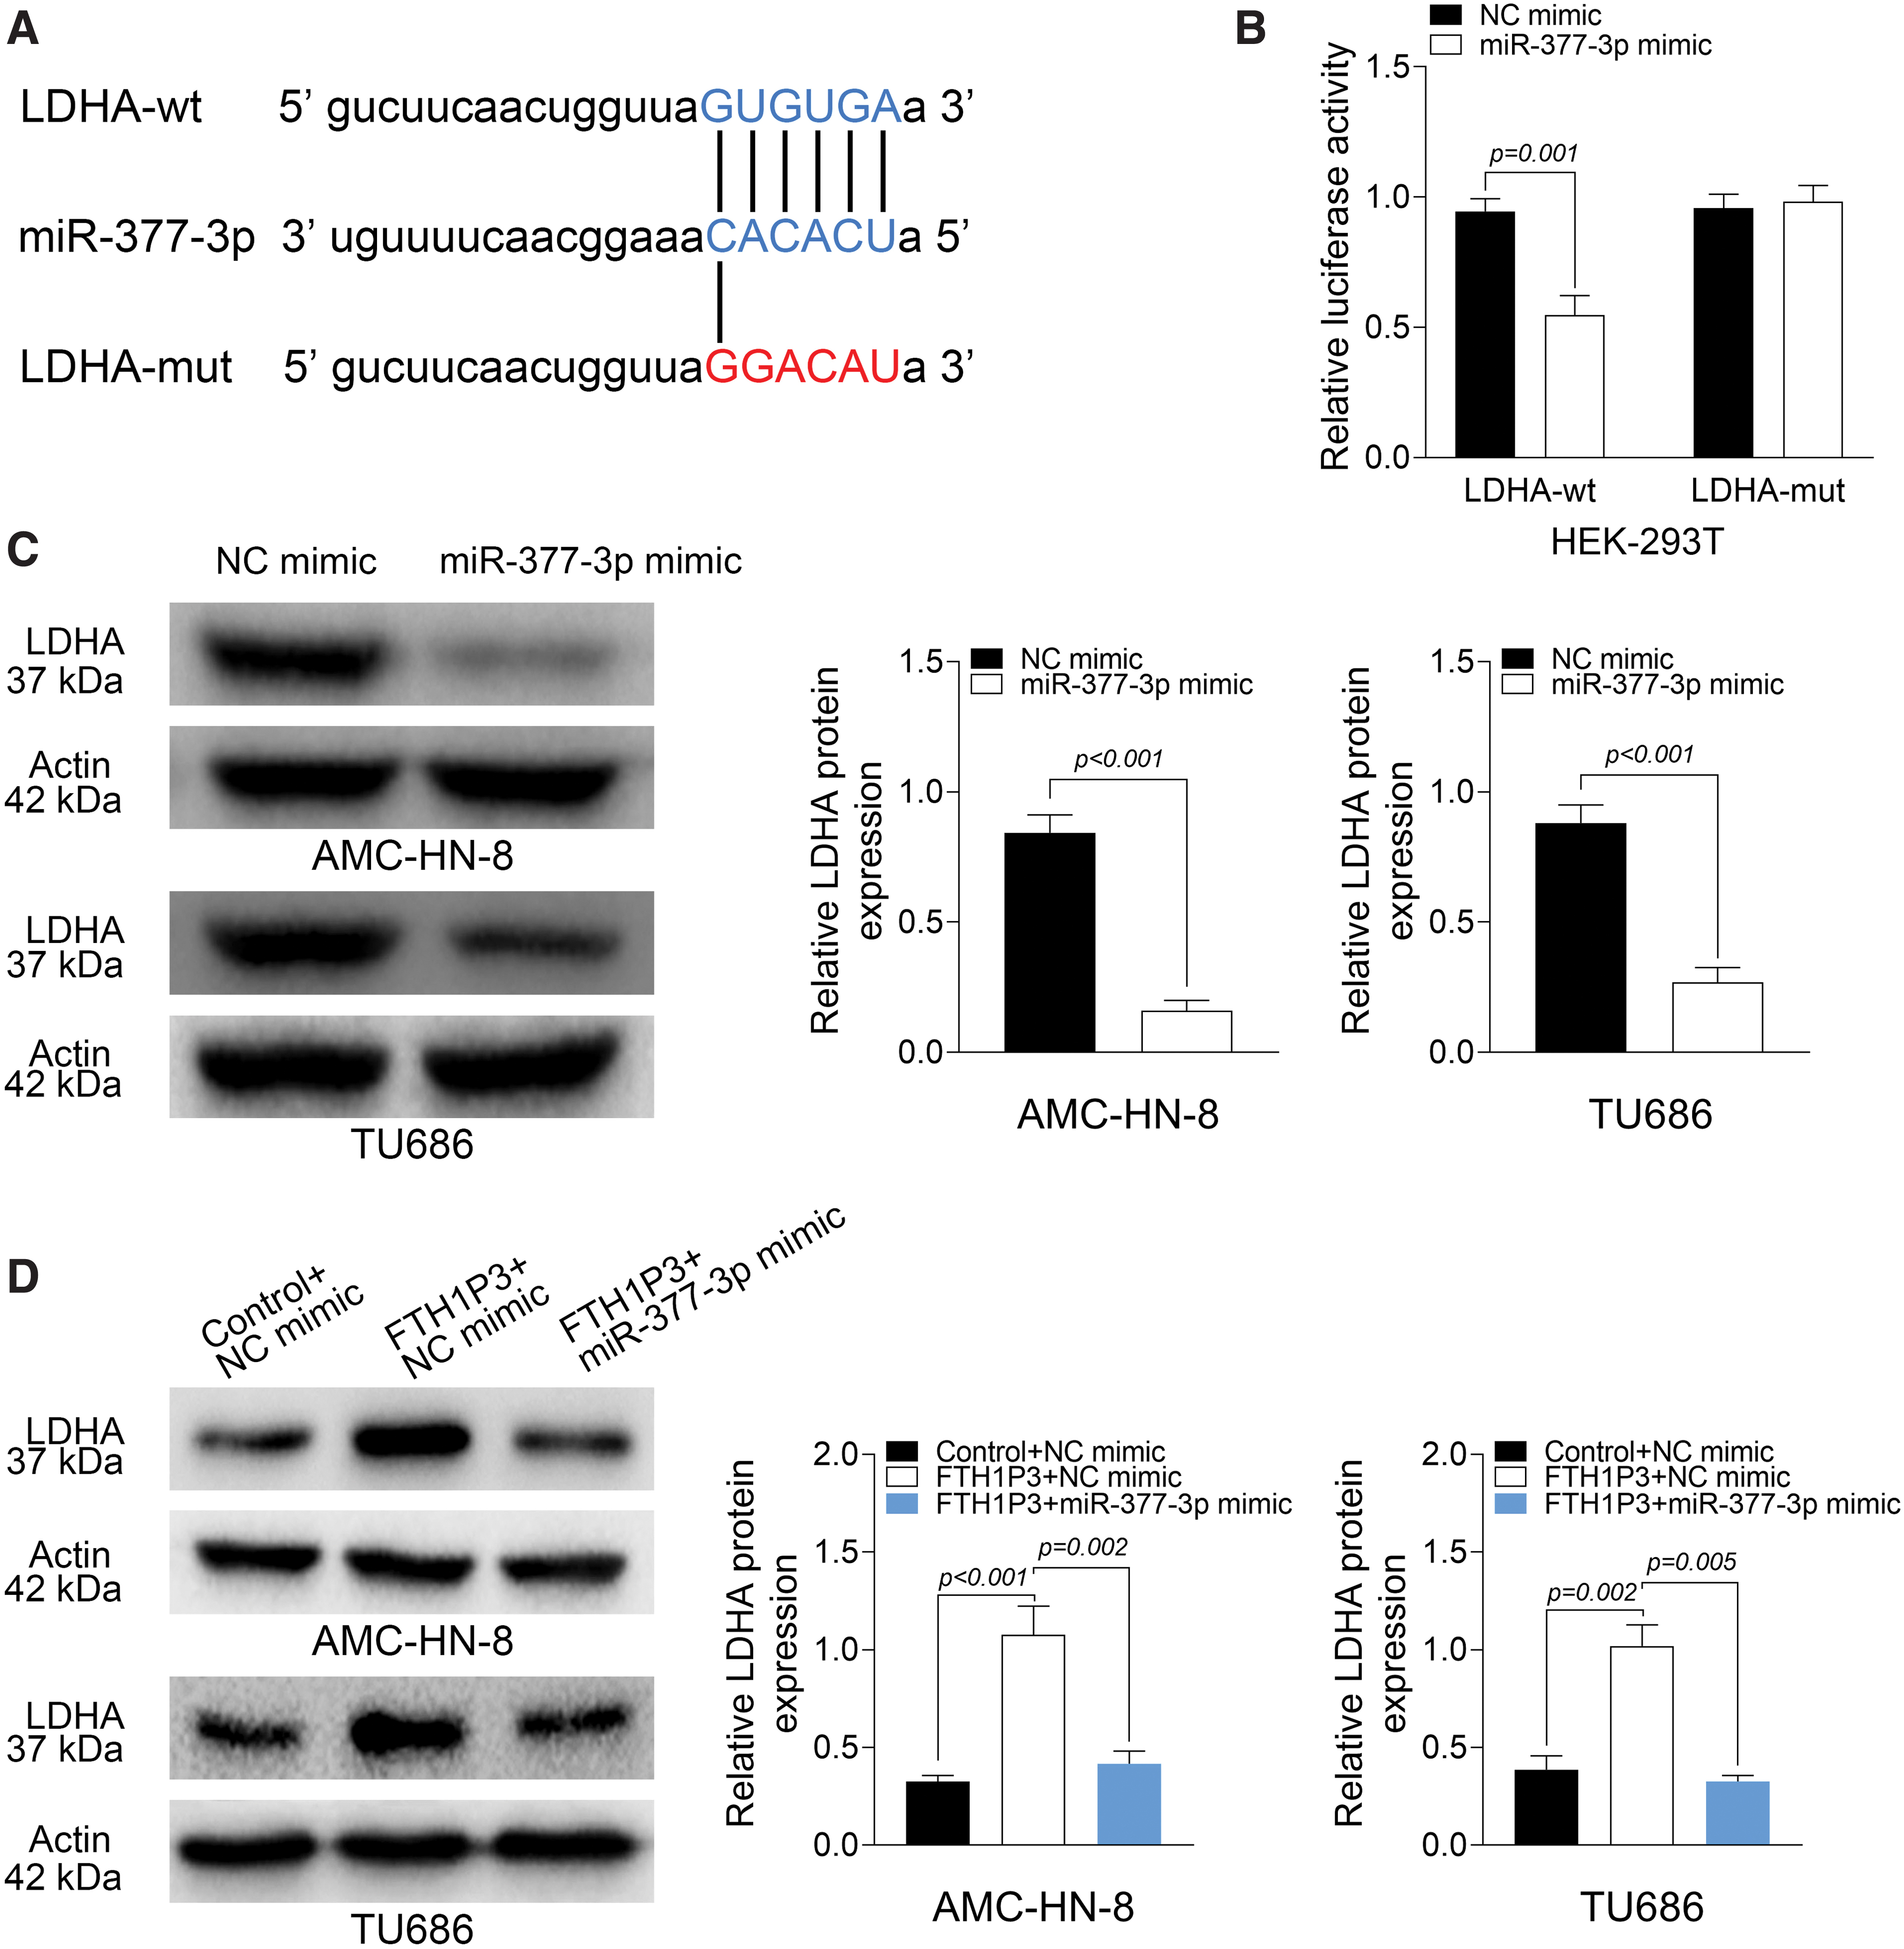
FTH1P3 promotes LDHA expression through the suppression of miR-377-3p.
Knockdown of FTH1P3 mitigated E2F1-induced cell viability and glycolysis through miR-377-3p/LDHA in AMC-HN-8 cells
To further validate that FTH1P3 modulates E2F1-induced cell viability and glycolysis in AMC-HN-8 cells, AMC-HN-8 cells were cotransfected with E2F1 plasmid and shFTH1P3, and the effects on cell viability and glycolysis were evaluated. First, miR-377-3p level in AMC-HN-8 cells was reduced by overexpression of E2F1, but induced by shFTH1P3 (Fig. 6A). On the contrary, LDHA expression in AMC-HN-8 cells was enhanced by overexpression of E2F1, but reduced by shFTH1P3 (Fig. 6B). Interestingly, MTT assays demonstrated that overexpression of E2F1 promoted cell viability of AMC-HN-8 cells, and this was reversed by shFTH1P3 (Fig. 6C). Furthermore, overexpression of E2F1 elevated glucose uptake, lactate production, and LDH activity, whereas transfection of shFTH1P3 led to the opposite effects (Fig. 6D). These findings concluded that knockdown of FTH1P3 mitigated E2F1-induced cell viability and glycolysis through miR-377-3p/LDHA in AMC-HN-8 cells.
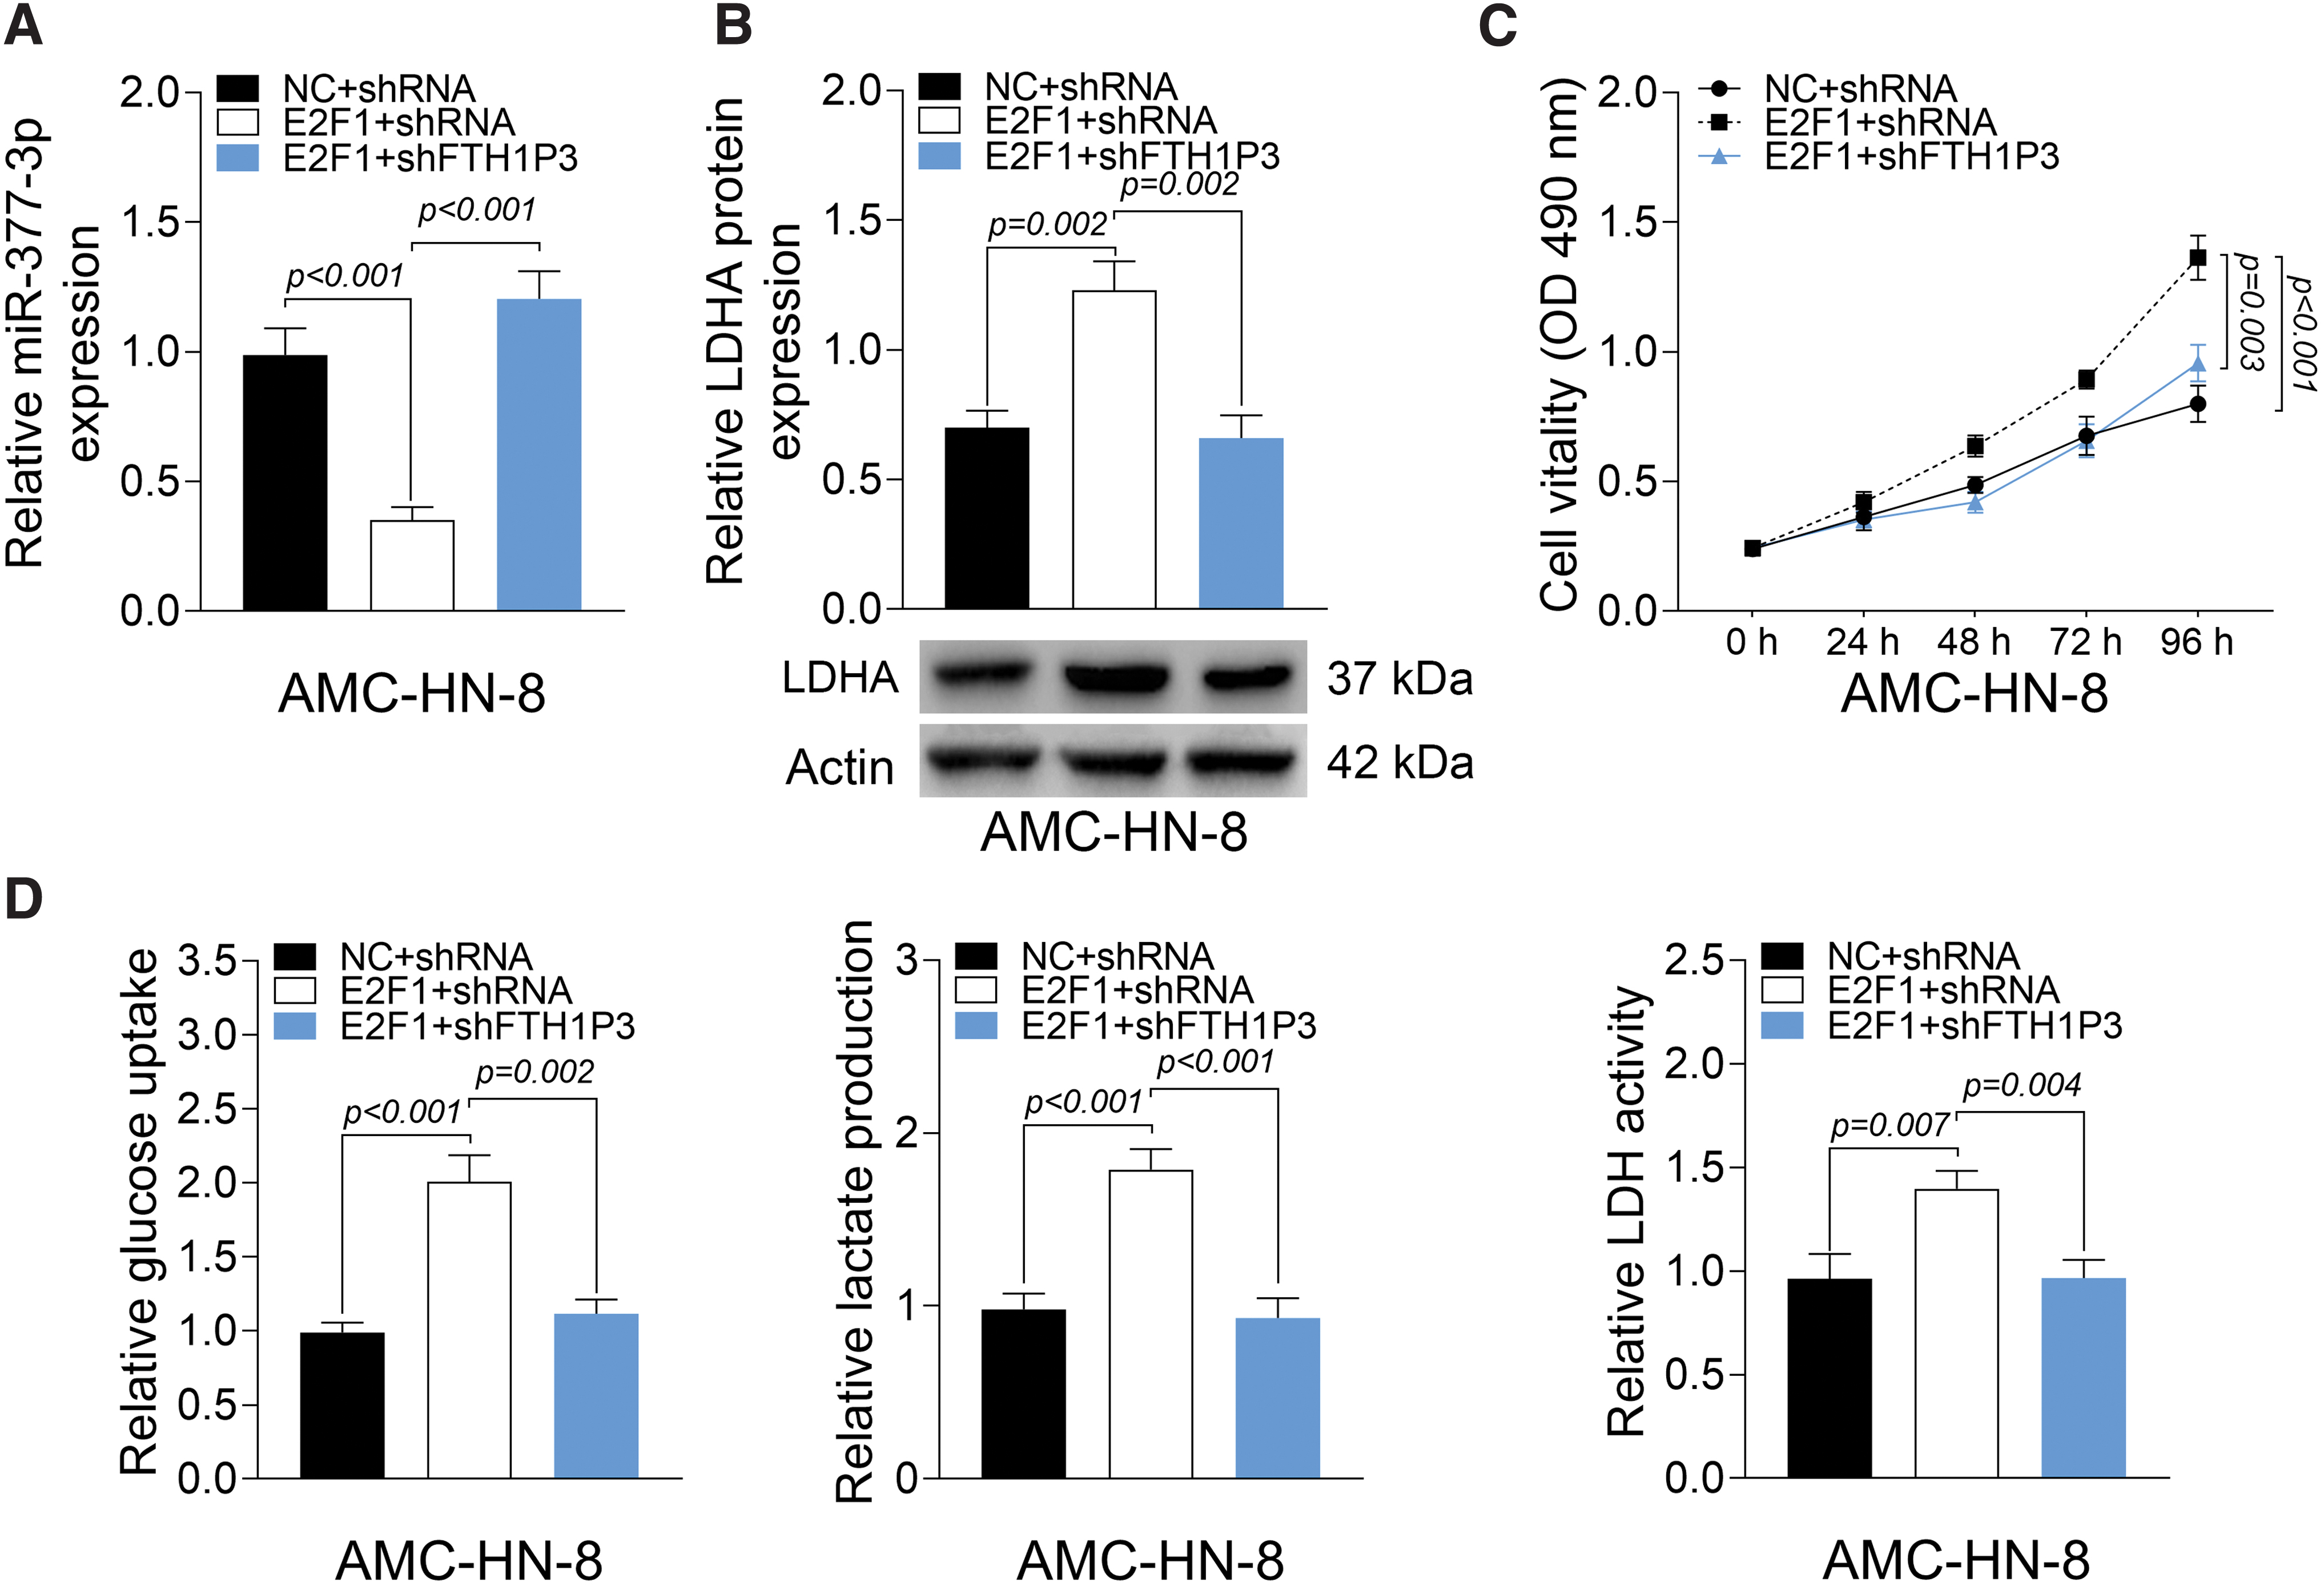
Knockdown of FTH1P3 mitigates E2F1-induced cell viability and glycolysis in AMC-HN-8 cells.
Knockdown of E2F1 inhibited tumor growth and FTH1P3 expression in vivo
Intriguingly, reduced miR-377-3p and increased LDHA were observed in LSCC tissues compared to corresponding normal tissues (Fig. 7A and B). To further explore the role of E2F1 and FTH1P3 in LSCC, AMC-HN-8 cells transfected with shNC or shE2F1 were injected into mice for in vivo investigation. As shown in Figure 7C, shE2F1 markedly reduced E2F1, FTH1P3, and LDHA expression, but induced miR-337-3p expression. In the shE2F1 mice, E2F1 knockdown suppressed tumor volume and weight, indicating that silencing of E2F1 significantly inhibited tumor growth (Fig. 7D). The expression of E2F1, Ki67, and LDHA in xenograft tumor was also verified by immunohistochemistry (IHC) staining, which showed that knockdown of E2F1 led to a reduction in Ki67 and LDHA expression in vivo (Fig. 7E). These results clearly demonstrated that knockdown of E2F1 inhibited tumor growth and FTH1P3 expression in vivo.
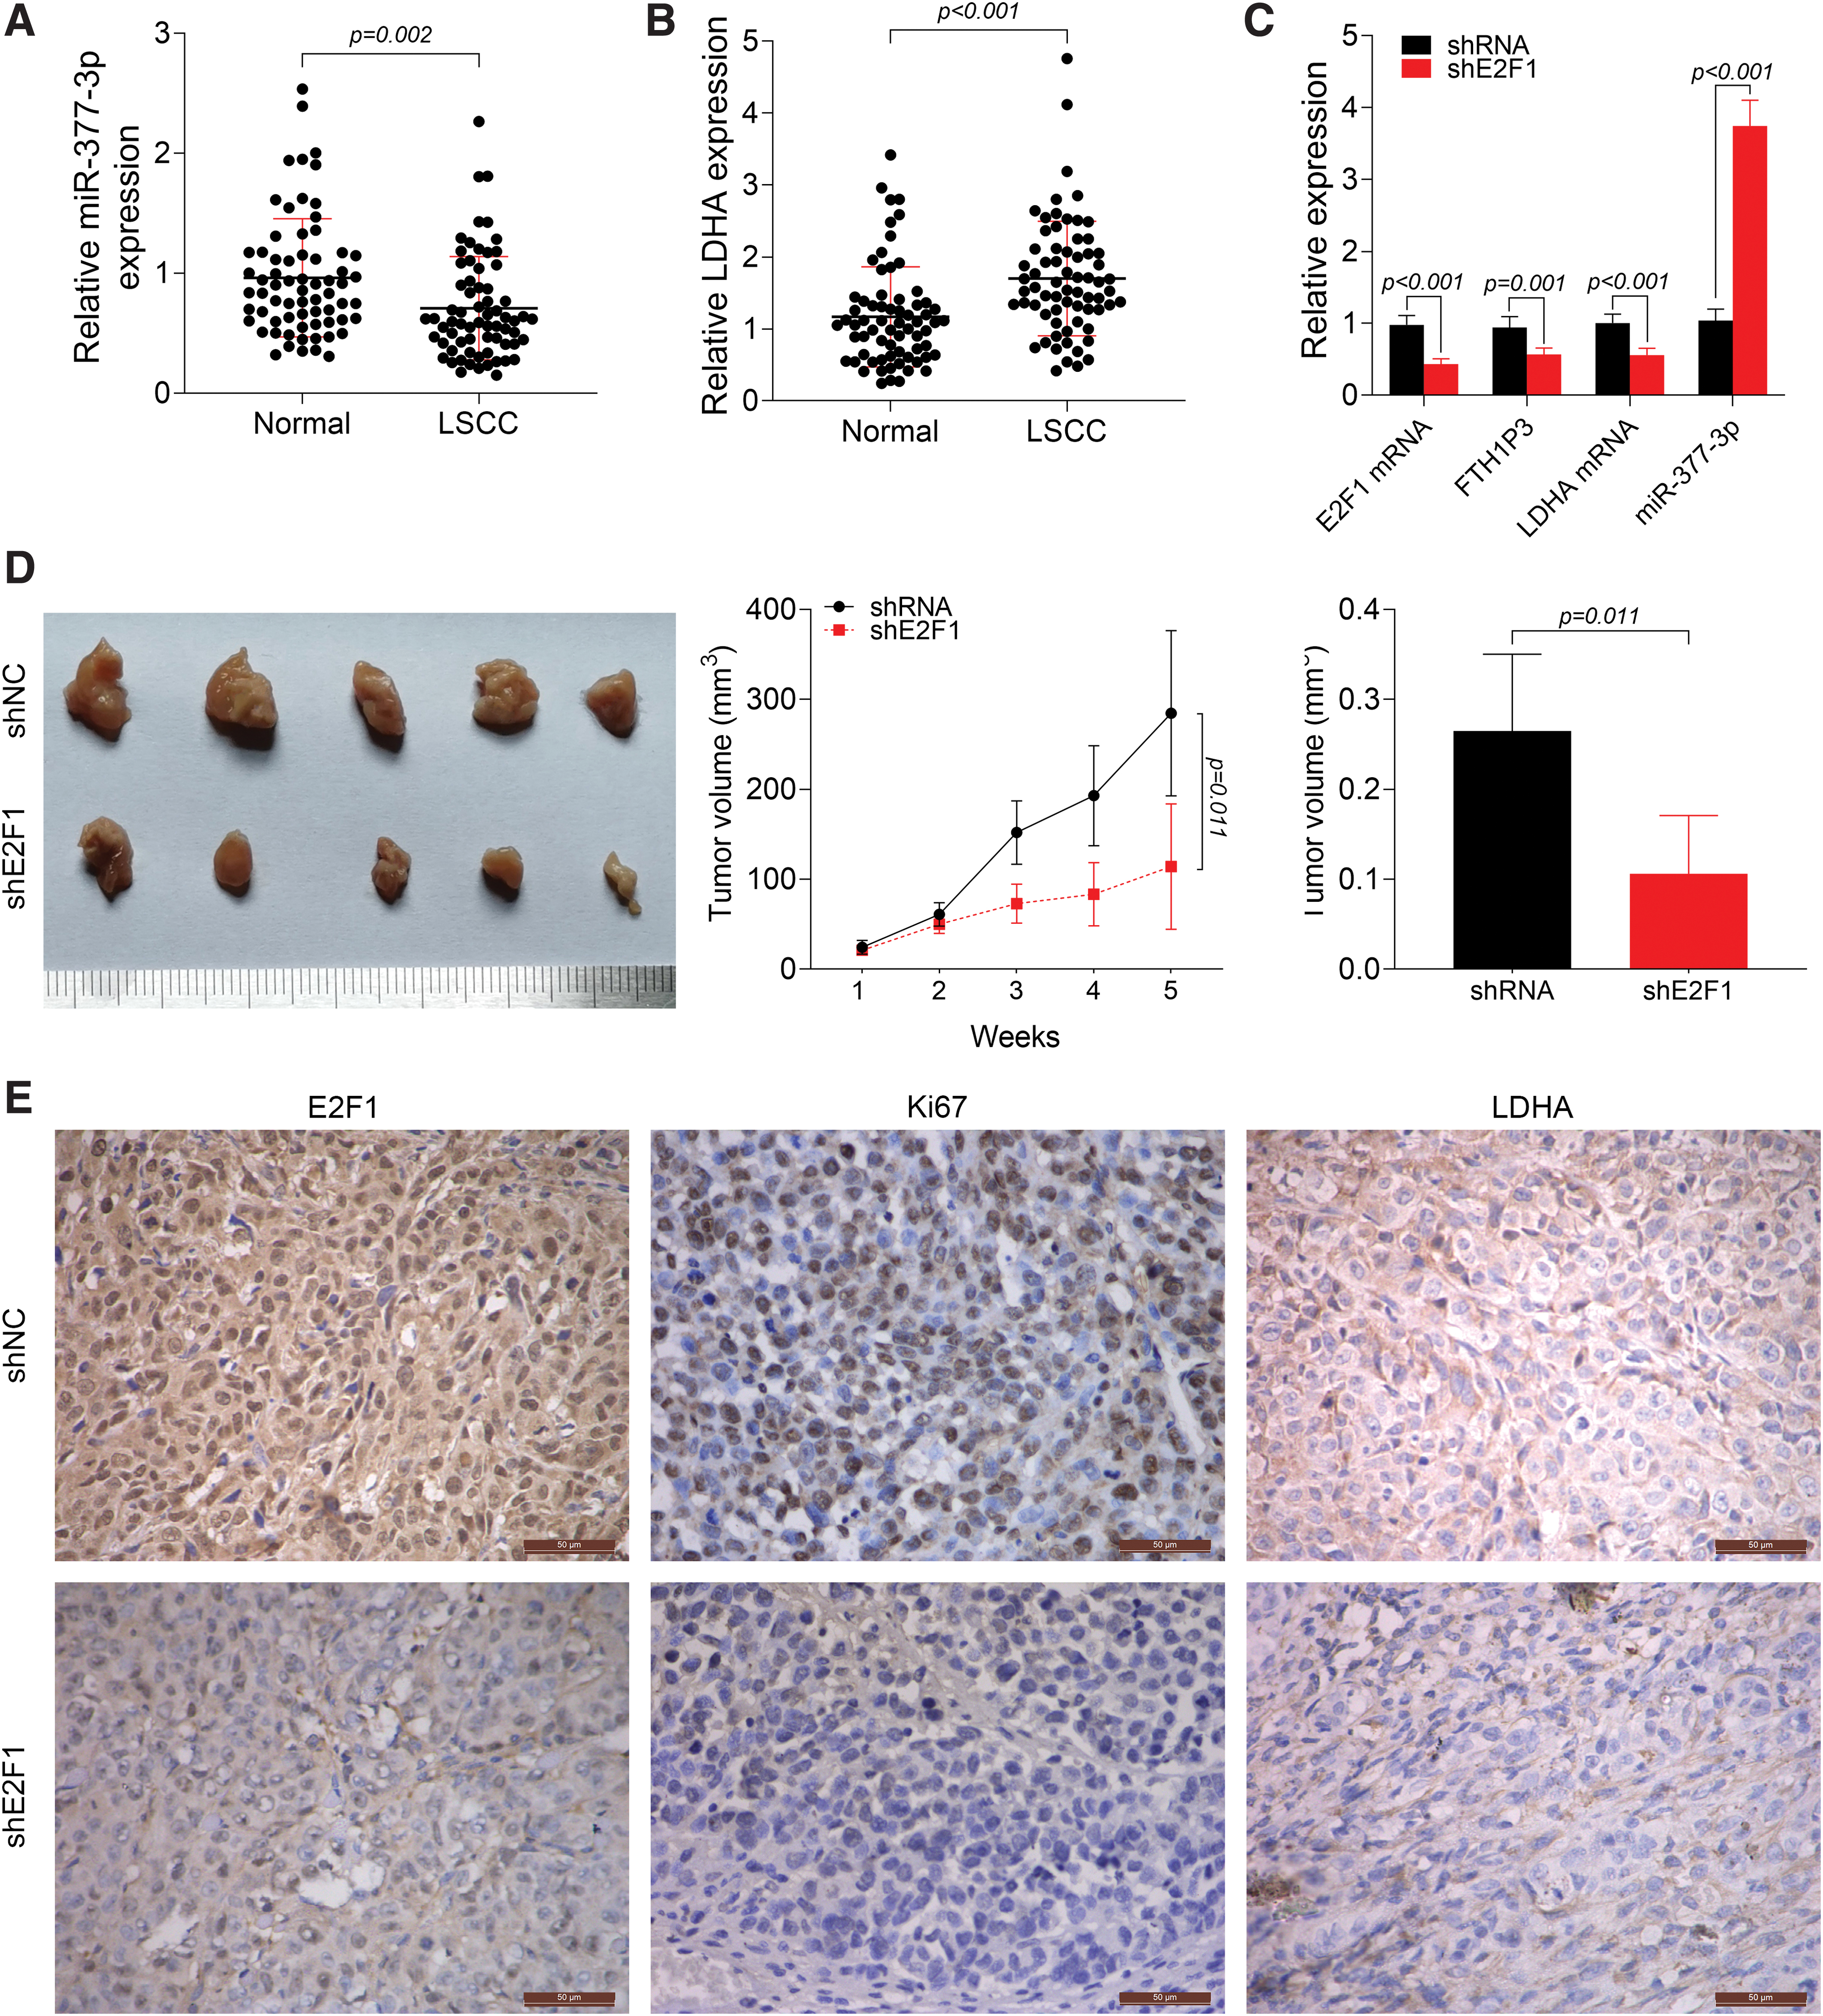
Knockdown of E2F1 inhibits tumor growth and FTH1P3 expression in vivo.
Discussion
In this study, overexpression of FTH1P3 promoted but knockdown of FTH1P3 suppressed cell viability and glycolysis in LSCC cells. Besides, increased FTH1P3 levels were associated with E2F1 upregulation in LSCC patients. E2F1 was proved to induce FTH1P3 expression in LSCC cells. Mechanically, FTH1P3 modulated miR-377-3p expression by targeting miR-377-3p. Interestingly, LDHA was identified to be a target of miR-377-3p, and FTH1P3 promoted LDHA expression by suppressing miR-377-3p. In rescue experiments, knockdown of FTH1P3 mitigated E2F1-induced cell viability and glycolysis through miR-377-3p/LDHA in AMC-HN-8 cells. This study has proven for the first time that E2F1-induced FTH1P3 promoted cell viability and glycolysis through miR-377-3p/LDHA axis in LSCC.
E2F1, a member of E2F transcriptional factor family, modulates the expression of genes involved in cell migration, invasion, proliferation, and apoptosis. Aberrant expression of E2F1 has been found in many types of cancers, including pancreatic, lung, gastric, colon, breast, ovarian, and esophageal cancer. 15 More importantly, E2F1 is upregulated in LSCC specimens and is connected with prognosis, clinical stage, and lymph node metastasis of LSCC, suggesting that it may serve as a specific diagnostic biomarker. 14 In their study, given the upregulation of FTH1P3 and the positive correlation between FTH1P3 and E2F1 expression in LSCC patients, the significance of FTH1P3 in LSCC should be taken into consideration.
Accumulating evidence has revealed that lncRNAs play a significant role in tumorigenesis. 16 LncRNA FTH1P3 participates in tumorigenesis by activating paclitaxel resistance, promoting growth, metastasis, and invasion in breast cancer, esophageal squamous cell carcinoma, and OSCC. 17 –19 Particularly, Yuan and colleagues have demonstrated that increased FTH1P3 presents poor prognosis and promotes aggressive phenotypes of LSCC. Similarly, the authors found that FTH1P3 was upregulated in LSCC patients and cells. Furthermore, knockdown of FTH1P3 suppressed cell viability and glycolysis in LSCC cells, suggesting that the expression of FTH1P3 is not only associated with cell proliferation, migration, invasion, apoptosis, and cell cycle but also glycolysis. Recently, accumulating data have revealed that cancer cells adapt to increased glucose uptake and facilitate a higher rate of glycolysis. Apart from providing energy, glycolysis also assists in macromolecular biosynthesis and helps cancer cells to survive under diminished nutrient supply. 20 In LSCC, small molecules are involved in glycolysis, including proteins and miRNAs. Knockdown of FOXJ1, overexpression of miR-125b-5p, miR-125a, and Wnt1-inducible signaling protein 1 (WISP1) can suppress LSCC glycolysis. 12,13,21,22 This is the first study that proved the significance of FTH1P3 in LSCC glycolysis, which provides a new vision in studying the role of lncRNA in LSCC glycolysis.
lncRNAs can regulate miRNA expression through target-mimetic, sponge/decoy function. 23 FTH1P3 has been reported to target miR-206, miR-224-5p, or miR-145 in breast cancer, uveal melanoma, and cervical cancer. 9,17,24 The authors demonstrated that FTH1P3 targeted miR-377-3p and modulated miR-377-3p expression. Furthermore, the authors have demonstrated that LDHA is the target of miR-377-3p, and FTH1P3 promoted LDHA expression by suppressing miR-377-3p, suggesting that FTH1P3 is involved in LSCC by regulating miR-377-3p/LDHA axis. LDHA is an enzyme that catalyzes the conversion of pyruvate into lactate and is a key component in glycolysis. More importantly, it serves as a target for the suppression of tumor growth and invasiveness. 25 Given all these findings, the authors speculate that FTH1P3 can inhibit miR-377-3p and enhance LDHA expression and induce pyruvate conversion into lactate and promote glycolysis, resulting in the promotion of LSCC tumorigenesis (Supplementary Fig. S1). More importantly, the in vivo results obtained in this study indicated that knockdown of E2F1 reduced FTH1P3 expression and inhibited tumor growth in vivo, further supporting the in vitro results. The authors demonstrated that depletion of FTH1P3 mitigated E2F1-induced cell viability and glycolysis in AMC-HN-8 cells, suggesting that FTH1P3 plays an important role in E2F1-induced LSCC, at least partially through promoting glycolysis using miR-377-3p/LDHA axis. However, few questions remain unanswered as to whether or not FTH1P3 can target other miRs apart from miR-377-3p in LCSS, and whether there are other lncRNAs that can reduce or promote glycolysis in LCSS, which warrant further investigation.
In conclusion, the authors demonstrated that E2F1-induced FTH1P3 promoted cell viability and glycolysis through miR-377-3p/LDHA axis in LSCC, which could be a promising novel therapeutic strategy for LSCC.
Footnotes
Authors' Contributions
L.Z. designed the study, supervised the data collection, and analyzed the data, Y.Z. interpreted the data and prepared the article for publication, and L.Z. and L.S. supervised the data collection, analyzed the data, and reviewed the draft of the article. All authors have read and approved the article.
Ethics Approval
Ethical approval was obtained from the Ethics Committee of Sir Run Run Shaw Hospital, Medical College of Zhejiang University.
Statement of Informed Consent
Written informed consent was obtained from a legally authorized representative(s) for anonymized patient information to be published in this article.
Availability of Data and Materials
All data generated or analyzed during this study are included in this published article.
Disclosure Statement
No competing financial interests exist.
Funding Information
This work was supported by the Zhejiang Traditional Chinese Medicine Scientific Research Fund Project (No. 2021ZA012) and Medical Science and Technology Project of Zhejiang Province (No. 2019313124).
Supplementary Material
Supplementary Figure S1
References
Supplementary Material
Please find the following supplemental material available below.
For Open Access articles published under a Creative Commons License, all supplemental material carries the same license as the article it is associated with.
For non-Open Access articles published, all supplemental material carries a non-exclusive license, and permission requests for re-use of supplemental material or any part of supplemental material shall be sent directly to the copyright owner as specified in the copyright notice associated with the article.