
Abstract
Background:
Cell division cycle 45 (CDC45) plays an important role in the occurrence and development of numerous carcinomas, but its effect in laryngeal squamous cell carcinoma (LSCC) remains unclear.
Materials and Methods:
The messenger RNA and protein expression levels of CDC45 in LSCC were evaluated with a t test and the standard mean difference (SMD). The ability of CDC45 expression to distinguish the LSCC was assessed through receiver operating characteristic (ROC) curves. Gene set enrichment analysis (GSEA), protein–protein interaction, public databases, and online tools were used to explore the potential molecular mechanism of CDC45 in LSCC.
Results:
A high expression of CDC45 was identified in LSCC (SMD = 2.61, 95% confidence interval [1.62–3.61]). Through ROC curves, the expression of CDC45 makes it feasible to distinguish the LSCC group from the non-LSCC counterpart. CDC45 was relevant to the progression-free interval of LSCC patients (log-rank p = 0.03). GSEAs show that CDC45 is related to the cell cycle. CDC45, CDC6, KIF2C, and AURKB were identified as hub genes of LSCC. E2F1 may be the regulatory transcription factor of CDC45.
Conclusions:
High expression of CDC45 likely demonstrates carcinogenic effects in LSCC, and CDC45 is a potential target in screening and treatment of LSCC.
Introduction
Laryngeal cancer (LC) is an important risk to human health. Globally, there are more than 177,400 new cases of LC and over 94,700 deaths due to this disease reported each year. 1 Laryngeal squamous cell carcinoma (LSCC) is the most common subtype of LC, accounting for more than 95% of LC cases. 2 Researchers have identified some risk factors for the occurrence of LC, including chemical factors (e.g., tobacco and alcohol intake), 3 contact with asbestos, 4 and biological factors (e.g., human papillomavirus infections). 3,5 However, its molecular mechanism remains unclear. 3,5 –8
Surgery, radiotherapy, chemotherapy, and other methods have achieved good results in patients with early stage LC. 9 For patients with advanced-stage LC, total laryngectomy has also achieved a certain therapeutic effect, 10 but the quality of life remains below par due to a lack of voice function. 11 However, unfortunately, more than two-thirds of LC patients are not diagnosed until the advanced stages, 12,13 creating a challenge to the efficient treatment of LC. Therefore, it is highly significant to further explore the molecular mechanisms of LC and propose new targets for its screening and treatment.
Cell division cycle 45 (CDC45) was originally found in a yeast mutant, 14 and Cdc45, the protein it encoded is a component of the CMG (Cdc45/MCM2-7/GINS) complex. CMG is a DNA helicase closely related to DNA replication. Therefore, Cdc45 is generally considered to be an important molecule: it is required to initiate DNA replication and is recognized to be related to many diseases, such as skull fusion 15 and type 1 diabetes. 16
CDC45, containing gene symbol CDC45 and the protein Cdc45 has also been studied extensively due to its high expression in a variety of cancers. For example, the expression of CDC45 increases in nonsmall cell lung cancer (NSCLC) cells. When the expression of CDC45 is knocked down through short hairpin RNA sequences, the proliferation of NSCLC cells is inhibited, thus suggesting the carcinogenic effect of CDC45. 17 Compared with normal tissues, the expression of CDC45 in hepatocellular carcinoma is reportedly upregulated 18 and associated with poor prognoses. 19 The upregulation of CDC45 expression is evident in colon cancer 20 and thyroid papillary carcinoma. 21 Interestingly, however, although the abovementioned reports and the function of CDC45 itself suggest that it plays an important role in the occurrence and development of carcinomas, no relevant report of CDC45 in LSCC exists so far. Therefore, this work contributes to the literature by exploring the clinical significance and molecular mechanism of CDC45 in LSCC.
The authors began this study by using public data sets to explore the messenger RNA (mRNA) expression level of CDC45 in LSCC and performing experiments to verify the protein expression of Cdc45. The authors simultaneously evaluated the clinical significance of CDC45 from three aspects: the relationship between the expression of CDC45 and the clinical parameters of LSCC patients, the ability of CDC45 to distinguish LSCC patients from their non-LSCC counterparts, and the relationship between CDC45 and the prognosis of LSCC patients. They analyzed the potential molecular mechanism of CDC45 in LSCC in relation to two aspects: CDC45-related signal pathways and CDC45 upstream regulatory transcription factors (TFs).
Materials and Methods
Collection of microarrays
Microarrays related to mRNA expression of CDC45 in LSCC were collected from the Gene Expression Omnibus (GEO,
Collection of RNA-Seq data
The RNA-Seq data set was screened and collected through The Cancer Genome Atlas (TCGA) database. Clinical information for the RNA-Seq samples was obtained from the University of California-Santa Cruz (UCSC) Xena database.
Clinical sample collection and immunohistochemistry experiment
The research was approved by the Ethics Committee of the First Affiliated Hospital of Guangxi Medical University, China (Approval number: 2021[KY-E-117]). Three formalin-fixed paraffin-embedded tissue microarrays (HNT961, HNT962, and HNT1021) were purchased from Pantomics Incorporated.
Immunohistochemistry (IHC) experiments were performed following the instructions of the manufacturer as follows. Each tissue slide was deparaffinized, rehydrated, and placed in boiling 0.01 M citrate buffer (pH 6.0) to extract the antigen. A 3% H2O2 solution was used to block endogenous peroxidase activity. The first antibody, an antihuman (rabbit) Cdc45 monoclonal antibody (dilution 1:100, ab126762; ABCAM, United Kingdom), was incubated overnight at 4°C, and the negative control sections were incubated with phosphate-buffered saline. The secondary antibody labeled with horseradish peroxidase (ready to use; Long Island Antibody, Shanghai, China) was stored at room temperature (about 25°C) for 25 min. Visualization of the horseradish peroxidase was performed with 3,3′-diaminobenzidine.
After dehydration and sealing, the three microarrays were evaluated under a bright field microscope. Positive staining appeared as brown particles in the nucleus and/or cytoplasm. The three microarrays, with staining, were independently evaluated by two pathologists, each of whom evaluated positive cells in 10 randomly selected fields. Cdc45 was scored with the method at the previous report, 22 containing the staining intensity (0: no staining, 1: light staining, 2: moderate staining, 3: strong staining) and percentage of stained positive cells (0: < 5%, 1: 5%–25%, 2: 26%–50%, 3: 51%–75%, 4: >75%). The total IHC score was calculated as the product of the intensity score and the score of percentage of stained positive cells.
Clinical significance of CDC45 in LSCC
The relationship between the expression level of CDC45 and the clinical parameters of the LSCC patients (age, clinical stage, tumor stage, node stage, gender, and neoplasm histologic grade) was analyzed in R (v3.6.1) using a t test.
The ability of CDC45 to distinguish LSCC from non-LSCC tissues was evaluated by the area under the curve (AUC) values of the receiver operating characteristic (ROC) and summary ROC (sROC) curves. The AUC values ranged from 0 to 1; the larger the value, the better the ability of CDC45 to distinguish LSCC from non-LSCC tissues. The ROC curve was drawn in GraphPad Prism 8. The forest plot (including sensitivity and specificity) and sROC curve were drawn in Stata 15.
The survival and prognosis of the high- and low-expression groups of CDC45 were described by the Kaplan–Meier curve, and statistical inference was evaluated with the help of the log-rank test. The hazard ratio calculation between the two groups (high- and low- CDC45 expressions) was completed by Cox regression. The research on the prognostic significance of CDC45 was conducted in R with the help of the survminer and survival packages.
Potential mechanism of CDC45 in LSCC
Samples of the RNA-Seq data set were divided into high- and low-expression groups based on the median expression value of CDC45. Gene Ontology (GO) terms and Kyoto Encyclopedia of Genes and Genomes (KEGG) pathways related to CDC45 were explored through gene set enrichment analysis (GSEA) in GSEA software (v4.0.3). The gene sets used in
Based on the RNA-Seq data set, differential expression genes (DEGs) of LSCC were identified by the edgeR package in R, with |log2 (fold change)| > 1 and false discovery rate <0.05. Heatmaps were then performed using the heatmap package and TF tools. 23 With the absolute value of the Pearson coefficient >0.5, CDC45-related DEGs were selected. Next, protein–protein interaction (PPI) of the CDC45-related DEGs was performed in the Search Tool for the Retrieval of Interacting Genes/Proteins (STRING). Using Cytoscape (v3.7.2), hub genes were screened based on the degree algorithm of the CytoHub plug-in.
The upstream regulation mechanism of CDC45 was also researched by predicting the TFs that regulated CDC45 expression. The Animal Transcription Factor database (AnimalTFDB),
24
Catalog of Inferred Sequence Binding Preferences (CISBP),
24
and Cistrome Data Browser (Cistrome DB)
25
contain plenty of TFs, and the TFs of the target gene can be predicted through its promoter sequence. The sequence, including the CDC45 promoter (the 2 kb region upstream of CDC45 gene transcription start site to the 99 bp region downstream of the CDC45 gene transcription start site, chr22: 19477294-19479393) was sourced from the National Center for Biotechnology Information (
The TFs that regulate CDC45 expression were predicted from the three databases above, and the results were intersected for the initial TFs. CDC45 expression-related candidate TFs were screened through coexpression analysis through Pearson correlation analysis. The ChIP-Seq data of the Cistrome DB were used to predict the target genes of the candidate TFs so as to reversely screen and verify the potential TFs that regulated CDC45 expression. The JASPAR database was used to explore the relationship between CDC45 and the binding sequence of each candidate TF, and the ggseqlogo 26 and ggplot2 packages in R were applied to plot a seqlogo. Visualizations of the gene position relationships between the potential TFs and CDC45 promoter sequence were completed in the UCSC Genome Browser. 27
Statistical analysis
Except for the raw counts of RNA-Seq, which were used to identify the DEGs, the expression value of CDC45 in the microarrays and RNA-Seq data sets was log2(x + 1) logarithmically transformed. The scatter plots comparing the average expression level of CDC45 between the LSCC and non-LSCC groups were completed in GraphPad Prism 8. Moreover, the difference in the mean expression levels of CDC45 between the LSCC and non-LSCC samples was evaluated according to the t test in SPSS Statistics 22. The standardized mean difference (SMD) calculation and the forest and funnel plots were performed in Stata 15.
According to the results of the forest plot, if the 95% confidence interval (CI) of the SMD did not contain 0, the difference was statistically significant. If I 2 (the I 2 test) is less than or equal to 50%, or the p-value of the Chi-square test is greater than or equal to 0.1, there is no heterogeneity in the results, and a fixed effects model should be used. However, I 2 > 50% or p < 0.1 denotes that the results of the forest plot are heterogeneous, and a random effects model ought to be applied. In this study, unless otherwise specified, p < 0.05 indicated that the difference was statistically significant. The core steps of this research are shown in Figure 1.
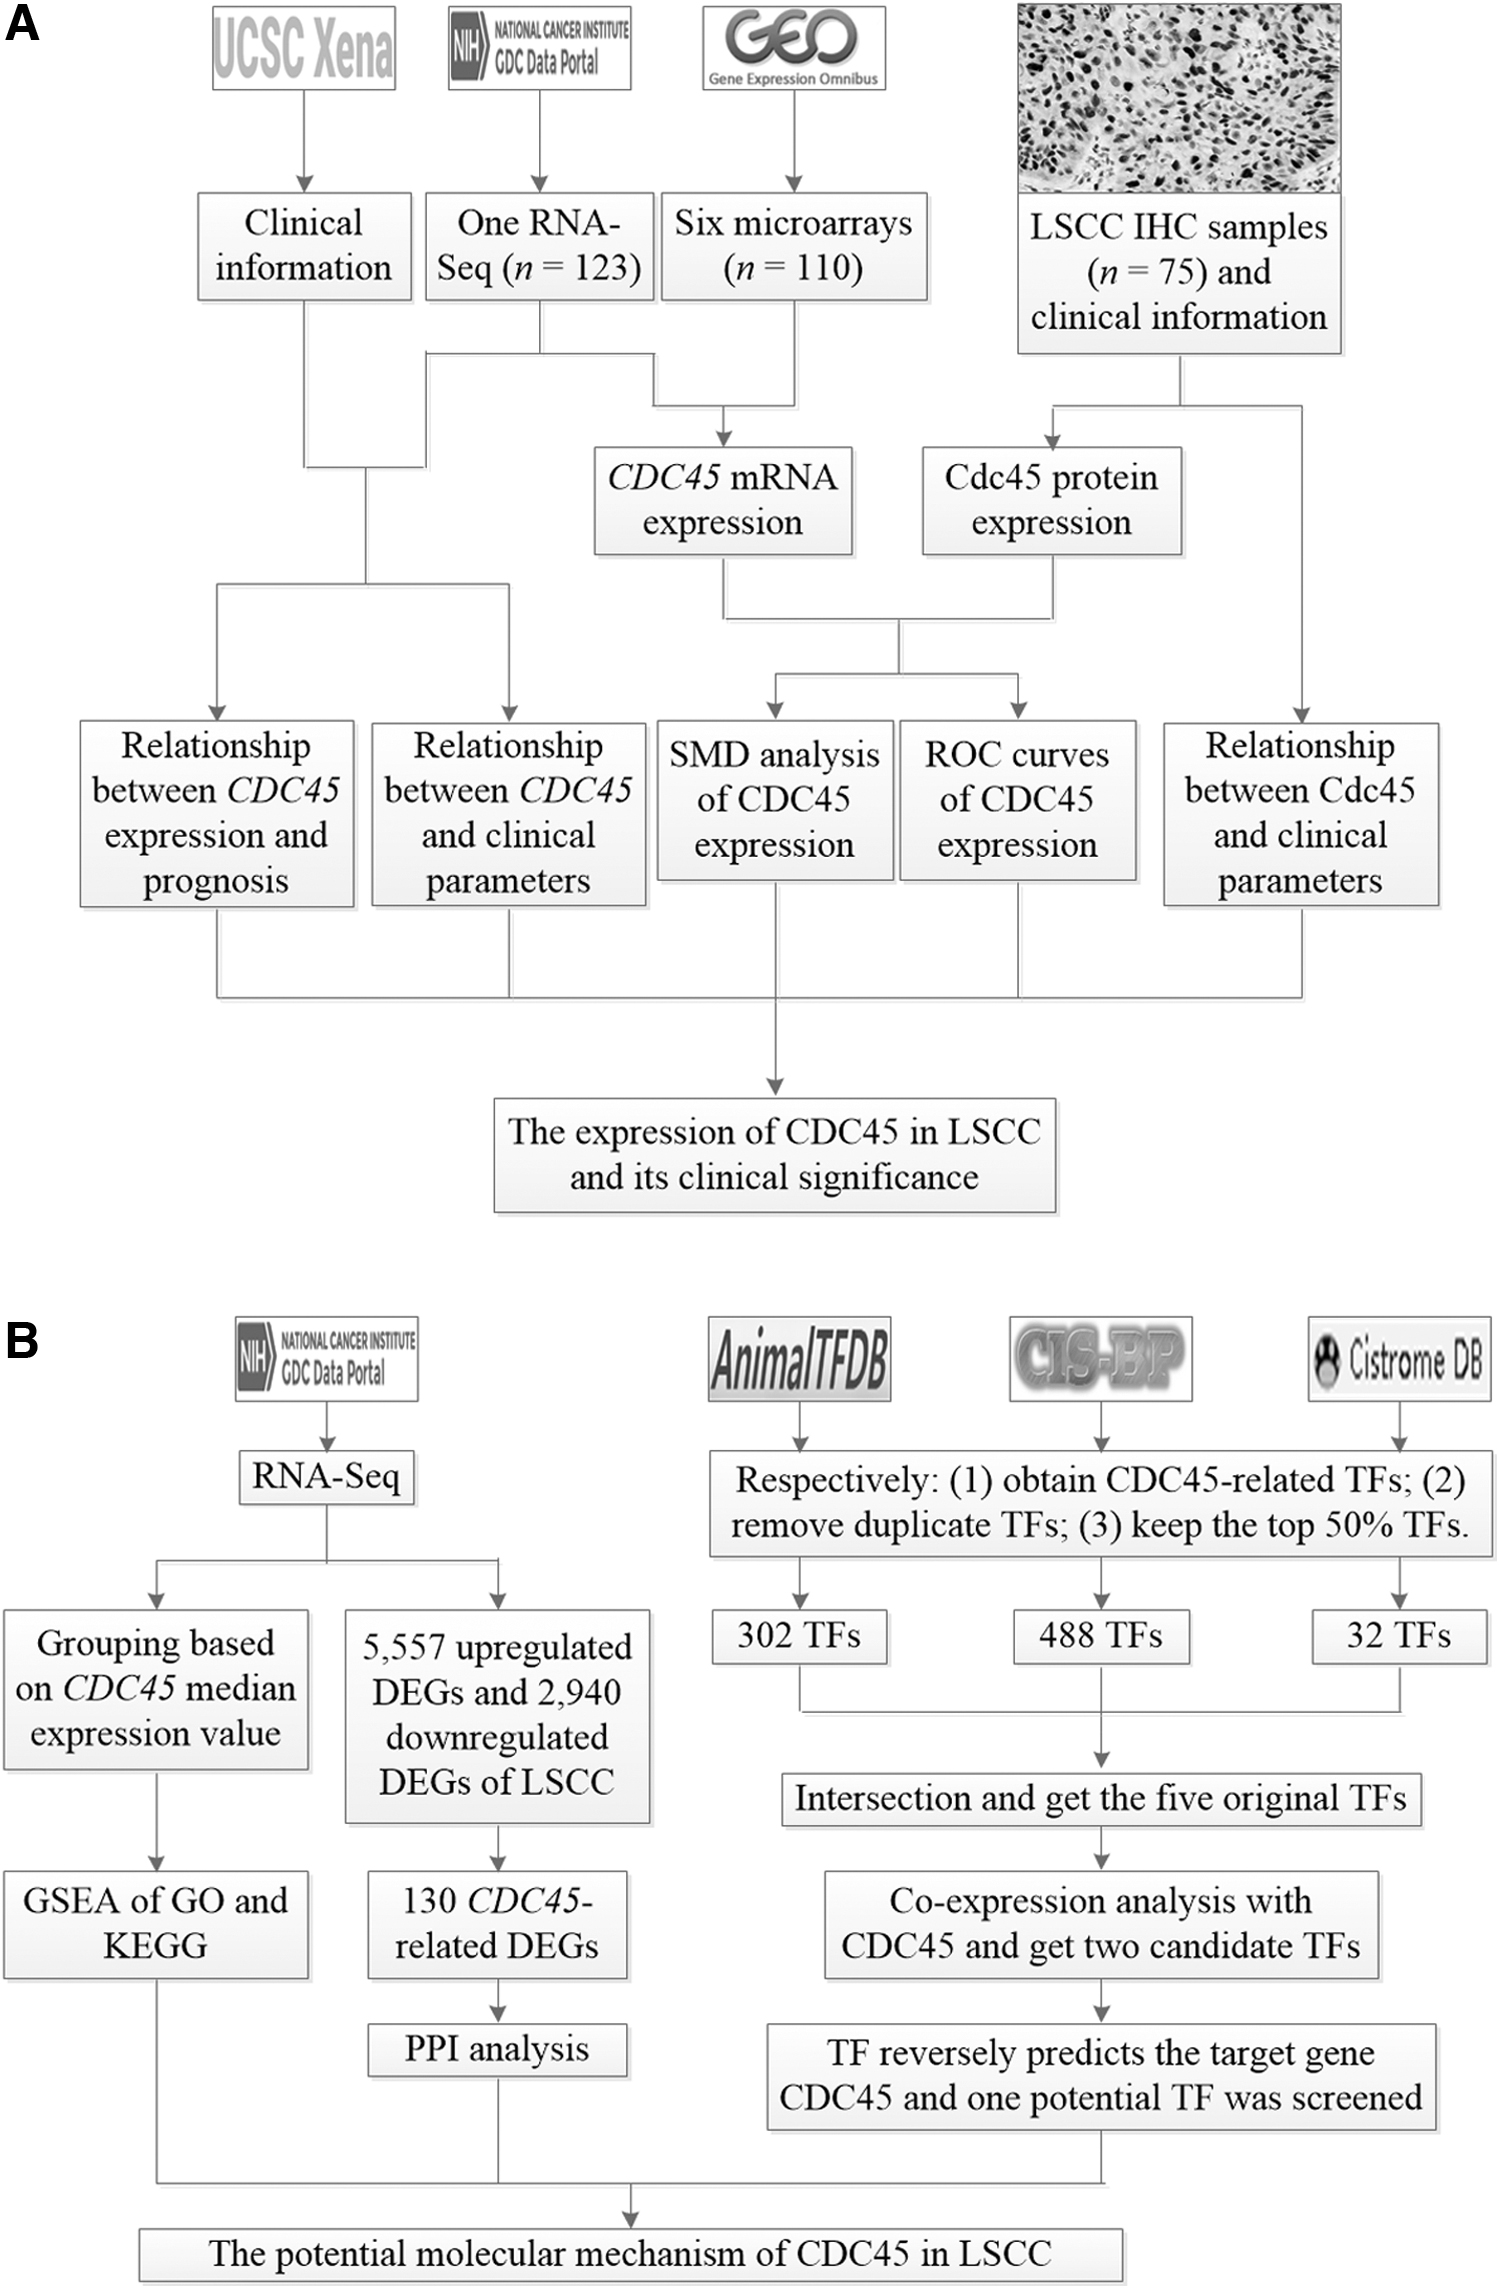
Flow charts of this study.
Results
Information on the included samples
A total of seven data sets were screened and collected for this study: six microarrays from GEO and one RNA-Seq data set from TCGA. These data sets contained a total of 173 LSCC samples and 60 non-LSCC control samples. The characteristics of each data set are shown in Table 1, and the selection process and results can be seen in Figure 1A. The three tissue microarrays contained a total of 49 LSCC samples and 26 non-LSCC control samples for the IHC experiments. Tables 1 and 2, respectively, contain the basic characteristics of the IHC data set and basic clinical information of the samples.
The Basic Features of the Seven Data Sets and In-House Tissue Microarrays of the CDC45 Expression Level and Corresponding Data for Screening Test
Protein expression of Cdc45.
CDC45, cell division cycle 45; FN, false negative; FP, false positive; IHC, immunohistochemistry; LSCC, laryngeal squamous cell carcinoma; SD, standard deviation; TCGA, The Cancer Genome Atlas; TN, true negative; TP, true positive.
Basic Clinical Information of Samples Used to Study the Relationship Between CDC45 Expression Level and Clinical Parameters
p-Value of t test based on CDC45 expression level between two groups.
Neoplasm histologic grade.
mRNA, messenger RNA.
Expression of CDC45 in the LSCC and non-LSCC groups
As shown in Figure 2A–G, the mRNA expression level of CDC45 in the LSCC group was significantly higher compared with the non-LSCC control group. Except for the GSE84957 data set (Fig. 2E), the results demonstrated that the mRNA expression level of CDC45 was statistically significant (p < 0.05) between the LSCC and non-LSCC groups.
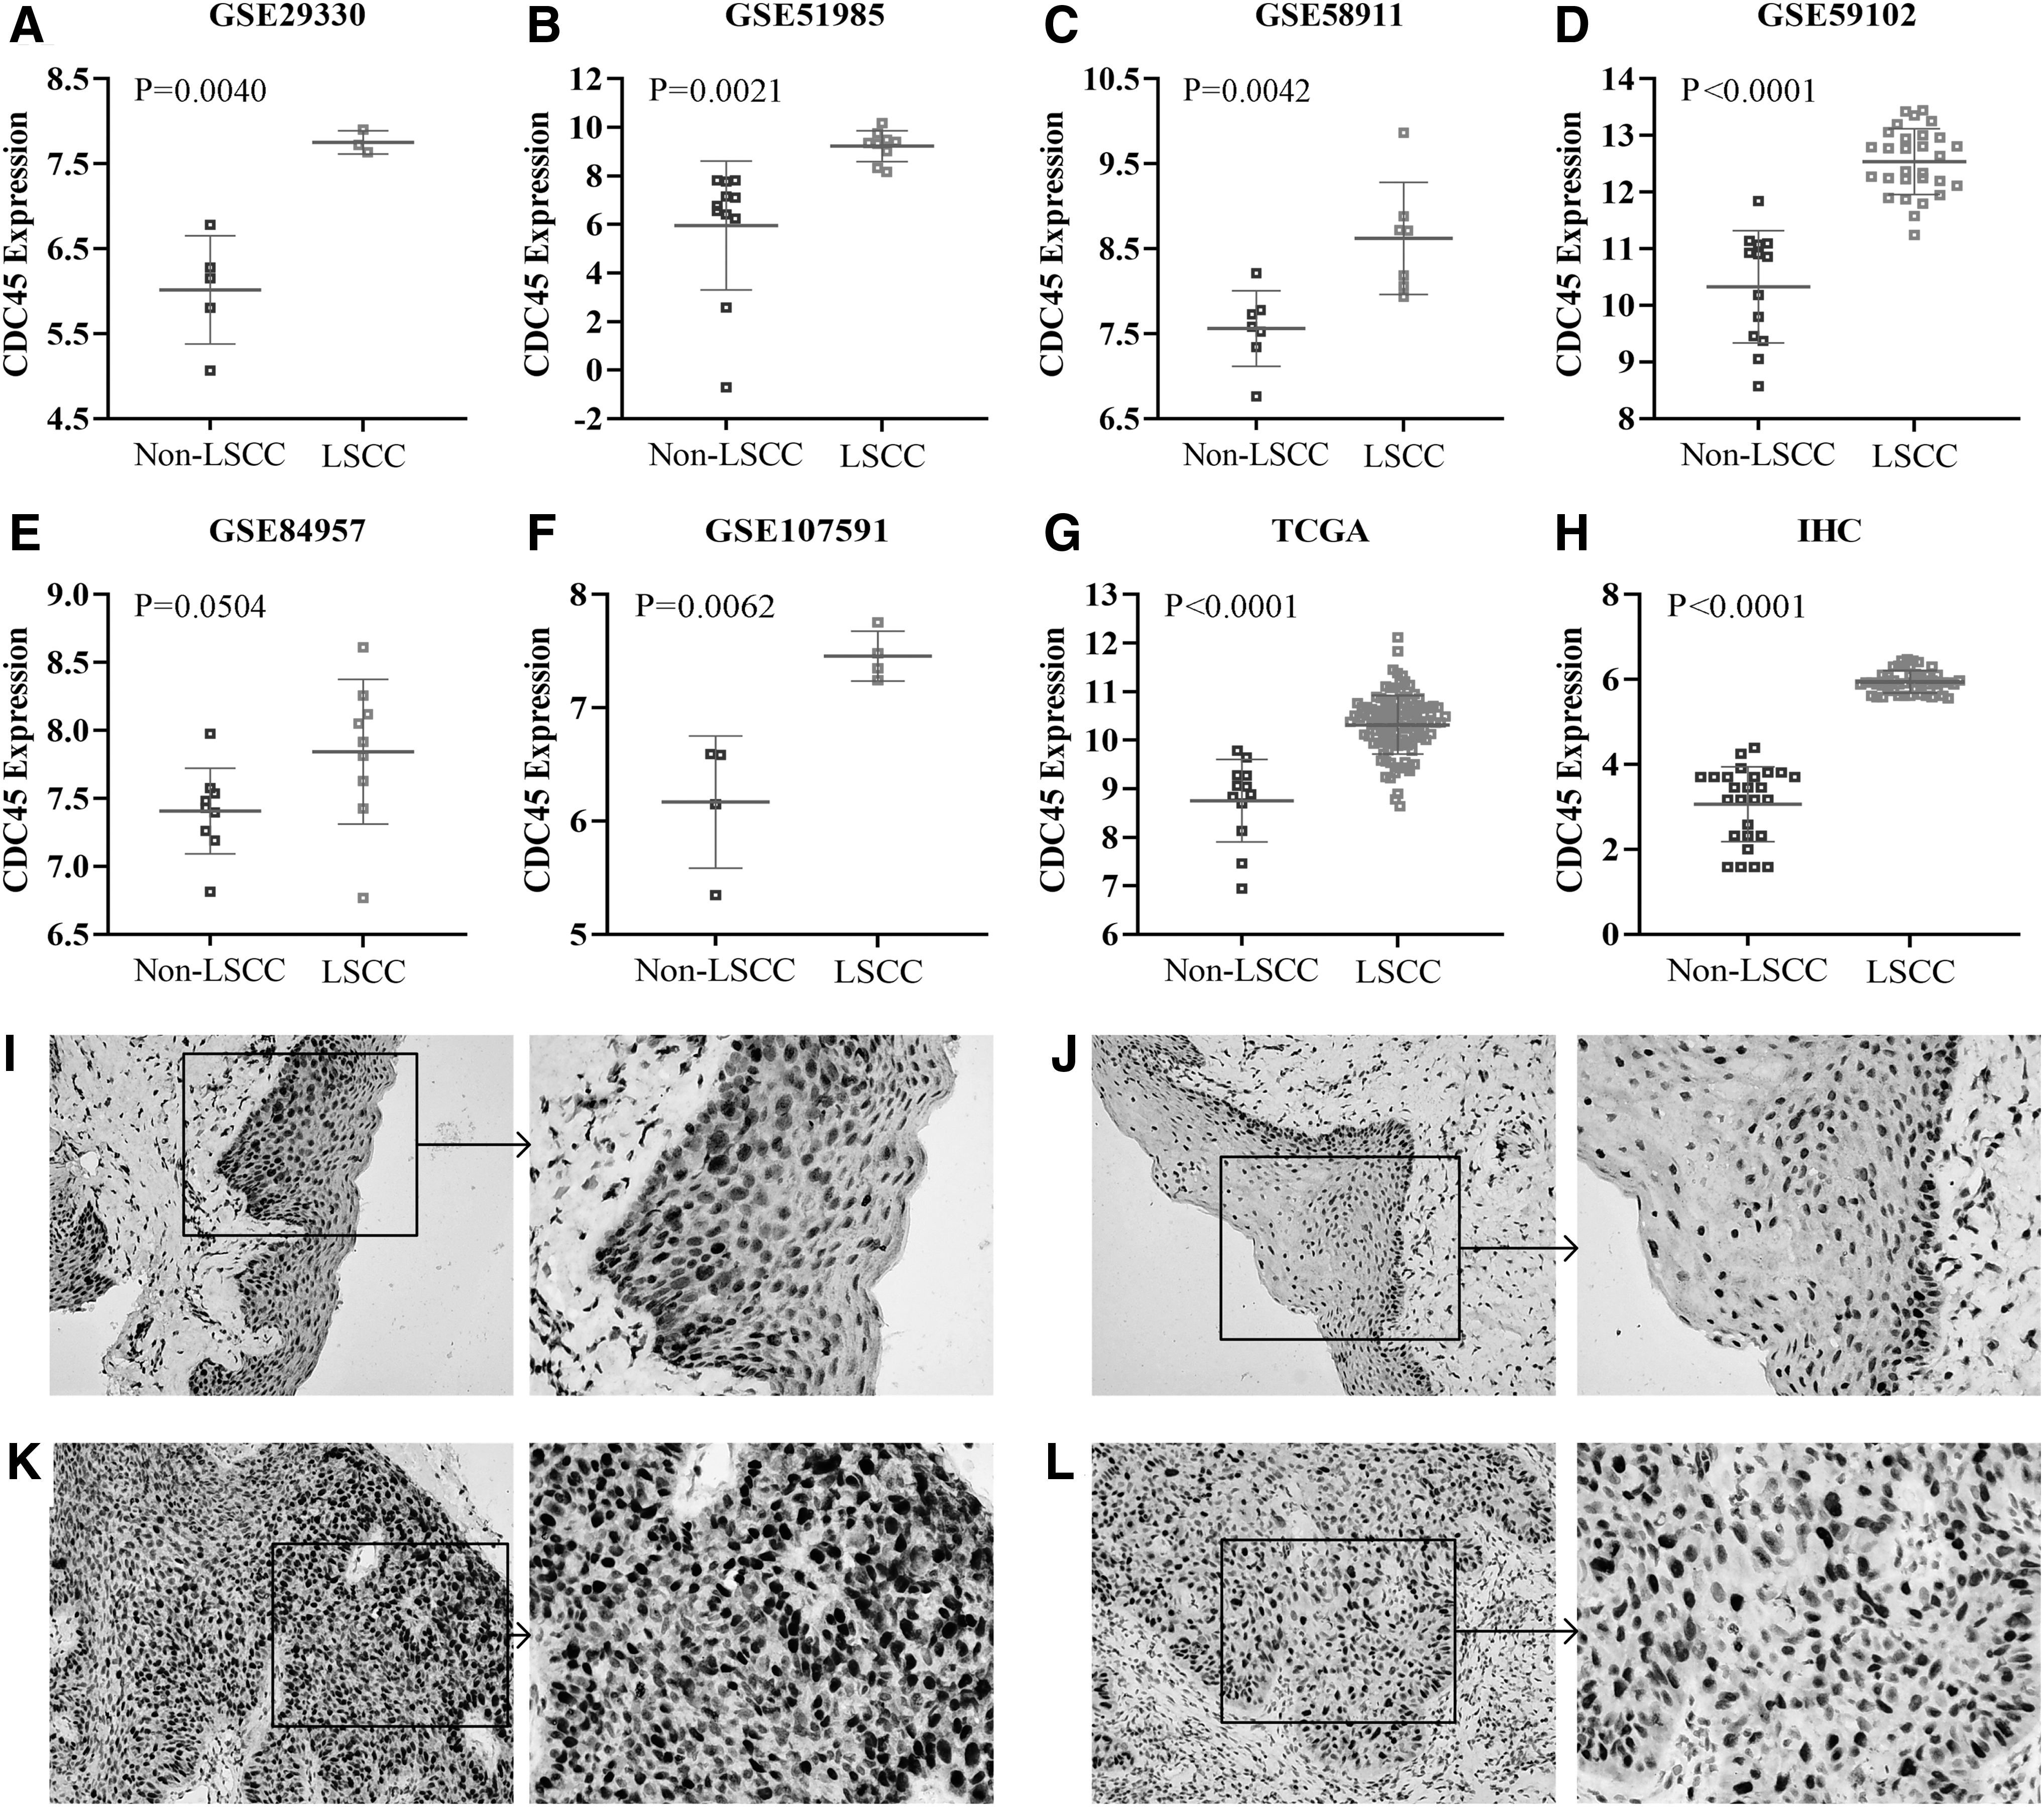
The mRNA
We conducted IHC experiments on the clinical samples to verify the difference in the expressions of Cdc45 between the LSCC and non-LSCC groups at the protein level. The scatter plots clearly revealed the difference in the expression levels of Cdc45 between the two groups as well as its statistical significance (Fig. 2H). The IHC microscopic results showed that upregulated Cdc45 expression was absent in the non-LSCC group (Fig. 2I, J) but present in the LSCC samples (Fig. 2K, L). It can be seen that Cdc45 expression in the LSCC group was significantly higher compared with the non-LSCC samples, which was consistent with the mRNA results.
SMD calculation of CDC45 expression between the LSCC and non-LSCC groups
The results of the forest plot (Fig. 3A) showed that I 2 > 50% and p < 0.1, indicating that the SMD results were quite heterogeneous, and thus, a random effects model was suitable for calculating the SMD. In summary, the overall SMD, SMD of the mRNA subgroup, and SMD of the protein group were greater than 0, and the 95% CI did not contain 0; these results consistently indicated that the CDC45 expression level of the LSCC group was upregulated compared with that of the non-LSCC samples. Furthermore, regarding the funnel plot, Egger's test showed a p-value >0.05 (p = 0.932; Fig. 3B), suggesting that no publication bias existed in the SMD results.
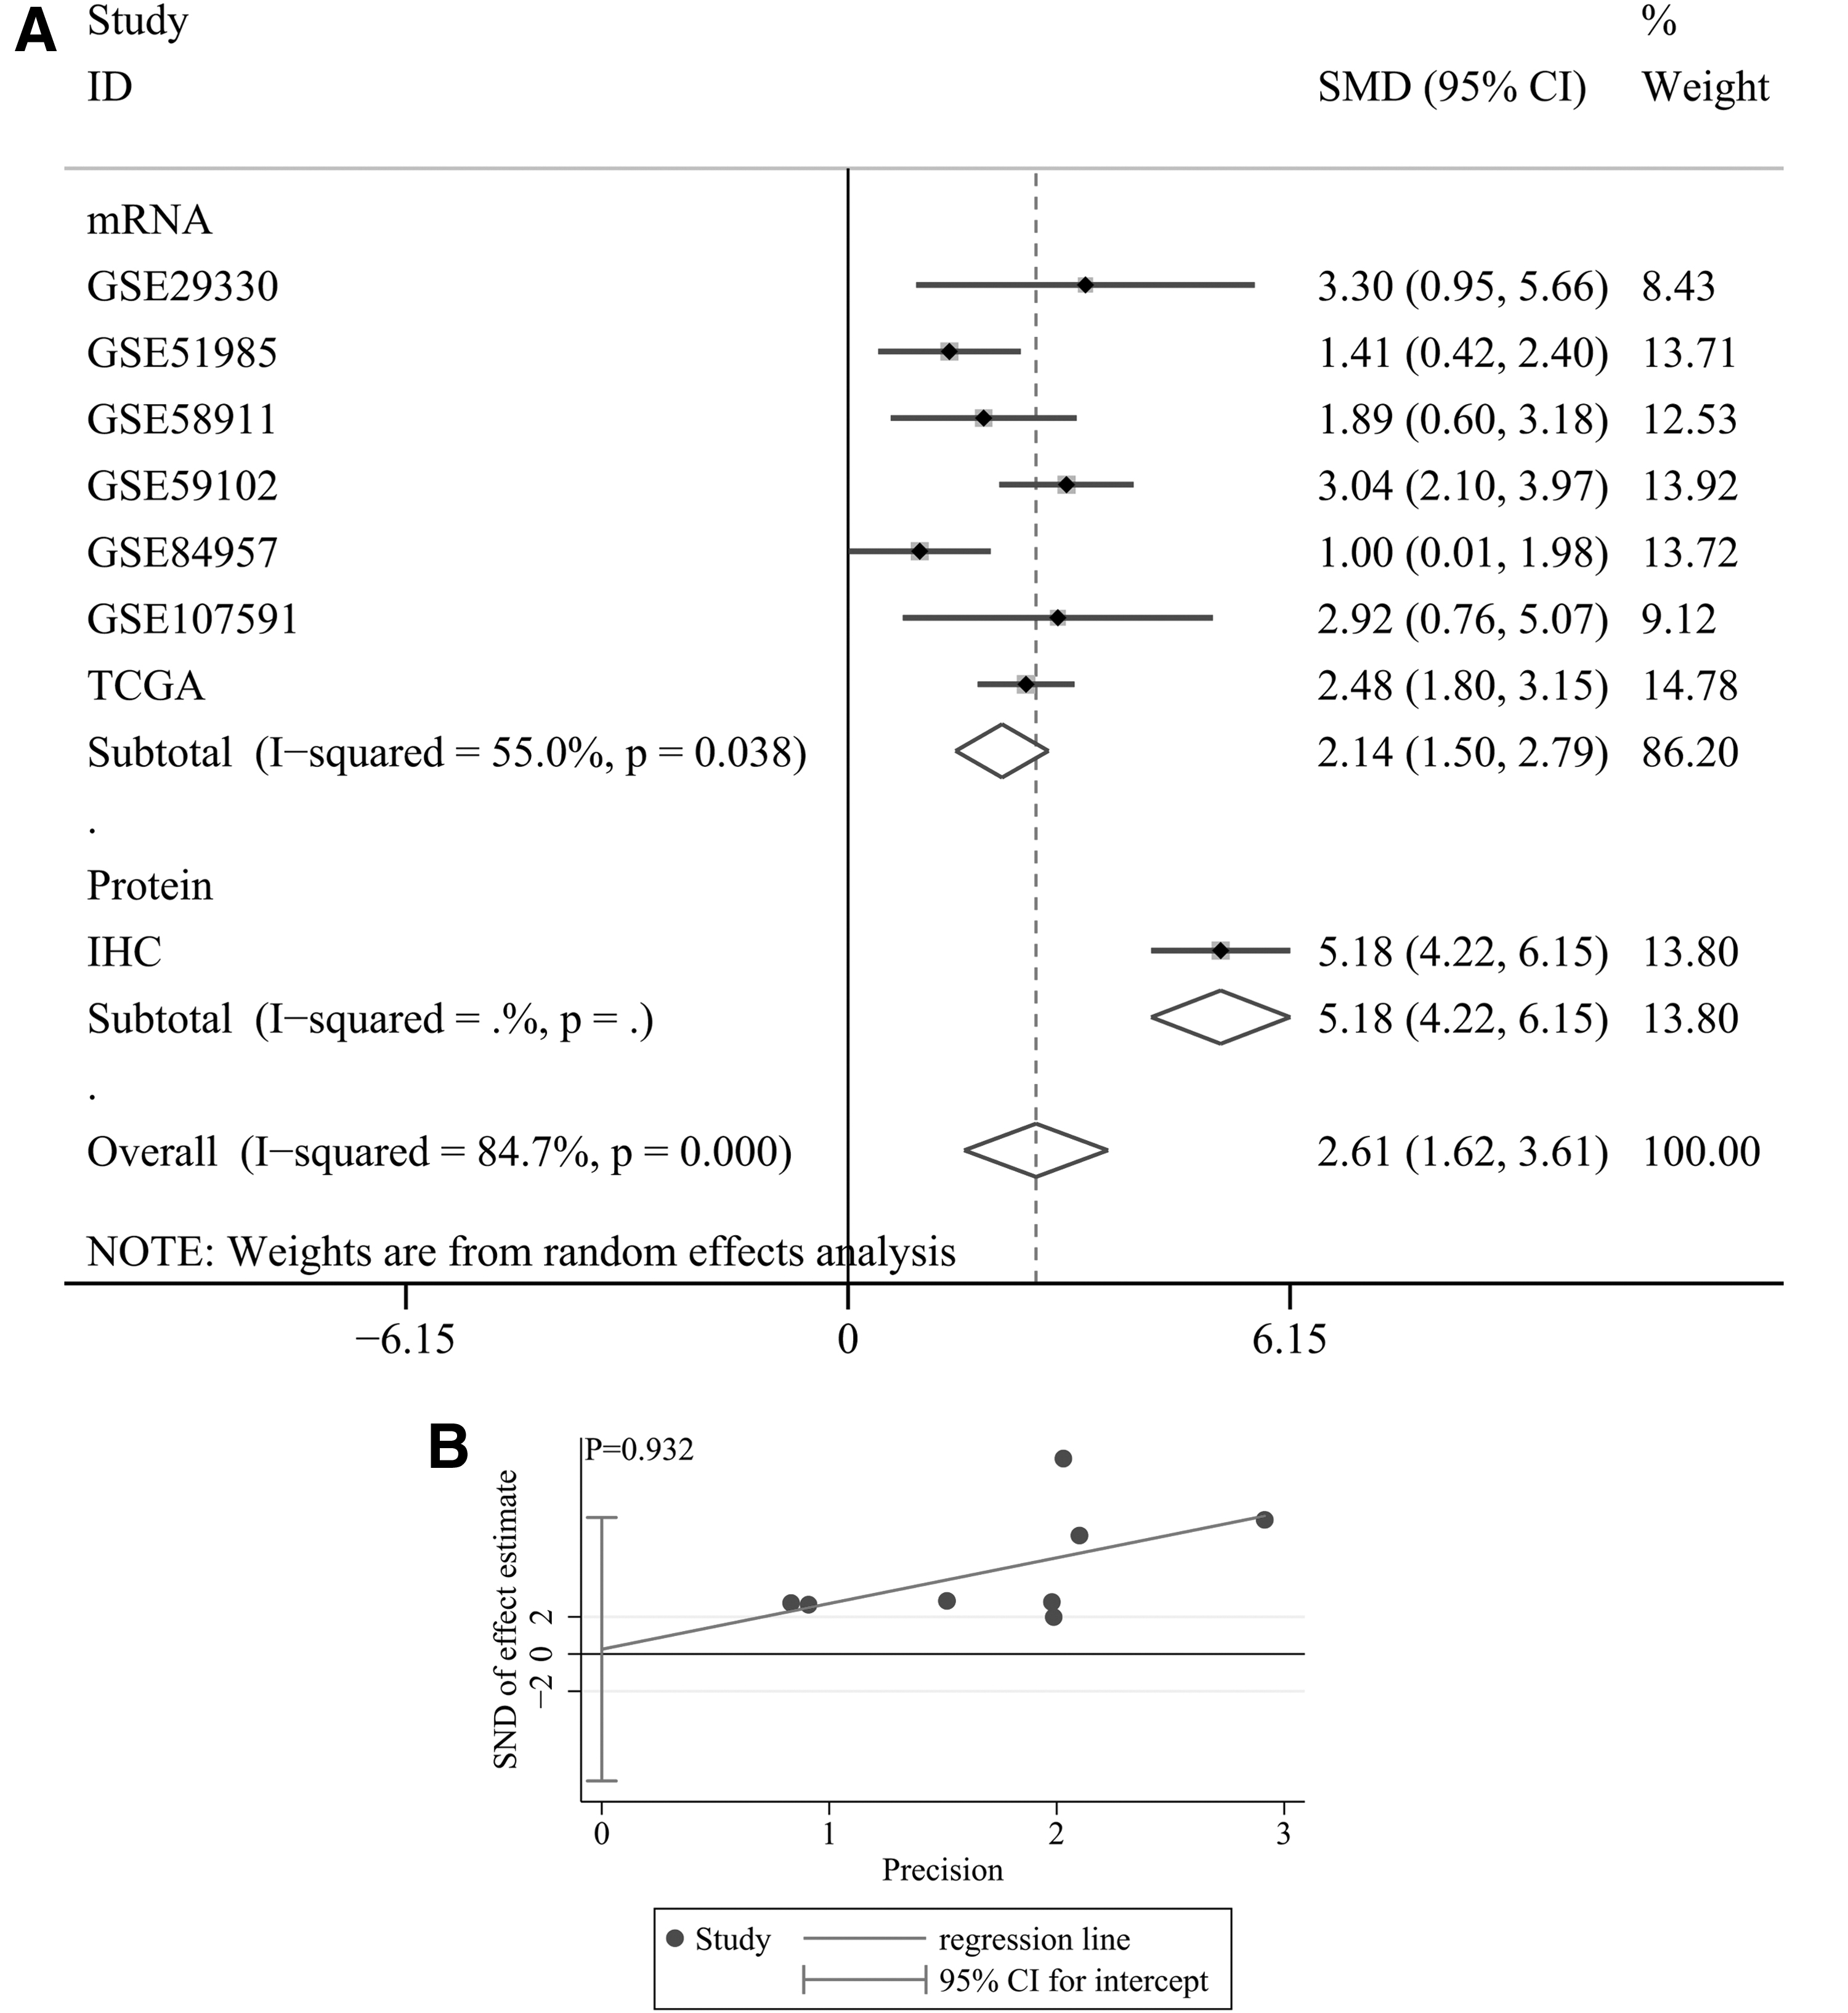
Forest plot of evaluating SMD of CDC45 expression between LSCC group and nontumor group
Clinical significance of CDC45 in LSCC
Clinical information on the LSCC samples included in the study can be seen in Supplementary Table S1. No correlation existed between CDC45 or Cdc45 expression and age, clinical stage, tumor stage, and node stage (p > 0.05, Table 2). However, based on the results of the RNA-Seq data set, CDC45 mRNA expression correlated with the gender (male vs. female) and neoplasm histologic grade (G3 vs. G1-G2) of the LSCC patients (p < 0.05; Fig. 4 and Table 2).
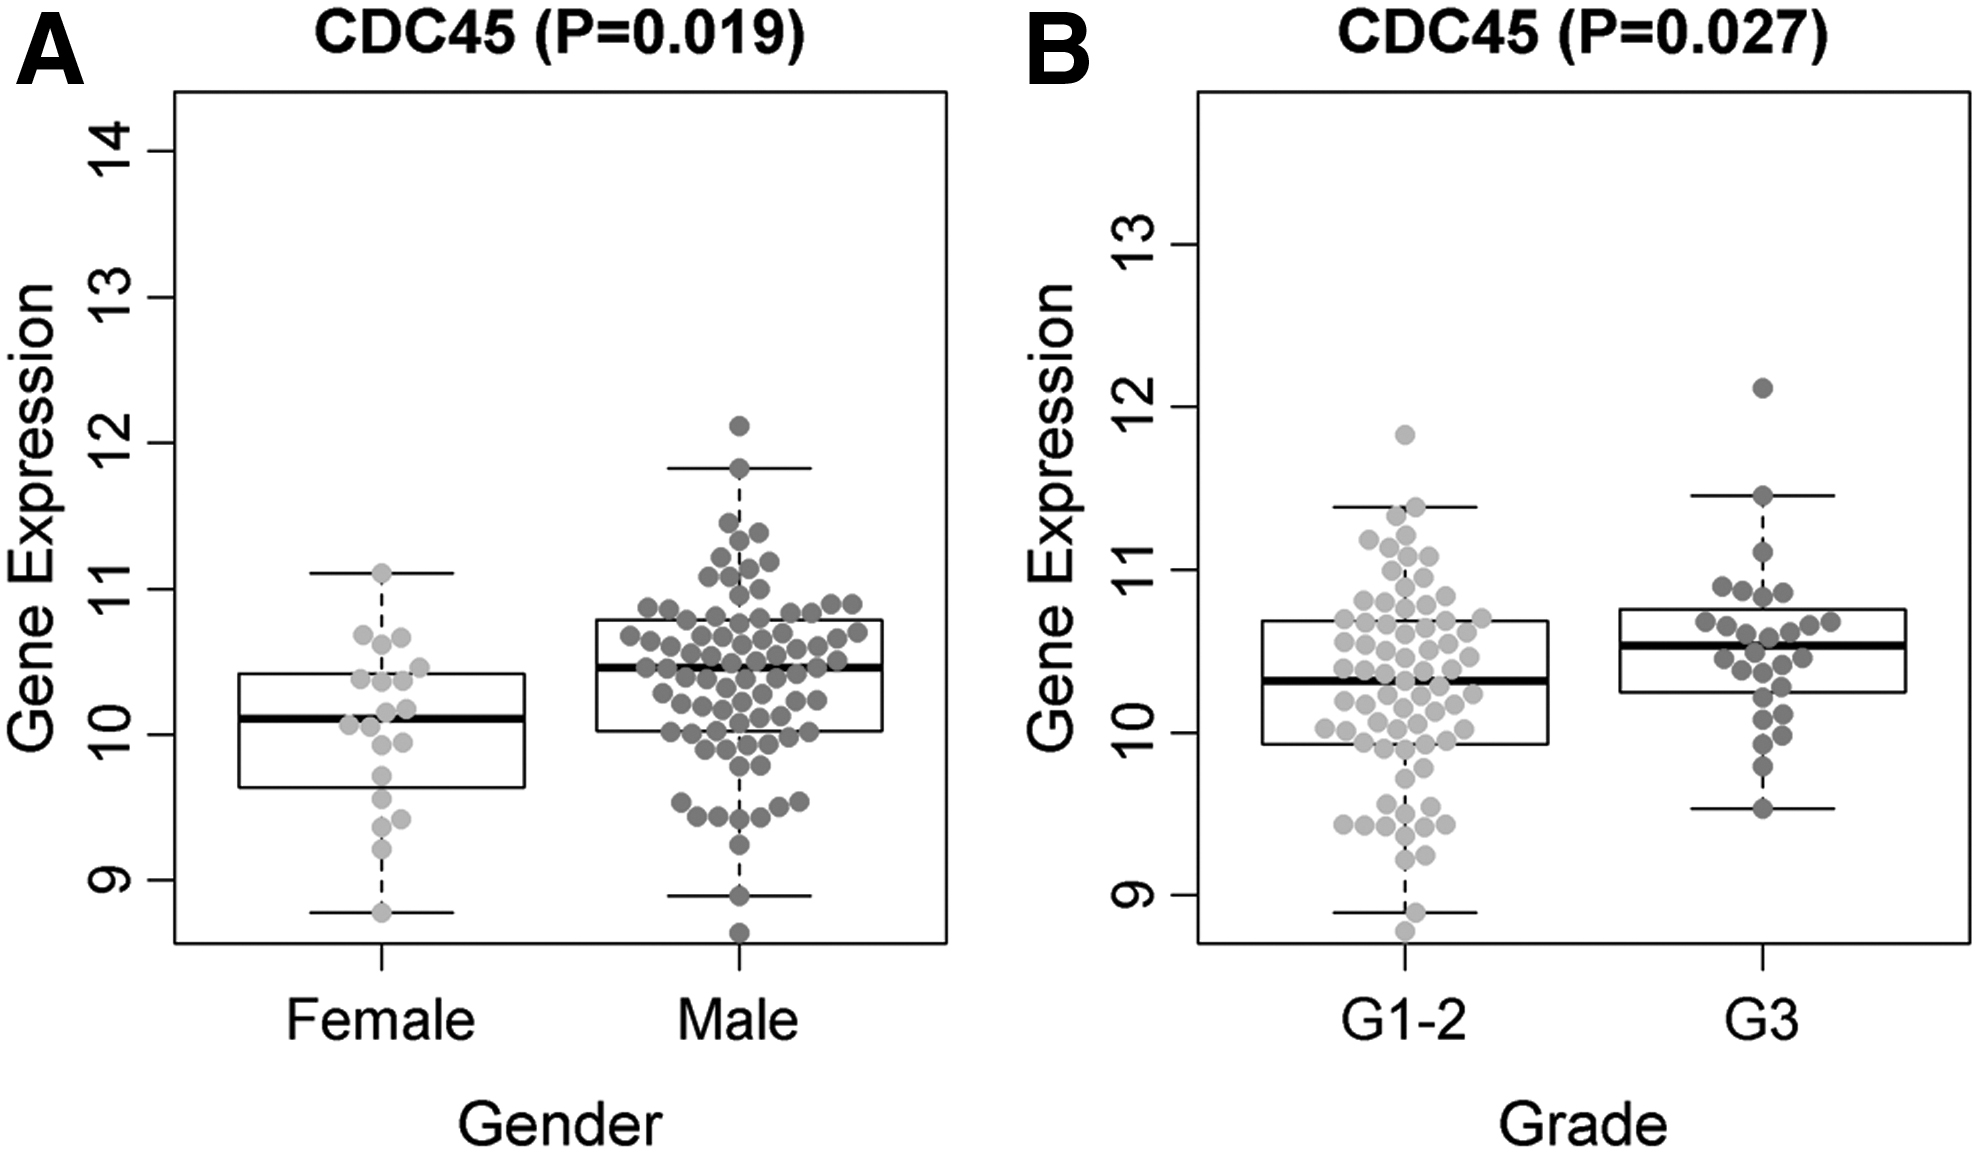
The relationship between CDC45 expression level and gender
In terms of CDC45 distinguishing the LSCC samples from the non-LSCC group, the AUC of GSE84957 was approximately equal to 0.79, while the corresponding values of the remaining seven data sets exceeded 0.93 (Fig. 5). The AUC of sROC was 0.97 (95% CI [0.96–0.98]) (Fig. 6A). The sensitivity of the CDC45 expression level with regard to distinguishing the LSCC from the non-LSCC group was 0.97 (95% CI [0.81–1.00]), while the specificity was 0.96 (95% CI [0.90–0.99]), as shown in Figure 6B. These results strongly suggested that the expression level of CDC45 makes it feasible to distinguish the LSCC group from its non-LSCC counterpart.
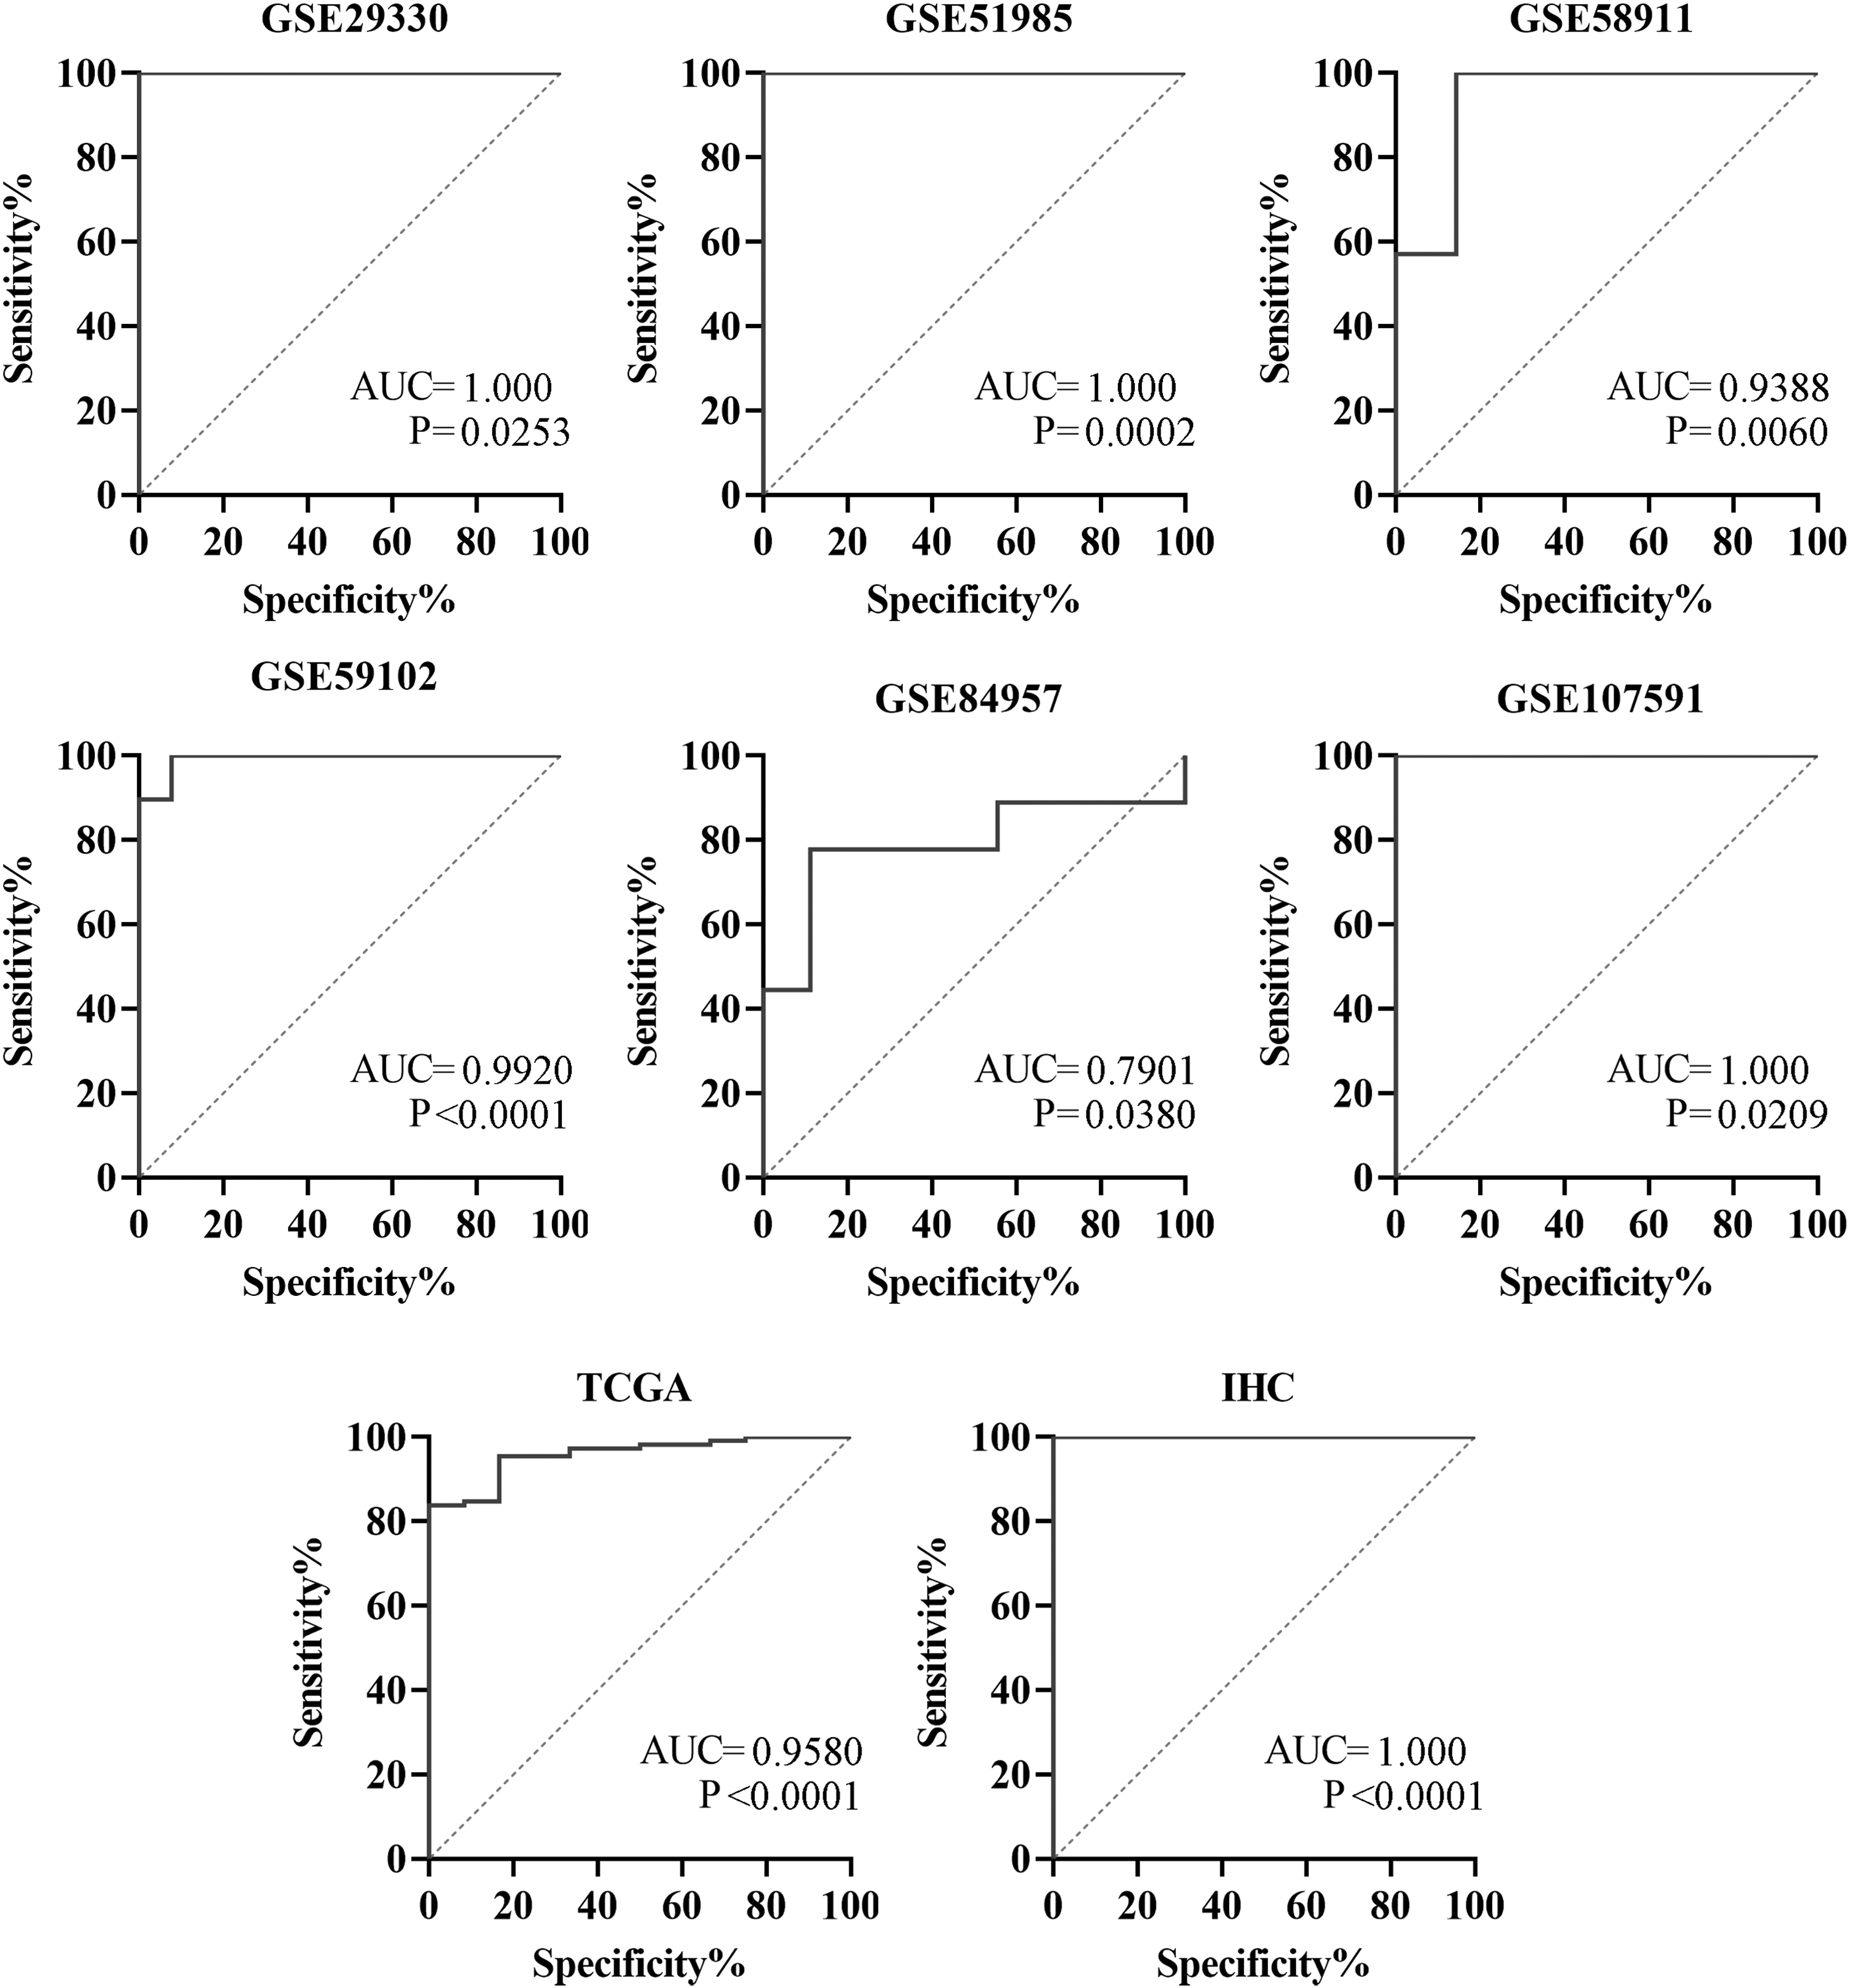
The ROC curves of CDC45 expression in the LSCC. AUC, area under curve.

sROC curve
In the LSCC sample group, the difference in the overall survival (OS) rate between the two groups with high and low CDC45 expressions was not statistically significant (log-rank p = 0.10; Fig. 7A). However, the progression-free interval (PFI) event of the low-expression CDC45 group was lower compared with its high-expression counterpart (log-rank p = 0.03; Fig. 7B). The hazard ratio (low-expression group vs. high-expression group) was 0.49 (95% CI [0.25–0.95]). Therefore, it was inferred that the high expression of CDC45 is a risk factor for PFI in LSCC patients.
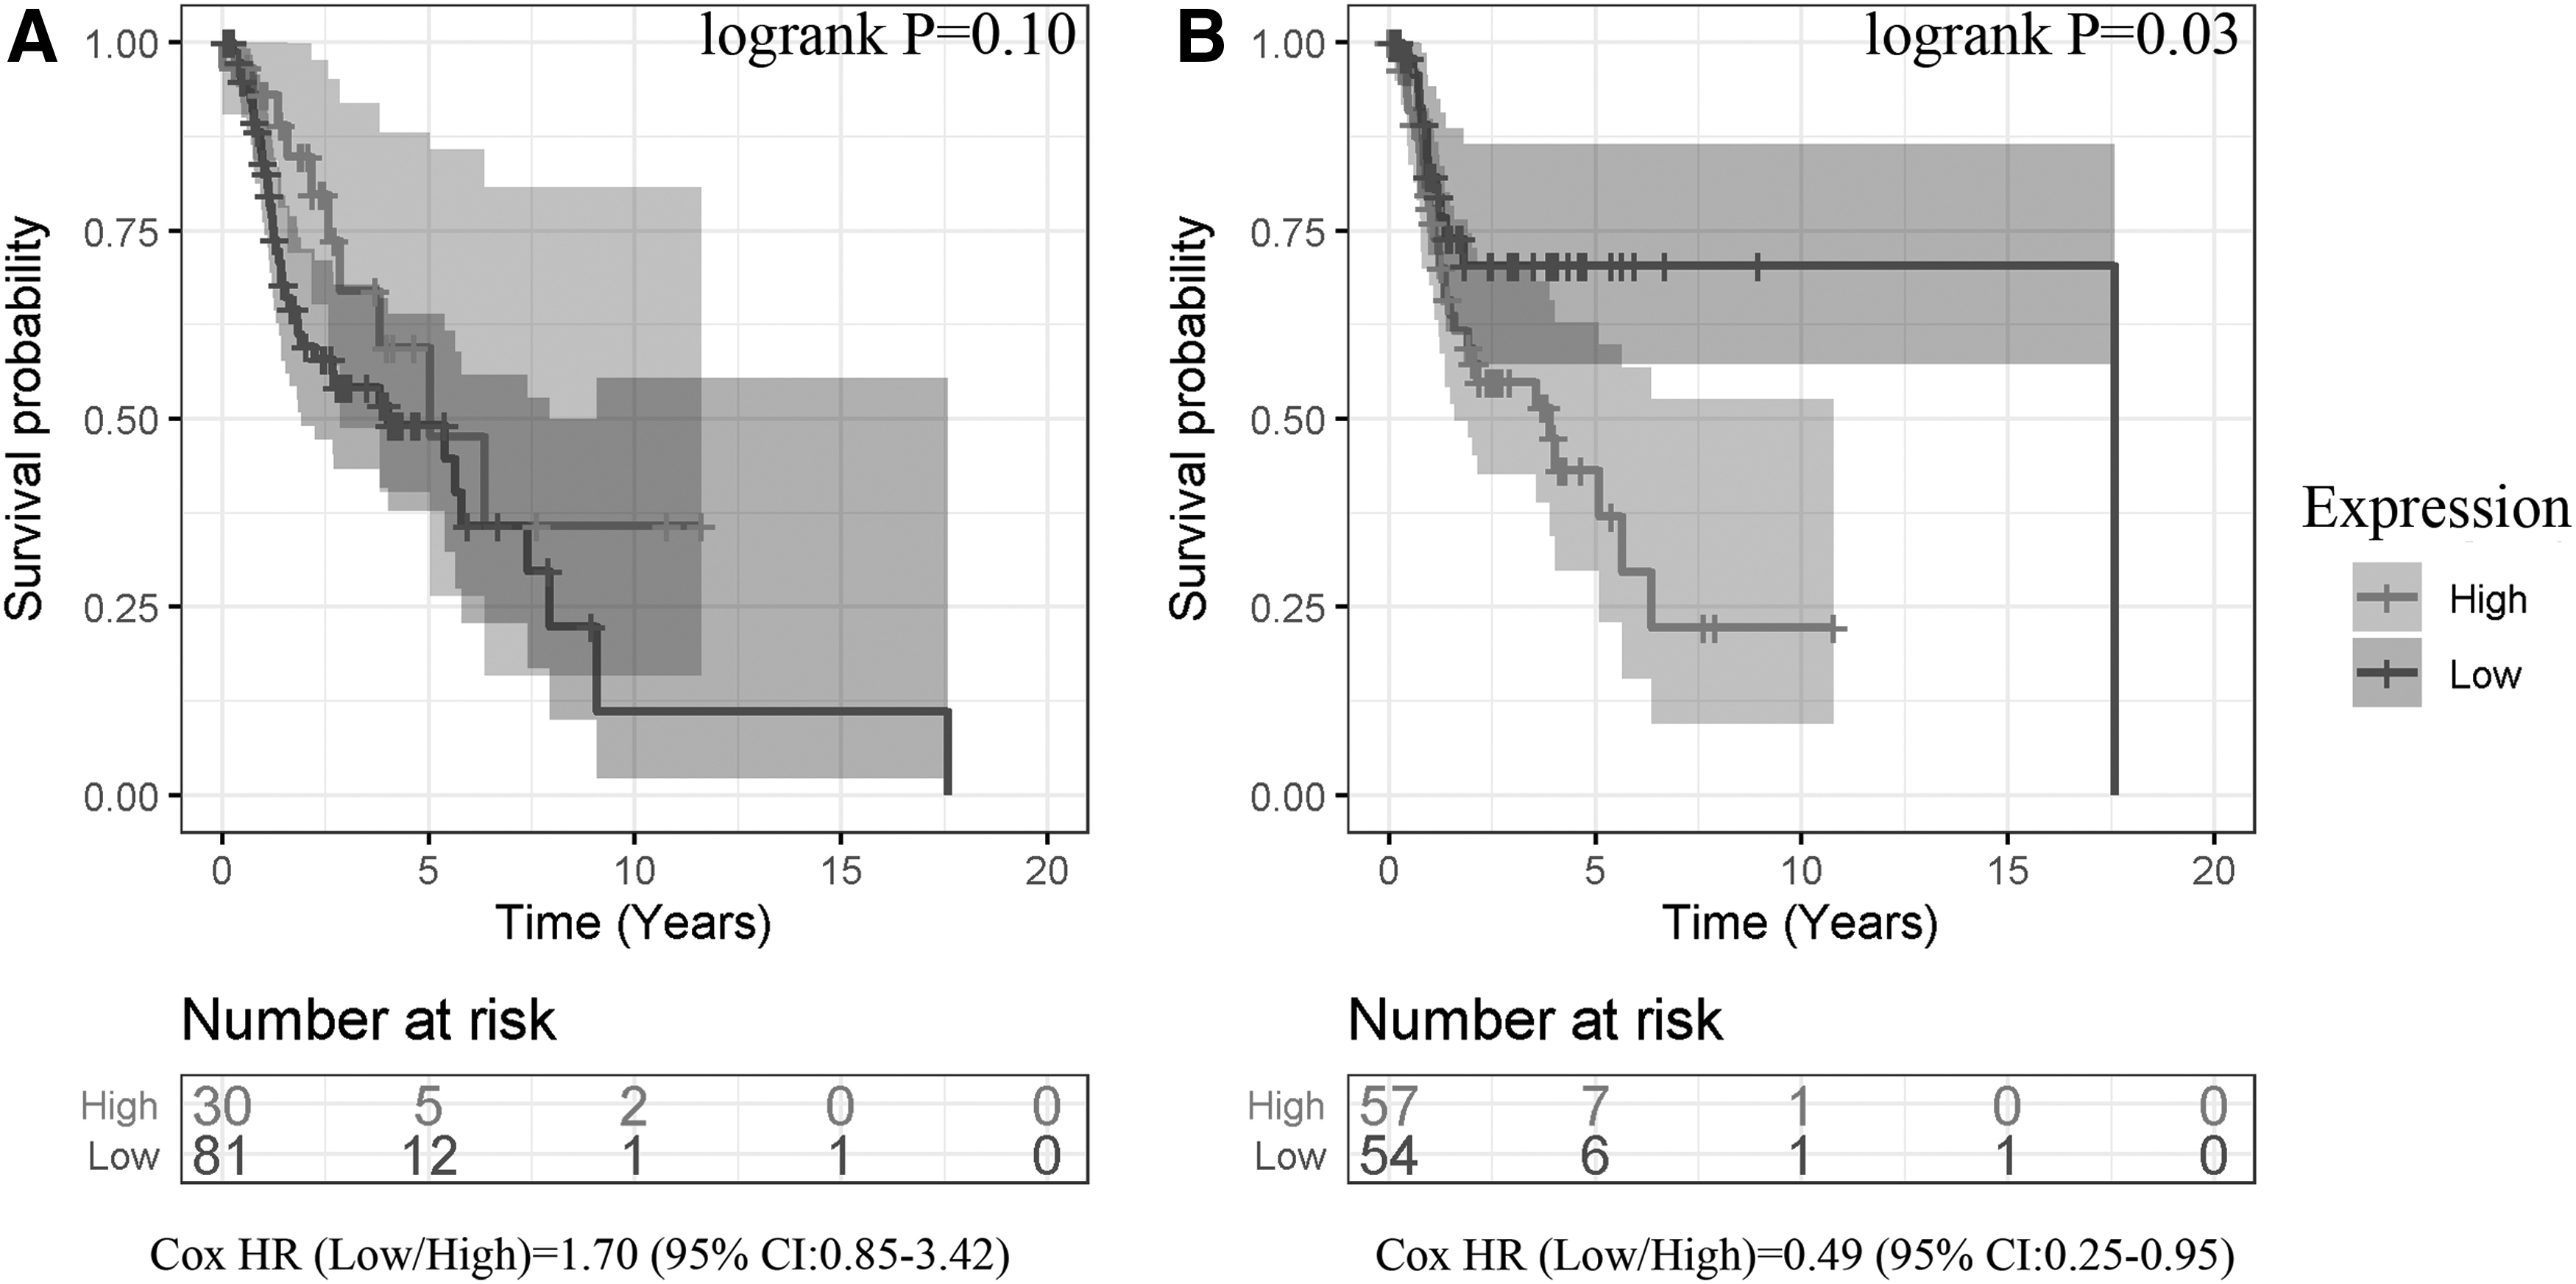
Kaplan–Meier curves reflecting relation between CDC45 expression and prognosis of patients with LSCC, based on overall survival
Potential molecular mechanism of CDC45 in LSCC
Based on the GO analysis of cellular components (Supplementary Fig. S1), the first three GO terms of genes from samples with high- CDC45 expressions (n = 56) were “CHROMOSOMAL REGION,” “CONDENSED CHROMOSOME,” and “CONDENSED CHROMOSOME CENTROMERIC REGION,” while those of the samples with low expressions of CDC45 genes (n = 54) were “MYELIN SHEATH,” “IMMUNOGLOBULIN COMPLEX,” and “IMMUNOGLOBULIN COMPLEX CIRCULATING.” The results of the other two GO terms are listed in Supplementary Figure S1B (for biological processes) and Supplementary Figure S2A (for molecular function). Moreover, as per the KEGG results, the first three pathways of genes from samples with high expressions of CDC45 were “CELL CYCLE,” “DNA REPLICATION,” and “BASE EXCISION REPAIR” (Supplementary Fig. S2B). The pathways of the sample group genes with low CDC45 expressions were “PROPANOATE METABOLISM,” “TASTE TRANSDUCTION,” and “FC EPSILON RI SIGNALING PATHWAY.”
Differential expression analysis yielded 5,557 upregulated DEGs (Fig. 8A) and 2,940 downregulated DEGs (Fig. 8B). A Pearson correlation analysis screened 130 CDC45-related DEGs (absolute value of the Pearson coefficient >0.5; data not shown), which were then entered into the STRING database for PPI analysis. Using the degree algorithm, the top four DEGs (with the highest scores) were identified as hub genes, containing CDC45, CDC6, KIF2C, and AURKB (Fig. 8C). The expressions of the four hub genes can be seen in Supplementary Figure S3.

Differential expression analysis and protein–protein interaction network. Heatmaps of upregulated DEGs
This study also predicted the TFs that regulate the expression of CDC45 (Fig. 1B), enabling exploring the potential molecular mechanism of CDC45 in LSCC at the upstream level. After taking the intersection of the TFs obtained from the AnimalTFDB, CISBP, and Cistrome DB databases, a total of five original TFs were obtained: BCL11A, CTCF, E2F1, FLI1, and FOXM1 (Fig. 9A). Using the RNA-Seq data, coexpression analysis between the five original TFs and CDC45 was performed, and two candidate TFs—E2F1 and FOXM1—were screened. Through calculating SMDs, upregulated mRNA expression of candidate TFs (E2F1 and FOXM1) can be seen in LSCC instead of non-LSCC (SMD >0 and 95% CI did not contain 0, Supplementary Fig. S4), which is consistent with the trend of high expression of CDC45 in LSCC.
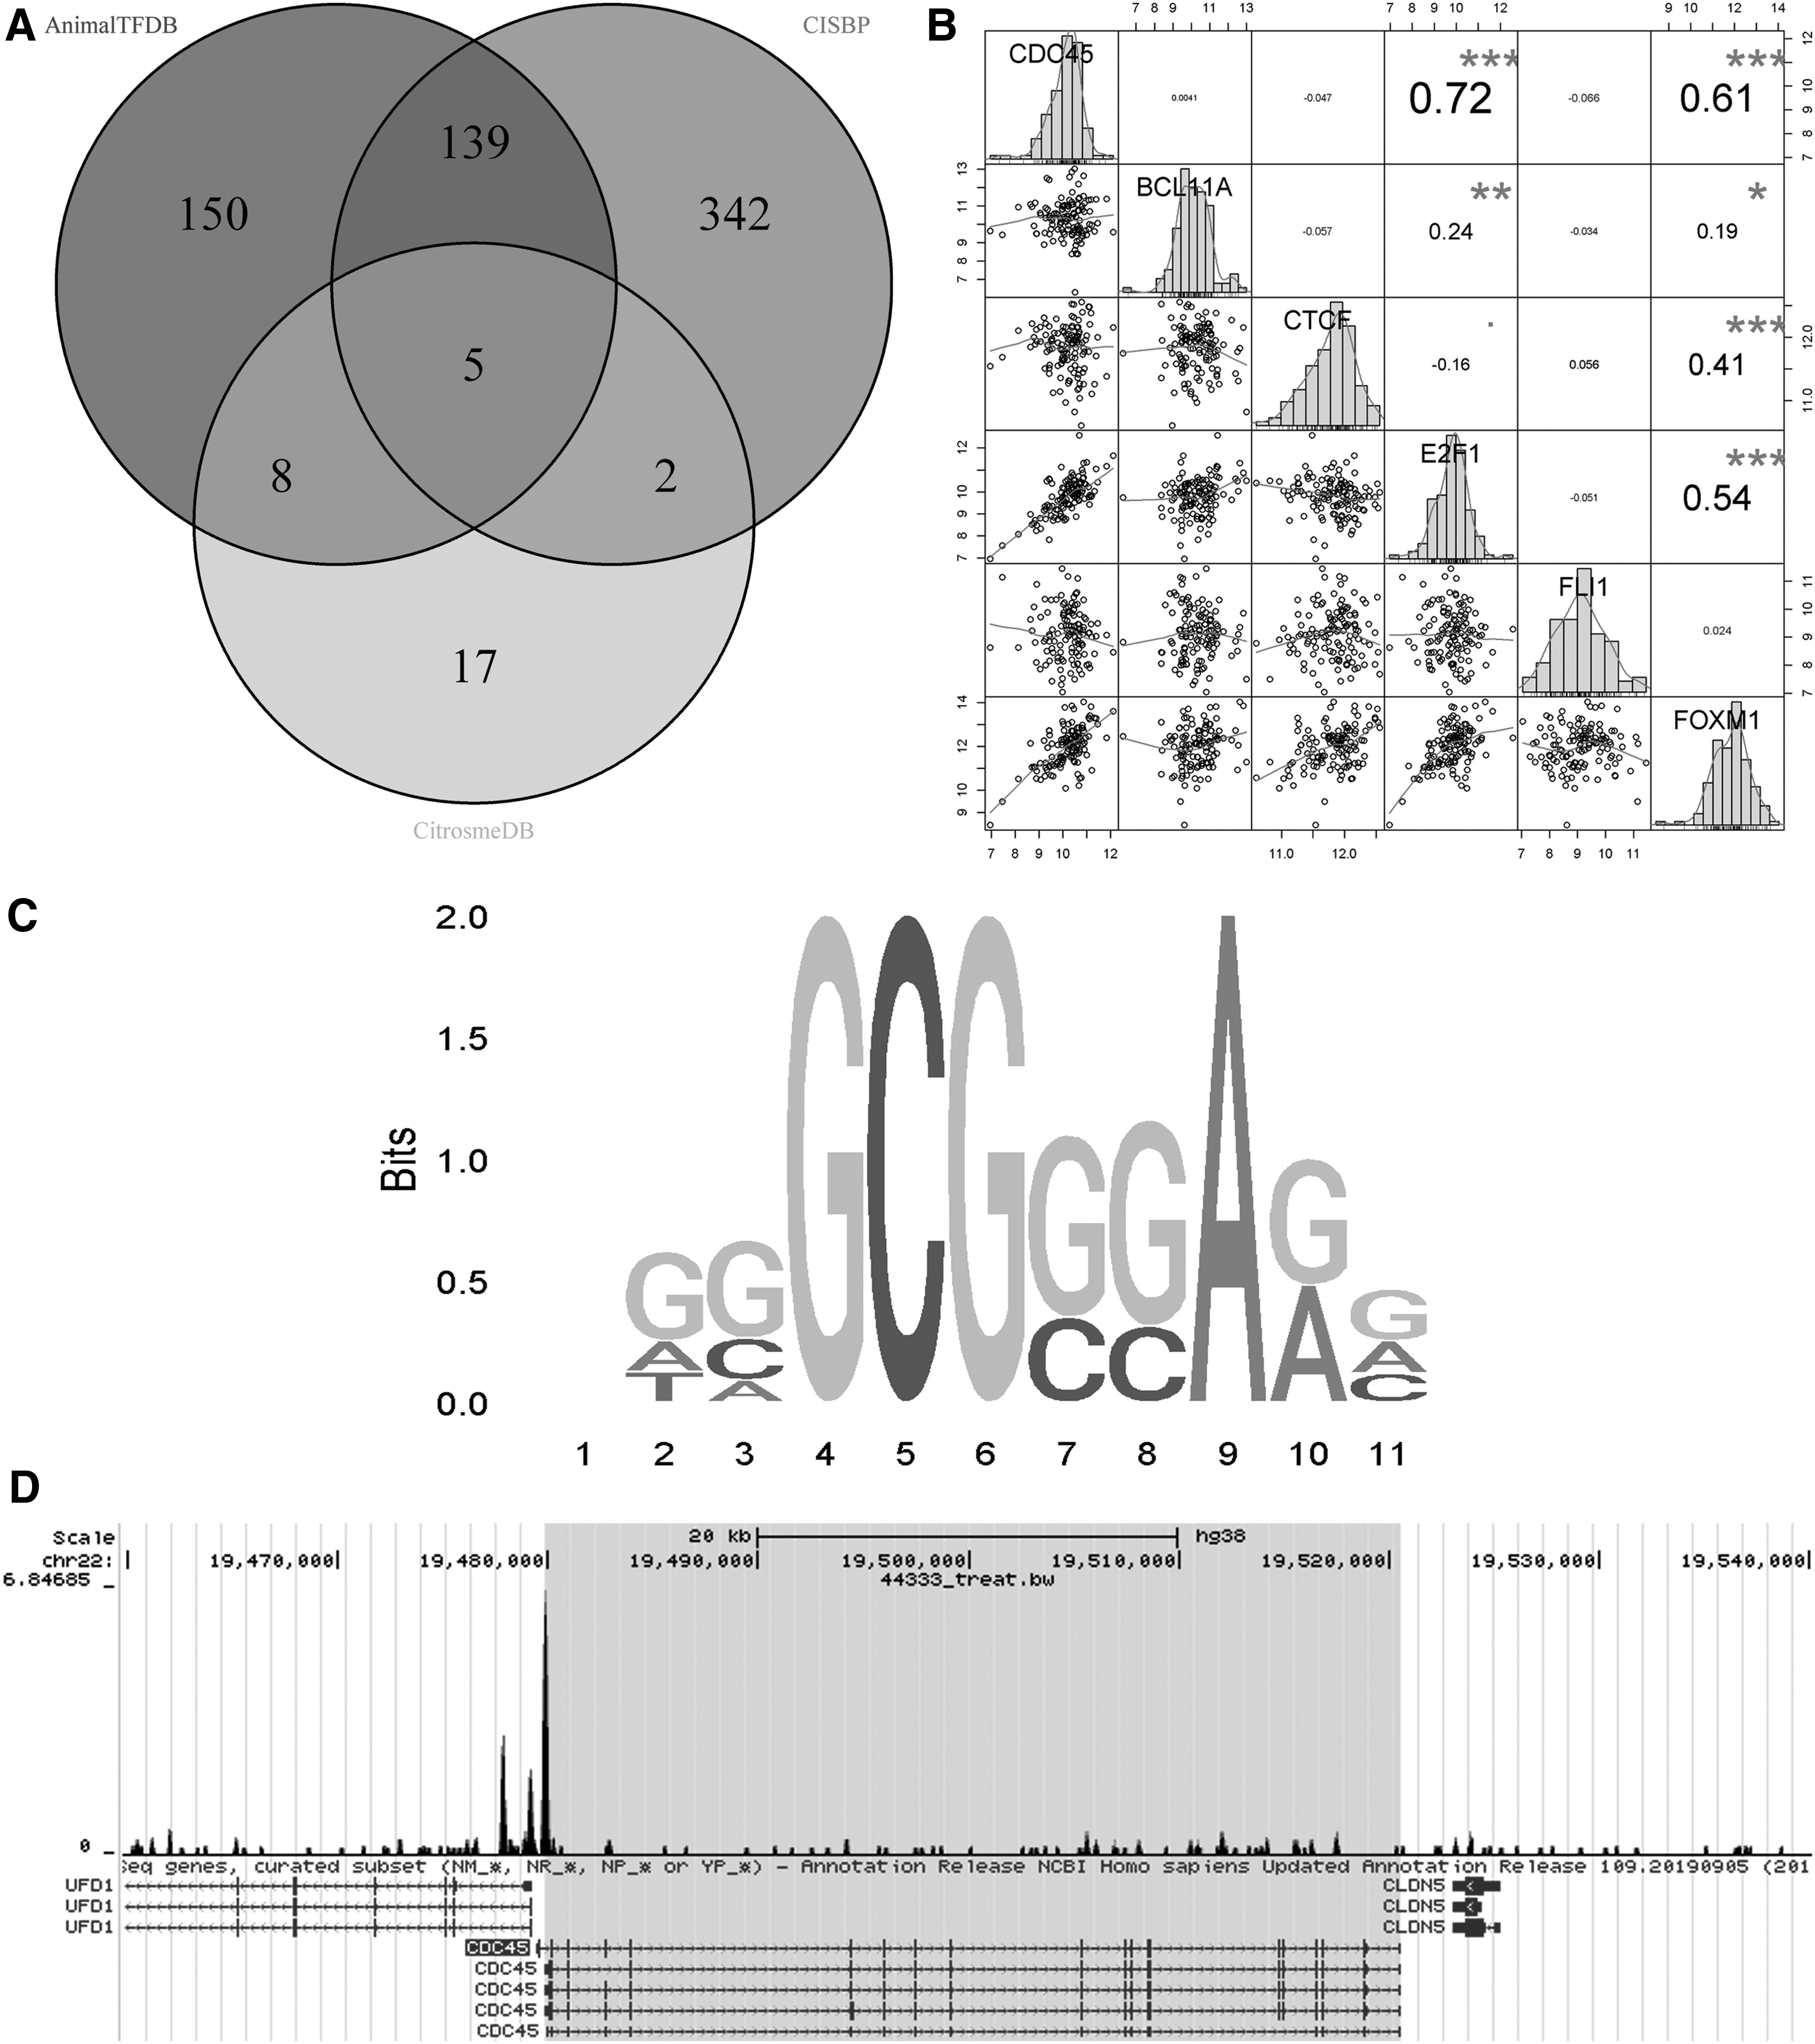
Analysis of TFs predicted to regulate CDC45.
Meanwhile, according to data from the six microarrays (Supplementary Fig. S5) and one RNA-Seq (Fig. 9B) in the study, the expressions of the two candidate TFs were closely related to CDC45 (observed in 4/7 and above). Both the SMDs and coexpression results imply a correlation between candidate TFs and CDC45. The target genes of E2F1 and FOXM1 were predicted from the Cistrome DB database. The ChIP-Seq data showed that all of E2F1-related high-quality research data (a total of 18 items) consistently indicated that CDC45 was the target gene of E2F1 (score ≥1, data not shown).
Among all FOXM1-related high-quality research data (17 items in total), 11 suggested that CDC45 was the target gene of FOXM1 (data not shown). Therefore, the authors supposed that E2F1, not FOXM1, was more likely to be the TF that regulated CDC45. Using the JASPAR database, the authors found that a sequence (Fig. 9C) of the E2F1 motif matched the sequence, including CDC45 promoter. The CDC45 promoter-binding sequence was also observed near the ChIP-Seq peak of E2F1 (Fig. 9D). In all, the current results show that E2F1 is likely a potential TF that regulates CDC45 expression.
Discussion
The helicase CMG, which is closely related to the initiation and process of DNA replication, is composed of 11 subunits: one Cdc45 protein molecule, six MCM subunits, and four GINS subunits. 28 As CDC45 encodes the Cdc45 protein molecule in CMG, it is believed to play an important role in DNA replication and initiation. 29 CDC45 exerts a carcinogenic effect in a variety of cancers, such as NSCLC, 17 hepatocellular carcinoma, 19 colon cancer, 17 and thyroid papillary carcinoma. 21 However, the clinical significance and molecular mechanism of CDC45 in LSCC remain elusive, and thus, our study is the first attempt to shed much-needed light on this area.
This study is the first to explore and uncover the role of CDC45 in LSCC using several data sources (microarrays, RNA-Seq, and IHC data), at multiple levels (mRNA and protein), and with multiple methods (t test and SMD calculation). The expression level of CDC45 was higher in the LSCC group compared with its non-LSCC control counterpart. Moreover, we explored the relationship between the expression of CDC45 and the clinical parameters of the LSCC patients, the ability for using CDC45 to distinguish LSCC tissues from non-LSCC tissues and the relationship between CDC45 and the prognosis of LSCC patients, none of which has been focused on previously. This study is also the first to analyze and comprehensively discuss the potential molecular mechanism of CDC45 in LSCC.
We began by studying the expression of CDC45 in LSCC. A recent study (n = 62) suggested that CDC45 is a DEG in LSCC tissue. 30 Our extended research, using microarrays and RNA-Seq data (n = 233), showed that the mRNA expression level of CDC45 was significantly increased in the LSCC group. The IHC experiment (n = 75) verified the high expression of Cdc45 in the LSCC group through the protein-level results. Thus, the mRNA and IHC results were consistent, indicating that CDC45 is overexpressed in LSCC tissues.
We explored the clinical significance of CDC45 in LSCC. Yang et al. posited that the expression of CDC45 in colon cancer was related to tumor–node–metastasis staging. 17 Sun et al. found that the high expression of CDC45 in papillary thyroid carcinoma is related to advanced tumor stages. 21 However, unlike colon cancer and papillary thyroid carcinoma, in this study, the expression of CDC45 mRNA expression or protein in LSCC tissue was not found to be related to age, clinical stage, tumor stage, and node stage. Interestingly, our study is the first to show that CDC45 mRNA expression is correlated with the gender and neoplasm histologic grade of LSCC patients. However, we lacked sufficient sample data to verify this idea at the protein level, and thus, further research in this regard is needed.
In terms of CDC45 distinguishing LSCC patients from their non-LSCC counterparts, the AUC values of the ROC and sROC curves showed that the expression level of CDC45 makes it feasible to distinguish the LSCC group from the non-LSCC group, suggesting that CDC45 may be used as a marker for screening LSCC patients. Regarding prognosis, Haider et al. found that patients suffering from pancreatic ductal carcinoma and exhibiting high expression of CDC45 had a poor prognosis and shorter survival times. 31 Similarly, we found that the high expression of CDC45 is a risk factor for PFI in LSCC patients, indicating that CDC45 may make it feasible to assess PFI in these patients. However, our results did not show CDC45 is associated with OS in LSCC patients. Therefore, further research on the prognosis of LSCC in connection with CDC45 is recommended.
We explored the potential molecular mechanism of CDC45 in LSCC. Cdc45 aids the initiation and process of DNA replication. 32,33 Experimental research on papillary thyroid carcinoma indicated that the cancer-promoting effect of CDC45 is reflected in the G1 phase of the cell cycle. 21 Similarly, it has been reported that NSCLC cells with CDC45 expression knockdown remain in the G2/M phase. 17 The GSEA based on the CDC45 median expression value showed that the first three GO term types (cell components, biological processes, and molecular functions) were most closely related to the cell cycle, especially DNA replication. It is also interesting to note that the results of the KEGG database grouping based on the CDC45 expression values showed that the first three KEGG pathways were related to the cell cycle, so it is necessary to knock out the expression of CDC45 in the LSCC cell line in vitro to detect its effect on cell cycles in the future.
Among the four hub genes identified by PPI, CDC45 was found to be the top hub gene. The other three hub genes—CDC6, 34,35 KIF2C, 36 and AURKB 37 —were reported as cell cycle regulators of various human cancer. The results pertaining to the potential molecular mechanisms strongly suggested that the carcinogenic effect of Cdc45 in LSCC may be related to its classic function in the cell cycle; that is, it participates in the initiation and process of DNA replication.
We identified a regulatory TF of CDC45, namely E2F1. Yang et al. showed that E2F1 is not related to the expression of CDC45 in colorectal cancer, although some cell cycle genes, such as CDC2 and Cyclin E, have been identified as target genes of E2F1. 38 However, the comprehensive use of online tool prediction and coexpression analysis showed that E2F1 may be the regulatory TF of CDC45. After focusing on the target genes of E2F1 from the perspective of TF reverse prediction of target genes, we concluded that CDC45 is likely to be the target gene of E2F1. However, the regulatory relationship between E2F1 and CDC45 remains unknown and requires further research.
Conclusions
CDC45 is significantly highly expressed in LSCC, and its mRNA expression is correlated with the gender and neoplasm histologic grade of LSCC patients. Moreover, the expression of CDC45 has a good ability to distinguish LSCC tissues from their non-LSCC counterparts. Highly expressed CDC45 is also a risk factor for PFI in LSCC patients. Our analysis of the potential molecular mechanism of CDC45 suggests that it plays an important role in LSCC; high expression of CDC45 is likely a tumor-promoting factor in LSCC and may be used as a new marker for the screening and treatment of this disease.
This research suffers from some limitations. First, the sample size was relatively small. Second, we considered relatively few clinical parameters of the LSCC patients. Third, it is necessary to explore and verify the molecular mechanism of CDC45 in LSCC through in vivo and in vitro experiments. This might involve knocking out the expression of CDC45 in LSCC cell lines in vitro for exploring its effect on LSCC cells and, moreover, focusing on the regulatory relationship between E2F1 and CDC45 through Chromatin Immunoprecipitation Sequencing.
Footnotes
Acknowledgment
The results shown in the study are in part based upon data generated by The Cancer Genome Atlas Program Research Network:
Authors' Contributions
G.-S.L.: Data collection, statistical analysis, article preparation, and article revision. L.-J.Y.: Study design, statistical analysis, and article preparation. G.C.: Study design, funds collection, and article revision. S.-N.H. and Y.-Y.F.: Experiment and article revision. W.-J.H., W.L., and J.H.: Study design and literature search. H.-C.L.: Data collection and literature search. L.-Y.L.: Data collection and experiment. B.-Y.M. and H.-P.L.: Study design, funds collection, article preparation, and article revision.
The corresponding authors declare that all coauthors have reviewed and approved of the article before submission.
Disclosure Statement
No competing financial interests exist.
Funding Information
The study was supported by the funds of Promoting Project of Basic Capacity for Young and Middle-aged University Teachers in Guangxi (2018KY0123), Guangxi Zhuang Autonomous Region Health and Family Planning Commission Self-financed Scientific Research Project (Z20200928, Z20180979), Guangxi Higher Education Undergraduate Teaching Reform Project (2020JGA146), Guangxi Medical University Education and Teaching Reform Project (2019XJGZ04), Guangxi Degree and Postgraduate Education Reform and Development Research Projects, China (JGY2019050), College Student Innovation and Entrepreneurship Training Program Project (202010598052), and Future Academic Stars Project from Guangxi Medical University (WLXSZX20081).
Supplementary Material
Supplementary Table S1
Supplementary Figure S1
Supplementary Figure S2
Supplementary Figure S3
Supplementary Figure S4
Supplementary Figure S5
References
Supplementary Material
Please find the following supplemental material available below.
For Open Access articles published under a Creative Commons License, all supplemental material carries the same license as the article it is associated with.
For non-Open Access articles published, all supplemental material carries a non-exclusive license, and permission requests for re-use of supplemental material or any part of supplemental material shall be sent directly to the copyright owner as specified in the copyright notice associated with the article.