
Abstract
Background:
Forkhead box Q1 (FOXQ1) regulates epithelial ovarian cancer (EOC) cell proliferation, migration, and invasion; however, its prognostic effect in EOC patients is unclear. This study assessed FOXQ1 expression in EOC patients by immunohistochemical (IHC) staining and reverse transcription–quantitative polymerase chain reaction (RT-qPCR) and to analyze its correlation with EOC patients' clinical features and prognosis.
Materials and Methods:
FOXQ1 protein level in tumor and adjacent tissues from 173 EOC patients who underwent resection was detected by IHC staining and further scored by a semiquantitative scoring method; meanwhile, FOXQ1 mRNA level in tumor and adjacent tissues from 105 out of 173 EOC patients (whose fresh-frozen tissues were available) was detected by RT-qPCR. Besides, EOC patients' clinical features and survival data were collected.
Results:
Both FOXQ1 protein (n = 173) and mRNA (n = 105) levels were increased in tumor tissues compared with adjacent tissues (both p < 0.001) in EOC patients. Meanwhile, tumor FOXQ1 protein level was positively correlated with tumor size (p = 0.005) and International Federation of Gynecology and Obstetrics (FIGO) stage (p = 0.037), while FOXQ1 tumor mRNA level was only positively correlated with tumor size (p = 0.015) in EOC patients; however, they were not correlated with other clinical features such as histological subtypes, tumor differentiation, peritoneal cytology, and so on (all p > 0.05). Moreover, FOXQ1 protein (p = 0.030) and mRNA (p = 0.011) levels in tumors were both correlated with worse overall survival (OS) in EOC patients.
Conclusion:
FOXQ1 is elevated in tumor tissues, and its high tumor expression correlates with increased tumor size, elevated FIGO stage, and worse OS in EOC patients.
Introduction
Epithelial ovarian cancer (EOC) is one of the most common gynecological cancers, which causes about 230,000 newly diagnosed cases annually. 1 Meanwhile, it is also listed as one of the most lethal gynecological cancers, and over 150,000 patients die of this disease every year. 2 It is recognized that the risk factors for EOC mainly include a family history of EOC, benign gynecological diseases, long menstrual life span, and smoking, which could improve the screening of EOC 1 ; besides, progress has been achieved in the treatment of EOC; however, the prognosis of EOC patients is still poor with the 5-year survival rate of 46%, which may be due to late diagnosis and high recurrence rate. 3,4 Therefore, searching for novel biomarkers to recognize the prognosis of EOC patients could enhance the precision medicine toward them, thus improving their prognosis. 5
Transcription factor forkhead box Q1 (FOXQ1) belongs to the FOX transcription factor superfamily, which is closely related to the progression of several tumors. 6 For instance, in gastric cancer, FOXQ1 upregulation promotes cell migration and invasion through inducing the epithelial–mesenchymal transition (EMT) 7 ; meanwhile, in laryngeal carcinoma, FOXQ1 overexpression suppresses cell proliferation, migration, and invasion and induces cell cycle arrest 8 ; moreover, in EOC, knockdown of FOXQ1 inhibits cell proliferation, leads to cell cycle arrest by reducing cyclin D1, and reduces cell migration and invasion through repressing the EMT. 9 Besides, it is also reported that FOXQ1 expression is increased in the tumor tissues compared with noncancerous tissues of gastric cancer patients, pancreatic cancer patients, and EOC cancer patients, 7,9,10 and it could act as a prognostic biomarker in hepatocellular carcinoma patients. 11 However, the prognostic value of FOXQ1 in EOC patients is yet to be elucidated.
In the present study, the authors performed the immunohistochemical (IHC) staining and reverse transcription–quantitative polymerase chain reaction (RT-qPCR) to, respectively, investigate FOXQ1 expression in EOC patients and explored the correlation of FOXQ1 with EOC patients' characteristics and prognosis.
Materials and Methods
Patients
This study was approved by the institutional review board of their hospital, and written informed consent was collected from each patient or her family. One hundred and seventy-three EOC patients who received tumor resection in their hospital between January 2015 and December 2019 were screened and analyzed in this study. Analyzed patients met following criteria: (1) pathological diagnosis of EOC; (2) underwent resection without neoadjuvant therapy; (3) paraffin-embedded tumor and adjacent tissues were accessible and available; (4) complete clinical data and follow-up records; and (5) no history of other cancers or malignancies. Patients' clinical features were abstracted from medical records, including age, histological subtype, tumor differentiation, peritoneal cytology, tumor size, the volume of ascites, International Federation of Gynecology and Obstetrics (FIGO) stage, and carbohydrate antigen-125 (CA125) level. Survival data were collected from follow-up records, which were used to calculate the overall survival (OS) with the last follow-up date of 2019/12/31.
Specimen collection and detection
A total of 173 paraffin-embedded tumor and paired adjacent tissues were collected from the sample library of their hospital; meanwhile, there were 105 fresh-frozen tumor and paired adjacent tissues available among 173 patients, which were also collected for study use. FOXQ1 expression in the 173 paraffin-embedded tumor and paired adjacent tissues was detected by IHC assay with a semiquantitative scoring method. The relative expression of FOXQ1 in the 105 fresh-frozen tumor and paired adjacent tissues was determined by RT-qPCR.
IHC assay
Paraffin-embedded tissues were sliced into 4 μm sections, then were deparaffinized with xylene, rehydrated with ethanol, and incubated with H2O2 at 37°C for 10 min. Following blocking using normal goat serum at 37°C for 20 min, the sections were incubated overnight with FOXQ1 Polyclonal Antibody (1:200 dilutions; Invitrogen, Carlsbad, CA). The next day, the sections were incubated with Goat anti-Rabbit IgG (H+L) Secondary Antibody (1:5000 dilutions; Invitrogen) at 37°C for 30 min. Diaminobenzidine and hematoxylin and eosin were applied for staining and counterstaining. Images were viewed on an FSX100 microscope (Olympus, Southend-on-Sea, United Kingdom). The quantification of FOXQ1 protein expression was performed using a semiquantitative scoring method. 12 Briefly, the staining intensity was scored as: (1) 0 (no staining); (2) 1 (weak staining); (3) 2 (moderate staining); and (4) 3 (strong staining). The staining density was scored as: (1) 0 (no positively-stained cell); (2) 1 (<25% of positively-stained cell); (3) 2 (26%–50% of positively-stained cell); (4) 3 (51%–75% of positively-stained cell); and (5) 4 (>75% of positively-stained cell). The IHC score was calculated using intensity score multiplying staining density score, and the total IHC score was ranging from 0 to 12. Protein low expression was defined as IHC score within 0–3, and protein high expression was defined as IHC score within 4–12. 12
RT-qPCR assay
The total RNA from the fresh-frozen tumor and adjacent tissues was extracted using TRIzol™ Reagent (Invitrogen). Subsequently, the reverse transcription of RNA was conducted with ReverTra Ace® qPCR RT Kit (Toyobo, Osaka, Kansai, Japan). After that, FOXQ1 quantitation was performed with SYBR® Green Realtime PCR Master Mix (Toyobo). FOXQ1 mRNA expression was calculated by the 2−ΔΔCt formula with GAPDH as the internal reference. The primers used were listed as follows: FOXQ1 forward (5′- > 3′): CTGGCGGAGATCAACGAGTA; reverse (5′- > 3′): CAGTAGTTGTCCTTGCCCCA 13 ; GAPDH forward (5′- > 3′): GGAGCGAGATCCCTCCAAAAT; reverse (5′- > 3′): GGCTGTTGTCATACTTCTCATGG). It was of note, according to the median value of FOXQ1 mRNA in 105 fresh-frozen tumor tissue, tumor FOXQ1 mRNA expression was classified as high and low for analysis.
Statistical analysis
Data were expressed as mean with standard deviation (SD), median with interquartile range (IQR), or number with percentage (No. (%)). Comparison of FOXQ1 protein expression between tumor tissue and paired adjacent tissue was determined by the McNemar test, and the comparison of FOXQ1 mRNA expression between tumor tissue and paired adjacent tissue was determined by Wilcoxon signed-rank test. Correlation of FOXQ1 expression with characteristics was determined by Chi-square test for trend. Kaplan curve was plotted to display OS, which was calculated from the date of surgery to the date of patients' death or last follow-up. The difference of OS between FOXQ1 high and low expression patients was determined by the log-rank test. p-Value of <0.05 was considered statistically significant. SPSS 24.0 statistical software (IBM, Chicago, IL) was used for statistical analysis, and GraphPad Prism 7.02 (GraphPad Software, Inc., San Diego, CA) was applied for figure making.
Results
Description of EOC patients' characteristics
The mean age of EOC patients was 57.6 ± 12.6 years. As to their clinical features, 111 (64.2%) patients had serous EOC, and 62 (35.8%) patients had other subtypes of EOC. Meanwhile, 86 (49.7%) patients were of well or moderate tumor differentiation, and 87 (50.3%) patients were of poor tumor differentiation. Regarding the tumor size, 103 (59.5%) patients had tumor size equal to or less than 10 cm, while 70 (40.5%) patients had tumor size greater than 10 cm. There were 61 (35.3%) patients who had ascites volume equal to or less than 100 mL and 112 (64.7%) patients who had ascites volume greater than 100 mL. As to the FIGO stage, 61 (35.3%) patients were of stage I or II, and 112 (64.7%) patients were of stage III or IV. Besides, 120 (69.4%) patients had CA125 level equal to or less than 1000 U/mL, and 53 (30.6%) patients had CA125 level greater than 1000 U/mL. The detailed patients' characteristics are shown in Table 1.
Patients' Characteristics
EOC, epithelial ovarian cancer; SD, standard deviation; FIGO, International Federation of Gynecology and Obstetrics; CA125, carbohydrate antigen-125.
FOXQ1 expression in EOC patients
The protein level of FOXQ1 expression in tumor tissues and paired adjacent tissues was detected by IHC (Fig. 1A–D) and then further evaluated by a semiquantitative scoring method. As shown in Table 2, in tumor tissues (n = 173), 96 (55.5%) cases were of high FOXQ1 and 77 (44.5%) cases were of low FOXQ1; in adjacent tissues (n = 173), 53 (30.6%) cases were of high FOXQ1 and 120 (69.4%) cases were of low FOXQ1 (p < 0.001), indicating that the protein level of FOXQ1 was elevated in tumor tissues compared with adjacent tissues. Meanwhile, the mRNA level of FOXQ1 expression in tumor tissues (n = 105) and paired adjacent tissues (n = 105) was detected by RT-qPCR. The median mRNA level of FOXQ1 in tumor tissues [2.377 (1.680–3.640)] was increased compared with that in adjacent tissues [1.000 (0.748–1.576)] (p < 0.001) (Fig. 2). These data suggested that FOXQ1 was increased in tumor tissues compared with adjacent tissues.
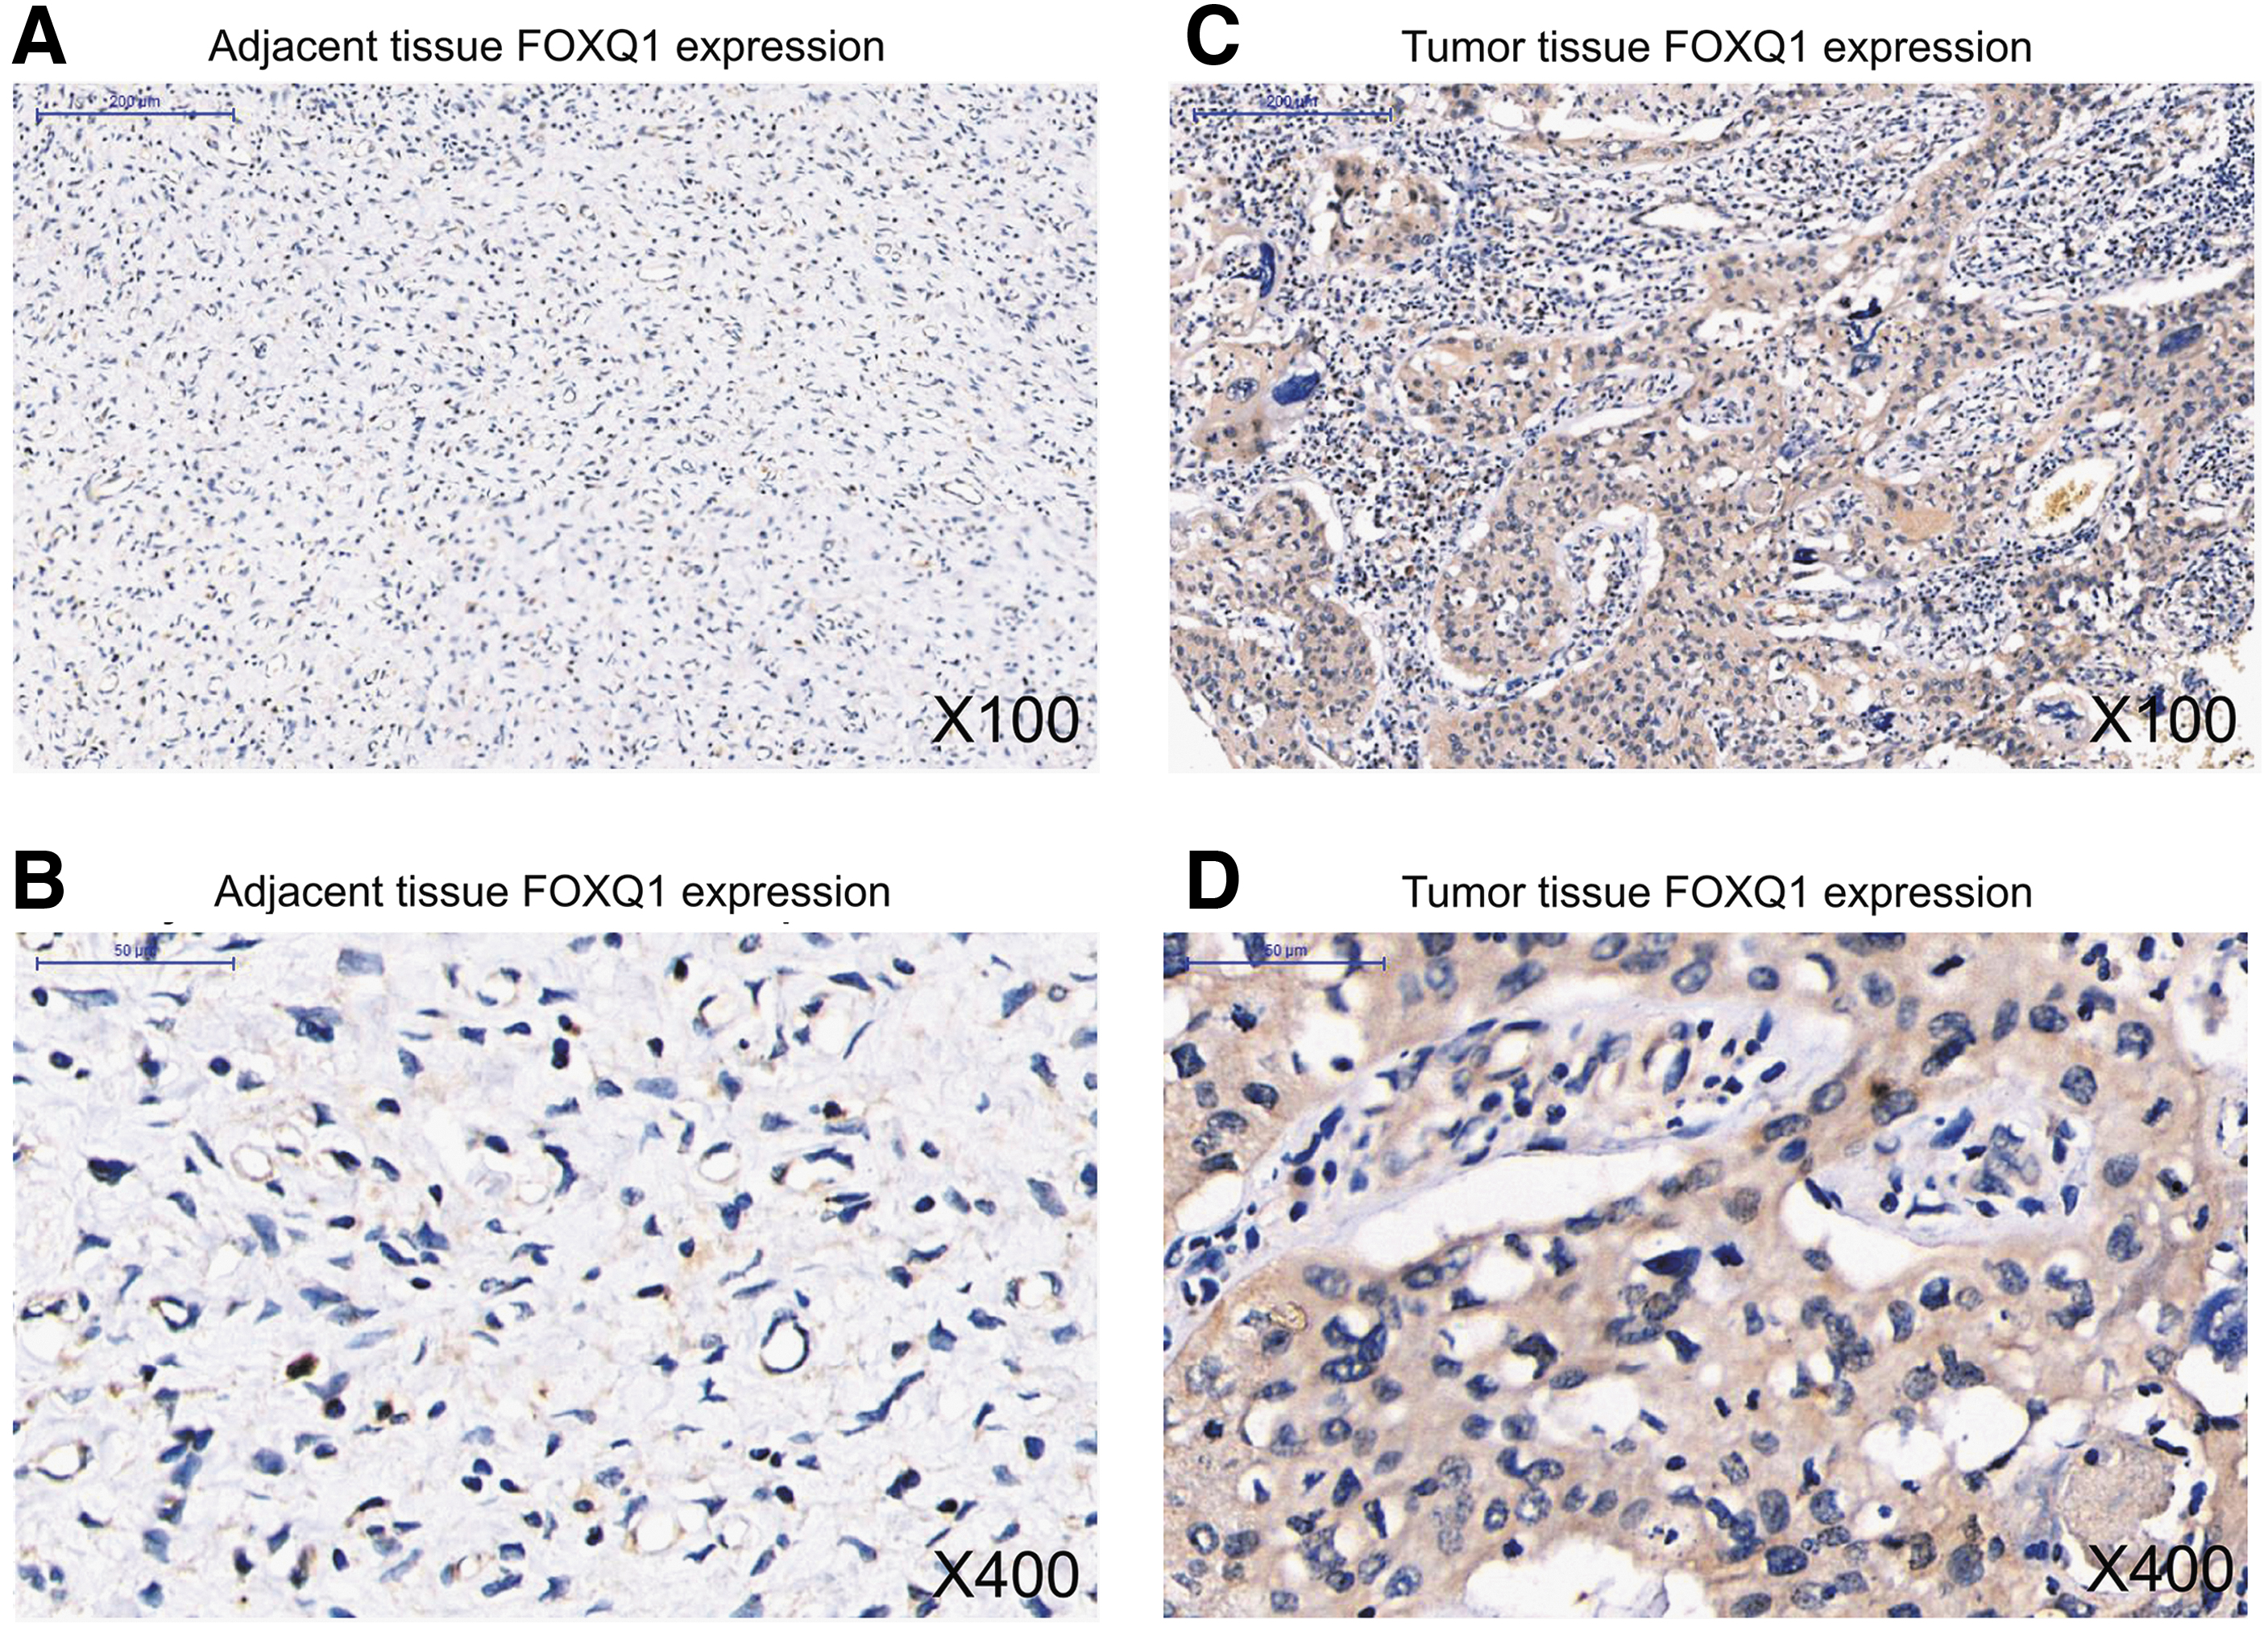
Example images of FOXQ1 detection by IHC staining in EOC patients. FOXQ1 expression in adjacent tissue

Comparison of FOXQ1 mRNA expression between tumor tissues and adjacent tissues in EOC patients. FOXQ1 mRNA expression was elevated in tumor tissues compared with adjacent tissues in EOC patients.
Comparison of Forkhead Box Q1 Protein Expression Between Tumor Tissue and Adjacent Tissue
Comparison was determined by McNemar test.
FOXQ1, forkhead box Q1.
Correlation of FOXQ1 in tumor tissues with EOC patients' characteristics
The protein level of tumor FOXQ1 was positively correlated with tumor size (p = 0.005) and FIGO stage (p = 0.037), while no correlation was observed in that with age (p = 0.643), histological subtype (p = 0.339), tumor differentiation (p = 0.170), peritoneal cytology (p = 0.435), ascites volume (p = 0.078), or CA125 level (p = 0.412). Meanwhile, the mRNA level of tumor FOXQ1 was only positively correlated with tumor size (p = 0.015); however, no correlation was found in that with age (p = 1.000), histological subtype (p = 0.231), tumor differentiation (p = 0.331), peritoneal cytology (p = 0.197), ascites volume (p = 0.098), FIGO stage (p = 0.064), or CA125 level (p = 0.221) (Table 3). Besides, 15 FOXQ1 high-expressed and 15 FOXQ1 low-expressed tumor tissues from the analyzed EOC patients were randomly chosen for E-Cadherin and N-Cadherin detection (Supplementary Fig. S1A). Data showed that tumor FOXQ1 was positively correlated with N-Cadherin (p = 0.020) but negatively correlated with E-Cadherin (p = 0.031) (Supplementary Fig. S1B).
Correlation of Forkhead Box Q1 Expression with Characteristics
Correlation was determined by Chi-square test for trend.
Correlation of FOXQ1 in tumor tissues with EOC patients' OS
The protein level of tumor FOXQ1 was negatively correlated with OS (p = 0.030) in EOC patients (N = 173) (Fig. 3A), and the mRNA level of tumor FOXQ1 was also negatively associated with OS (p = 0.011) in EOC patients (N = 105) (Fig. 3B).
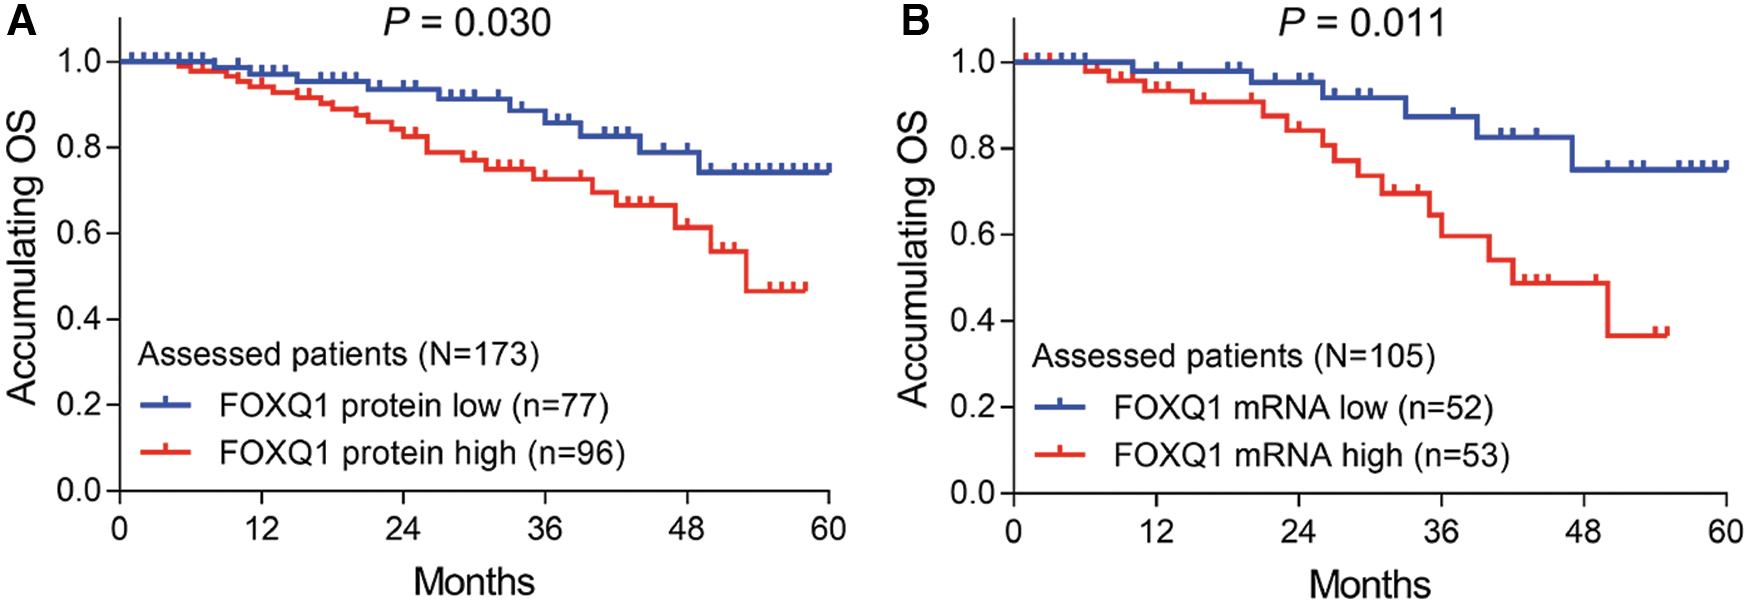
Correlation of tumor FOXQ1 with OS in EOC patients. FOXQ1 protein expression
Discussion
FOXQ1, as a transcription factor, is able to regulate its downstream target genes and thus participate in the initiation and progression of several tumors. 14 For instance, one study reports that FOXQ1 overexpression promotes cancer growth and metastasis through activating the phosphoinositide 3-kinase/protein kinase B (PI3K/Akt) pathway in colorectal cancer in vivo. 15 Another study suggests that FOXQ1 upregulation suppresses BCL11A/mouse double minute 2 homolog (MDM2) signaling to repress cell proliferation and invasion in prostate cancer. 16 Furthermore, it is suggested that silencing FOXQ1 inhibits the transcription of β-catenin and reduces the activity of the Wnt pathway, thus further repressing migration and invasion in colorectal cancer cell line SW480. 17 Taken together, these preclinical studies imply that FOXQ1 could promote proliferation, migration, and invasion of several cancers, which lay a firm foundation for the clinical application of FOXQ1 in cancer patients.
As to the clinical detection of FOXQ1 in cancers, it's revealed that FOXQ1 is dysregulated in the tumor tissues of cancer patients. As mentioned earlier, FOXQ1 upregulation is observed in the tumor tissues compared with adjacent tissues in gastric cancer patients, pancreatic cancer patients, and hepatocellular carcinoma patients. 7,10,11 In the present study, increased FOXQ1 in tumor tissues compared with adjacent tissues of EOC patients was confirmed by both IHC and RT-qPCR assays, which was partly in line with one previous study. 9 Their data could be explained by that: elevated FOXQ1 might activate the Wnt and PI3K/Akt pathways to promote the malignant proliferation of ovarian epithelial cells 18 (as in colorectal cancer cells 15,17 ); therefore, FOXQ1 was elevated in tumor tissues. However, this study only enrolled EOC patients, and whether increased FOXQ1 was the cause of ovarian tumorigenesis or the result of EOC was not clear, and further prospective studies in the precancerous lesion of ovarian cancer could be conducted to explore that.
Considering that FOXQ1 could promote the progression of several cancers at the molecular level, it is not surprising that FOXQ1 is correlated with unfavorable tumor features of cancer patients. Indeed, one previous study reports that FOXQ1 high expression in tumor tissues is correlated with increased tumor diameter, elevated serum α-fetoprotein level, and advanced disease stage in hepatocellular carcinoma patients 11 ; meanwhile, another study reveals that FOXQ1 in gastric tumor tissues is positively correlated with tumor size, histological grade, lymph node involvement, and tumor-node-metastasis stage in gastric cancer patients. 19 However, the correlation of FOXQ1 with EOC patients' clinical features was unclear. In this study, it was found that FOXQ1 protein level in tumor tissues was positively correlated with tumor size and FIGO stage, and FOXQ1 mRNA level in tumor tissues was positively correlated with tumor size. Possible explanations for their data might be that: (1) increased FOXQ1 might activate the Wnt and PI3K/Akt pathways to enhance the proliferation of EOC cells (as in colorectal cancer cells 15,17 ), thus increasing the tumor size in EOC patients; therefore, it was positively correlated with tumor size; (2) elevated FOXQ1 in tumor tissues could promote the EMT to enhance the migration and invasion of EOC cells (as in gastric cancer cells 7 and shown by correlation of tumor FOXQ1 with E-Cadherin and N-Cadherin in EOC patients in this study), thus it was positively correlated with FIGO stage in EOC patients; (3) in this study, the number of patients for FOXQ1 protein detection (n = 173) and mRNA detection (n = 105) was different, and fewer fresh-frozen tumor/adjacent tissues were well-preserved for FOXQ1 mRNA detection, which would result in low statistical power; therefore, the authors did not observe the correlation between FOXQ1 mRNA level and FIGO stage in EOC patients.
As to the prognostic value of FOXQ1, previous studies reveal that FOXQ1 is correlated with poor prognosis in gastric patients, 19 and it is an independent prognostic factor for worse prognosis in hepatocellular carcinoma patients. 11 However, the correlation of FOXQ1 with prognosis in EOC patients was still unclear. Therefore, the authors performed this study, and the correlation between tumor FOXQ1 and worse prognosis in EOC patients was validated by both IHC and RT-qPCR detections. Possible explanations for their data might be that: (1) elevated FOXQ1 expression was correlated with unfavorable disease features of EOC patients, which might cause worse prognosis of EOC patients indirectly; (2) increased FOXQ1 expression might activate the Wnt, nuclear factor-κB, and PI3K/Akt pathways, 1,20,21 which could reduce the chemosensitivity of EOC cells, 22 thus affecting the adjuvant/neoadjuvant treatment effect of EOC and directly cause reduced prognosis of EOC patients. Therefore, tumor FOXQ1 was negatively correlated with prognosis in EOC patients.
There were several limitations in this study. First, in the analyses of the correlation of FOXQ1 with disease features of EOC patients, some continuous parameters were converted into categorized parameters, which might cause information loss; however, this conversion could provide more consistency in the correlation analyses, which may improve the readability of the results (such as the study performed by Peng et al. 23 ). Second, the sample size of this study was relatively small, which might cause low statistical power; especially in the analyses of the correlation in FOXQ1 mRNA level with EOC patients' clinical features and prognosis. Third, considering that recurrence is one of the reasons for the poor prognosis of EOC patients, it might be vital to investigate the correlation of FOXQ1 with the recurrence of EOC; however, a certain part of EOC patients was followed up by local hospitals (rather than their hospital) or failed to be followed up by the schedule, which resulted in incomplete information on EOC recurrence in them; therefore this issue was not involved in the present study, and further studies could be conducted to explore this issue.
Collectively, FOXQ1 is increased in tumor tissues, and its tumor expression positively correlates with tumor size, FIGO stage, but negatively correlates with OS in EOC patients. Based on these findings, FOXQ1 may serve as a potential prognostic biomarker to improve the individualized management of EOC patients.
Availability of Data and Material
The dataset supporting the conclusions of this article is included within the article.
Footnotes
Authors' Contributions
X.W. and X.Z. made substantial contributions to the design of the present study. Data acquisition and interpretation were performed by X.W. and X.Z. X.W. and X.Z. critically revised the article for important intellectual content. All authors approved the final version of the article. All authors agree to be accountable for all aspects of the work in ensuring that questions related to the accuracy or integrity of the work are appropriately investigated and resolved.
Disclosure Statement
No competing financial interests exist.
Funding Information
This research did not receive any specific grant from funding agencies in the public, commercial, or not-for-profit sectors.
Supplementary Material
Supplementary Figure S1
References
Supplementary Material
Please find the following supplemental material available below.
For Open Access articles published under a Creative Commons License, all supplemental material carries the same license as the article it is associated with.
For non-Open Access articles published, all supplemental material carries a non-exclusive license, and permission requests for re-use of supplemental material or any part of supplemental material shall be sent directly to the copyright owner as specified in the copyright notice associated with the article.