
Abstract
Background:
The molecular mechanisms underlying chemoresistance are still poorly understood in nasopharyngeal cancer. The protein expression of ERCC1 in DNA repair genes has been reported related to resistance platinum and predicting treatment outcomes in various malignant carcinomas, but the benefit for predicting outcomes with optimal cutoff value of ERCC1mRNA is controversial. The level of plasma Epstein-Barr virus (EBV) DNA is positively correlated with clinical stages of nasopharyngeal carcinoma (NPC). The predictive value of ERCC1mRNA from receiver-operator characteristic (ROC) and EBV-DNA level for stratified treatment with stage II NPC is exactly unclear. This study aims to assess the predictive value of combined EBV-DNA and ERCC1 in stage II nasopharyngeal cancer (NPC) patients treated with intensity-modulated radiotherapy (IMRT) with concurrent cisplatin, and provide guidance for future stratified treatment.
Methods:
A total of 86 stage II NPC patients who received IMRT and concurrent cisplatin-based chemotherapy with or without cisplatin-based adjuvant chemotherapy had measurements of ERCC1 mRNA, and pretreatment EBV-DNA levels were analyzed by real-time PCR (RT-PCR). Associations of ERCC1 mRNA and pretreatment EBV-DNA levels with clinical characteristics and survivals were evaluated.
Results:
Cutoff value of ERCC1 mRNA obtained from ROC curve was used, and there were significant differences in progression-free survival (PFS) and overall survival (OS) and overall response rate (ORR) between high expression group and low expression group (p = 0.021 and 0.030 and 0.000, respectively). Patients with pretreatment EBV-DNA <2000 copies/mL had significantly better PFS and ORR (p = 0.024 and 0.043, respectively) and a marginally significant impact on OS (p = 0.062) than those with pretreatment EBV-DNA ≥2000 copies/mL. Patients were divided into three groups by combination of ERCC1 mRNA and EBV-DNA level: ERCC1 mRNA low expression/pre-EBV-DNA <2000 copies/mL, ERCC1 mRNA low expression/pre-EBV-DNA ≥2000 copies/mL, and ERCC1 mRNA high expression/pre-EBV-DNA ≥2000 copies/mL. There were significant differences in ORR among the three groups (p = 0.005). The median follow-up was 62 months (range 22–84) with a follow-up rate of 90.70%. In these groups by combination of ERCC1 mRNA and EBV-DNA level, 1, 3, 5-year OS were 100%, 100%, 100%; 100%, 94.1%, 90.9%; and 100%, 85%, 72.9%, respectively (p = 0.038); 1, 3, 5-year PFS were 100%, 100%, 100%; 97.1%, 91.2%, 84.8%; and 95%, 85%, 71.4%, respectively (p = 0.028). Multivariate analysis showed that combination of ERCC1 mRNA and EBV-DNA levels remained independent prognostic factor but not ERCC1 mRNA and EBV-DNA alone.
Conclusions:
Combined ERCC1 mRNA and pre-EBV-DNA is a better prognostic biomarker in stage II NPC patients treated with concurrent chemoradiation. Patients with ERCC1 mRNA high expression/pre-EBV-DNA ≥2000 copies/mL may benefit from more aggressive treatment.
Introduction
Nasopharyngeal carcinoma (NPC) is one of the most common malignancies in Southern China with an incidence rate of 20–30/10,000. 1,2 Nonkeratinizing carcinoma (WHO 2005 classification), especially the undifferentiated type of Nonkeratinizing carcinoma, is the major pathological type in regions with high incidence, 3 which is more sensitive to chemoradiotherapy. NCCN guidelines recommend concurrent chemoradiation for stage II NPC. Cisplatin is the standard concurrent chemotherapeutic agent 4,5 ; however, the role of chemotherapy in stage II NPC is still controversial. 6 A phase III randomized controlled trial revealed improved 5-year overall survival (OS) rates in stage II NPC patients who received concurrent chemoradiotherapy (CCRT) compared with radiotherapy alone (94.5% vs. 85.8%; p = 0.007). 7 Selection of patients for chemoradiation is important. The clinical stage II NPC includes three subgroups: T2N0M0, T0 ∼ 1N1M0, and T2N1M0. Long-term follow-up data showed that the survival of these subgroups was different. 8
However, the current staging system based solely on anatomical information does not fully reflect the stratification of risk factors among stage II NPC patients; there is biological heterogeneity among these patients. Therefore, there are some limitations in guiding stage II NPC treatment through clinical staging system.
Repair of DNA damage is a key process after exposure of cancer cells to radiotherapy and chemotherapy. 9 Mediators that are associated with DNA damage repair process may affect the outcomes of radiotherapy and chemotherapy. 9 Excision repair cross-complementation group 1 (ERCC1) acts as a rate-limiting enzyme in the nucleotide excision repair pathway. 10,11 Recently, increasing experimental and clinical evidence demonstrated that high ERCC1 expression was associated with resistance to platinum-based chemotherapy in various malignant carcinomas, and low ERCC1 expression predicted good survival of these patients. 12 –17 In locoregionally advanced NPC patients treated with chemoradiotherapy, there were several studies that used immunohistochemical techniques (IHC) to determine the expression of ERCC1, which found that high tumor ERCC1 expression predicted poor treatment response and survival. 18 –21 However, the relationship between ERCC1 mRNA and treatment outcomes in NPC has not been established. Epstein-Barr virus (EBV) DNA concentrations correlate positively with disease stage as well as exhibit prognostic importance in NPC. 22 Many published studies have shown that EBV-DNA is an important biomarker for monitoring survival at all stages of disease. 23 –25 In stage II NPC, our previous study found that the plasma EBV-DNA level 1 week after radiotherapy completion could predict 3- and 5-year recurrence and metastasis rate. 26
Understanding the underlying intrinsic factors would help us predict the prognosis and select optimal treatments. However, whether combined ERCC1 and EBV-DNA is associated with prognosis in the prediction of CCRT treatment outcomes and provides clinical guidance remains unclear. The subject of this study was to retrospectively assess the prognostic value of combined ERCC1mRNA with the level of pretreatment plasma EBV-DNA and survival for stage II NPC.
Methods
Human NPC tissue samples
All procedures performed in this study involving human participants were approved by Ethics Committee of the participating hospitals, and were in accordance with the 1964 Declaration of Helsinki. Informed consent was obtained from each patient. Human NPC tissues were collected from 86 patients who underwent CCRT between June 2012 and June 2015. All cases were biopsy-proven NPC and stage II disease according to the seventh edition TNM staging system. The median age was 46 years (18–73 years), and the gender ratio (male vs. female) was 2.58:1. The clinicopathological characteristics of the NPC patients are presented in Table 1.
Characteristics of the Patients with Stage II Nasopharyngeal Carcinoma
Chemoradiation treatment
All patients were treated with intensity-modulated radiotherapy (IMRT) given once daily five times per week. The radiation dose was as follows: PGTVnx 70.06 Gy/31 fractions, PGTVnd70.06 Gy/31 fractions, PTV1 66.03 Gy/31 fractions, and PTV2 54.25 Gy/31 fractions. The gross tumor volume (GTV), including the primary tumor (GTV-P), cervical lymph node tumor volume (GTV-LN), was defined as the respective gross extent of the tumor shown by CT/MRI and clinical examinations, and contoured following International Commission on Radiation Units and Measurements Report 50 and 62 (ICRU50 and 62) guidelines. The clinical target volume (CTV) included a 1–1.5 cm margin surrounding the GTV, as well as the entire nasopharyngeal space and the positive lymph node regions. Each respective planning (P-) target volume (P-GTV-P, P-GTV-N, P-CTV), for setup variability and internal motion, was defined by requiring in all directions of a minimum of 3 mm around the GTV-P and 3 mm around the GTV-LN and CTVs. The limit of endangered organs refers to the relevant regulations of the Radiation Therapy Oncology Group (RTOG). All patients were treated with concurrent cisplatin (80 mg/m2 on d 1, 22, and 43); every 21 d for three cycles, with or without cisplatin-based adjuvant chemotherapy.
Response evaluation and follow-up studies
At 12 weeks after completion of CCRT, magnetic resonance imaging (MRI) of nasopharynx and neck was obtained in all patients, and the tumor response was evaluated according to the Response Evaluation Criteria in Solid Tumors (Version 1.1). Based on the tumor response, patients were divided into complete response group (CR), partial response group (PR), stable disease group (SD), or progressive disease (PD) group. The response rate (RR) was calculated as number of CR plus PR cases divided by all cases. All patients were followed every 3 months during the first 2 years and every 6 months during the second year to the fifth year, and patients were then followed up every year until death.
Real-time PCR analysis
RNA was extracted from the cancerous tissues using TRIzol reagent (Invitrogen; Carlsbad, CA) according to manufacturer's instructions, and cDNA was synthesized using PrimeScript 1st strand cDNA Synthesis Kit (Takara). ERCC1 expression level was detected by using SYBR Green real-time PCR in ABI7900 system (Applied Biosystems, Foster City, CA). The PCR amplification was carried out by a fluorescent temperature cycler (Mx 3000P Real Time PCR System; Stratagene, La Jolla, CA). In brief, cDNA was PCR amplified in a final volume of 25 μL containing 3 μL cDNA, 25 mM MgCl2, 25 mM dNTPs, 100 μM of the specific forward and reverse primers, 10 × Amoy buffer and 5 U/μL of Amoy HS-Taq. Thermal cycling conditions were 2 min at 50°C and 10 min at 95°C, followed by 40 cycles at 95°C for 20 s and 60°C for 30 s. GAPDH was used as an internal reference for ERCC1 mRNA expression. The primers for ERCC1 were as follows: F, 5′-CCGCCAGCAAGGAAGAAA-3′, R, 5′-CTGCCGAGGGCTCACAAT-3′; the primers for GAPDH: F, 5′-GAGATCCCTCCAAAATCAAGT-3′, R, 5′-CTTCCACGATACCAAAGTTGT-3′. The mRNA expression of ERCC1 was calculated by using compared Ct method.
Quantitative detection of EBV-DNA in plasma
EBV fluorescence quantitative PCR detection kit included selected products of Sun Yat Sen University Daan Gene Co., Ltd. About 3 mL of blood was collected each time, added into the EDTA anticoagulant tube, centrifuged at 2000 R/min for 5 min, and 200 μL of plasma was frozen at −20°C for standby. Extraction and amplification steps of EBV-DNA were performed as follows: frozen plasma was maintained at room temperature, DNA was extracted in strict accordance with the instructions provided in EBV fluorescence quantitative polymerase chain reaction (RT-PCR) detection kit; gene amplification was detected with mixed PCR solution on ABI 7300 PCR instrument; PCR conditions were set as follows: 93°C predenaturation for 2 min, 93°C 45 s, 55°C 60 s; ten cycles; 93°C 30 s, 55°C 45 s, 30 cycles. The formula for calculation of plasma EBV-DNA concentration was as follows: C = q × (vdn/VPC) × (1/vext).
Statistical analysis
All the data analysis was performed with SPSS software (Version 23.0, SPSS, Inc., Chicago, IL). The survival curves and the receiver-operator characteristic (ROC) curve were analyzed using GraphPad Prism 8.3 (GraphPad Software, Inc., San Diego, CA), and Forest maps were drawn in StataSE version 15 (Statacorp Lp, College Station, TX). The OS was defined as the time from start of the treatment to death from any cause. The progression-free survival (PFS) was defined as the time from start of the treatment to the observation of disease progress. Association between ERCC1mRNA expression, the level of EBV-DNA, and clinicopathological characteristics was assessed by chi-square test. The survival difference in OS and PFS between different groups was assessed by the Kaplan–Meier plots. All statistical tests were two sided, and p-values <0.05 were considered as statistically significant.
Results
ERCC1 mRNA expression in NPC tissues and treatment response
The mRNA expression levels of ERCC1 in NPC tissues determined by RT-PCR ranged from 0.456 to 1.412 with the median value of 1.119.
To determine the diagnostic value of the ERCC1 mRNA to response, the data from 86 cases were analyzed by ROC curve. The results showed that the area under the curve (AUC) was significantly larger than the area expected by chance alone (p < 0.0001, 95% CI: 0.975–0.999; Fig. 1). The optimal cutoff value was 1.295, with sensitivity of 83.3% and a specificity of 81.2%.

ROC curve for the cutoff points for ERCC1 mRNA that could be obtained by testing ERCC1 mRNA level to predict therapeutic response of stage II NPC patients. NPC, nasopharyngeal carcinoma; ROC, receiver-operator characteristic; ERCC1, excision repair cross-complementation group 1.
Using this cutoff value, ERCC1 mRNA expression was found significantly associated with N stage and TN stage but not significantly associated with gender, age, or T stage (Table 2). Furthermore, using this cutoff value as dichotomy, 65 of 66 had CR or PR in the low expression group (<1.295), and 14 of 20 had CR or PR in the high expression group (≥1.295). Those with low expression had significantly higher treatment RR than those with high expression (98.48% vs. 70.00%; p = 0.000) (Table 4). The patients who did not achieve remission were mainly those with the large neck lymph nodes (5–6 cm), which caused obvious oropharyngeal reaction of radiotherapy, resulting in treatment interruption and unsatisfied tumor regression, and distant metastasis and disease progression were found in review and evaluation at 12 weeks after completion of CCRT.
The Relationship Between ERCC1mRNA Expression and Clinical Characteristics in Stage II Nasopharyngeal Carcinoma Patients
ERCC1, excision repair cross-complementation group 1.
General treatment outcomes
The median follow-up was 62 months (range 22–84). Eight patients were excluded from survival statistics due to incomplete follow-up data, and 78 patients were included for survival analysis finally, with a follow-up rate of 90.70%. The 1-, 3-, and 5-year OS rates were 98.72%, 93.59%, and 91.03%, respectively, and the 1-, 3-, and 5-year PFS rates were 97.4%, 92.3%, and 86.5%, respectively.
The relationship between ERCC1 mRNA expression levels and treatment outcomes
The Kaplan–Meier survival curves for OS and PFS comparing high ERCC1 mRNA expression and low ERCC1 mRNA expression using the cutoff value are shown in Figure 2A and B. There was statistically significant difference in both OS and PFS. The 1-, 3-, and 5-year OS rates were 100%, 85.0%, and 72.9% in the high expression group versus 100%, 96.6%, and 94.7% in the low expression group (p = 0.021), respectively. The 1-, 3-, and 5-year PFS rates were 95%, 85%, and 71.4% in the high expression group versus 98.3%, 94.8%, and 91.1% in the low expression group (p = 0.030), respectively.
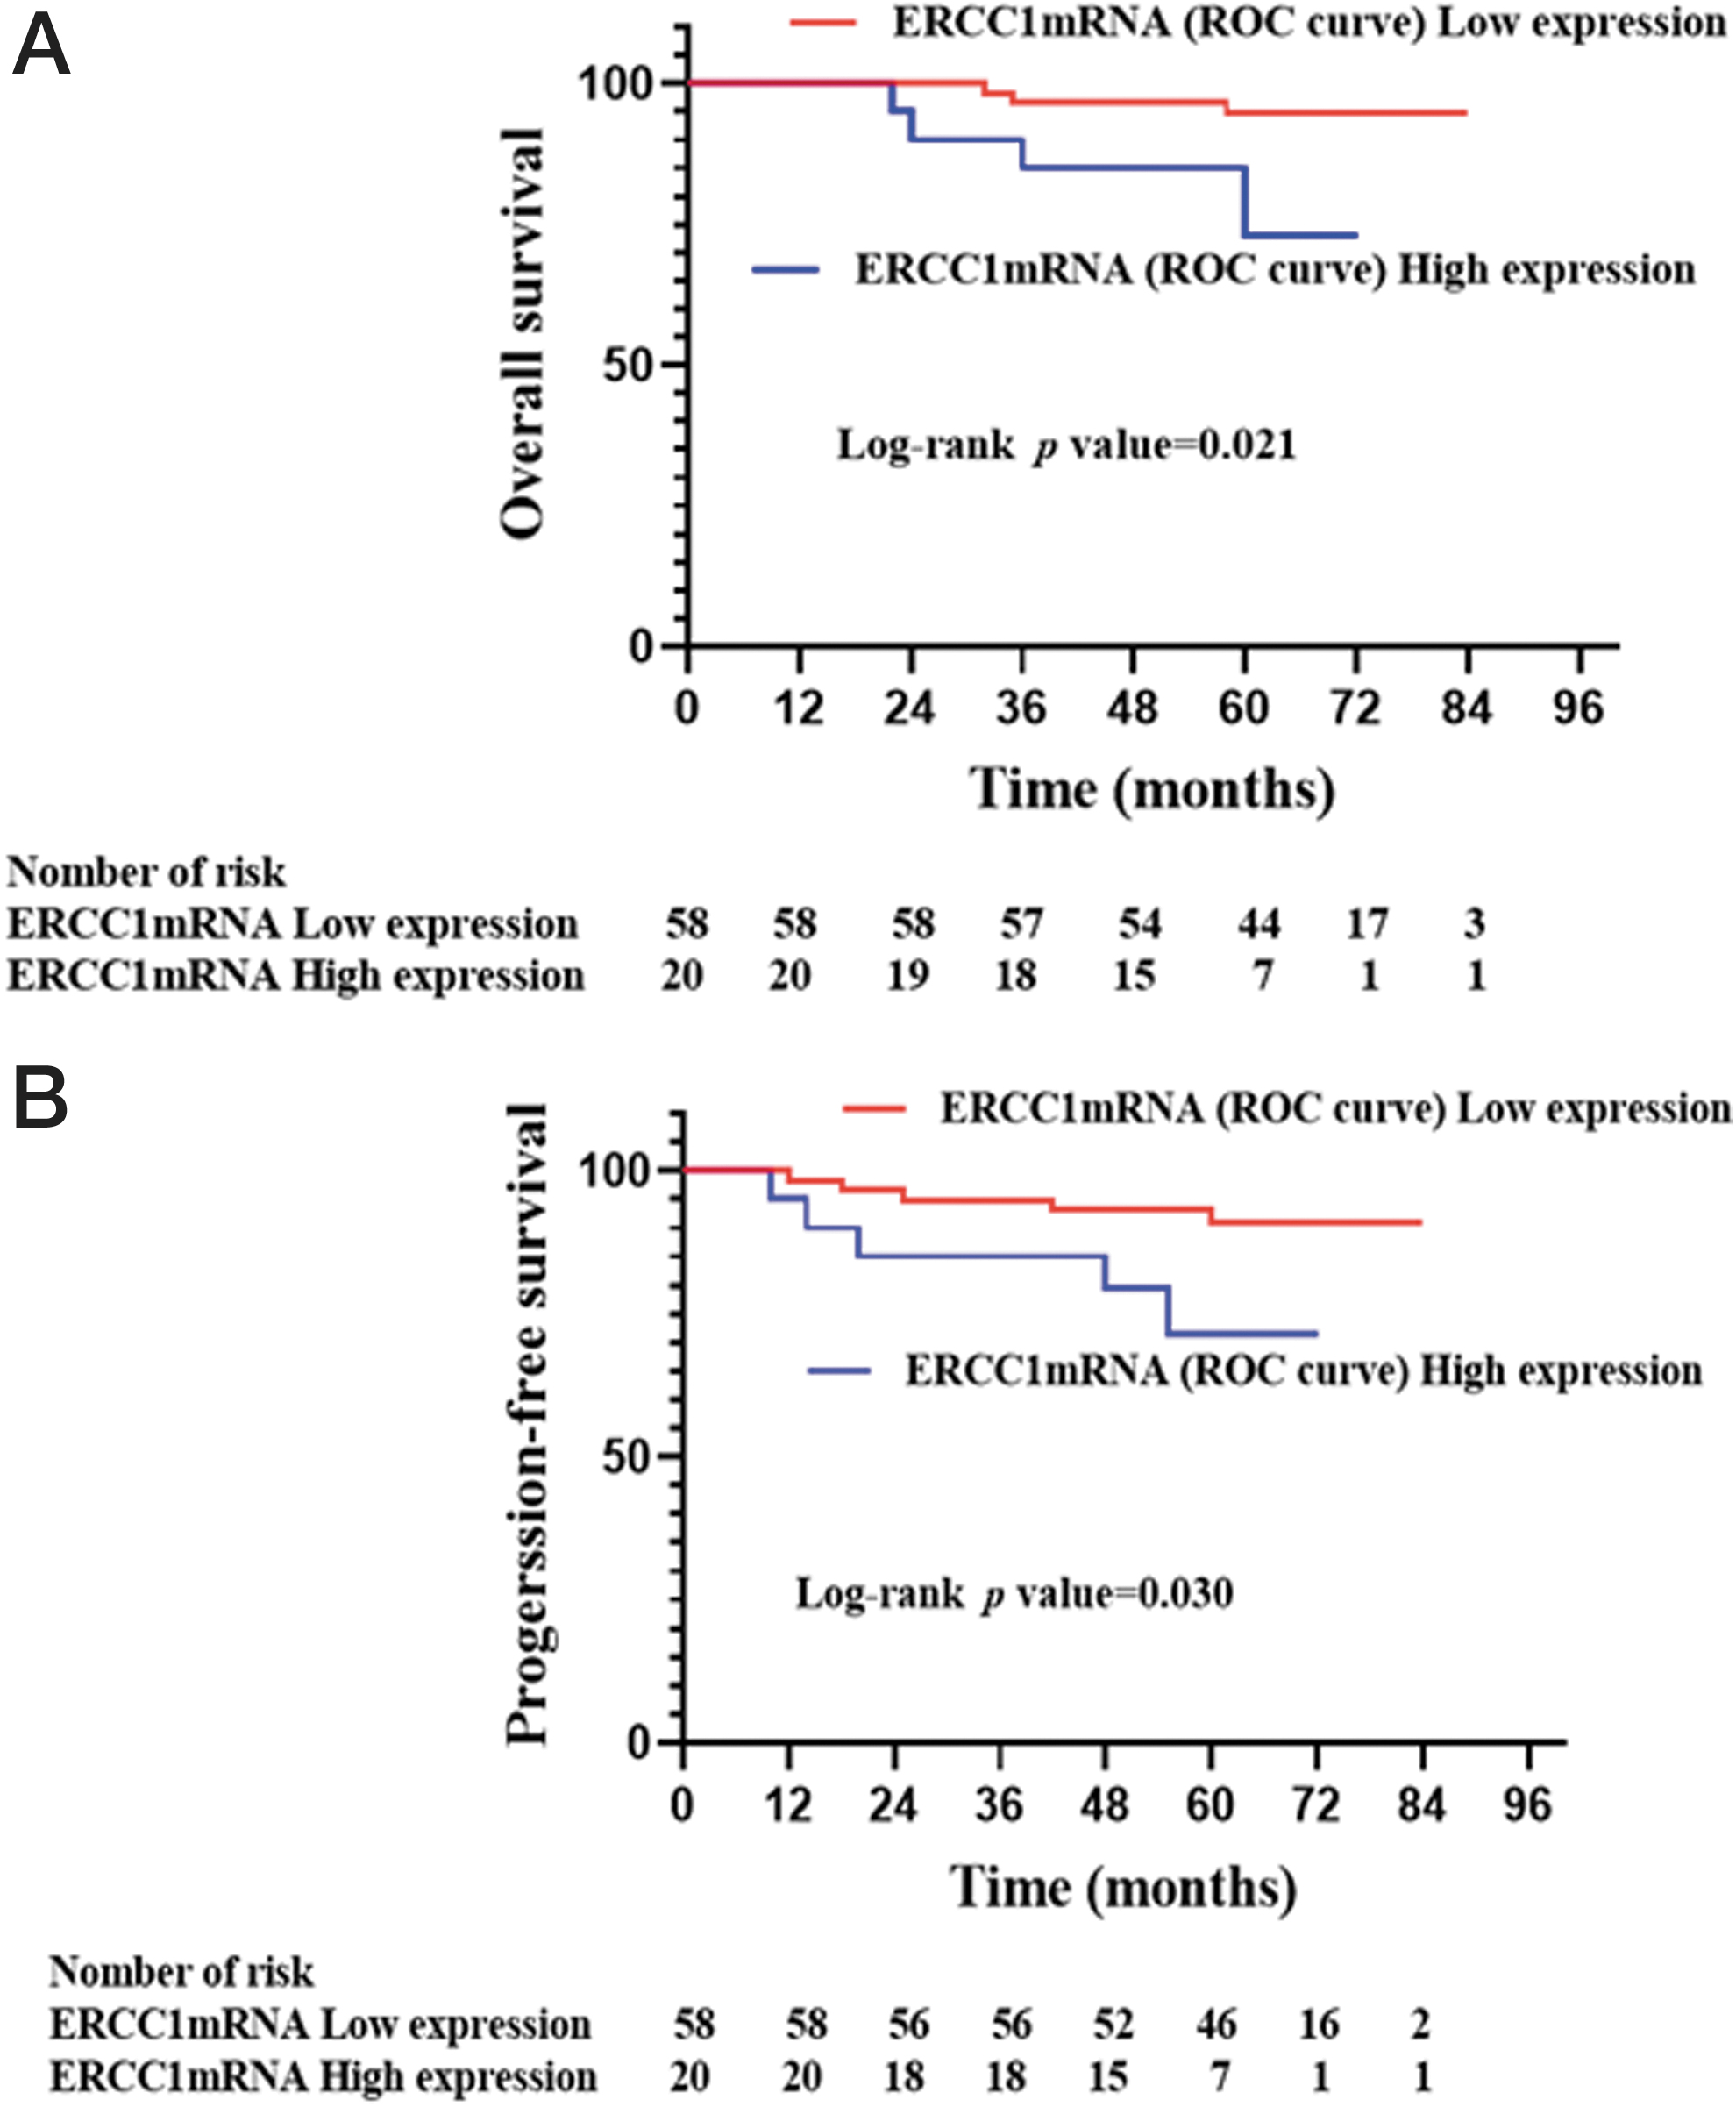
The Kaplan–Meier analysis of ERCC1 mRNA expression based on the cutoff value for OS
The EBV-DNA viral load and treatment outcomes
All patients had detectable pretreatment plasma EBV-DNA (>0 copy/mL), and 90.70% (78/86) of patients had post-treatment 1 week plasma EBV-DNA between 0 and 100 copies/mL. Pretreatment EBV-DNA load 2000 copies/mL was used as a cutoff, 22 EBV-DNA viral load was found to be significantly associated with T stage and TN stage but not significantly correlated with gender, age, or N stage (Table 3). One hundred percentage overall response rate (ORR) (32/32) was found in low EBV-DNA load (2000 copies/mL) and 87.04% (47/54) in high EBV-DNA load (>2000 copies/mL). Those with low virus load had significantly higher treatment RR than those with high virus load (p = 0.043) (Table 4).
The Relationship Between Pre-Epstein-Barr Virus DNA Level and Clinical Characteristics in Stage II Nasopharyngeal Carcinoma Patients
The Relationship Between ERCC1mRNA Expression/EBV-DNA Viral Load and Therapeutic Effects in Stage II Nasopharyngeal Carcinoma Patients
The Kaplan–Meier survival curves for OS and PFS comparing high EBV-DNA load (≥2000 copies/mL) and low EBV-DNA load (2000 copies/mL) are shown in Figure 3A and B. The low EBV-DNA load group had a obvious trend although not statistically significant difference with the high EBV-DNA load group in OS. The 1-, 3-, and 5-year OS rates were 100%, 90.7%, and 85.7% in the high EBV-DNA load group versus 100%, 100%, and 100% in the low EBV-DNA load group (p = 0.062). But there was statistically significant difference in PFS. The 1-, 3-, and 5-year PFS rates were 96.3%, 88.9%, and 80.1%, in the high EBV-DNA load group versus 100%, 100%, and 100% in the low EBV-DNA load group (p = 0.024), respectively.
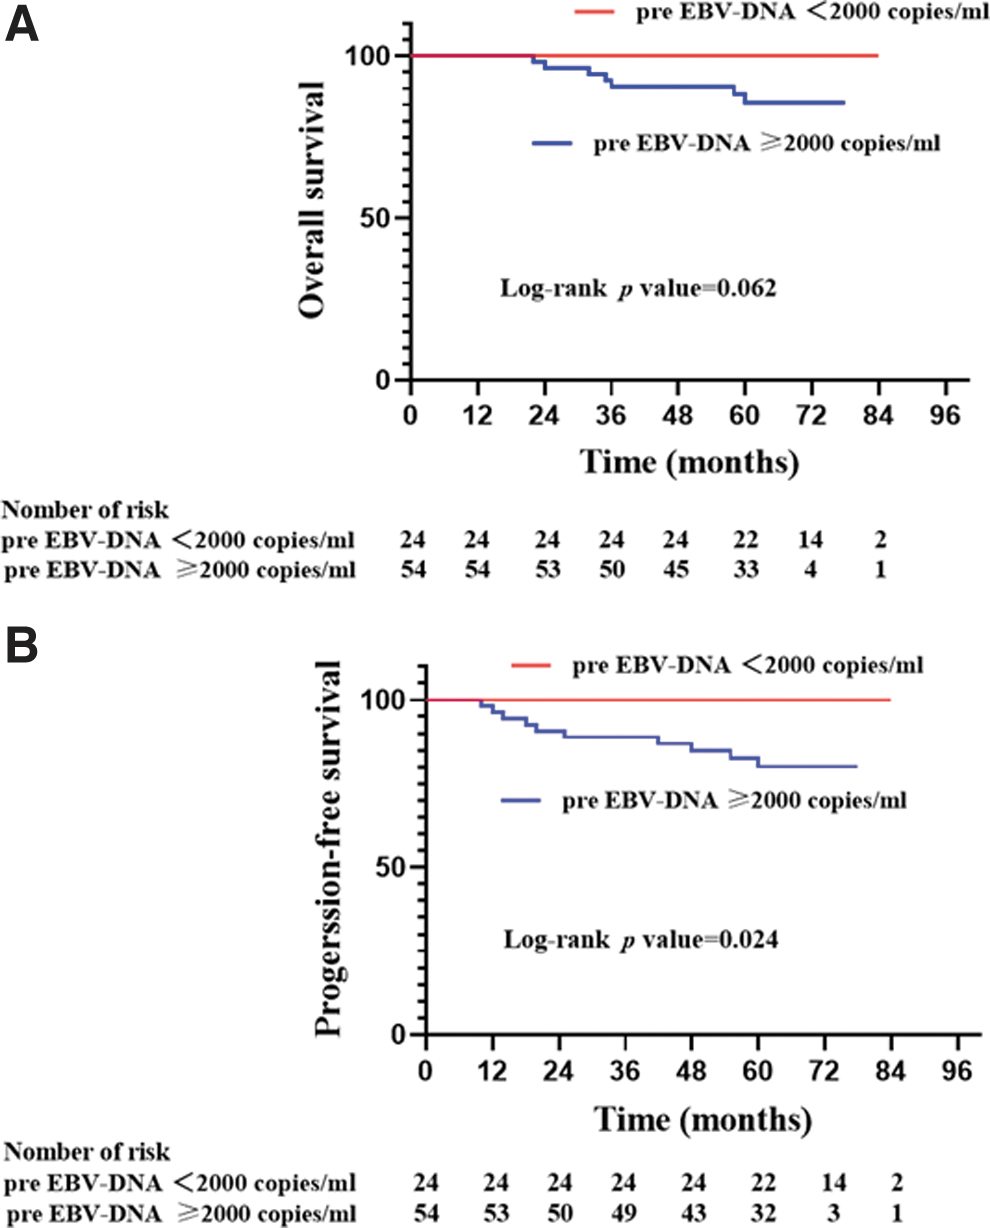
The Kaplan–Meier curves of OS
Combination of ERCC1 mRNA expression and EBV-DNA viral load improved prognostic stratification
Patients were stratified into three groups: low ERCC1 mRNA expression and low EBV-DNA load, low ERCC1 mRNA expression and high EBV-DNA load, high ERCC1 mRNA expression and high EBV-DNA load. There was no patient with high ERCC1 mRNA expression and low EBV-DNA. For these three groups, there were significant differences in ORR (p = 0.005) (Table 4). The 1-, 3-, and 5-year OS rates were 100%, 100%, 100%; 100%, 94.1%, 90.9%; and 100%, 85%, 72.9%, respectively (p = 0.038); the 1-, 3-, and 5-year PFS rates were100%, 100%, 100%; 97.1%, 91.2%, 84.8%; and 95%, 85%, 71.4%, respectively (p = 0.028). Figure 4A and B show OS and PFS for these three groups.
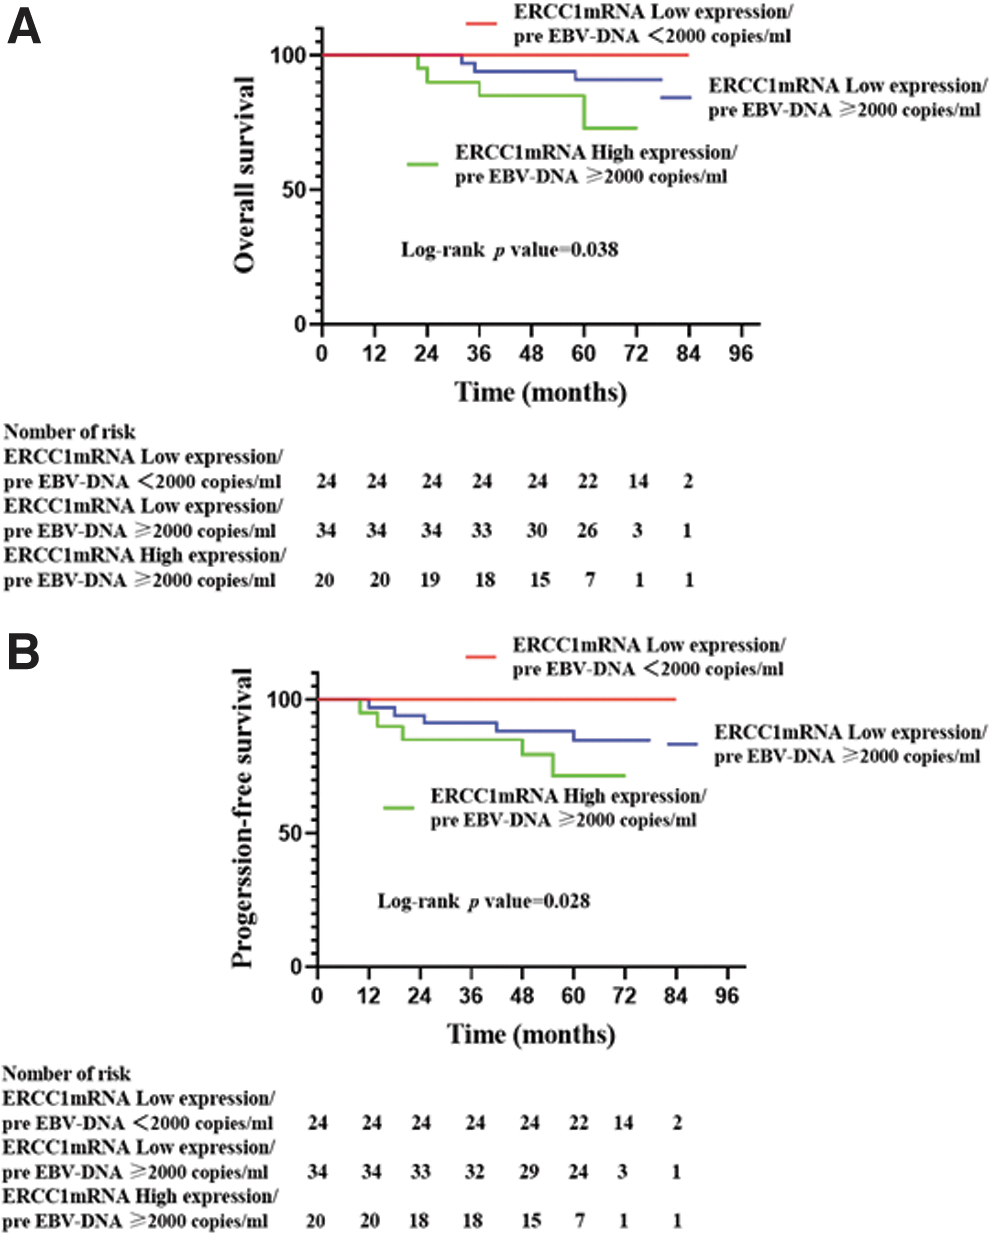
The Kaplan–Meier survival curves for stage II NPC patients displaying different combinations of ERCC1 expressions based on the cutoff and pre-EBV-DNA level. OS
Univariate and multivariate analysis for survival
In univariate analysis, ERCC1 mRNA based on cutoff value and ERCC1 mRNA expression/pre-EBV-DNA viral load were significant prognostic factors for OS (p = 0.037, p = 0.023) and PFS (p = 0.043, p = 0.014) (Fig. 5). However, after adjusting for covariates, multivariable analysis indicated that only ERCC1 mRNA expression/pre-EBV-DNA viral load was independent and significant negative prognostic factor for OS and PFS in patients with stage II NPC (HR: 4.290, 95% CI: 1.220–15.082, p = 0.023; HR: 3.461, 95% CI: 1.292–9.270, p = 0.014).
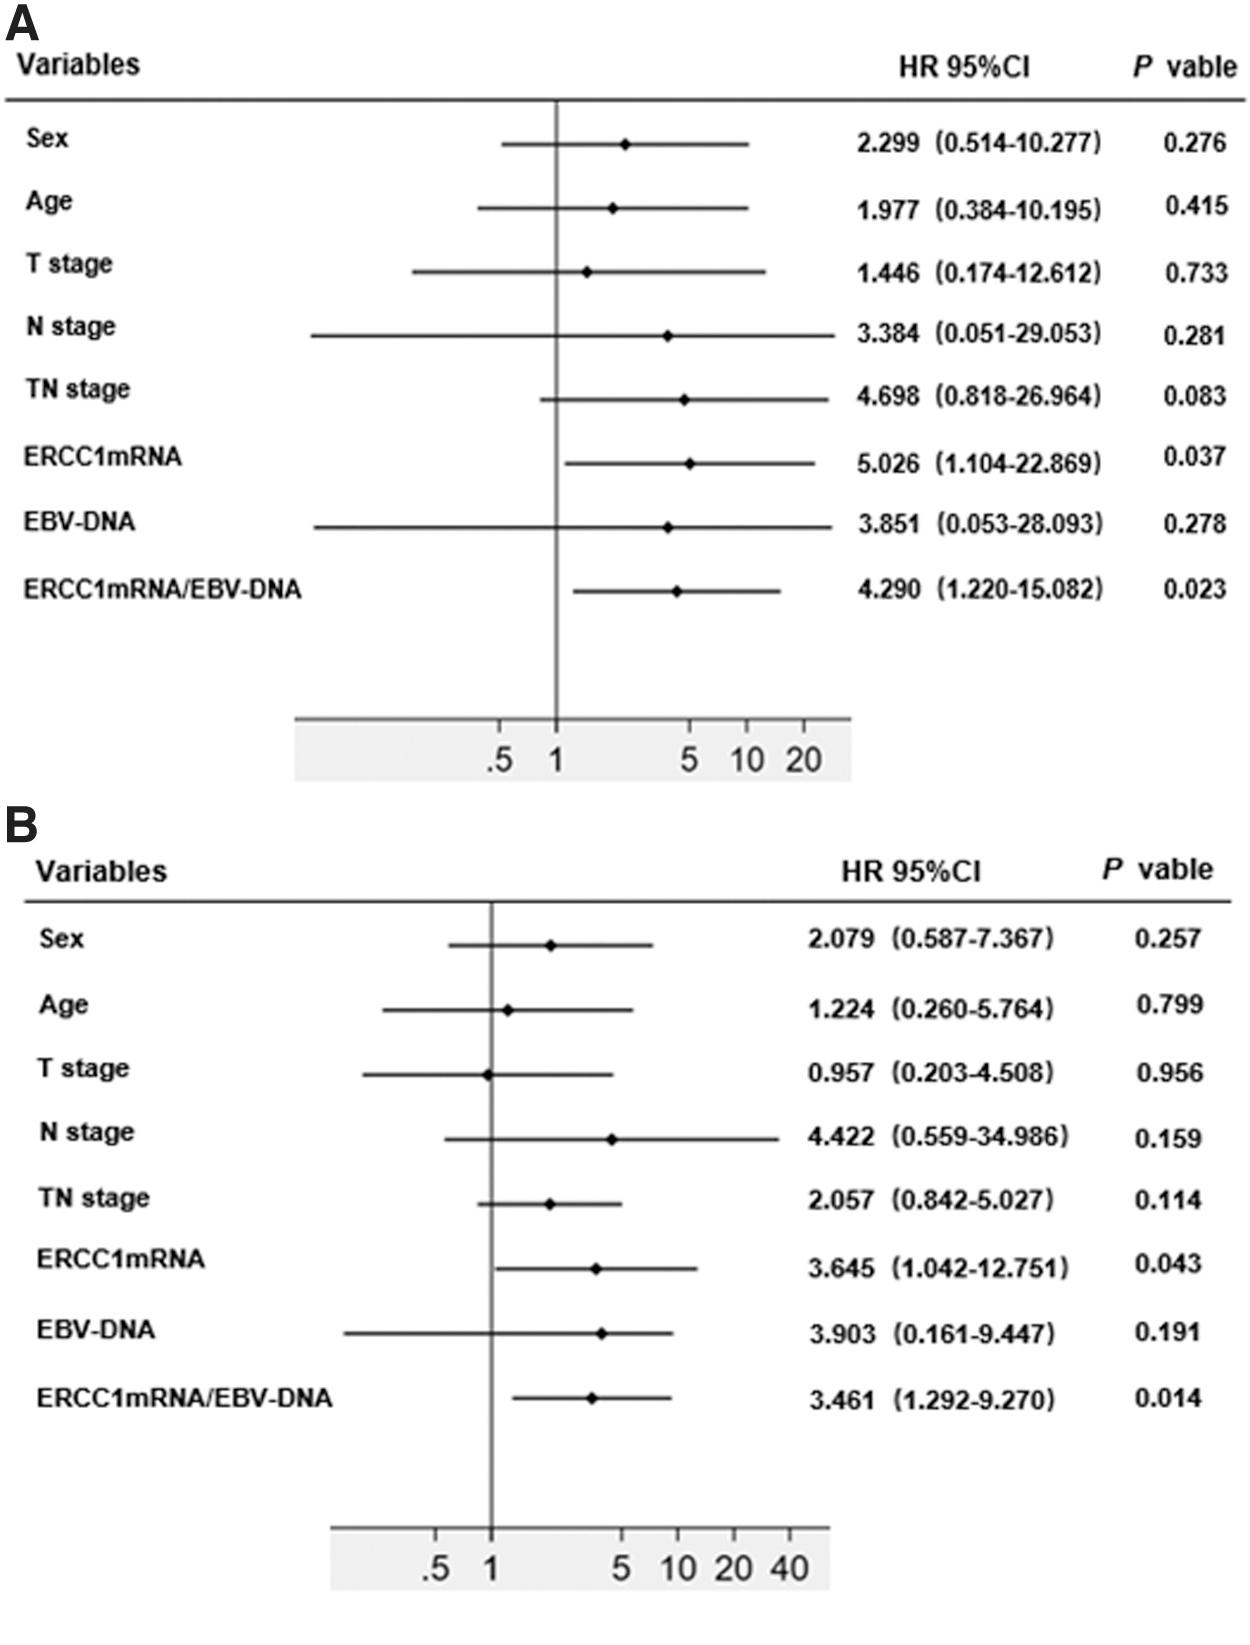
Forest plot of the association between clinicopathological variables and OS
Discussion
In this study, the ERCC1 mRNA expression level in NPC tissues determined by RT-PCR was examined rather than the ERCC1 protein level determined by the IHC; the latter is more commonly used in most studies. Each method has its advantages and disadvantages. IHC procedure is easier to perform but shows poorer reproducibility. In comparison, RT-PCR is more sensitive. In addition, ERCC1 has four protein subtypes: 201, 202, 203, and 204. Only subtype 202 is related to the efficacy of platinum chemotherapy. However, the commonly used protein antibody detection method of ERCC1 cannot distinguish different subtypes. 27,28 A meta-analysis by Song et al. suggested that RT-PCR method is superior to IHC in terms of detecting ERCC1 expression level to predict the outcomes of platinum-based chemotherapy in gastric carcinoma. 29 However, this is still controversial due to the differences in experimental reagents and criteria for assessment.
Our study showed that ERCC1 expression level was strongly correlated with N stage and TN stage but not significantly associated with gender, age, or T stage. This is different from the results of Olaussen et al., which found that ERCC1 expression significantly correlated with age, gender, and histological type, but not associated with tumor size and TNM stage. 30 It also showed that ERCC1 mRNA level was significantly associated with treatment outcomes in stage II NPC. Using the cutoff value obtained from ROC curve, ERCC1 mRNA can be divided into high expression and low expression groups. The OS and PFS of high expression group were significantly worse than those of low expression group. It is possible that the cancer cells with high ERCC1 expression have better ability to repair DNA damage, which is associated with resistance to platinum radiochemotherapy leading to poor response to initial radiotherapy and chemotherapy.
Several studies have shown that EBV-DNA levels in advanced stage NPC are significantly higher than those in stage I and II NPC. 31 –33 Du et al. observed that the level of EBV-DNA was correlated with age, T stage, N stage, and total stage in stage II–IV NPC. 34 However, TWU et al. reported that EBV-DNA was not correlated with clinical and pathological factors in stage III NPC. 35 In this study with stage II diseases, we found that EBV-DNA was significantly associated with T stage and TN stage but not significantly correlated with gender, age, or N stage.
Furthermore, in advanced stage NPC, patients with a high level of EBV-DNA have worse survival outcomes, and several prognostic subgroups can be classified based on their plasma EBV-DNA levels. However, in stage I and II disease, there were few studies on the prognostic value of pretherapy plasma EBV-DNA due to infrequent treatment failures. The optimal cutoff value of EBV-DNA has not been determined due to lack of harmonization of qPCR assay, and different values were reported in different studies. Chai et al. used 8000 copies/mL of pretreatment plasma EBV-DNA as a potential biomarker associated with OS for all stage NPC. 36 Lin et al., however, reported that OS and relapse-free survival were significantly lower in patients with pretreatment plasma EBV-DNA concentration ≥1500 copies/mL than those with <1500 copies/mL. 37 Zhang et al. in a meta-analysis of 14 prospective and retrospective control studies evaluated the relationship between EBV-DNA and half-life of EBV-DNA and survival, and proposed a 4-level risk stratification model. Patients with stage II disease and pretreatment plasma EBV-DNA <4000 copies/mL could be down staged to stage I and treated with radiation alone. However, patients with ≥4000copies/mL pretreatment plasma EBV-DNA should be reclassified into stage III and treated more aggressively. 24 Guo and colleagues analyzed 979 newly diagnosed nonmetastatic NPC patients with RPA model, and proposed a new staging model based on pretreatment EBV-DNA level using 2000 copies/mL as cutoff value and anatomical information. 22 Pretreatment EBV-DNA load 2000 copies/mL were extensively recommended as a predictor by most of Chinese expert consensus. In our study, we found that stage II NPC also has high EBV-DNA concentrations with 63% of the patients having >2000 copies/mL. Using this cutoff value, we show here that higher level of pretreatment EBV-DNA was associated with an increased risk of disease recurrence and had a marginally significant impact on 5-year OS. This revealed that pretreatment EBV-DNA is an effective biomarker for predicting disease progress or distant relapse. This finding is the same as Chen's study of stage II NPC. 38
Previous studies have confirmed that pretreatment EBV-DNA levels reflect the tumor burdens in vivo. Generally, the larger tumor diameter and volume, the more likely it is that there would be high-level EBV-DNA. 38,39 However, some studies deemed plasma EBV-DNA might be derived from active tumor cells, such as circulating tumor cells or micrometastatic lesions. 40,41 In addition, large tumor volume often accompanied with necrosis, and necrotic tumor cells secreted less EBV-DNA into the blood. Therefore, tumor volume did not always increase with the plasma EBV-DNA level; the level of plasma EBV-DNA depends on the number of active tumor cells rather than dead tumor cells. 39 Moreover, the large volume accompanied with necrosis may indicate tissue hypoxia and resistance to chemoradiotherapy, thus resulting in a worse survival outcome. ERCC1 expression was found to be more closely correlated with resistance to platinum radiochemotherapy. These reasons prompted us to try whether combining ERCC1 expression and pretreatment EBV-DNA will improve prognostic stratification for stage II NPC patients.
In our study, we found that the combination of pretreatment EBV-DNA and ERCC1 mRNA was shown to be a significant independent prognostic factor for OS and PFS. By combining ERCC1 mRNA and pretreatment plasma EBV-DNA, stage II NPC can be divided into three subgroups: ERCC1 mRNA low expression/pre-EBV-DNA <2000 copies/mL, ERCC1 mRNA low expression/pre-EBV-DNA ≥2000 copies/mL, ERCC1 mRNA high expression/pre-EBV-DNA ≥2000 copies/mL, and there were significant differences in OS and PFS between the three groups. Patients with ERCC1 mRNA high expression/pre-EBV-DNA ≥2000 copies/mL showed significantly worse outcomes, and possibly needed more aggressive treatment and closer follow-up after treatment. On the contrary, patients with ERCC1 mRNA low expression/pre-EBV-DNA <2000 copies/mL did much better, and their treatment could possibly be de-escalated and radiation alone without chemotherapy may be sufficient. The combination of ERCC1 mRNA and pretreatment EBV-DNA can improve prognostic value compared with using pretreatment EBV-DNA alone in stage II NPC patients who have relatively better survival outcomes.
Conclusion
In summary, our study demonstrated for the first time that integrated ERCC1 mRNA and pre-EBV-DNA levels may serve as a better predictor for the efficacy of CCRT treatment and long-term survival in stage II NPC patients. High ERCC1 mRNA and high pre-EBV-DNA combined result in significant decrease in PFS and OS. These patients may benefit from more aggressive treatment. However, due to different methods in detecting ERCC1 expression level and various cutoff values of ERCC1 level and pretreatment EBV-DNA reported, cutoff values of ERCC1 level and pretreatment EBV-DNA in early NPC need to be further verified; more studies will be required to validate our results. In addition, the limitation of this study is the relatively small sample size. Harmonization of quantitative assays and large sample size will need international efforts ultimately to achieve the goal of individualized treatment for stage II NPC patients.
Footnotes
Authors' Contribution
L.H., S.C., and M.W. contributed to the study design, literature research, interpretation of findings, and writing of the article. Y.S., J.L., Z.L., and Y.M. contributed to the follow-up, data collection and analyses. C.G. provided suggestion of statistics. H.H., X.T., and M.Y. contributed to critical review of data analyses and critical edit of the article. All authors reviewed and approved the final article.
Availability of Data and Materials
The datasets used and/or analyzed during this study are available from the corresponding author on reasonable request.
Ethics Approval and Consent to Participate
This study was approved by the Ethics Committee of Guangxi Medical University and the Forth Affiliated Hospital of Guangxi Medical University; written informed consent was obtained from each patient.
Disclosure Statement
The authors declare that they have no competing interests.
Funding Information
This study was supported by Guangxi Natural Science Foundation (No. 2011GXNSFA018236) and Liuzhou important Scientific Research & Technology Development Plan (No. 2014J030404) from Science &Technology of Guangxi. Funding bodies did not have any role in the design of the study, data collection, analysis, interpretation of data, or writing of the article.