
Abstract
Background:
The purpose of this study was to develop a rapid, reliable, and efficient tool for three-dimensional (3D) dosimetry treatment planning and post-treatment evaluation of liver radioembolization with 90Y microspheres, using tissue-specific dose voxel kernels (DVKs) that can be used in everyday clinical practice.
Materials and Methods:
Two tissue-specific DVKs for 90Y were calculated through Monte Carlo (MC) simulations. DVKs for the liver and lungs were generated, and the dose distribution was compared with direct MC simulations. A method was developed to produce a 3D dose map by convolving the calculated DVKs with the activity biodistribution derived from clinical single-photon emission computed tomography (SPECT) or positron emission tomography (PET) images. Image registration for the SPECT or PET images with the corresponding computed tomography scans was performed before dosimetry calculation. The authors first compared the DVK convolution dosimetry with a direct full MC simulation on an XCAT anthropomorphic phantom. They then tested it in 25 individual clinical cases of patients who underwent 90Y therapy. All MC simulations were carried out using the GATE MC toolkit.
Results:
Comparison of the measured absorbed dose using tissue-specific DVKs and direct MC simulation on 25 patients revealed a mean difference of 1.07% ± 1.43% for the liver and 1.03% ± 1.21% for the tumor tissue, respectively. The largest difference between DVK convolution and full MC dosimetry was observed for the lung tissue (10.16% ± 1.20%). The DVK statistical uncertainty was <0.75% for both media.
Conclusions:
This semiautomatic algorithm is capable of performing rapid, accurate, and efficient 3D dosimetry. The proposed method considers tissue and activity heterogeneity using tissue-specific DVKs. Furthermore, this method provides results in <1 min, making it suitable for everyday clinical practice.
Introduction
Primary liver cancer is the sixth most common malignancy globally, with very high mortality rates. 1 According to the 2018 Global Cancer Statistics, liver cancer was ranked as the third most common cause of cancer death worldwide. 2 The most prevalent primary liver malignancy is hepatocellular carcinoma, 1 while less frequent primary liver neoplasms are cholangiocarcinomas, angiosarcomas, and leiomyosarcomas. 3 Secondary hepatic metastases, such as liver metastasis from metastatic colorectal cancer, are also common. 4 Despite the latest advances in oncology treatments, liver cancer continues to be a therapeutic challenge for physicians. 5 The management of primary liver cancer is usually interdisciplinary and involves, among other methods, surgical resection, transarterial embolization (TARE), liver transplantation, systemic chemotherapy and immunotherapy, and novel targeted therapies, such as the multiple kinase inhibitor sorafenib. 5
TARE is an attractive therapeutic method, especially when it comes to nonresectable liver cancer. 4,6 TARE is based on the preferential blood supply of liver malignancies by the hepatic artery, whereas normal liver is mainly perfused by the portal vein (almost 70%), allowing for intra-arterial treatments to specifically target tumors, while sparing normal liver parenchyma. 7,8 This method involves the injection of a radioactive agent targeting the liver malignancy, thus limiting systemic irradiation and protecting the remaining healthy liver tissue. 4,6 Some of the most frequently used radioisotopes are β− -emitters, such as 90Y and 166Ho. 4
TARE is an effective, well-tolerated treatment with a favorable profile of side-effects as shown by large clinical trials. 9,10 However, pretreatment dosimetry is not currently optimized in a standardized and individualized manner. The suggested liver doses for TARE have been reported to vary between 80 to 150 Gy. 11,12 Yet, in selected patients (Child-Pugh A, unilobar disease, sufficient hepatic reserve), an absorbed dose exceeding 150 Gy to the treated liver lobe accompanied by a total mean liver dose of 150 Gy was well tolerated. It is postulated that dose heterogeneity allows for regional liver regeneration from low-dose regions in the normal liver parenchyma. In any case, the target is to maximize tumor dose beyond tumoricidal threshold, while minimizing the absorbed dose to organs at risk.
In daily clinical practice, the commonly used methods are not necessarily needed to evaluate the absorbed dose, but to prescribe the activity distribution. They are either based on the calculation of the total body surface area method 6 or on the Partition Model method. 13,14 The body surface area method is a semiempirical model that is based on the tumor load and liver volume, without considering tumor heterogeneity and type. 13 Partition Models are based on the hypothesis of a homogenous energy distribution in the tumor tissue and a homogenous energy distribution in the nontumor liver tissue. 7 Both methods, as part of TARE treatment, are used to assess the lung-shunt fraction through 99mTc-macroaggregated albumin (99mTc-MAA) scans to calculate the lung-absorbed radioactivity. 7 However, both models fail to provide a highly accurate personalized dosimetry because tissue heterogeneity and, more importantly, activity heterogeneity are not taken into account.
TARE treatment planning is based on the differentiation between the vascular compartments of the lungs, tumor, and healthy liver parenchyma, assuming that the radiation uptake is homogeneously distributed in each tissue. Specifically, the partition model is based on the calculation of the T/N ratio, which stands for the microsphere distribution among the tumorous and normal liver regions of interest. However, the fact that the microsphere distribution is significantly heterogeneous within the healthy and tumorous hepatic tissue (e.g., due to the presence of necrotic areas, previous therapeutic attempts with chemoembolization treatments as well as variable flow dynamics within the liver parenchyma) is hereby neglected. Accurate dosimetry should occur in the form of heterogeneous point sources, or voxel sources in three-dimensional (3D) case, which emit beta particles without neglecting the spatial distribution of the absorbed radioactivity dose. 15
In recent years, several dosimetry estimation models have been developed to achieve high-accuracy personalized dosimetry, such as Monte Carlo (MC)-based simulation models, dose-point kernel (DPK) convolution, 6,16 –18 and dose voxel kernel (DVK) convolution, which uses the voxel-level S-value method. 19 In addition, recent studies have successfully investigated the use of convolution superposition methods 20 and discrete-ordinates or grid-based Boltzmann solvers (GBBS) as a viable alternative to MC simulations for voxel-level absorbed dose calculation in nuclear medicine. 21 However, the former technique has not be tested yet on electron-emitting nuclides while the latter requires high computational time. Further studies have developed advanced mathematical simulations of the liver structures to assess the dosimetry at the microscopic scale. 11
In the direct MC approach, an accurate dosimetric calculation of the radiation uptake at the voxel level can be provided by accounting for multiple parameters, such as the differentiation in activity distribution and medium properties. However, this method can be significantly time consuming, 22 making it difficult to use in routine clinical practice. On the other hand, DPK convolution methods may speed up the absorbed dose calculation. DPK methods calculate the energy deposition of an isotropic activity source in a uniform medium, using MC simulations. 22,23 However, the inability to provide accurate energy deposition estimates in heterogeneous mediums is a severe limitation of this dosimetry approach. 22 Widely used DPK methods cannot take density heterogeneity into account and treat the human body as a water- or soft tissue-equivalent medium. 24 –28 Several methods addressing this problem have been reported. Dieudonné et al. 29 proposed a simple density-correction method for soft tissues. However, lung tissue was not taken into consideration for density correction and the technique was applied only on a single test case. Mikell et al. 30 proposed the combination of density correction with the local deposition (LD) method, taking into account different tissue heterogeneities. This method was evaluated on several clinical cases. Despite the fact that a very good agreement with direct MC simulations was reported for soft tissue (≈5%), the accuracy deteriorated significantly for lung tissue (≈17%–20%).
The purpose of this study was to develop a rapid, reliable, and efficient tool for 3D dosimetry treatment planning and post-treatment evaluation of liver radioembolization with 90Y microspheres, using tissue-specific DVKs that can be used in everyday clinical practice. The proposed algorithm incorporates the multiple DVK approach, in which the dose is considered to be distributed around a voxel source instead of a point source. 31 The algorithm was validated against a direct MC simulation using an anthropomorphic XCAT phantom as a medium 32,33 and was tested in 25 clinical cases, either in pretreatment 99mTc-MAA single-photon emission computed tomography (SPECT)/computed tomography (CT) scans or in post-treatment 90Y microsphere-positron emission tomography (PET)/CT scans. The proposed technique considers tissue heterogeneity and nonuniform activity distribution, which allowed us to minimize current dosimetric limitations. With the proposed algorithm, the authors established a patient-specific and highly accurate dosimetric calculation protocol for TARE.
Materials and Methods
GATE MC simulation toolkit
The simulations of this study were performed using the GATE (v8.0) MC simulation toolkit 34 –36 and the well-validated general-purpose Geant4 (v4.10.5) toolkit. 37,38 GATE is a reliable toolkit for MC simulations that are related to particle transport in nuclear medicine. It can efficiently simulate voxelized and analytical phantoms and a wide range of predefined or customized particle-emitting sources. 36 All simulations were performed using the “histogram”-type source model of Geant4, and the generated kernels used in this study were previously and extensively validated by members of the authors' research team 39 by being compared to other MC codes. The 90Y continuous beta spectrum ranged from 0 to 2.2 MeV, with a mean energy of 0.9337 MeV and a half-life of 2.67 d (64.1 h). 39,40 The physical processes were simulated using the “emstandard_opt3” model, which is designed for any application that requires more accurate electron and ion tracking. All of the physical processes were included in the simulation, namely positron annihilation, gamma conversion, Bremsstrahlung, electron ionization, multiple scattering, radioactive decay, and Rayleigh and Compton scattering. 36 The kinetic energy range was set between 0.1 keV and 10 GeV, and the number of bins for the Lambda tables (DEDXBinning) and the mean energy loss on a given step (LambdaBinning) were set at 220. The parameter “electronStepLimiter” was also used to simulate the nonlinear electron track more accurately and was set at 1.0 mm.
DVK calculations
A nonmonoenergetic uniform 90Y voxel source with isotropic emission was simulated at the center of a homogeneous spherical medium, placed in a void environment. 31 The emitted particles deposited their energy uniformly inside the sphere. A 3D dose map was generated using the “DoseActor” option of GATE, where the deposited energy is stored in MeV units per particle. The parameter ‘‘stepHitType” was also used to randomly deposit the energy of the hits along the dose map.
DVKs for two different materials (liver and lungs) were generated. The authors simulated 2 × 10⁹ primary events to achieve an adequately low statistical uncertainty. The material composition of various tissue types in GATE was accurately defined by the user (the material density, constituent elements, individual abundances, and atomic number). If the material was described as a mixture of elements, then the relative combinations of these elements were defined, including their mass fractions, as shown in Table 1.
Tissue Characteristics in the GATE Monte Carlo Simulation Toolkit
A, molar mass; Z, atomic number.
Due to the fact that 90Y β particle range in water is 11 mm,
7
the chosen radius of the spherical medium for the liver DVK (
MC simulations and DVK convolution
MC simulation and anthropomorphic model
To validate simulation efficacy, the authors compared these results regarding the absorbed dose in the tumor, liver, and lung tissue against a direct full MC simulation (ground truth) using an anthropomorphic XCAT phantom 32,33 (Fig. 1).
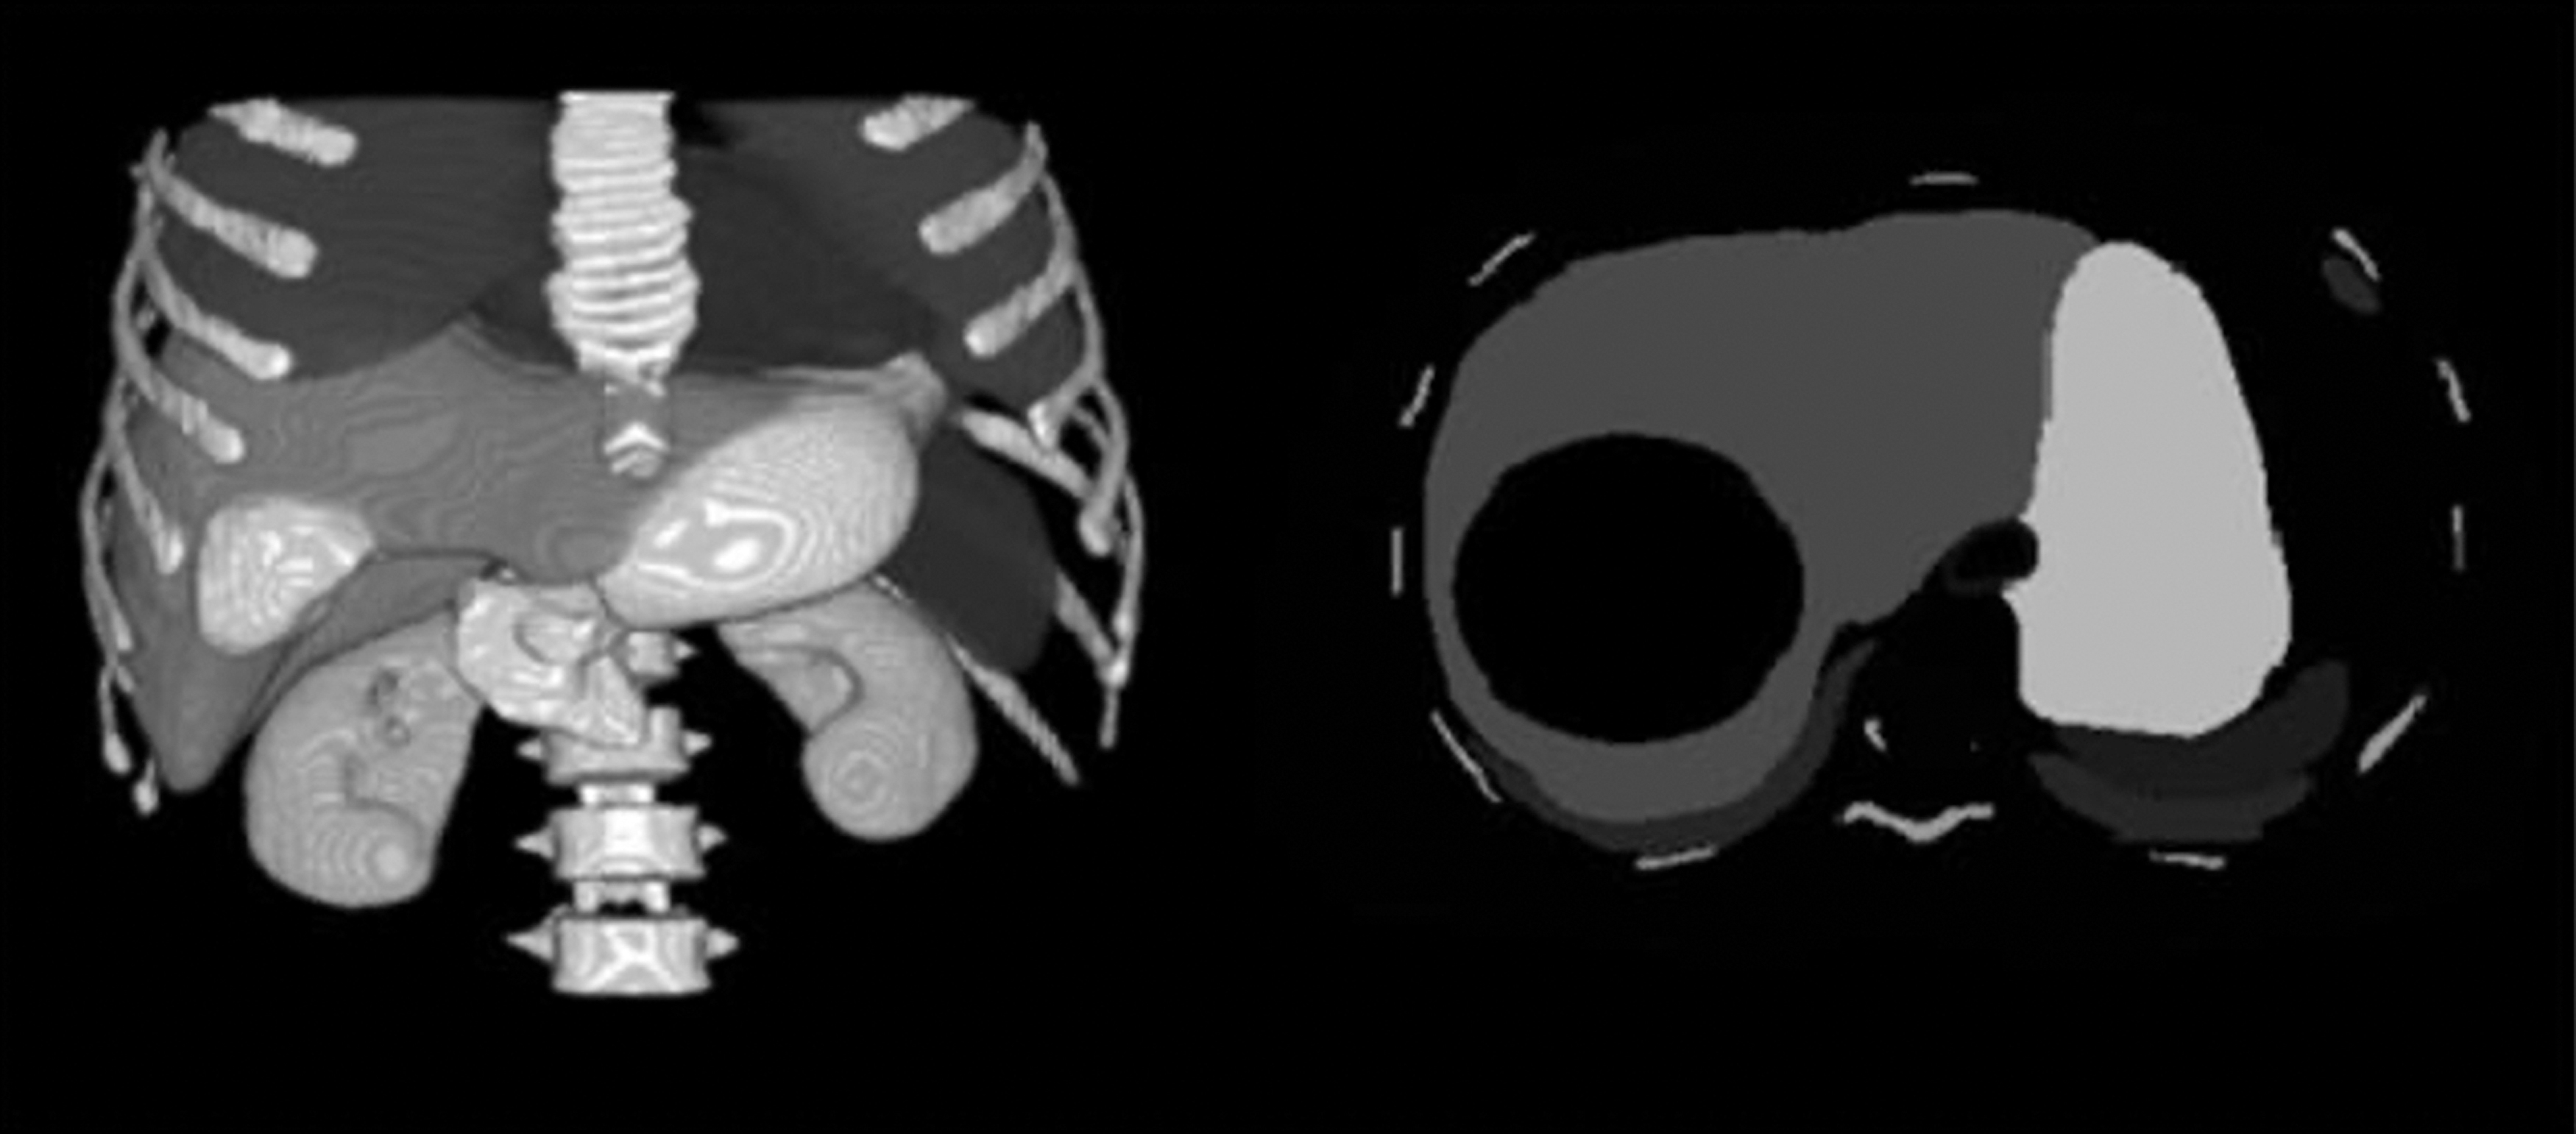
3D (left) and axial view (right) of the anthropomorphic XCAT phantom used to validate the authors' technique. 3D, three dimensional.
An XCAT adult male phantom was generated, which was 171 cm high, including the whole body-torso (without arms and legs). The phantom was segmented into seven different tissue types (i.e., spleen, pancreas, bones, lungs, liver, kidney, and tumor), and the rest of the body was considered water-equivalent tissue. The phantom consisted of 351 × 351 × 351 voxels, with a voxel size of 1 × 1 × 1 mm3, to achieve adequately high accuracy. Inside the liver, a spherical tumor of 4.3 cm radius was designed, which corresponded to 19.25% of the total liver volume.
A total activity of 3 GBq of 90Y was prescribed to the liver, assuming that there was no extrahepatic leakage or lung shunting. A theoretical treatment plan was simulated with a tumor-to-normal liver ratio (RT/N)
7
equal to 20.77. Based on Ho et al.,
45
in 71 clinical cases, the RT/N ranged from 2.06 to 18.07, slightly below ours. Also, in the study of Manalang et al.
46
that concerned 47 patients, RT/N ranged from 0.8 to 22.3. The RT/N was determined by using Equation (1):
where A is the activity and M is the mass corresponding to the tumor and the normal liver. This resulted in a distribution of 2.6 GBq to the tumor tissue and 0.4 GBq to the normal liver tissue. The 3D dose map was converted from MeV in Gy units using Equation (2). The results are shown in Table 2.
Monte Carlo Simulation-Absorbed Dose for Each Organ of Interest and Its Corresponding Statistical Uncertainty
For comparison, the DVK-absorbed dose and the differences between the two approaches are also presented.
DVK, dose voxel kernel; MC, Monte Carlo.
DVK convolution methods
As described above, an alternative method was used to perform image-based dosimetry, other than direct MC simulation; the dose in the region of interest was estimated by convolving a DVK with the activity decay map of the patient (SPECT or PET images). Basically, a DVK is a cube of voxels; the mean dose distribution of a certain radionuclide (90Y in this study), as it randomly disintegrates, is deposited around the central voxel of the cube. In this study, the authors' method was compared and validated against a direct MC simulation, which was considered the ground truth for the dosimetric results. The medium used for the simulations was the anthropomorphic XCAT phantom. 32,33
Every voxel of the activity map was convolved with its corresponding homogeneous tissue-specific equivalent tissue DVK. The advantage of this method is that it takes tissue heterogeneities into consideration and therefore leads to better dosimetric results. The voxel classification of the activity map was determined on the basis of its corresponding co-registered CT and will be explained and described analytically below (Segmentation Methods section).
Nonetheless, in the case of treatment with radioembolization with 90Y microspheres, activity heterogeneity is also a critical issue. Therefore, an image preprocessing step was added to the original activity map. A new proportional map was created on the basis of the original activity map by dividing all voxels with the total activity injected to the phantom. In this way, an activity percentage scaling (APS) map was created, in which each voxel was the correspondent proportion of the total activity of the original activity map. This new map practically depicts the activity distribution ratio among all organs and is used by the algorithm for convolving each DVK with its corresponding organ (DVKT). A comparison was made by performing convolution with the DVKT against a direct full MC simulation. The algorithm's workflow is shown in Figure 2.
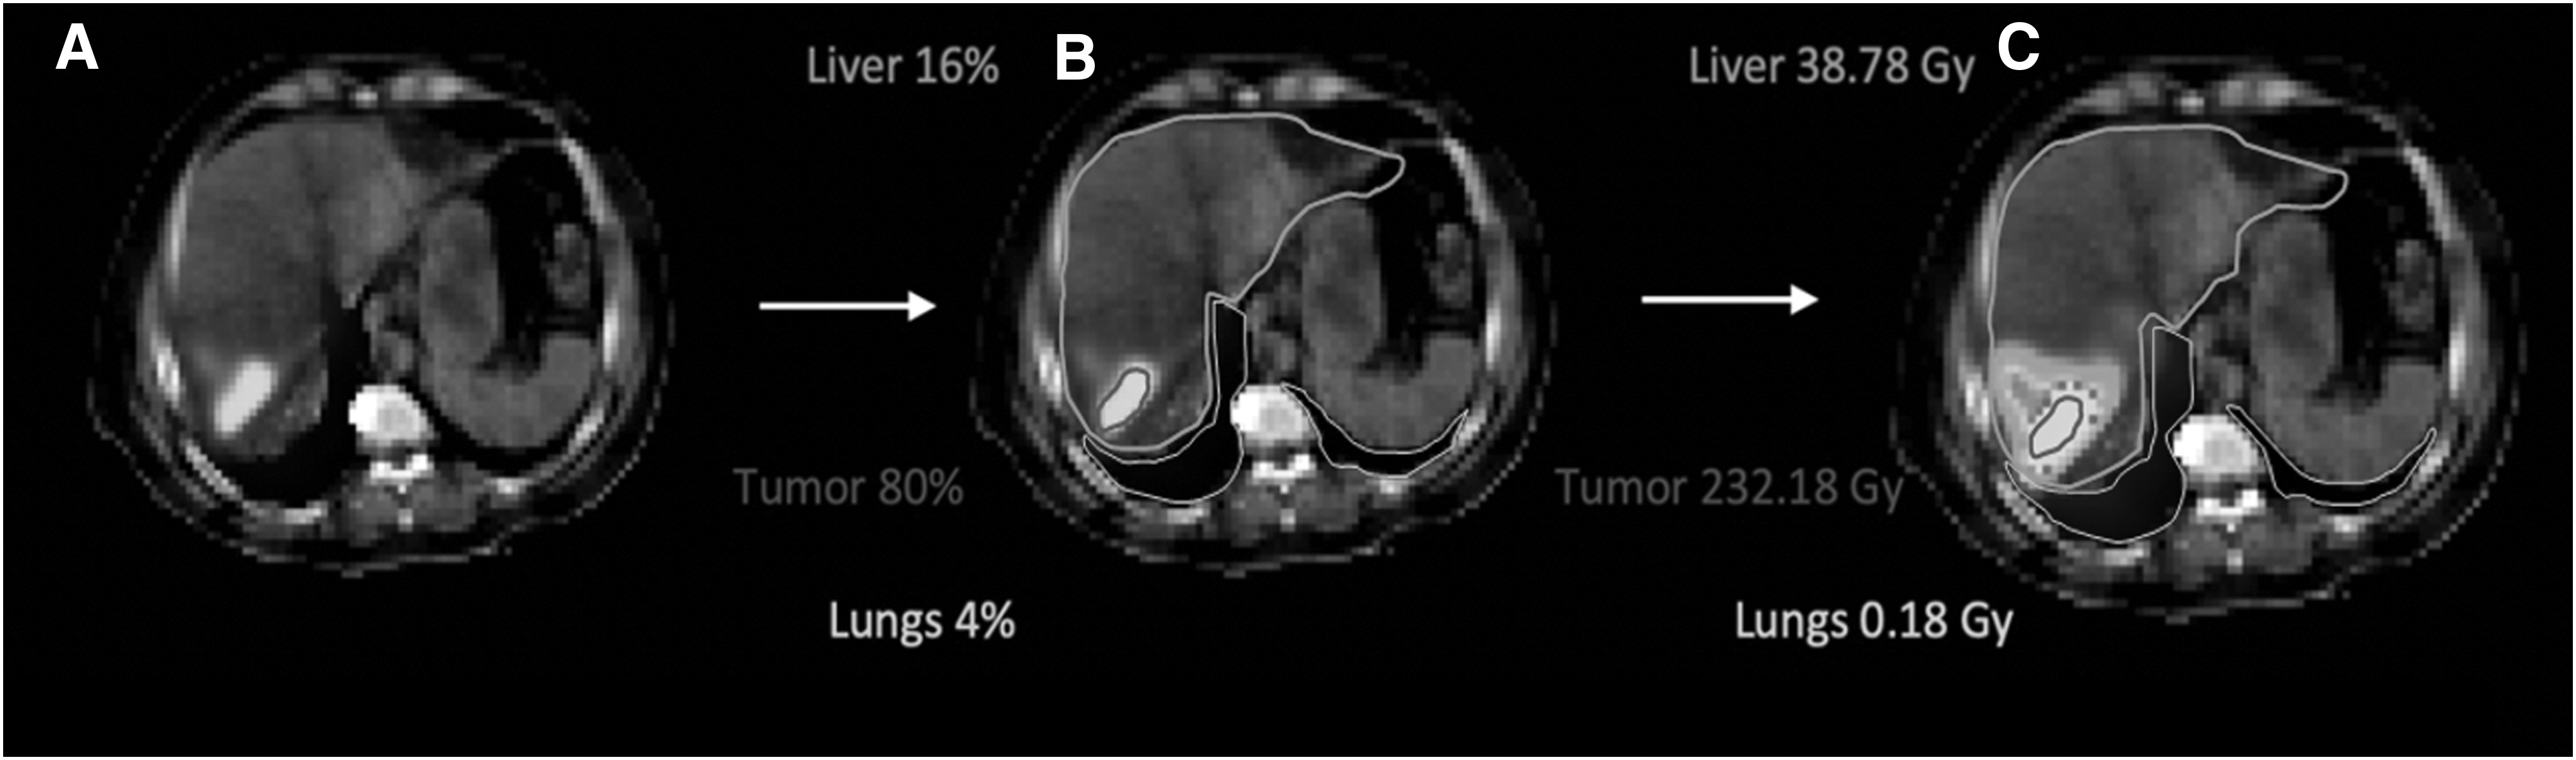
Example of the algorithm workflow:
The formula used to measure the total absorbed dose, using any method of DVK convolution, is described in Equation (3):
where λ is 90Y decay constant.
For the tested simulations in real clinical scenarios, APS was defined as the biodistribution of the 90Y derived from the patients' SPECT or PET scans. This was performed to account for the activity and tissue heterogeneity, not only among the different human organs but also within the tissue of each organ individually. The results are shown in Table 3.
Monte Carlo Simulation-Absorbed Dose for Each Organ of Interest and Its Corresponding Statistical Uncertainty
The first 14 patients underwent a 90Y post-treatment PET/CT scan, and the remaining 11 patients underwent a 99m Tc MAA pretreatment SPECT/CT scan.
Tc-MAA, 99m Tc-macroaggregated albumin; CT, computed tomography; DVK, dose voxel kernel.
Statistical uncertainties
The statistical uncertainties of the MC simulations were calculated using the formula in Equation (4), and the results are presented in Table 2:
where ɛκ
is defined as the statistical uncertainty at pixel k, N is the total number of primary events in the simulation, and dk
,i
is the deposited energy from the primary event i in pixel k. The dose differences were calculated using Equation (5).
Clinical dataset
To further evaluate their proposed convolution method, the authors tested a similar approach using clinical patient data. For this purpose, the authors randomly selected 25 patients from the University Hospital of Patras Oncology Department, who had been treated for hepatocellular carcinoma, other types of primary liver cancer, or secondary hepatic metastases with 90Y radioembolization treatment. Eleven of these patients were assessed on the basis of their pretreatment 99mTc-MAA SPECT/CT scans, and 14 on the basis of their post-treatment 90Y microsphere-PET/CT scans. As far as the patient pool is concerned, 22 patients were male and three were female, while their mean age was 72 years, ranging from 61 to 79 years. All steps of this study were made in accordance with the ethical guidelines of the Declaration of Helsinki and were approved by the University Hospital of Patras Institutional Review Board, while an informed consent for data collection, processing, and analysis was obtained from the selected patients. The injected radioactivity of 90Y ranged from 1.26 to 4.76 GBq. The SPECT/CT images were obtained within 30 min and PET/CTs within 2 h of the radionuclide injection.
Segmentation methods
The APS were automatically co-registered to their corresponding CT images using their header files. Since SPECT images have a different spatial resolution than CT images, the latter were resampled to match the voxel size of the former through bicubic interpolation for both full MC simulations and tumor delineation.
The tumors and organs of interest were classified by a multitask algorithm to efficiently minimize the number of parameters needed for accuracy. The classification or segmentation of the organs of interest from the CT image was determined by the high differences of Hounsfield Unit (HU) values. The tumor and lungs were segmented by the algorithm in all clinical cases. Automatic segmentation of the liver was not feasible with this approach; thus, it was thus segmented manually.
The automatic tumor delineation from the APS was decided by applying a fixed threshold in the case of SPECT images or by applying a threshold based on the Otsu method in the case of PET images. The level or the method of thresholding was not investigated in this study, but was decided on the basis of already published literature. 47 –49
Threshold methods for tumor segmentation
As it is not possible to define a tumor area from a SPECT/CT or PET/CT scan because of the poor contrast of CT scans, a different approach was used to delineate the tumor area on the basis of the activity map itself. By using two different thresholding methods, a binary mask was created. The latter was also co-registered with the CT scans, and every voxel of the mask was classified according to the previously described segmentation methods. The registration was used to ensure that all of the voxels concerning the tumor area would be convoluted with the correct DVKT.
For the SPECT images, a fixed threshold was set to 42% 47 of the maximum voxel value. This method was used because of its simplicity and widespread use. 47,48
For the PET images, a fixed threshold did not result in accurate segmentation of the tumor; therefore, the Otsu method was used, since it was reported to produce more accurate results 49 ; this was confirmed by the nuclear medicine physicians. With this method, the threshold value is adapted and automatically decided on the basis of the histogram voxel values of the image.
Before applying the DVKs, the authors performed image preprocessing of their clinical data. To match the DVKs' voxel size, all images were re-sampled to a 1 × 1 × 1 mm3 voxel size with various interpolation methods to achieve minimum loss, especially in the case of the activity attenuation maps where all the activity/counts had to be preserved. The activity attenuation images (SPECT or PET) were linearly resampled. Their corresponding CTs and the aforementioned binary mask (i.e., tumor tissue) were resampled through bicubic and nearest neighbor interpolation, respectively.
In the proposed algorithm, the authors alleviated the limiting homogeneous medium or activity distribution assumption of the DVK method by performing a convolution between the absorbed activity percentage and the corresponding tissue-specific DVK for each tissue or organ of the human body and by using a semiautomatic, nontime-consuming, and precise dosimetry model.
Results
DVK statistical uncertainty
A total statistical uncertainty of <1.6% was achieved for all simulated DVKs. Up to a 7.5-mm radius, the statistical uncertainty was <0.75% for all media. The associated statistical uncertainty at each voxel along the sphere was <6%.
Validation of DVK technique vs GATE MC dosimetry
The designed DVKs were validated against a direct full MC simulation. As previously mentioned, a total of 3 GBq 90Y was injected into the liver of an XCAT anthropomorphic phantom with the following distribution pattern: 2.6 GBq in the tumor area and 0.4 GBq in the rest of the liver tissue, with no extrahepatic or lung shunting. From the extracted energy distribution map, they calculated the absorbed dose in each organ of interest using Equation (2). The absorbed dose in each organ and the corresponding statistical uncertainty for a simulation with ≈5 × 10⁹ primary events are presented in Table 2. The two critical tissues, liver and tumor, provided a statistical uncertainty of <2%.
The total number of simulated primary events N was calculated using Equation (6), as they assumed that there was no lung or extrahepatic shunting and that 90Y was located only in the liver and tumor tissue:
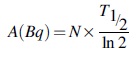
where A is the total prescribed activity, T 1/2 is the 90Y half-life, and the decay constant λ of 90Y is 3.008 × 10⁻⁶·s−1.
The material of the designed tumor was set as liver equivalent (primary tumor conditions). Deposited doses in the liver and the tumor, as measured from the direct MC simulation, were 19.81 and 335.87 Gy, respectively. The comparison between the DVKT and the MC simulation revealed a 2.41% difference for the tumor tissue and 6.32% for the liver tissue. More specifically, the calculated doses using DVKT were 21.1483 and 327.7851 Gy for the tumor and liver tissue, respectively. As far as the lungs are concerned, the measured difference was 38.71%. However, the statistical uncertainty in this case was as high as 36.96%; this may be attributed to the physical properties of the lungs, which mainly consist of air, and the source, which mainly emits electrons, being distant from the lungs.
Consequently, the tissue-specific DVKs were constantly close to the MC simulation results, as shown in Table 2. In particular, the comparison of the results was shown to be accurate in the tumor and the liver, where uncertainties are minimal. This encouraged us to test the algorithm using real patient data.
Clinical evaluation
The authors applied the developed algorithm to 25 clinical cases of patients diagnosed with liver tumors. The absorbed dose was calculated by taking into account the different tissue and activity heterogeneities. Every slice of the SPECT or PET images was registered with its corresponding CT slice to determine the activity distribution in the organs of interest. The APS in the tumor, liver, and lungs in 11 99mTc MAA pretreatment SPECT/CT and in 14 90Y post-treatment PET/CT images was convolved with the corresponding DVKT. A comparison was made by performing convolution with the DVKT against a direct full MC simulation in every individual case.
In isolated patients, because of the location of the liver tumor (e.g., in the inferior liver compartments), the absorbed lung radioactivity was insignificant (<1 Gy). In those cases, lung dose measurements were considered unnecessary. The differences in dose distributions for every patient case and in each tissue (liver, lungs, and tumor), as well as the statistical uncertainty, are shown in Table 3.
The comparison between the DVKT and the MC simulation revealed a mean difference of 1.03% for the tumor and 1.07% for the liver, with a standard deviation of ±1.21% and ±1.43%, respectively. In lung tissue, in cases where the dose was significant and needed to be measured, the mean difference between MC and DVK approaches was calculated to 10.16% ± 1.20. These results demonstrate the consistency and accuracy of the authors' method in both SPECT and PET images. The agreement between MC and DVKT appears to be better and more consistent when the authors applied their method in the clinical dataset, even though in both cases, they used the exact same parameters during the calculations (e.g., same energy spectra and same resolution). This was something to be expected for two main reasons: first, because of high differences in statistical uncertainties, and second, and more importantly, due to how the authors have decided the DVKs to distribute the convoluted activity.
More specifically, as far as the lung's case is concerned, succeeding on a very low statistical uncertainty (measuring only the tails of betas) in an anthropomorphic phantom, especially with such high-resolution settings (351 × 351 × 301), it is extremely difficult and it would had consumed extremely high computational time (the authors estimate more than a month) in contrast to the real clinical data where the statistical uncertainty for DVK convolution was <1.6%. It is worth noting that the observed accuracy deterioration was significant only for the lung tissue. As far as in liver's and tumor's case are concerned, that is not the issue, as they succeeded a statistical uncertainty as low as in the DVKs. In case of liver and tumor, not only the testing in the authors' real clinical data showed better results but also more consistent. These differences could be explained on how the convoluted activity is distributed. In the authors' case, during the convolution process, they chose for the source voxels to collapse their activity to the voxel centroid. In the study with the anthropomorphic phantom, the activity was set only to the tumor and to the liver. This means that the peripheral liver voxels will convolute with no ideal boundaries (voxels not applicable to convolve). The same explanations apply for almost 1/4 of the peripherally tumor voxels.
Discussion
In this study, the authors developed a fast voxel-based algorithm that uses two DVKs, depending on the tissue of interest. It was initially validated by direct MC simulation on an anthropomorphic XCAT phantom and then tested on clinical data. This approach facilitates the estimation of the absorbed dose to healthy tissue and the tumor, in reference to SPECT- or PET-derived activity maps. The dosimetric results of the authors' approach are in good agreement with those of the direct MC simulation, with the advantage of a faster calculation. In particular, while each MC simulation was conducted within 5 d, the authors' approach reduced the execution time to <1 min per patient.
As promising as it may be, there is no standard dosimetric procedure for radioembolization therapy using 90Y microspheres. Evidently, the failure to differentiate between the tumor and the healthy liver tissue leads to the unavoidable classification of simple and conventional methods as safety planning rather than as treatment planning. 30
A direct MC simulation approach, despite its dosimetric accuracy, is difficult to implement in clinical practice because of the increased computational time. In contrast, the DVK convolution method is less complicated to implement and is able to speed up the dosimetric calculations. Alternative approaches that aim to provide accurate dose calculation with high efficiency have been reported in the literature. Dieudonné et al. proposed a simple density-correction method when applying the DVK method. Density correction was applied to soft tissue without including lung tissue. 29 The authors investigated the effect of density correction on dose calculation using three different clinical cases. Each case corresponded to a different radionuclide (131I, 177Lu, and 90Y microspheres). The density-corrected DVKs were compared with direct MC simulation. Their approach differed from MC results in liver tumorous area for −3.6% and −1.3% for the healthy area, respectively, for 131I, and 0.8% for both tumorous and healthy liver for 90Y microspheres. For the 177Lu dataset, they reported a difference of −0.9% for the liver area. Mikell et al., in a more extensive study, evaluated the impact of using soft-tissue kernel with density correction (SKD), soft-tissue kernel (SK), and the LD method when applied to pretherapy 90Y SPECT/CT images. 30 They compared those different methods against a direct MC simulation considering tumor, healthy liver area, and the right lung. They reported that SKD, SK, and LD were within 5% difference compared to MC for tumor and healthy liver area, while LD and SKD overestimated the dose in the right lung on average by 17% and 20%, respectively. They found that using simple SK, the absorbed dose in the lung is significantly underestimated (up to 60%).
An alternative method to replace MC simulations in nuclear medicine for voxel level-absorbed dose calculations has also been reported by Mikell et al. 21 They used the GBBS method with additional angular discretization concerning the 90Y. Differences between the GBBS and MC were similar to that seen among other MC codes. The drawback of their method is the high computational demands (up to 24 CPU cores and 60 GB of RAM). Sanchez-Garcia et al. 50 implemented a collapse cone superposition method that was implemented and validated for the dosimetry with photon emissions. Although their research was tested only for radionuclides emitting monoenergetic photons, their algorithm was able to achieve up to 97% accuracy compared to direct MC simulations, while taking into account tissue density heterogeneity. The technique has a few limitations: (1) only a mean absorbed dose can be assessed, (2) the human body is mainly soft tissue and water, and (3) energy distribution variations are not considered. 51 In this study, the mean difference, as determined by comparing DVKT with MC simulation, alleviates these limitations. The mean dose difference in the lung tissue was 10.16%. Smaller variations were found for the liver's DVKs (mean, 1.07%). Moreover, personalized patient data, such as the anatomical morphological characteristics of the source and target tissues, were adequately assessed. 52
Apart from considering the dosimetric aspects, an ideal treatment plan should be able to standardize a method for segmenting its compartments. Although the segmentation of surrounding healthy tissues, as well as that of the tumor, is important in voxel-based dosimetry, the importance is indicative of the total absorbed energy and not of the exact calculation of the latter. 30 When it comes to accurately calculating absorbed radiation during a standard selective radiation session, the limited literature data mostly concern the liver tissue. 29 However, dosimetry is also crucial in the treatment of the lungs because lung-absorbed radiation is one reason for reduced activity delivery. 30
To address these limitations, the proposed algorithm uses SPECT/CT or PET/CT image registration based on the CT HU and can segment the lungs efficiently. However, there is a need to standardize the segmentation of the tumor area. A convenient method would be to extract the volume-of-interest area from the diagnostic CT or magnetic resonance imaging image and register it as the pretherapy SPECT/CT. However, because of the difference in patient positioning or breathing-related artifacts, misalignment between the anatomical delineations and the SPECT reconstruction may occur. 6 A threshold cutoff value of ≥42% was applied to the SPECT images, while the Otsu method was used for the PET images. These methods were selected because of their efficiency, simplicity, and wide use in tumor segmentation. In addition, the liver is a common metastatic organ for many tumors, such as colorectal, pancreatic, breast, and lung carcinomas. Using a tissue-specific DVK will give even better dosimetric results. 53 Finally, the algorithm was tested in 25 clinical cases with various liver tumors.
Using 11 99mTc MAA pretreatment SPECT/CT and 14 90Y post-treatment PET/CT images, the authors calculated a mean dose difference of 1.07% ± 1.43% and 1.03% ± 1.21% between the direct MC simulation and DVKT for the liver and tumor tissue, respectively. The corresponding differences between DVKT and MC simulation for lung tissue were 10.16% ± 1.2% in cases in which the absorbed doses occurred >1 Gy. To the authors' opinion, there are not many more things to do in the liver tissue, but to research approaches and decrease the error on calculated doses to the lung tissue, and perform all calculations in less time.
The main limitation of the suggested algorithm is not related to dosimetry, but rather to its poor performance with respect to liver segmentation. Future studies should focus on optimizing the algorithm to provide a complete treatment plan that can be transferred to everyday clinical practice. With the addition of the auto-segmentation process, this algorithm would simplify the planning process without the need of supercomputers, while minimizing the computation time. The suggested approach would require <2 min of computational time to provide a complete treatment plan in a clinical environment.
Conclusions
In this study, the authors present a multimodal, image-based dosimetry approach for fast, accurate dose calculation in patients undergoing TARE therapy. This algorithm offers the advantage of considering both tissue and dose heterogeneities, as well as the individualized patient-specific anatomic parameters of the source and target tissues. The applied computational characteristics and the used assumptions allowed us to achieve a good compromise in the calculation time and an accurate estimated absorbed dose. This approach can optimize the treatment planning procedure, which will eventually result in improved overall patient survival.
Footnotes
Acknowledgment
The authors would like to thank the UT MDACC Department of Scientific Publications for their professional language editing on the article.
Disclosure Statement
There are no existing financial conflicts.
Funding Information
This work was partly supported by computational time granted by the Greek Research & Technology Network (GRNET) in the National High Performance Computing facility, Advanced Research Information System, under project ID pr005035_taskp-NuPeDose. This research is co-financed by Greece and the European Union (European Social Fund [ESF]) through the Operational Programme “Human Resources Development, Education and Lifelong Learning” in the context of the project “Strengthening Human Resources Research Potential via Doctorate Research” (MIS-5000432), implemented by the State Scholarships Foundation (IKY). This research is co-financed by Greece and the European Union (European Social Fund) through the Operational Programme “Human Resources Development, Education and Lifelong Learning” in the context of the project “Reinforcement of Postdoctoral Researchers-2nd Cycle” (MIS-5033021), implemented by the State Scholarships Foundation (IKY).” Funding was also received from the European Research Council under grant agreement ERC-2014-StG 638284, MINECO (Spain) through project DPI2016-75458-R, and by ESF (EU) and Aragón Government through BSICoS group (T39_20R). This work was supported by the European Regional Development Fund (ERDF), Greek General Secretariat for Research and Innovation, Operational Programme “Competitiveness, Entrepreneurship and Innovation” (EPAnEK), under the frame of ERA PerMed (project POPEYE T11EPA4-00055).