




Abstract
Background:
The immune system is well known to exert tumor immunosurveillance effects, and that immune cells circulating in the peripheral blood affect tumor prognosis. The study investigated the effect of estimated dose of radiation on circulating immune cells (EDRIC) and tumor control for esophageal cancer patients treated with concurrent chemo-radiotherapy.
Materials and Methods:
A total of 146 esophageal cancer patients treated with radiotherapy between January 2016 and June 2020 were retrospectively identified. We determined EDRIC, known prognostic factors, and the association of these factors with progression-free survival (PFS) and overall survival (OS).
Results:
The median follow-up was 17.9 months (2.7–60.4 months). The 3-year OS was 39.2%. Severe post-treatment lymphopenia was observed in 84.2% of patients. A negative correlation between EDRIC and absolute lymphocyte count was found (r = −0.679; p < 0.001). Patients with EDRIC ≥10.3 Gy were more likely to demonstrate grade 4 lymphopenia (55.2% vs. 4.5%; p < 0.001). Patients with grade 4 lymphopenia had a worse OS and PFS. On multivariate analysis, EDRIC was independently associated with OS (hazard ratio [HR], 1.142; p = 0.016) and PFS (HR, 1.121; p = 0.019).
Conclusions:
EDRIC can predict lymphocyte reduction and poor prognosis for esophageal cancer patients treated with radiotherapy.
Introduction
Esophageal cancer is a common malignant tumor affecting the digestive tract and associated with the seventh- and sixth-highest morbidity and mortality rates globally. 1 In China, the incidence of esophageal cancer is high. In Japan, it exceeds 250,000 annually. 2
Radiotherapy is an important treatment option for esophageal cancer. Aside from killing tumors, it also impacts the body's immune system, including lymphocytes, which are closely related to the occurrence and development of tumors. 3 Lymphocytes in the human peripheral blood are the most radiosensitive cell types in the body, and a dose as low as 0.125 Gy can induce apoptosis of human peripheral lymphocytes. 4 Certain radiation doses can damage or induce apoptosis of peripheral blood lymphocytes, which can weaken the body's antitumor immune response. Studies have shown that severe lymphopenia caused by radiotherapy and chemotherapy decreases overall survival (OS) in patients with cancer. 5 –7
The mechanism by which radiotherapy causes lymphopenia remains unclear. Dosimetric variables, including lung volume receiving ≥5 Gy and heart volume receiving ≥50 Gy, are important risk factors for lymphopenia. During radiotherapy to thoracic tumors, low doses to the heart, circulating blood pool, and lymphoid organs were associated with reduced immunosuppressive effects. 8 –10 In this study, we aim to analyze the relationship between estimated dose of radiation to circulating immune cells (EDRIC) and lymphopenia and the survival of patients undergoing concurrent chemoradiotherapy for esophageal cancer.
Methods and Materials
Patients
This study was approved by the ethics committee of the Second Affiliated Hospital of Soochow University, and all the investigations were conducted in accordance with the relevant guidelines and regulations.
A total of 146 esophageal cancer patients who received concurrent chemoradiotherapy in our department between January 2016 and June 2020 were included. Their clinical characteristics are given in Table 1. All the patients were treated with intensity modulated radiotherapy therapy, and received concurrent chemotherapy. Approximately 15.1% of patients received neoadjuvant chemotherapy, whereas 45.2% of patients received consolidation chemotherapy. We reviewed records related to treatment; complete blood count before radiotherapy, once a week during radiotherapy, within 1 week after radiotherapy; recurrence; and death. The last follow-up was December 31, 2020. A total of 77 patients (52.7%) died during the follow-up period; 3 of whom died owing to sudden cardiac death, whereas 1 died because of a cerebrovascular accident.
Patient Characteristics
KPS, Karnofsky performance status; PET-CT, positron emission tomography-computer tomography; PTV, planning target volume; RT, radiotherapy.
Radiotherapy
For the concurrent chemotherapy, carboplatin and paclitaxel were most commonly used. Patients were given elective nodal irradiation, and the delineation of target volumes was based on RTOG and NCCN guidelines. The postoperative radiation dose was 45–50.4 Gy (1.8–2.0 Gy/d) for five fractions per week. The dose was locally increased to 60–64 Gy (1.8–2.0 Gy/d) for five fractions per week for definitive radiotherapy.
Lymphocyte count
Lymphocyte counts (cells × 109/L) were collected 1 week before the start of treatment, every week during radiotherapy, and ∼1 week after the end of radiotherapy. Lymphopenia was evaluated according to the lowest lymphocyte count. Decreased lymphocyte counts were graded according to the Common Terminology Criteria for Adverse Events, version 5.0. 11
Calculation of EDRIC
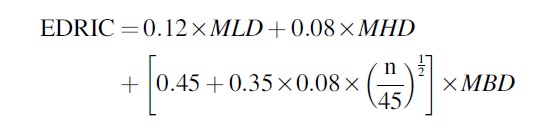
According to the method established by Jin et al., we calculated EDRIC based on the mean lung and heart dose, the fractions of radiotherapy, and the mean body dose (MBD). 12 The MBD was estimated by the integrated dose divided to the body by a population-based mean estimate of body volume. 13 The model we used as follows:
Statistical analyses
The primary endpoint of this study was OS and the secondary endpoint was progression-free survival (PFS). The independent sample t-test or the χ 2 test was used to test the difference between continuous and categorical variables. The best cut-off value for EDRIC was evaluated using receiving operating characteristic (ROC) survival curve analysis. To investigate the relationship between EDRIC and clinical variables, the univariate and multivariate Cox regression models were used. Significance was defined as variables with p < 0.05. Statistical analyses were performed with SPSS 26.0 (IBM, Chicago, IL).
Results
Patient characteristics
Patients’ characteristics are given in Table 1. The median age of the entire group at diagnosis was 71 years (range, 50–91 years). Most patients were men (68.5%) and the vast majority (80.1%) had Karnofsky performance status (KPS) >70 at the time of diagnosis. The most common histological type was squamous cell carcinoma (95.2%).
Myelosuppression
The lymphocyte counts of the 146 patients with esophageal cancer before and after radiotherapy are given in Figure 1A. The average lymphocyte count of all patients before radiotherapy was 1.4 (0.3–2.9 × 10⁹/L), whereas the average lymphocyte count after radiotherapy was 0.3 (0.0–1.1 × 10⁹/L). Pre- and post-radiotherapy lymphopenia ratings are given in Figure 1B. No patients had G4 lymphopenia before radiotherapy. There were 4 (2.7%), 19 (13.0%), 87 (59.6%), and 36 (24.7%) patients, respectively, with grades 0–1 (G0–1), 2 (G2), 3 (G3), and 4 (G4) lymphopenia after radiotherapy. During the follow-up period, 77 patients died, and the median OS was 28.5 months (95% confidence interval [CI]: 21.7–35.3 months). The mortality rates for patients with G0–2, G3, and G4 lymphopenia were 41.6%, 47.1%, and 75.0%, respectively.
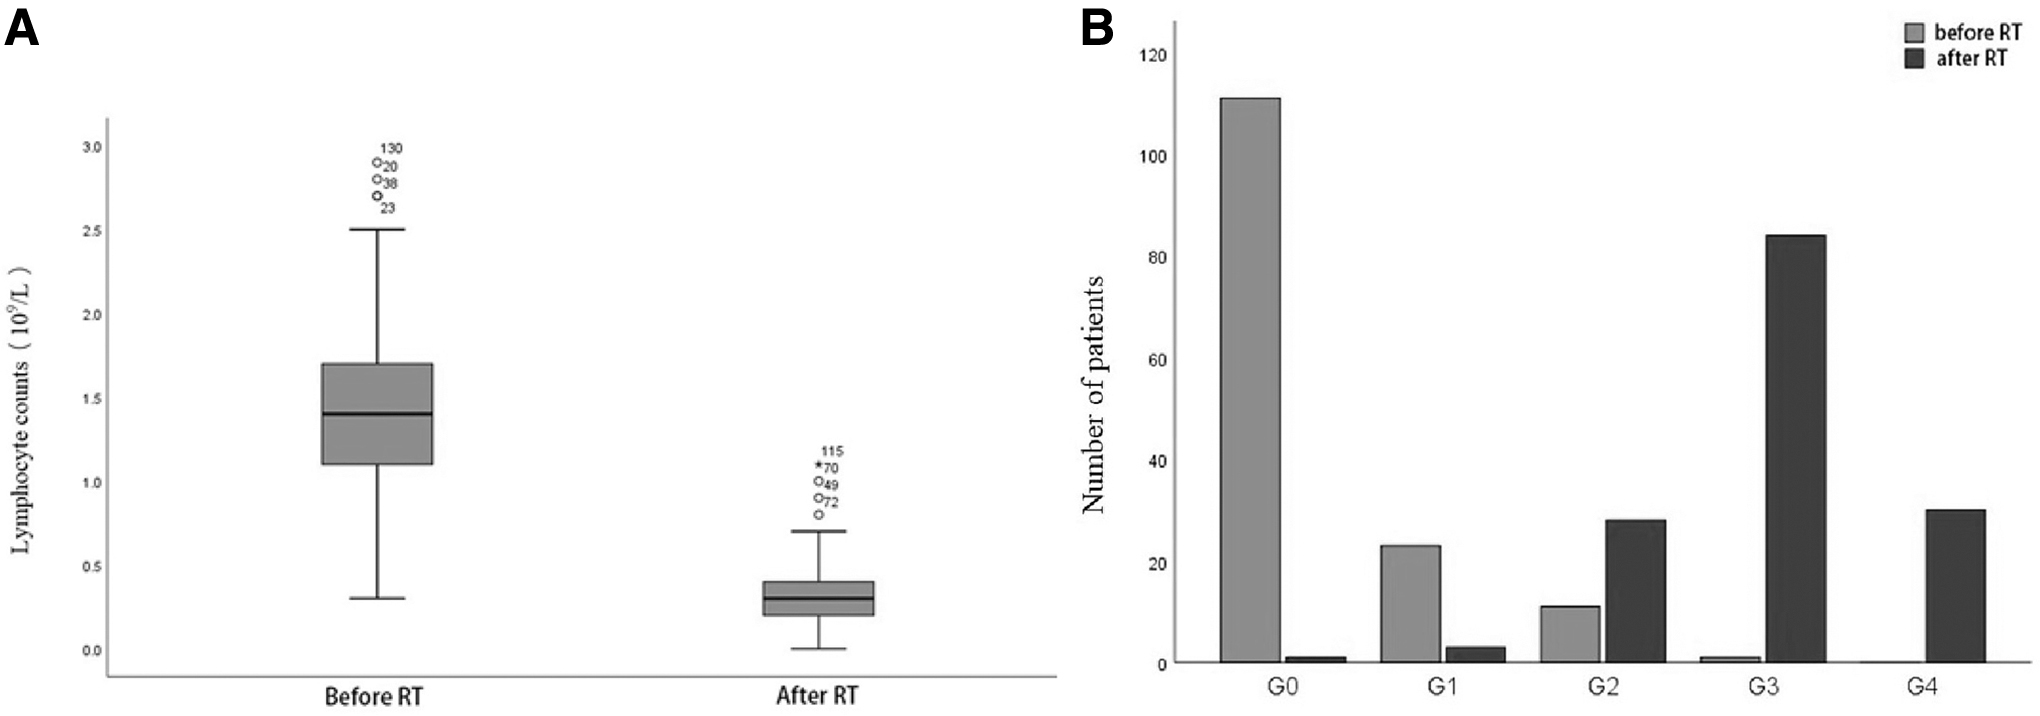
Lymphocyte counts of all patients before and after radiotherapy
For all 146 patients, the median OS was 28.5 months (95% CI: 21.7–35.3 months) (Fig. 2A). There was no statistically significant difference in OS between patients with G3 and G0–2 lymphopenia (p = 0.846). However, the OS of patients with esophageal cancer with decreased G4 lymphocytes was significantly worse (Fig. 2B). The PFS of patients with G4 lymphopenia were inferior to those with G0–3 lymphopenia (3-year PFS: 20.7% vs. 45.4%; p = 0.048) (Fig. 2C).
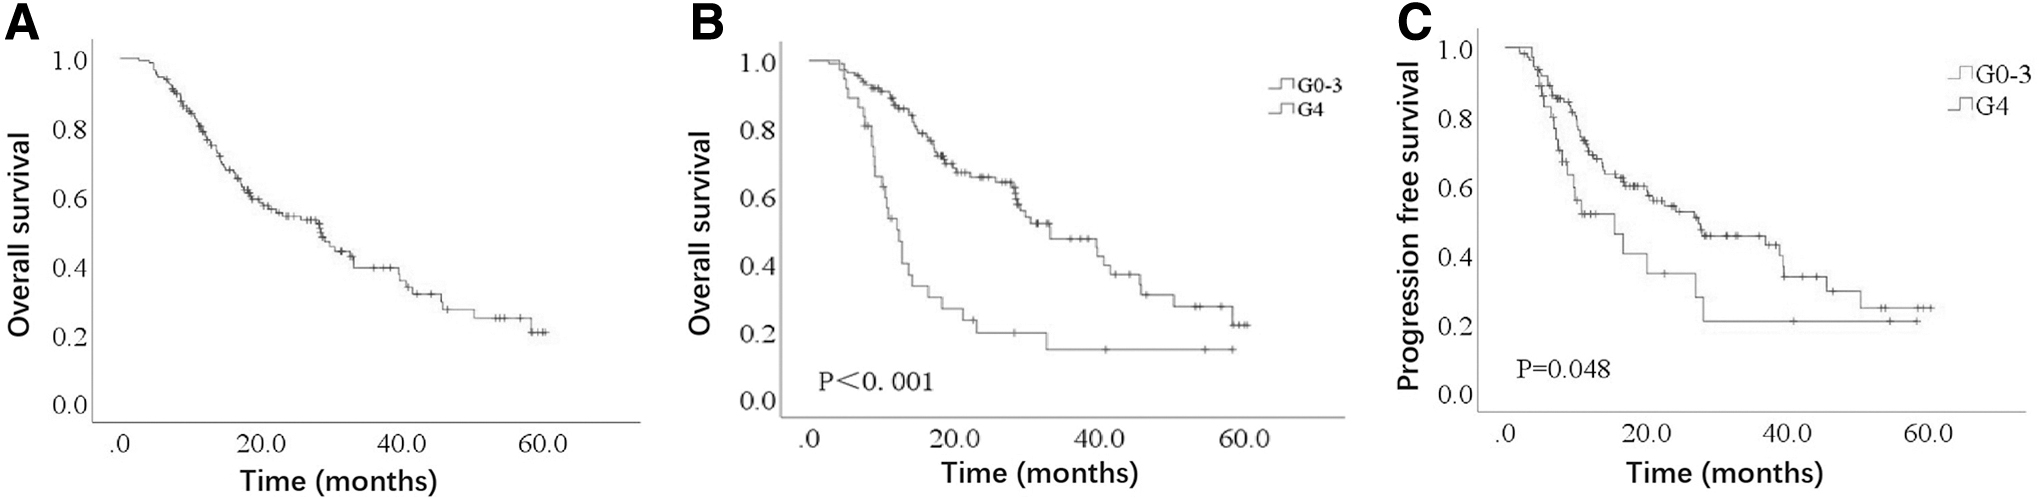
The median OS for all the patients
EDRIC distribution
Based on the mean lung dose, the mean heart dose, the MBD, and the number of divisions (n), we calculated the EDRICs for 146 patients with esophageal cancer undergoing concurrent chemoradiotherapy. The median EDRIC was 9.8 Gy (range: 4.4–19.0 Gy). There was a moderate positive correlation between EDRIC and planning target volume (PTV) (r = 0.551, p < 0.001), whereas the correlation between staging and lesion location was small (r = 0.278, p = 0.001; r = 0.196, p = 0.018).
Relationship between EDRIC and lymphopenia
Next, we further investigated the relationship between EDRIC and severe lymphopenia. According to the quartile, EDRIC was divided into four grades, and the percentages of severe lymphopenia were 3% (EDRIC: 4.4–7.5 Gy) and 5% (7.5–9.8 Gy), and 21% (9.8–11.6 Gy) and 67% (11.6–19.0 Gy; p < 0.001), as given in Figure 3A. Meanwhile, EDRIC was also divided into equal intervals, and the percentages of severe lymphopenia were 2% (EDRIC: 4.4–8.0 Gy) and 16% (8.0–11.6 Gy), and 66% (11.6–15.3 Gy) and 100% (15.3–19.0 Gy; p < 0.001), as given in Figure 3B. Meanwhile, the OSs of the four EDRIC quartiles and interval EDRIC group are given in Figure 3C and D. The increase in EDRIC was significantly correlated with a decrease in lymphocytes (r = −0.679; p < 0.001). According to the ROC curve, the median cutoff point of EDRIC was 10.3. The rate of G4 lymphopenia in esophageal cancer patients with EDRIC ≥10.3 Gy was higher than that of patients with EDRIC <10.3 Gy; this difference was statistically significant (58.1% vs. 4.5%; p < 0.001). Univariate analysis showed that the risk factors for severe lymphopenia were including older age, advanced staging, larger PTV volume, and higher EDRIC. After adjusting for other clinical variables, EDRIC was still identified as a risk factor for severe lymphopenia.

The relationship between EDRIC and severe lymphopenia in quartile
Overall survival
The median survival time of all patients was 28.5 months (95% CI: 21.7–35.3 months). The 2- and 3-year OS rates were 54.2% and 39.2%, respectively. The factors related to OS in the univariate and multivariate analyses are summarized in Table 2. In the univariate analysis, pathology, staging, a decreased KPS, surgical history, increased EDRIC, and a higher PTV were associated with worse OS. In the multivariate analysis and an increased EDRIC (hazard ratio [HR]: 1.183, p = 0.001), III/IVa (HR: 1.267, p = 0.034), and a lower KPS (HR: 2.613, p = 0.004) were significantly associated with worse OS.
The Cox Regression Analysis of Clinical and Dosimetric Variables with the Overall Survival
CI, confidence interval; EDRIC, estimated dose of radiation to circulating immune cells; HR, hazard ratio.
The Kaplan–Meier analysis was conducted to further support the relationship between EDRIC and OS. Compared with patients with EDRIC <10.3 Gy, patients with EDRIC ≥10.3 Gy had significantly lower OS (HR: 2.43, p < 0.001; Fig. 4A). For patients with EDRIC ≥10.3 Gy, their median OS was much longer than those with EDRIC <10.3 Gy (39.6 months [95% CI: 29.7–49.5 months], and 14.2 months [95% CI: 12.2–16.1 months]).
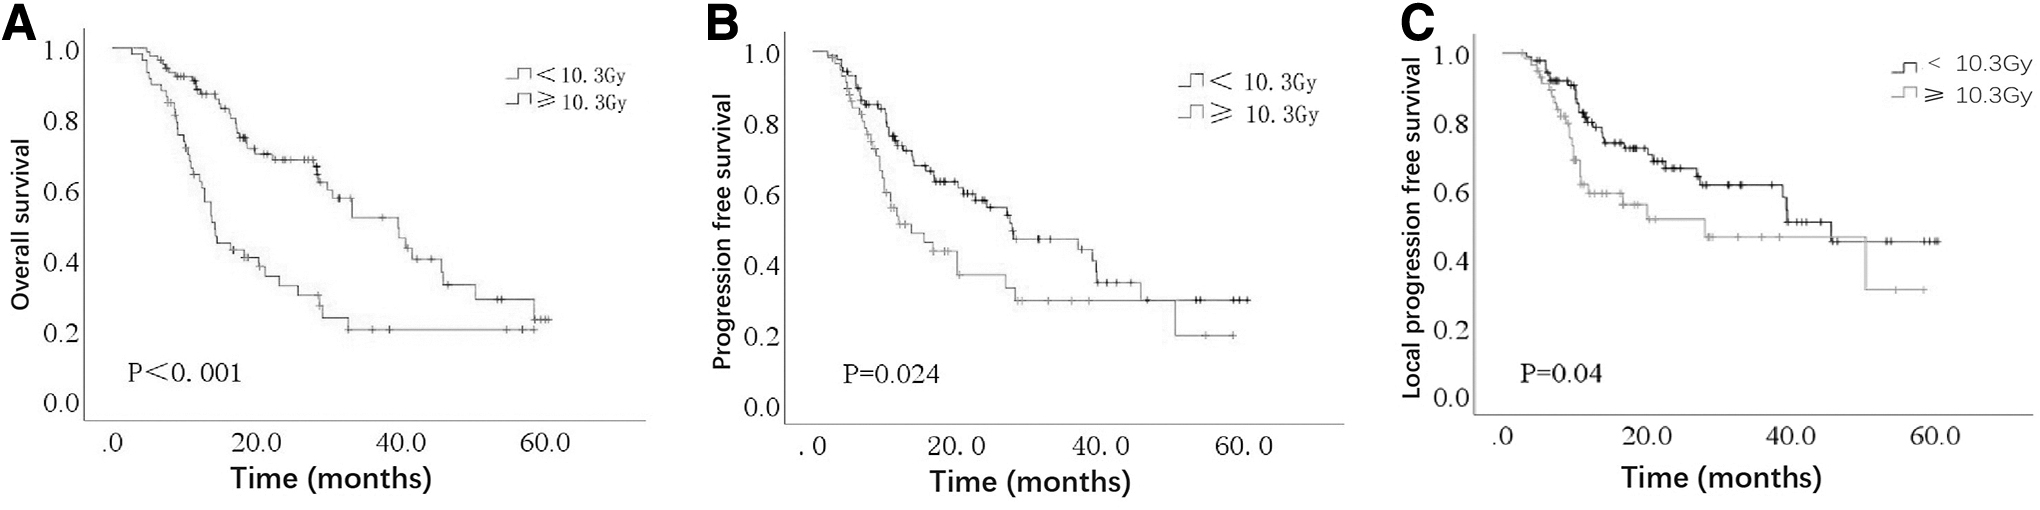
Patients with EDRIC ≥10.3 Gy (n = 56) had significantly poorer OS
Progression-free survival
The median PFS of all the patients was 22.6 months (95% CI: 13.9–31.3 months). The 2- and 3-year PFS rates were 49.9% and 40.2%, respectively. The factors related to PFS in the univariate and multivariate Cox risk ratio analyses are summarized in Table 3. In the univariate analysis, stage III/IVa, pathology, and an increased EDRIC were associated with worse PFS. A higher EDRIC value was strongly correlated with poor PFS in the multivariate analysis model (HR, 1.121; p = 0.019). The Kaplan–Meier analysis was conducted to further support the relationship between EDRIC and PFS (Fig. 4B). Patients with EDRIC ≥10.3 Gy had a significantly lower PFS (HR: 2.43, p < 0.024; Fig. 4B) than those with EDRIC <10.3 Gy. The median PFS of patients with EDRIC ≥10.3 Gy and EDRIC <10.3 Gy were 39.6 months (95% CI: 29.7–49.5 months) and 14.2 months (95% CI: 12.2–16.1 months).
The Cox Regression of Clinical and Dosimetric Variables with Progression-Free Survival
CI, confidence interval; EDRIC, estimated dose of radiation to circulating immune cells; HR, hazard ratio.
Local progression-free survival
The 2- and 3-year local progression-free survival (LPFS) rates were 60.5% and 55.6%, respectively. The Kaplan–Meier analysis was conducted to further support the relationship between EDRIC and LPFS (Fig. 4C). Patients with EDRIC ≥10.3 Gy had a significantly lower LPFS (HR: 1.752, p = 0.04; Fig. 4C) than those with EDRIC <10.3 Gy. The median LPFS of patients with EDRIC ≥10.3 Gy and EDRIC <10.3 Gy were 39.4 months (95% CI: 33.7–45.0 months) and 28.1 months (95% CI: 4.9–51.3 months).
Discussion
Lymphocytes are highly sensitive to ionizing radiation, and a dose as low as 1 Gy can decrease in the natural logarithm of cell survival and significantly reduce survival time. 14 –16 We confirmed that the EDRIC model decreased the number of peripheral lymphocytes. Furthermore, we verified that increases in EDRIC were independently associated with worse OS and PFS.
Although most patients had a normal baseline lymphocyte count, almost 80% of patients had G3–4 lymphopenia after starting treatment. This treatment-related lymphopenia persisted during the long-term follow-up, and there was no indication that it would eventually return to baseline levels. Treatment-related lymphopenia also occurred after radiotherapy of the head and neck squamous cell carcinoma. Long-term follow-up studies showed that persistent lymphopenia lasted up to 15 years after radiotherapy. 17
Dosimetric factors, including lung volume receiving ≥5 Gy, heart volume receiving ≥50 Gy, brain volume receiving ≥25 Gy, and average systemic dose, can be used to estimate EDRIC and predict lymphopenia. 5,14,18,19 In this study, we validated an average dose parameters of the heart, lungs, and body-based prediction model for severe lymphopenia. The EDRIC value was an important risk factor for severe lymphopenia and a potential independent prognostic factor for cancer patients who received radiotherapy. For instance, in a retrospective study, Ladbury et al. reported that higher doses of radiotherapy to the immune system were associated with tumor progression and poor prognosis for nonsmall cell lung cancer patients definitive radiotherapy. 13 Meanwhile, after radiotherapy for thoracic malignancies, there was a correlation between higher heart and lung doses with poorer OS. 20 Constantly, our study also found that higher EDRIC was associated with poorer PFS and OS for esophageal cancer patients treated with radiotherapy.
Several attempts have been made to protect the immune system from radiotherapy. Wu et al. found that compared with the conventional fractionated radiotherapy for locally advanced pancreatic cancer, stereotactic body radiotherapy is associated with much less degree of lymphopenia, 21 and this was proved by another similar study conducted by Wild et al. 22 They proposed the potential mechanism that stereotactic body radiotherapy not only reduced the treatment volume to lymphocyte-rich organs, but also reduced the total volume of blood exposed during radiotherapy. Meanwhile, novel precise image technologies including magnetic resonance (MR) venography technique and MR linear accelerator, will help to precisely identify and restrict dose to lymphocyte-rich organs. 23 Meanwhile, ongoing clinical trials are testing immunoadjuvant therapy with agents that could potentially prompt lymphocyte proliferation. 23
Our study has several limitations. First, this was a single-institution retrospective study; there may be problems including unknown confounding factors, and a shortage of structured follow-up. In addition, there were limitations in EDRIC model. Most importantly, we assume that EDRIC represents the dose of radiotherapy received by circulating immune cells; however, other factors may correlate with EDRIC, potentially confounding this relationship.
Conclusions
EDRIC could predict PFS and OS for esophageal cancer patients treated with radiotherapy. Next, multicenter, larger sample size trials are needed to confirm this.
Footnotes
Acknowledgment
The authors acknowledge the contributions of the Department of Radiotherapy & Oncology, The Second Affiliated Hospital of Soochow University.
Authors’ Contributions
S.C. conceived the study, contributed to the study design, assisted with analysis, and wrote the first draft of the article. Y.F., Q.G., P.Z., Y.T. contributed to data preparation and analysis. Q.F. contributed to the interpretation of the results and report finalization. All authors agreed with the decision to submit.
Disclosure Statement
No competing financial interests exist.
Funding Information
(1) Young Talent Support Project of the Second Affiliated Hospital of Soochow University (S.C., XKTJ-RC202007); (2) The Natural Science Foundation of Jiangsu Province, BK20180195; (3) The National Natural Science Foundation of China, 81902715; (4) Jiangsu Medical Innovation Team, CXDT-37.