




Abstract
Two independent equations were recently proposed for estimating 177Lu-cetuximab cumulative activity, in a preclinical situation, from an initial 64Cu-cetuximab diagnostic scan acquired at peak time of decay-uncorrected (t peak-uncorr) or decay-corrected (t peak-corr) time–activity curve of trapped 64Cu-cetuximab, respectively. The standard uptake ratio (SUR) measured at t peak-uncorr or t peak-corr turned out to be a key metric in each equation, respectively. However, acquiring the diagnostic scan at t peak-uncorr or t peak-corr might be a limitation of the proposed method. Therefore, in an attempt to overcome this limitation, this note aims at theoretically investigating whether SUR(t peak-uncorr) and/or SUR(t peak-corr) could be derived from a diagnostic scan acquired at any time postinjection.
Arecently published study has proposed two independent equations for estimating 177Lu-cetuximab cumulative activity from an initial positron emission tomography 64Cu-cetuximab diagnostic scan, when acquired at peak time of decay-uncorrected or decay-corrected time–activity curve of trapped tracer (t peak-uncorr or t peak-corr), respectively. 1,2 Applied to published TE-8 tumor-bearing mouse data, the 64Cu-cetuximab standard uptake ratio (SUR64Cu; a.u.), that is, the tumor-to-blood standard uptake value ratio, assessed at either t peak-uncorr = 14 h or t peak-corr = 59 h turned out to be a key metric. 1,2
However, assessing SUR64Cu at a mandatory acquisition time might be considered as a limitation of the proposed method, even if two options are possible, that is, 14 or 59 h postinjection for 64Cu-cetuximab in TE-8 tumor-bearing mice. Therefore, in an attempt to overcome this limitation, the current note aims at theoretically investigating whether SUR64Cu(t peak-uncorr) and/or SUR64Cu(t peak-corr) could be derived from a single diagnostic scan acquired at time t (h) different from t peak-uncorr and t peak-corr.
The previously published study showed that: 1 –3

where Ki-64Cu (mL × h−1 × mL−1) is the 64Cu-cetuximab uptake rate constant in the tissue of interest. The 64Cu-cetuximab release rate constant from the tissue of interest is kR-64Cu (h−1) that may involve both a release of the 64Cu-cetuximab molecule from its target and a detached 64Cu label. The 64Cu physical decay rate constant is λ 64Cu ( = 0.05457 h−1). The fraction of free 64Cu-cetuximab in blood and interstitial volume is F64Cu (mL × mL−1), that is, sum of blood volume fraction and of constant ratio of concentrations between free compartment and blood. 3
Furthermore, Ki-64Cu can be expressed as (from previously published Eq. [10]): 1 –3

where CTumor-64Cu(t) is total tissue activity concentration at time t (kBq × mL−1), CBlood-64Cu(t) is blood activity concentration at time t (kBq × mL−1), which is equal to CBlood-64Cu(t = 0) × exp(–α64Cu × t) for a monoexponentially decaying input function, and f(t) is given by: 1,2

Noteworthy, the ratio of the right-hand side of Eq. (3) cancels out the issue of applying or not 64Cu physical decay correction to experimental data. Inserting Eq. (3) in Eqs. (1) and (2) then leads to:

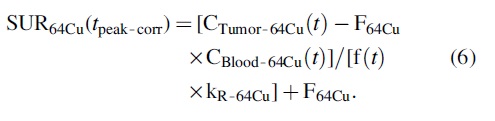
In Eqs. (5) and (6), CTumor-64Cu(t) and CBlood-64Cu(t) can be provided by the diagnostic scan. Table 1 compares SUR64Cu(t peak-uncorr) and SUR64Cu(t peak-corr) values obtained from Eqs. (1) and (2) with those obtained from Eqs. (5) and (6) that involve experimental values of CTumor-64Cu(t) and CBlood-64Cu(t) reported by Song et al at t = 2–24–48–72 h postinjection 1,2 A good agreement was found at t = 24 and 48 h unlike at t = 2 and 72 h. At t = 2 h, the role of the experimental measurement uncertainty of CBlood-64Cu(t = 2h) is illustrated by comparing line 2 versus line 1 in Table 1 for both SUR64Cu(t peak-uncorr) and SUR64Cu(t peak-corr).
Comparison of Standard Uptake Ratio (SUR)64cu(t peak-uncorr) and SUR64Cu(t peak-corr) Involving Experimental Data
SUR64Cu(t peak-uncorr = 14 h) and SUR64Cu(t peak-corr = 59 h) were computed from Eqs. (1) and (2), respectively, by using average values for Ki-64Cu, kR-64Cu, and F64Cu previously reported in Table 1 of Laffon and Marthan (from Song's data fitting). 1 These gold-standard values were compared with values computed from Eqs. (5) and (6) that involved experimental data published by Song et al at t = 2–24–48–72 h postinjection: (1) both CTumor-64Cu(t) and CBlood-64Cu(t) data were used; (2) CTumor-64Cu(t) data were only used and CBlood-64Cu(t) was the average 64Cu-cetuximab input function fitted by using Song's data. 1,2 In lines 1 and 2, average values for kR-64Cu and F64Cu were used. 1
SUR, standard uptake ratio.
Furthermore, Figure 1 shows that the experimental CBlood-64Cu(t = 2 h) value is ∼25% greater than the fitted value. Figure 1 also shows that the experimental CTumor-64Cu(t = 72 h) value is ∼43% lower than the fitted value that may explain the discrepancy found at t = 72 h. Therefore, it was suggested that the diagnostic scan should not be performed too late, since the later the measurement, the greater the measurement uncertainty of CTumor-64Cu(t) and CBlood-64Cu(t).
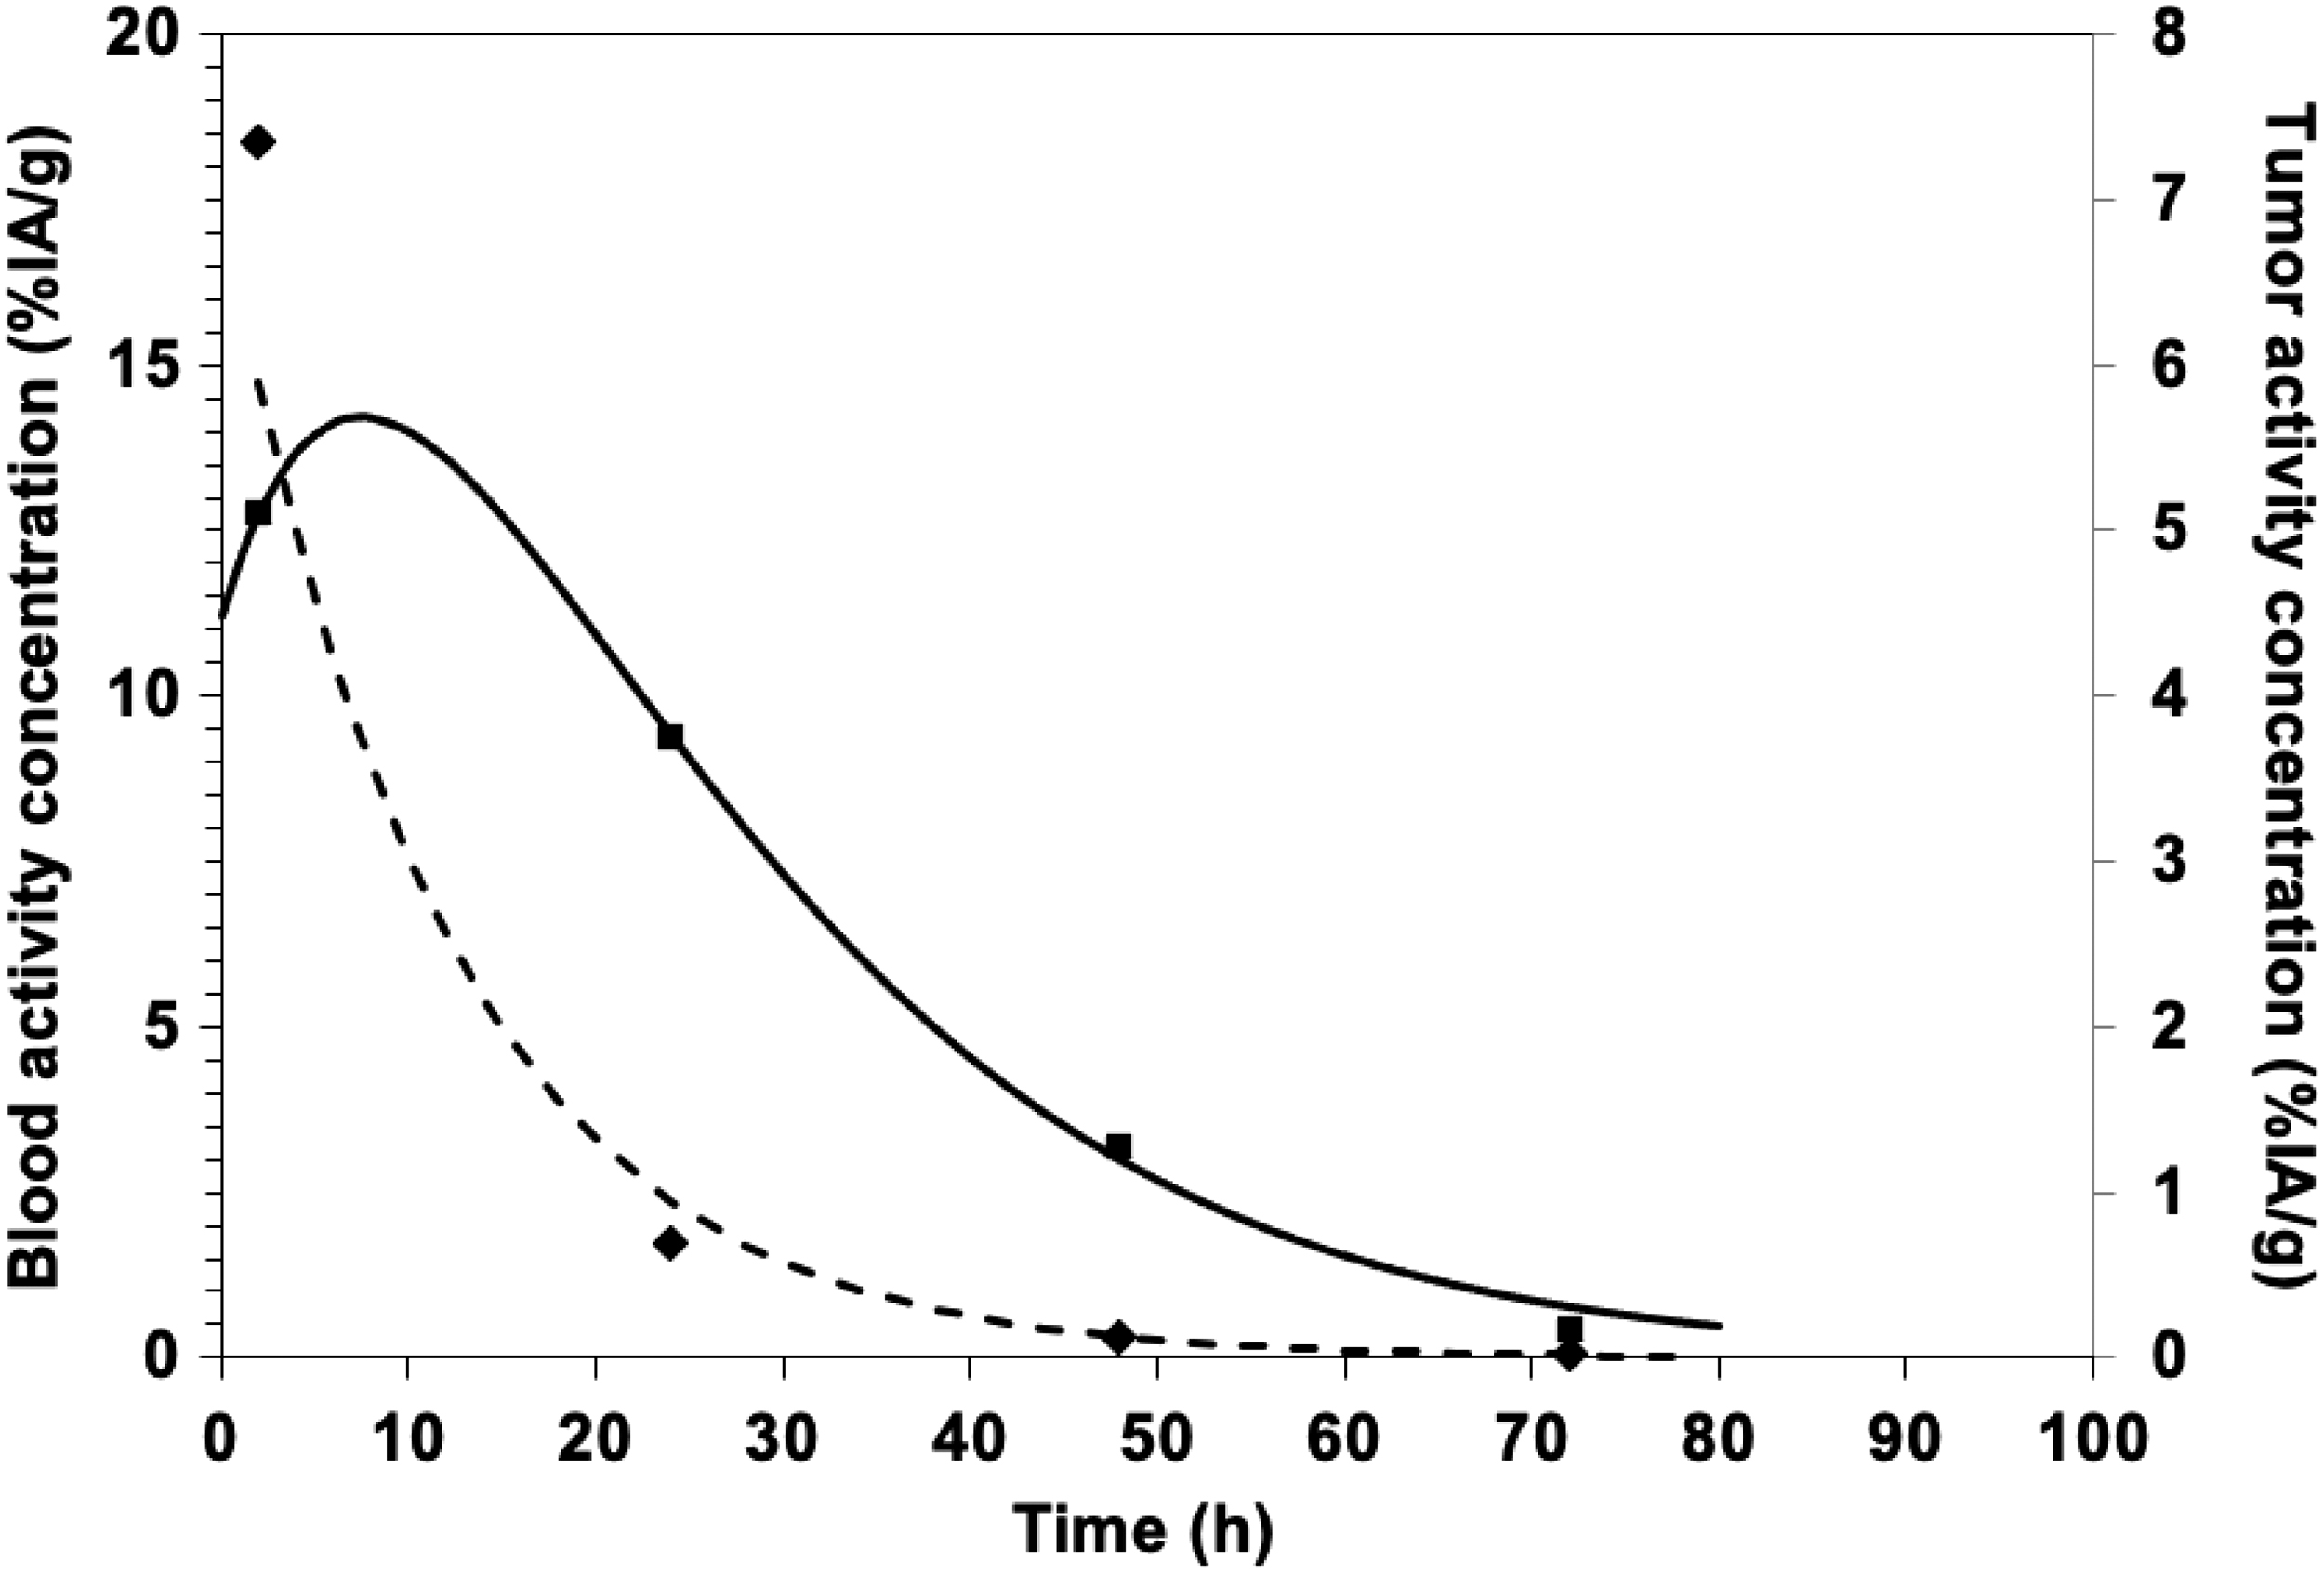
Blood and tumor activity concentration versus time. Fitting (dashed/solid) of Song's experimental data (rhomb/square; uncorrected for physical decay) for 64Cu-cetuximab in TE-8 tumor, respectively.
Likewise, it should not be performed too early (1) so that the part of trapped tracer in CTumor-64Cu(t) should be greater than that of free tracer and (2) since the above proposed equations are valid for the period t > t* after 64Cu-cetuximab injection, according to the reversible Patlak–Blasberg analysis. 1,3 In other words, it was suggested that the diagnostic scan should be performed at any time around and between the two peak time values.
Regarding F64Cu, using an average value seems reasonable, in particular for computing SUR64Cu(t peak-corr) from Eq. (6), because its part is reduced compared with Ki-64Cu/kR-64Cu in Eq. (2) (∼5% from Song's data fitting in Table 1 of reference 1). 1,2 Regarding kR-64Cu, the lower its value in comparison with that of λ 64Cu ( = 0.05457 h−1), the lower its part in Eq. (1), and, hence, in Eq. (5). When kR-64Cu = 0, in other words, when 64Cu-cetuximab is irreversibly trapped in the tissue of interest: (1) Eq. (5) is simplified and its measurement uncertainty is removed from that of SUR64Cu(t peak-uncorr) and (2) Eq. (6) is no more valid, that is, there is only one available peak time (t peak-uncorr) and, hence, one available estimate of the 177Lu-cetuximab cumulative activity.
Finally, f(t) has to be computed from Eq. (4), involving an average 64Cu-cetuximab input function fitted by using Song's experimental data for 64Cu-cetuximab in TE-8 tumor-bearing mouse: CBlood-64Cu(t) = 17.39 × exp(−0.0830 × t). 1,2 This feature stresses the relevance of developing systems for accurately measuring CBlood-64Cu(t), or even better, for estimating the whole 64Cu-cetuximab input function in preclinical situations and in forthcoming clinical theranostic practice. 4 In this connection, let us note that a multiexponentially decaying input function can be used in Eq. (4), which would not alter the current line of argument.
To conclude, Eqs. (5) and (6) show that it is theoretically possible to derive SUR64Cu(t peak-uncorr) and SUR64Cu(t peak-corr) from a single 64Cu-cetuximab diagnostic scan acquired at time t different from t peak-uncorr and t peak-corr and, hence, to compute two estimates of 177Lu-cetuximab cumulative activity (when 64Cu-cetuximab trapping is reversible). 1,2 Besides measurement of CTumor-64Cu(t) and CBlood-64Cu(t) from this diagnostic scan, an average value of some parameters has to be used, including F64Cu and kR-64Cu, as well as an average 64Cu-cetuximab input function. The proposed theoretical equations have to be probed in various preclinical situations, in particular, for assessing the additional measurement uncertainty introduced by this SUR normalization in estimating the 177Lu-cetuximab cumulative activity.
Footnotes
Disclosure Statement
There are no existing financial conflicts.
Funding Information
No funding was received for this article.