
Abstract
Background:
Trigger transposable element-derived 1 (TIGD1) is a human-specific gene, but no studies have been conducted to determine its mechanism of action. Our aim is to ascertain the function and mode of action of TIGD1 in the development of colon cancer.
Materials and Methods:
The authors used bioinformatics to analyze the relationship between TIGD1 and the clinical characteristics of colon cancer, as well as its prognosis. A series of cell assays were conducted to assess the function of TIGD1 in the proliferation and migration of colon cancer, and flow cytometry was used to explore its effects on apoptosis and the cell cycle.
Results:
The authors discovered that the expression of TIGD1 was remarkably elevated in colon cancer. Clinical correlation analysis demonstrated that TIGD1 expression was elevated in the tissues of advanced-stage patients, and it was remarkably elevated in individuals with both lymph node and distant metastasis. Further, the authors found that individuals showing elevated TIGD1 expression levels had a shortened survival time. Univariate and multivariate Cox regression analyses revealed that TIGD1 was an independent prognostic factor. Overexpression of the TIGD1 gene remarkedly enhances the proliferation and metastasis of colon cancer cells and suppresses apoptosis. In addition, the overexpression of TIGD1 can enhance the transition of tumor cells from the G1 toward the S phase. Western blot results suggested that TIGD1 may promote the malignant activity of colon cancer cells via the Wnt/β-catenin signaling pathway, Bcl-2, N-cadherin, BAX, E-cadherin, CDK6, and CyclinD1.
Conclusions:
TIGD1 may be an independent prognostic factor in the advancement of colon cancer, and therefore function as a therapeutic target.
Introduction
Colon cancer is the third most prevalent malignancy worldwide. In addition, it is the second leading cause of cancer-related mortalities globally. 1 Generally, an endoscopic biopsy is utilized in diagnosing colon cancer. At present, the major treatment approaches for colon cancer are radiotherapy, surgery, chemotherapy, and targeted therapy; however, the effectiveness of these treatments is uncertain, because the recurrence rate of colon cancer remains high and its prognosis is poor. 2
A lot of individuals with colon cancer are only identified at advanced stages, which contributes to poor survival owing to the absence of typical symptoms and feasible treatment options, 3 which is mainly due to uncertainties regarding the histopathological behavior and characteristics of early colon cancer. 4 Hence, there is an urgent need to ascertain the molecular mechanisms of colon cancer progression, and to discover alternative treatment approaches for colon cancer.
Trigger transposable element-derived 1 (TIGD1) is a human-specific gene initially classified as belonging to the trigger subfamily of the pogo superfamily of DNA-mediated transposons in humans. 5 A prior study affirmed that TIGD1 expression is higher in colon cancer, liver cancer, gastric cancer, lung cancer, and pancreatic cancer when compared with normal tissues; it is negatively correlated with prognosis; and it may regulate cell cycle progression. 6 Another study proposed that TIGD1 may influence the response of patients with ovarian cancer to platinum chemotherapy. 7 These studies postulated that TIGD1 plays a critical function in enhancing cancer progression and drug resistance.
In this research, the authors utilized bioinformatics to explore differentially expressed genes (DEGs) in colon and normal tissues. TIGD1 was found to be upregulated in colon cancer in multiple databases. The authors analyzed the link between TIGD1 expression and survival among patients suffering from cancer, to ascertain the feasibility of utilizing TIGD1 as a prognostic factor. The authors further conducted an investigation to determine the role of TIGD1 in modulating the development of colon cancer, as well as its downstream signal transduction pathways. The authors hypothesized that TIGD1 contributes to the progression of colon cancer as an independent prognostic factor.
Materials and Methods
Cell line culture
Suzhou Medical University (Suzhou, China) provided the following human colon cancer cell lines: HCT8, HT29, SW480, and HCT116. In addition, it also supplied the normal cell line NCM460. HCT8, HT29, HCT116, and SW480 were cultured in DMEM (HyClone, Logan, UT) and NCM460 cells were maintained in RPMI 1640 (HyClone), supplemented with 10% fetal bovine serum purchased from Gibco (Grand Island, NY) and 100 μg/mL streptomycin/penicillin (Hyclone), in a 5% CO2 humidified environment at 37°C. The authors passaged the cells every 2–3 d, using 0.25% trypsin (Hyclone).
Clinical sample collection
Samples of 20 cancerous and matched adjacent normal tissues were collected from colon cancer patients of the Second Affiliated Hospital of Wannan Medical College. Among these patients, none of them had been subjected to radiotherapy, chemotherapy, or immunotherapy. The Ethics Committee of the Second Affiliated Hospital of Wannan Medical College granted permission to perform the research, and every participant availed consent.
Data collection
The authors utilized The Cancer Genome Atlas (TCGA:
The authors also downloaded chip sequencing datasets from the Gene Expression Omnibus (GEO) (
In addition, the authors used the GSE17536 dataset as a validation cohort, to explore the relationship between TIGD1 and clinical information and prognosis. 10 Information on TIGD1 protein expression in the human body and its location in the cells was obtained from the Human Protein Atlas (HPA) database.
Quantitative real-time PCR
The extraction of the total RNA from the frozen colon tissues was performed by TRIzol reagent (Invitrogen, Waltham, MA) in accordance with the manufacturer's guidelines, and 1 μg of total RNA was employed to produce complementary DNA (cDNA), utilizing a RevertAid First Strand cDNA synthesis kit (Thermo Scientific) following the manufacturer's specifications. This was consequently semi-quantified with the aid of conventional PCR. Electrophoresis in 2% agarose gels incorporating ethidium bromide was used to separate the PCR products.
On a Roche LightCycler 96, real-time PCR (RT-PCR) was carried out utilizing an UltraSYBR mixture (CWBio, China) under normal PCR conditions. The FC in gene expression was determined utilizing the ΔΔCT technique. Primer sequences are described in Supplementary Table S1.
Western blot
The cells were lysed on ice for 30 min, with the NP40 lysis buffer (Beyotime, China) supplemented with 1 × protease inhibitor (Cwbio, China) and 1 × phosphatase inhibitor (MCE, Princeton, NJ). To determine protein concentration, the authors utilized the BCA kits (Thermo Scientific). The authors separated the total protein extract using sodium dodecyl sulfate polyacrylamide gel electrophoresis (SDS-PAGE) before transferring the proteins to polyvinylidene difluoride membranes (Millipore, Burlington, MA). Second, a 5% fat-free milk was used to block the membrane for 1–2 h at room temperature, and the authors incubated it overnight at 4°C with the antibodies (Supplementary Table S2).
The next day, the membrane was incubated at room temperature for 2 h with the secondary horseradish peroxidase (HRP)-conjugated anti-rabbit antibody (Sungene Biotech, China). Ultimately, the proteins of interest were observed by utilizing enhanced chemiluminescence (Thermo Scientific).
Immunohistochemistry
Immunohistochemistry (IHC) was performed as per standard protocols. In summary, the tissues samples were fixed in 4% paraformaldehyde, embedded in paraffin, and sectioned. After deparaffinization, rehydration, antigen retrieval, and blocking, incubation of the slides with primary antibodies was conducted at 4°C. The sections then underwent incubation with an HRP-conjugated anti-rabbit secondary antibody (Servicebio, China). The chromogen was diaminobenzidine. To capture the images under white light, a fluorescence microscope from Olympus (Japan) was used.
Construction of nomogram
Nomograms have been extensively utilized for anticipating cancer prognosis since their introduction. 11 In this statistical methodology, every contributing parameter—age, gender, risk score, and TNM stage, for instance—is assigned a score. For every individual, these scores are summed up to obtain a total score, with higher scores indicating a greater likelihood of an event happening. The authors employed a nomogram in this investigation for cancer prognosis prediction by including the age, stage of tumor, and TIGD1 expression among colon cancer patients. To construct the nomogram, the rms R package was utilized. A calibration curve was used to visualize the discrepancy of anticipated probability from what really happened using the bootstrap technique (1000 replicates). The nomogram's prediction accuracy was measured using the concordance index (C-index).
Plasmid and siRNA transfection
The TIGD1 siRNAs (siRNA sequences shown in Supplementary Table S3) and the corresponding negative controls were supplied by Genepharma Ltd (China). The specific siRNA or negative control and 5 μL lipofectamine 2000 were then diluted into 0.2 mL Opti-MEM medium (Gibco, Life Technologies), according to the manufacturer's instructions. The mixture was transferred to colon cancer cell lines after 30 min of rest. TIGD1 cDNA from a cDNA library for human colon cancer cell lines was subjected to PCR amplification, and it was cloned into a 2 × Flag pcDNA3 empty vector using a one-step approach, to create the homologous recombination vectors.
Before transfection, cells were plated in six-well cell culture dishes at a ratio of 1.8 × 10⁵ cells/well. According to the manufacturer's instructions, 2 μg plasmid and 5 μL lipofectamine 2000 were diluted into 0.2 mL Opti-MEM medium (Gibco, Life Technologies), incubated at 37°C for 6–8 h, and added to 2 mL of DMEM whole culture medium. Changes in TIGD1 transcription, as well as protein levels, were ascertained by utilizing quantitative RT-PCR and Western blotting analysis following plasmid transfection for 48 h.
Cell Counting Kit-8 assay
Cell Counting Kit-8 (CCK-8) proliferation assay kits supplied by Dojindo Molecular Technologies (Japan) were utilized to conduct in vitro investigations as per the manufacturer's guidelines to ascertain cell viability. After transfection, seeding of cells into the 96-well plates was done using a density of 1500 cells in every well, with five replicate wells. To measure the absorbance at 450 nm, an ELX-800 microplate reader supplied by BioTek (Winooski, VT) was employed for the purpose of constructing the growth curve for the transfected cells.
Cell scratch test
Transfection on six-well plates was performed. When the cells formed full holes, a 20 μL pipette tip of a suitable strength was adopted in drawing a straight line at the centre of the holes. Subsequently, the time after the cells had been left to stand for 30 min was obtained. At 0 and 24 h, the scratch distance was photographed and measured.
Apoptosis assay and cell cycle analysis
The cells were rinsed two times using PBS after being harvested in 0.25% trypsin. Flow cytometry was employed to determine the extent of cellular apoptosis using the Annexin V-PE/propidium iodide (PI) apoptosis detection kit (BD, China). Experiments were performed in triplicate, and results were presented as mean ± standard deviation. The ratio of apoptotic cells was analyzed using CytExpert software.
Fixation of HCT8, HT29, and SW480 cells with 70% ethanol was performed overnight at 4°C. Flow cytometry (Beckman, Indianapolis, IN) was utilized to examine the cells after they had been stained with PI (BD Biosciences).
Statistical analysis
For data analysis, R (version 4.0.3) was used. The Wilcoxon test determined the difference between TIGD1 expression in normal tissues and colon cancer. In the TCGA, GSE18105, and GSE44076 datasets, the authors utilized the survminer R program to investigate the link between TIGD1 expression and prognosis. The authors stratified patients in two groups using the median value as the criterion. The authors investigated the link between clinical factors and TIGD1 in depth and utilized univariate and multivariate analysis to ascertain its potential as an indicator of prognostic prediction. p < 0.05 was set as statistically significant.
Results
TIGD1 was highly expressed in colon cancer
To understand the progression of colon cancer, the authors performed differential gene analyses on three colon cancer datasets to uncover key genes. The three datasets were the TCGA, GSE18105, and GSE44076. The threshold values were established as adjusted p < 0.05 and |log2FC| > 1. As shown in Supplementary Table S4, 3461 DEGs were chosen from the TCGA database, of which 2329 genes were upregulated and 1132 genes were suppressed in cancerous tissues. In GSE18105, 1774 genes were upregulated and 1359 genes were suppressed in tumor tissues. GSE44076 contained 878 genes upregulated and 979 genes suppressed in tumor tissues.
The authors detected a total of 603 genes, considering the intersection of the DEGs in the 3 datasets (Fig. 1A). Our study revealed that TIGD1 was upregulated in colon cancer tissues (Fig. 1B). According to the receiver operating characteristic curve, TIGD1 was able to distinguish tumor tissues from normal tissues very effectively (Fig. 1C). The authors then further investigated the difference in TIGD1 expression between colon cancer cell lines and normal colon cell lines. The findings demonstrated that TIGD1 was substantially expressed in colon cancer at mRNA (Fig. 1D), as well as protein levels (Fig. 1E).

TIGD1 is upregulated in colon cancer.
At the same time, the authors collected cancer tissue samples and corresponding peri-tumor tissue from 20 patients with colon cancer (The patients' clinical information was shown in Supplementary Table S5). RT-PCR (Fig. 1F) and Western blot (Fig. 1G) findings demonstrated that TIGD1 was highly expressed in the patient's tumor tissue. IHC confirmed that TIGD1 was highly expressed in tumor tissue (Fig. 1H, I and Supplementary Fig. S1). These findings imply that TIGD1 may be involved in colon cancer progression.
Correlation between TIGD1 and the clinicopathological parameters of colon cancer patients
The authors investigated the link between the expression of TIGD1 and the clinical characteristics of colon cancer individuals in the TCGA database. As shown in Figure 2, TIGD1 expression was not linked to age, gender, or T stage, but it was related to the pathologic stage (p = 0.003), N stage (p = 0.003), and M stage (p = 0.023). In the validation dataset GSE17536, the authors found that the upregulation of TIGD1 was linked to the pathologic stage (p = 0.025), as demonstrated in Supplementary Figure S2. These findings imply that TIGD1 expression is elevated in later stage tumors, suggesting that TIGD1 could promote the progression of colon cancer.

Connection between TIGD1 and the clinicopathological parameters of colon cancer patients. The relationship between TIGD1 expression and age
Prognostic value of TIGD1 in COAD
The authors further explored the effect of TIGD1 on prognosis. In TCGA samples, the authors used survminer package to obtain the optimal cut-off value of TIGD1 expression, divided patients into two groups, and then analyzed the difference in prognosis between the two groups. The findings revealed that, in contrast with individuals with low expression, high-TIGD1 expression individuals had shortened overall survival (OS) duration (Fig. 3A: p = 0.002).
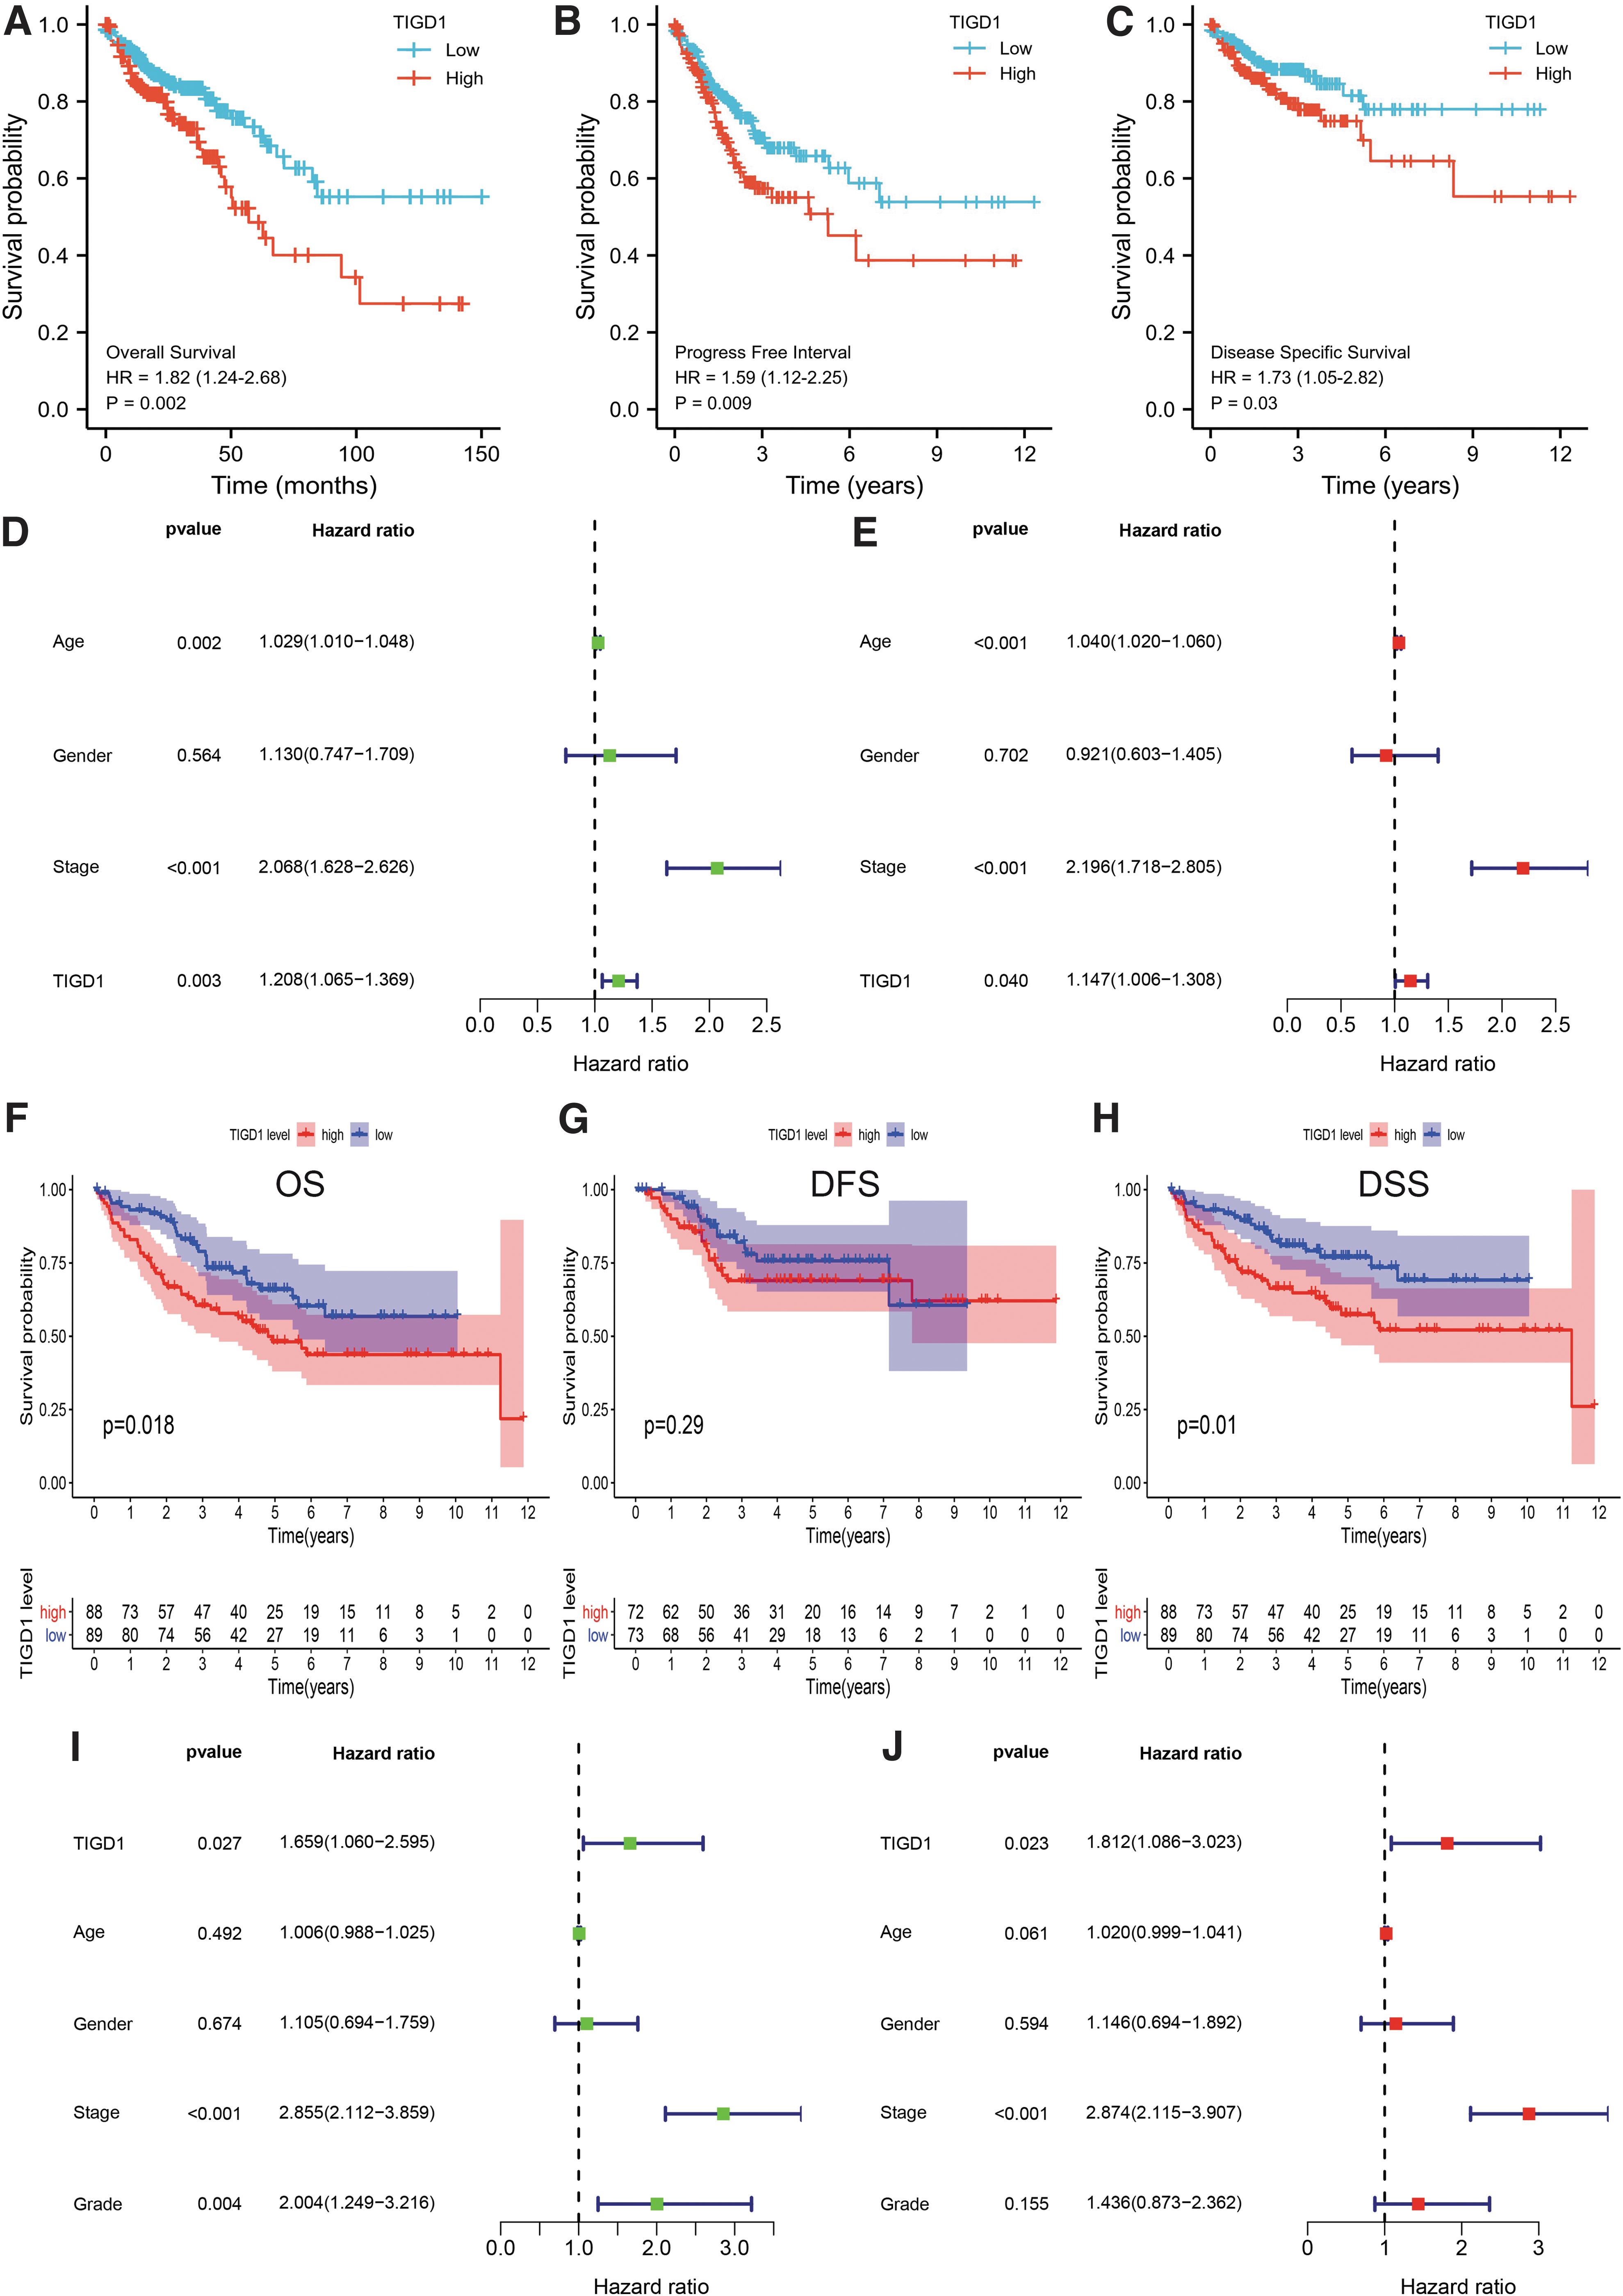
Prognostic value of TIGD1 in COAD. Individuals with higher TIGD1 expression had worse OS
The authors discovered that high TIGD1 expression was linked to poor PFI (Fig. 3B: p = 0.009), and that subjects with high TIGD1expression had poor disease-specific survival (DSS) in the TCGA database (Fig. 3C: p = 0.03). To further investigate the role of TIGD1 in prognosis, as well as to determine the prognostic variables associated with OS, the authors conducted univariate and multivariate Cox regression analyses. In the univariate Cox model, there was a strong link between high expression of TIGD1 and the worsening of OS (Fig. 3D: hazard ratio [HR] = 1.208; 95% confidence interval [CI]: 1.065–1.369; p = 0.003). High expression of TIGD1 was observed to be an independent factor of prognosis most closely linked to OS as per the multivariate analysis (HR: 1.147; 95% CI: 1.006–1.308; p = 0.04, Fig. 3E).
Further, in the validation cohort GSE17536, the authors assessed the prognostic significance of TIGD1. In GSE17536, according to the median expression level of TIGD1 as the cut-off value, patients were divided into two groups with high and low expression levels, and then the difference in prognosis was assessed. As depicted in Figure 3F, high expression of TIGD1 was linked to poor OS (p = 0.018), and the same result was observed for DSS (Fig. 3H, p = 0.01).
However, high expression of TIGD1 was not linked to disease-free survival (DFS; Fig. 3G, p = 0.29). Univariate (Fig. 3I: HR: 1.659; 95% CI: 1.060–2.595; p = 0.027) and multivariate (Fig. 3J: HR: 1.812; 95% CI: 1.086–3.023; p = 0.023) Cox regression analyses showed TIGD1 to be a prognostic factor independently of other factors.
Since age, stage, and TIGD1 were discovered to be independent prognostic factors in univariate as well as multivariate analyses, the authors incorporated these factors into a nomogram model. The authors obtained scores based on patients' age, disease stage, and TIGD1 expression, which were then added together to obtain an overall score, which was used to anticipate patients' 1-, 3-, and 5-year survival (Fig. 4A, C-index: 0.724, 95% CI = 0.694–0.754).

The prognostic nomogram was established in COAD.
According to our findings, the nomogram model was able to accurately predict the survival rate in the first and third years, but not in the fifth year (Fig. 4B–D). Taken together, these results suggested that TIGD1 causes adverse outcomes in colon cancer, but further verification through experimentation is needed.
TIGD1 induced the proliferation and migration of colon cancer cell lines
Recent studies have shown that TIGD1 promotes malignant behavior in various tumors. 6,7,12 –14 Therefore, the authors explored whether TIGD1 could affect the malignant biological behaviors of colon cancer cells. In colon cancer cells, TIGD1 was overexpressed by plasmid or silenced by siRNA. The overexpression and downregulation efficiency of the TIGD1 gene was confirmed by both qPCR and Western blotting in cell lines HCT8, HT29, and SW480 (Supplementary Fig. S3).
The results showed that overexpression of TIGD1 (in the OE-TIGD1 group) substantially upregulated the expression of TIGD1 in colon cancer cells, whereas si-TIGD1 remarkably inhibited the expression of TIGD1. Since the effect of siRNA3 was not very obvious, the authors selected siRNA1 and siRNA2 for follow-up experiments. These results further confirmed the overexpression and effectiveness of silencing the TIGD1 gene.
The CCK-8 assay demonstrated that TIGD1 overexpression promoted the proliferation of HCT8, HT29, and SW480 cells (Fig. 5A), and the silencing of TIGD1 inhibited the proliferation of colon cancer cells (Fig. 5B). Moreover, the scratch test showed that the migration of HCT8, HT29, and SW480 cells was remarkably enhanced in the OE-TIGD1 group (Fig. 5C), whereas the result of the TIGD1 silencing group was the opposite (Fig. 5D). These findings showed that TIGD1 enhances the malignant phenotypes of colon cancer, such as proliferation and migration.
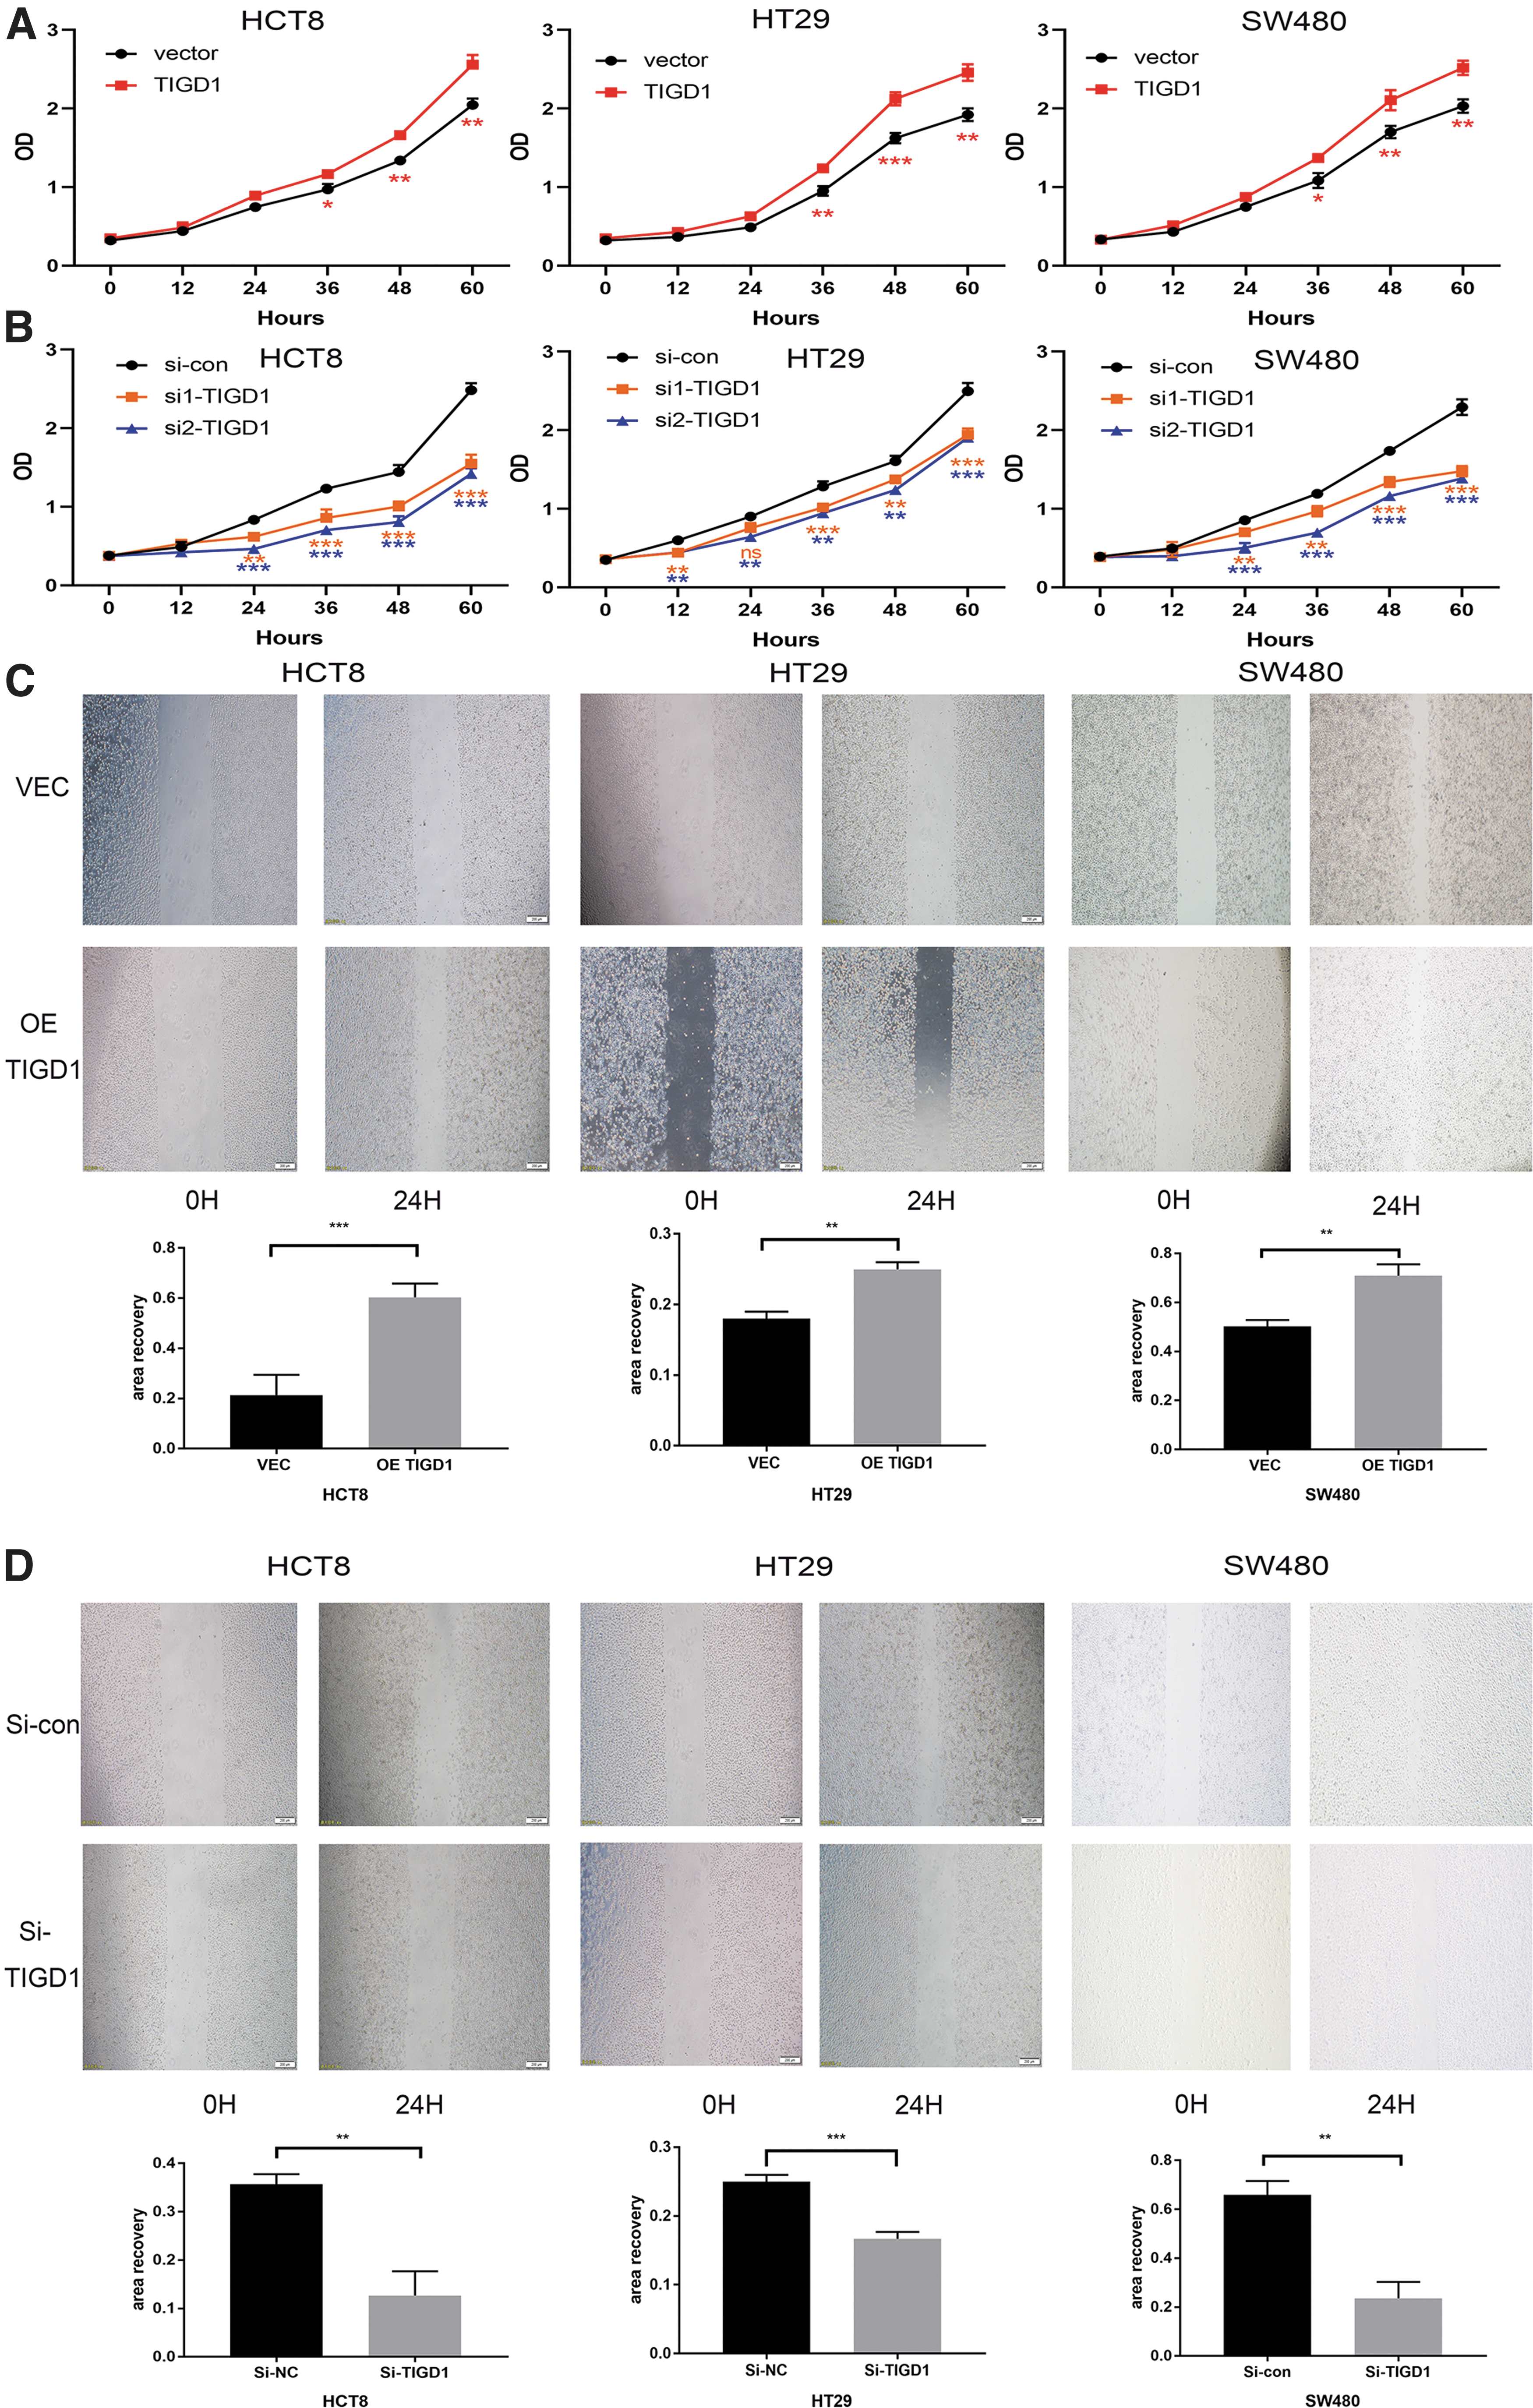
TIGD1 induced the proliferation as well as migration of colon cancer cell lines.
TIGD1 inhibits apoptosis and affects cell cycle
One of the hallmarks of cancer is its ability to resist apoptosis. 15 The authors examined the function of TIGD1 in the apoptosis of colon cancer cells. Flow cytometry findings affirmed that overexpression of TIGD1 remarkably decreased the apoptotic rate of colon cancer cells (Fig. 6A–C and Supplementary Fig. S4A–C). In contrast, when TIGD1 was silenced, apoptosis rates were significantly increased in all three colon cancer cells (Fig. 6D–F and Supplementary Fig. S4D–F). These findings implied that TIGD1 can significantly suppress the apoptosis of colon cancer cells and thus promote tumor cell growth.
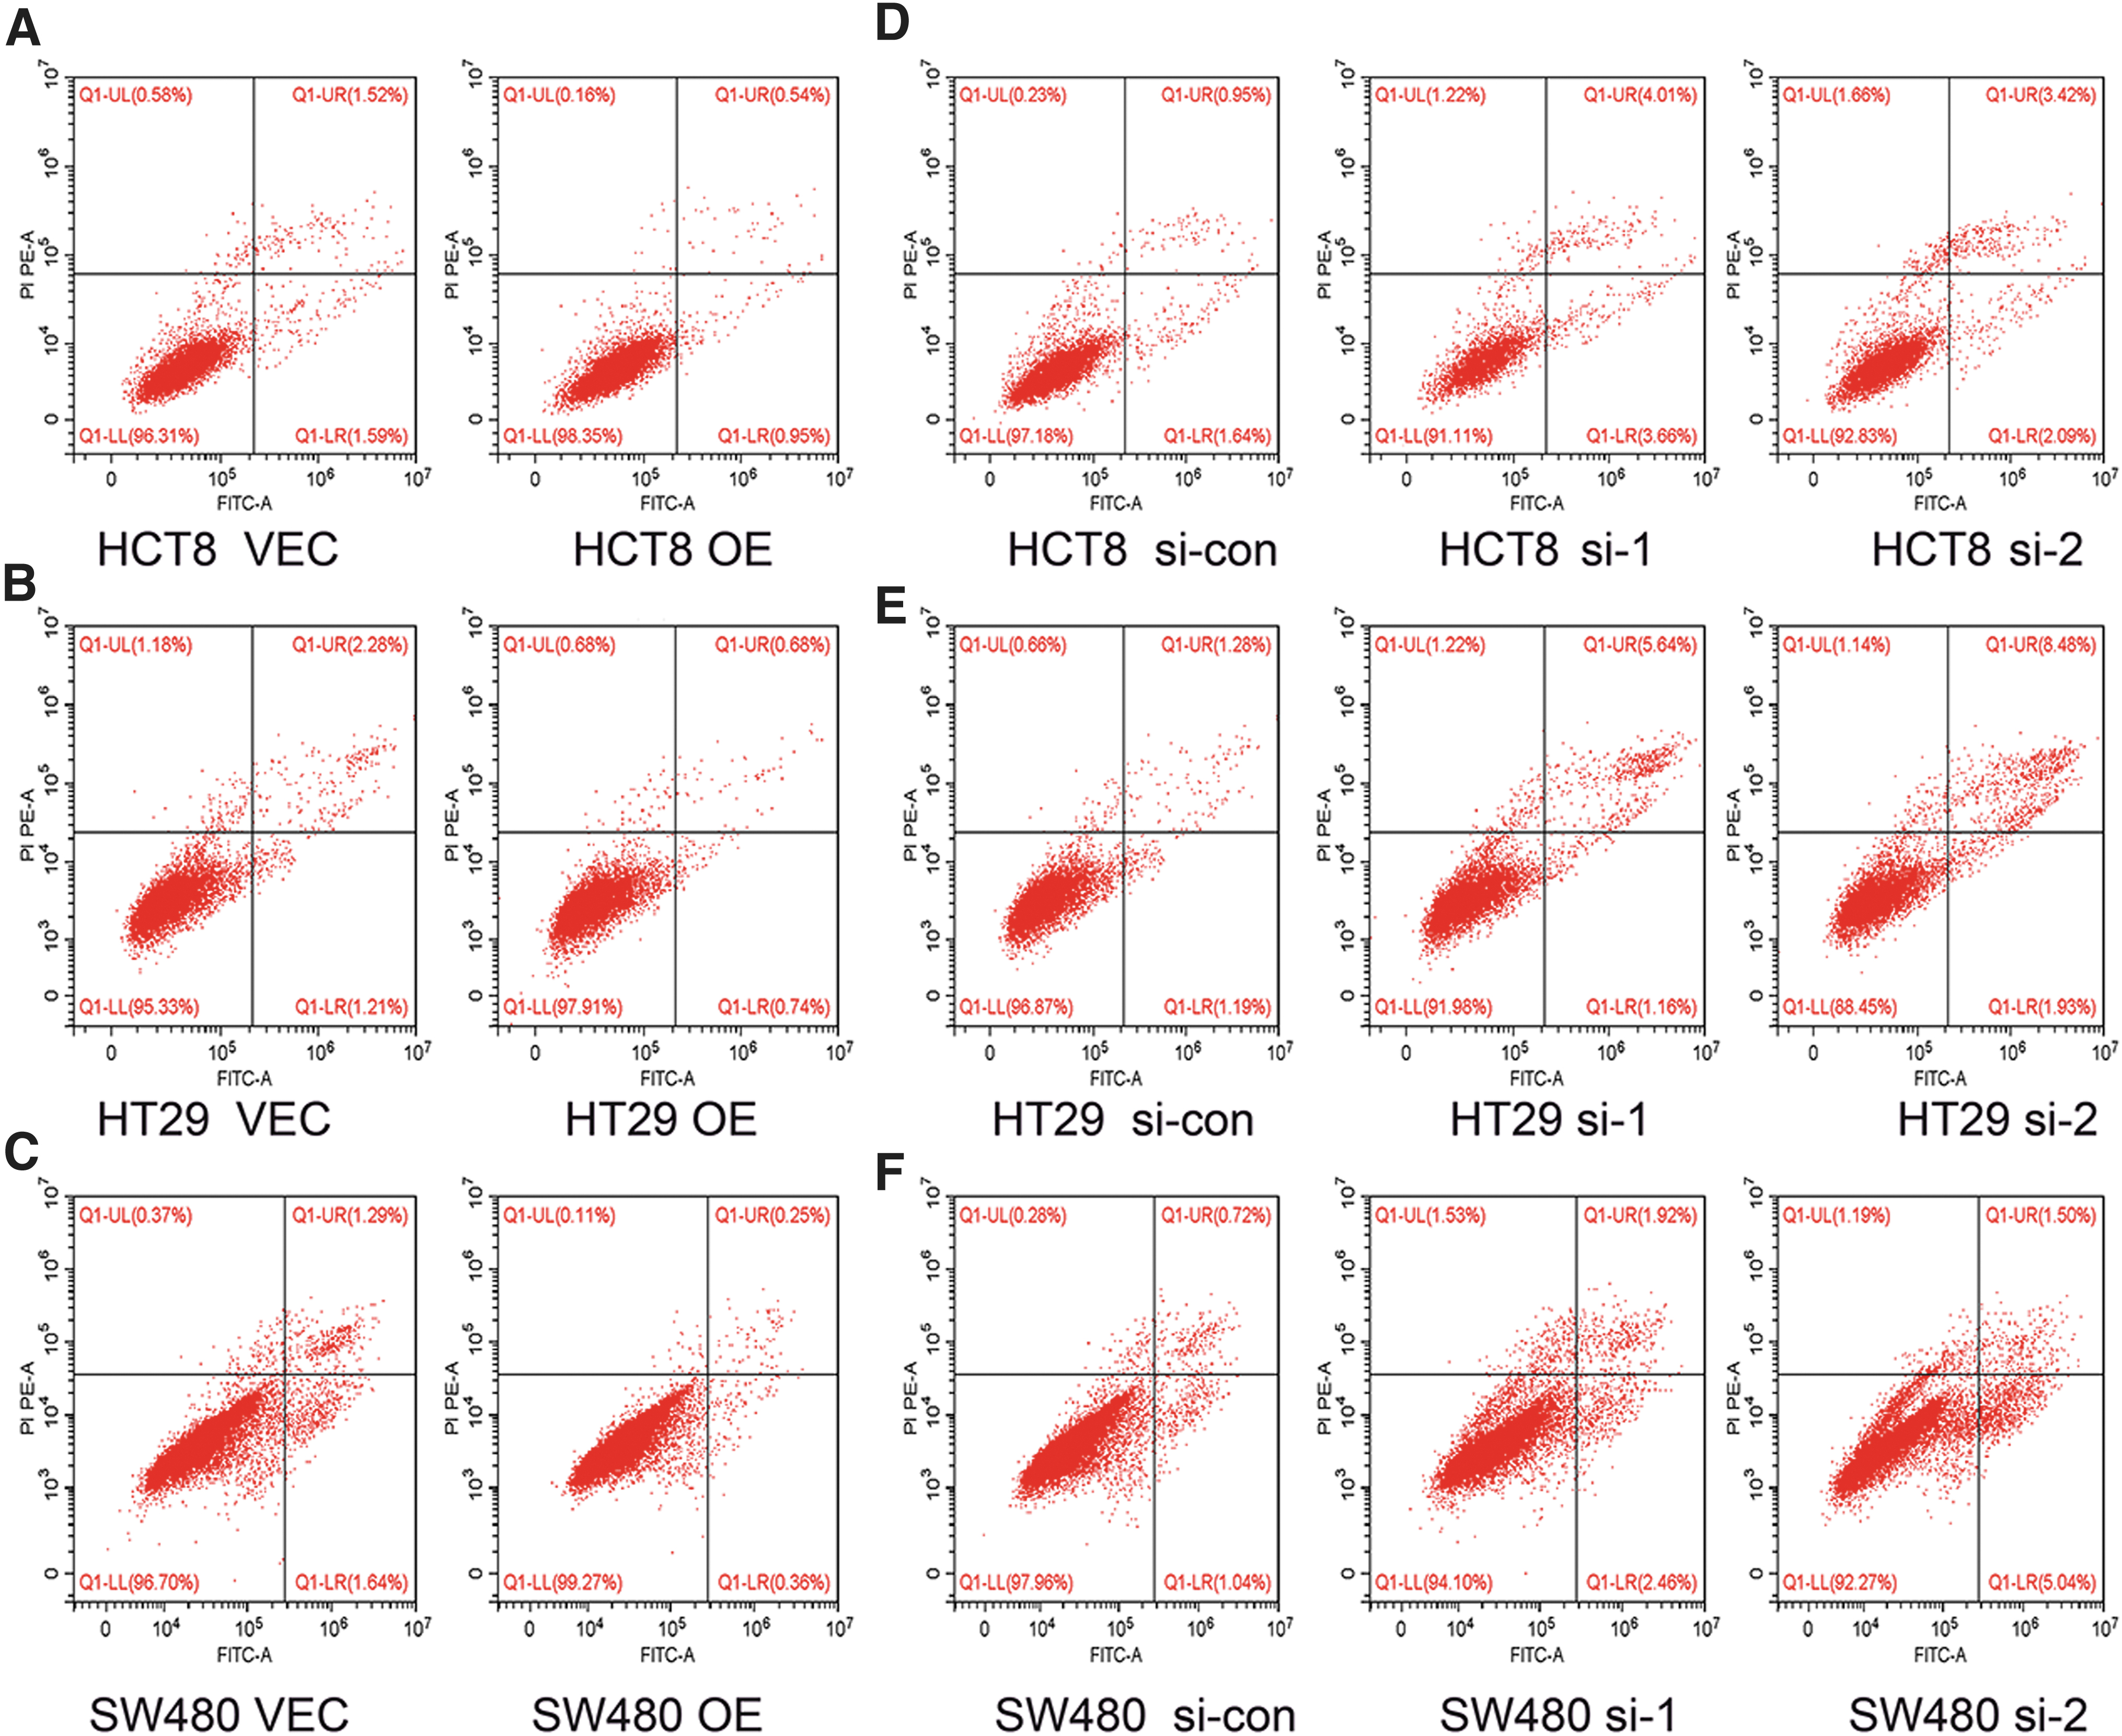
TIGD1 inhibits apoptosis and affects cell cycle.
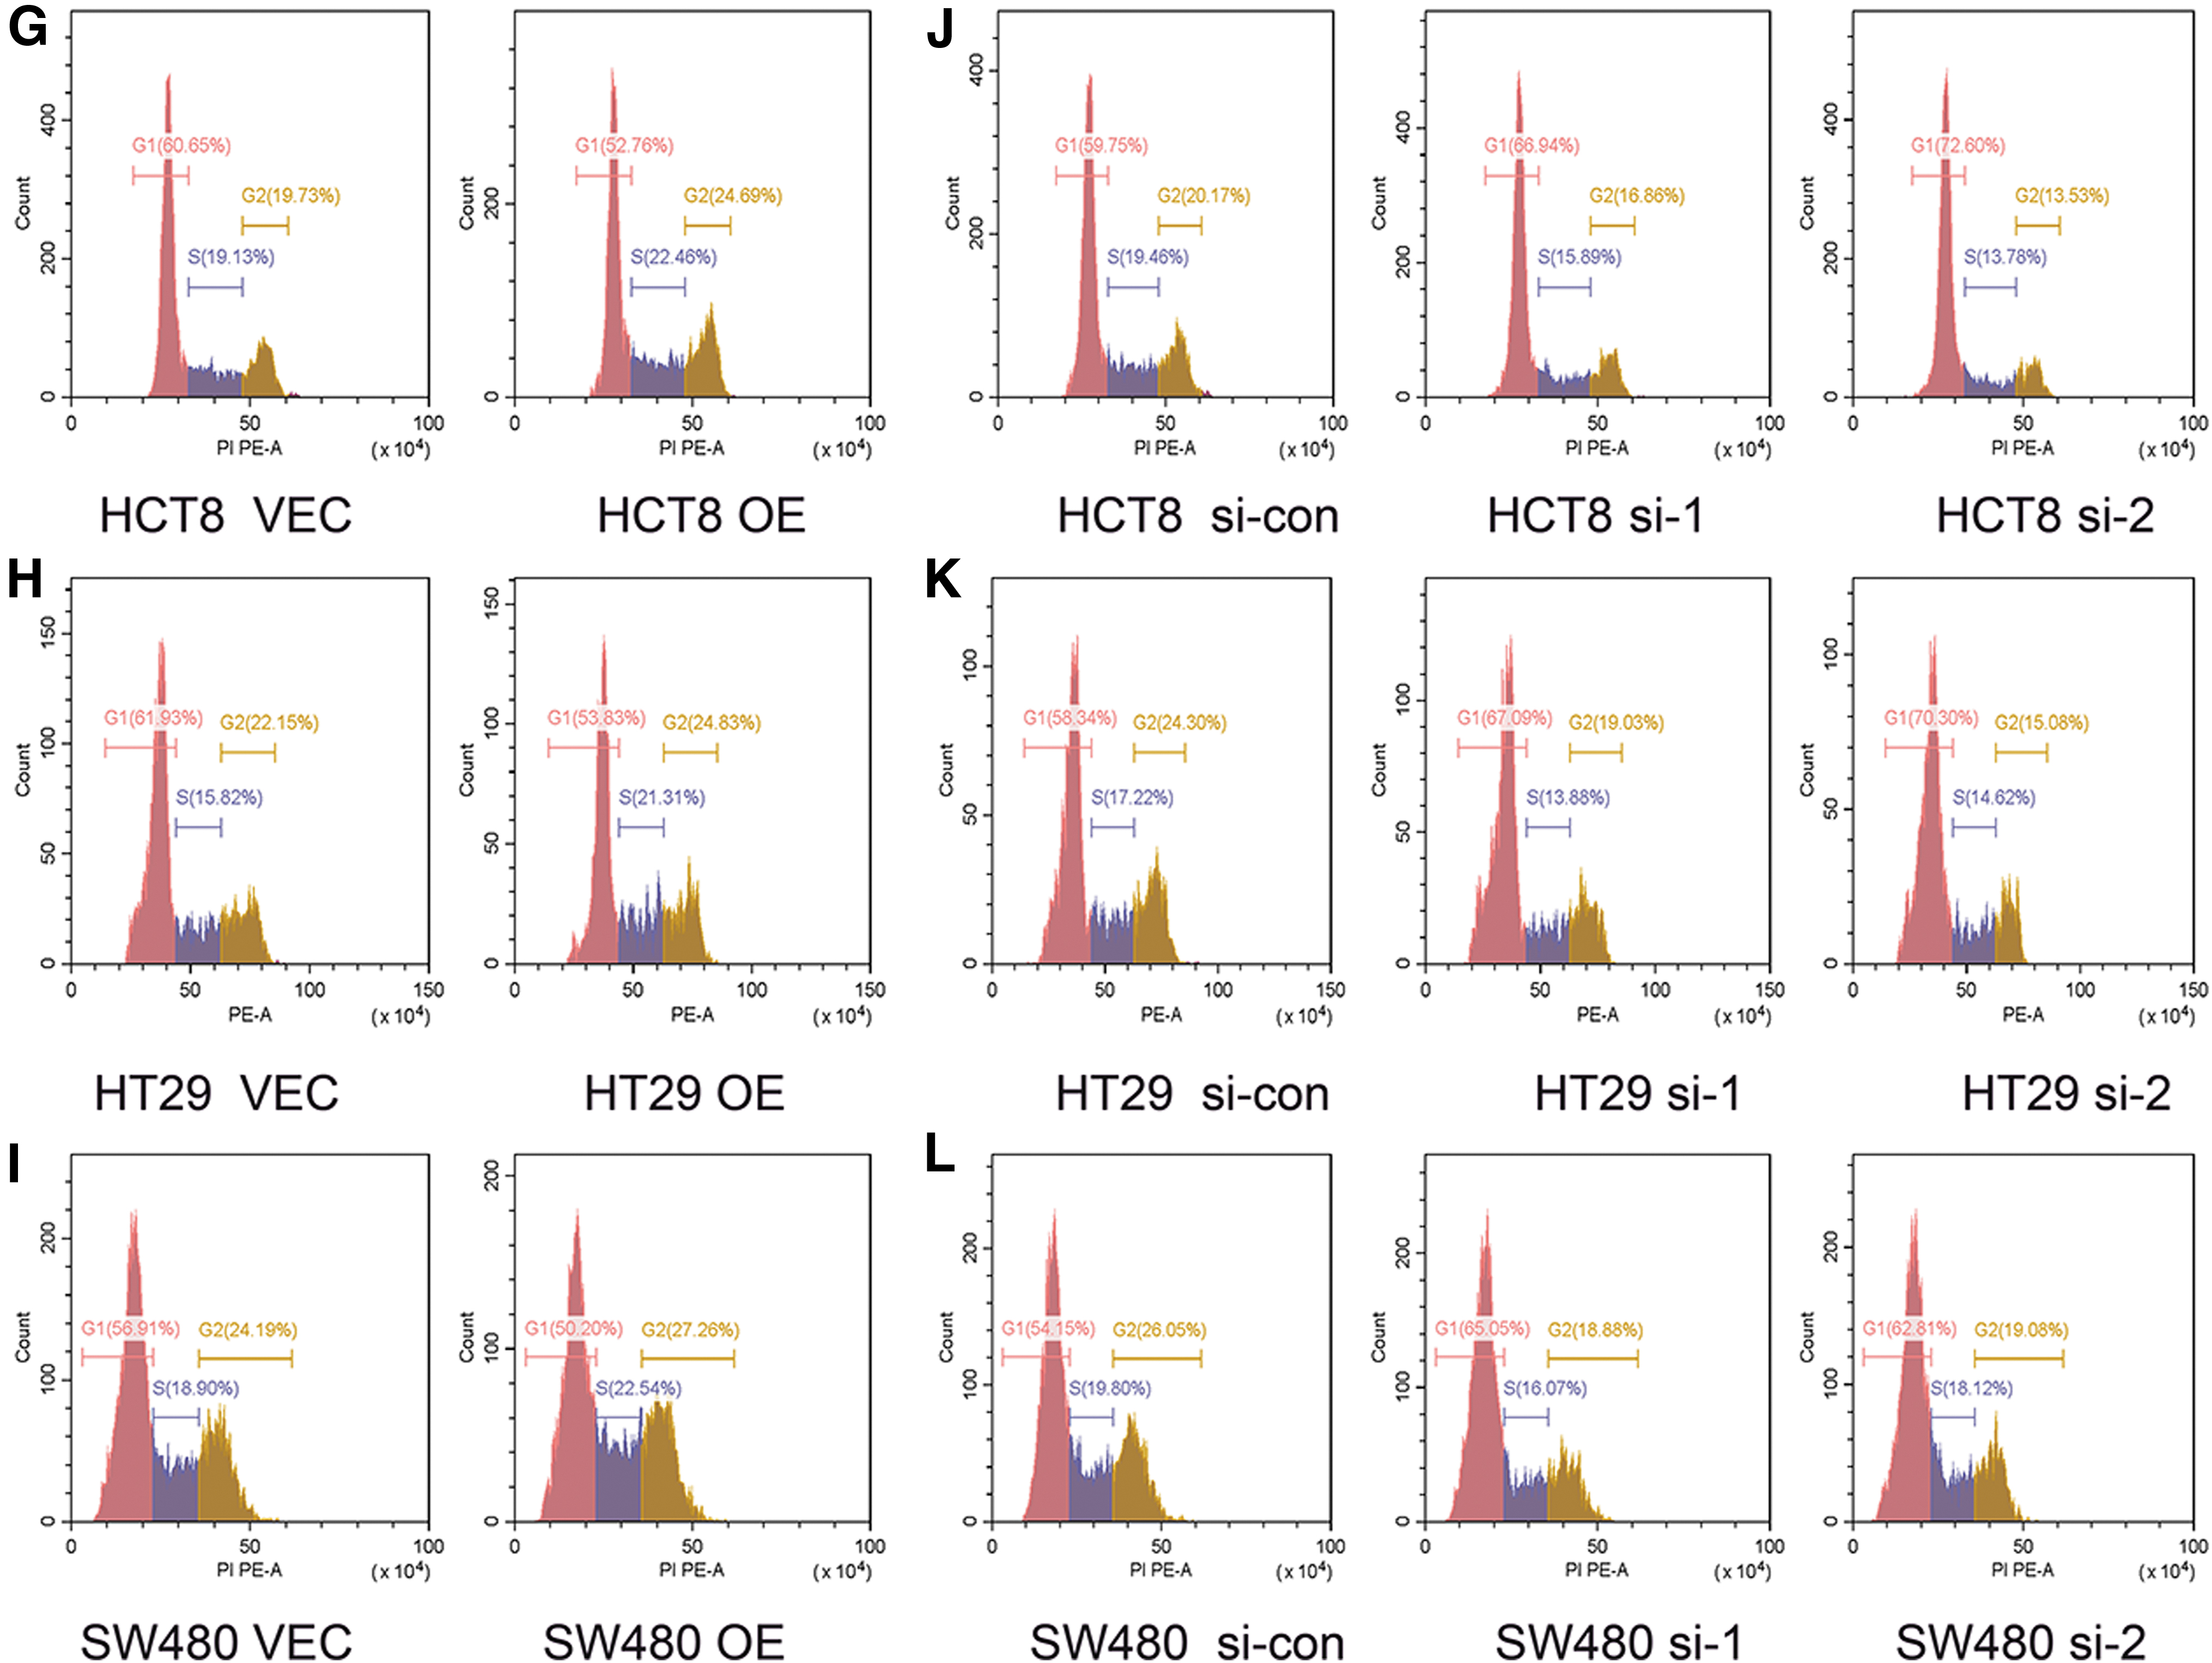
The cell cycle is essential in the proliferation and apoptosis of tumor cells. 16 Therefore, flow cytometry was conducted to determine whether the proliferation capability of TIGD1 in colon cancer cells was influenced by the cell cycle. In the HCT8 cell line, overexpression of TIGD1 significantly decreased the proportion of G1 phase cells, whereas the number of G2 and S phase cells significantly increased (Fig. 6G). This phenomenon was also observed in the HT29 and SW480 cell lines (Fig. 6H, I). In contrast with the controls, TIGD1 depletion inhibited cell proliferation by blocking the G1-S transition (Fig. 6J–L).
Related pathways involved in TIGD1 in colon cancer
The results described earlier demonstrate that TIGD1 can influence the proliferation and invasion of colon cancer cells, suppress the apoptosis of tumor cells, and affect the cell cycle. The pathways involved in TIGD1 that affect these malignant behaviors need to be further explored.
The authors utilized the HPA database to find TIGD1 in cells. It was discovered that TIGD1 is located in the nucleoplasm of Hela, MCF7, and U2-OS cell lines (Fig. 7A). This result suggested that TIGD1 may act as a transcription factor, promoting the transcription of downstream genes. The authors discovered that overexpression of TIGD1 substantially elevated the expression levels of Wnt and β-catenin, thereby activating the Wnt signaling pathway, whereas knockdown of TIGD1 remarkedly lowered the expression levels of both Wnt and β-catenin (Fig. 7B–D).
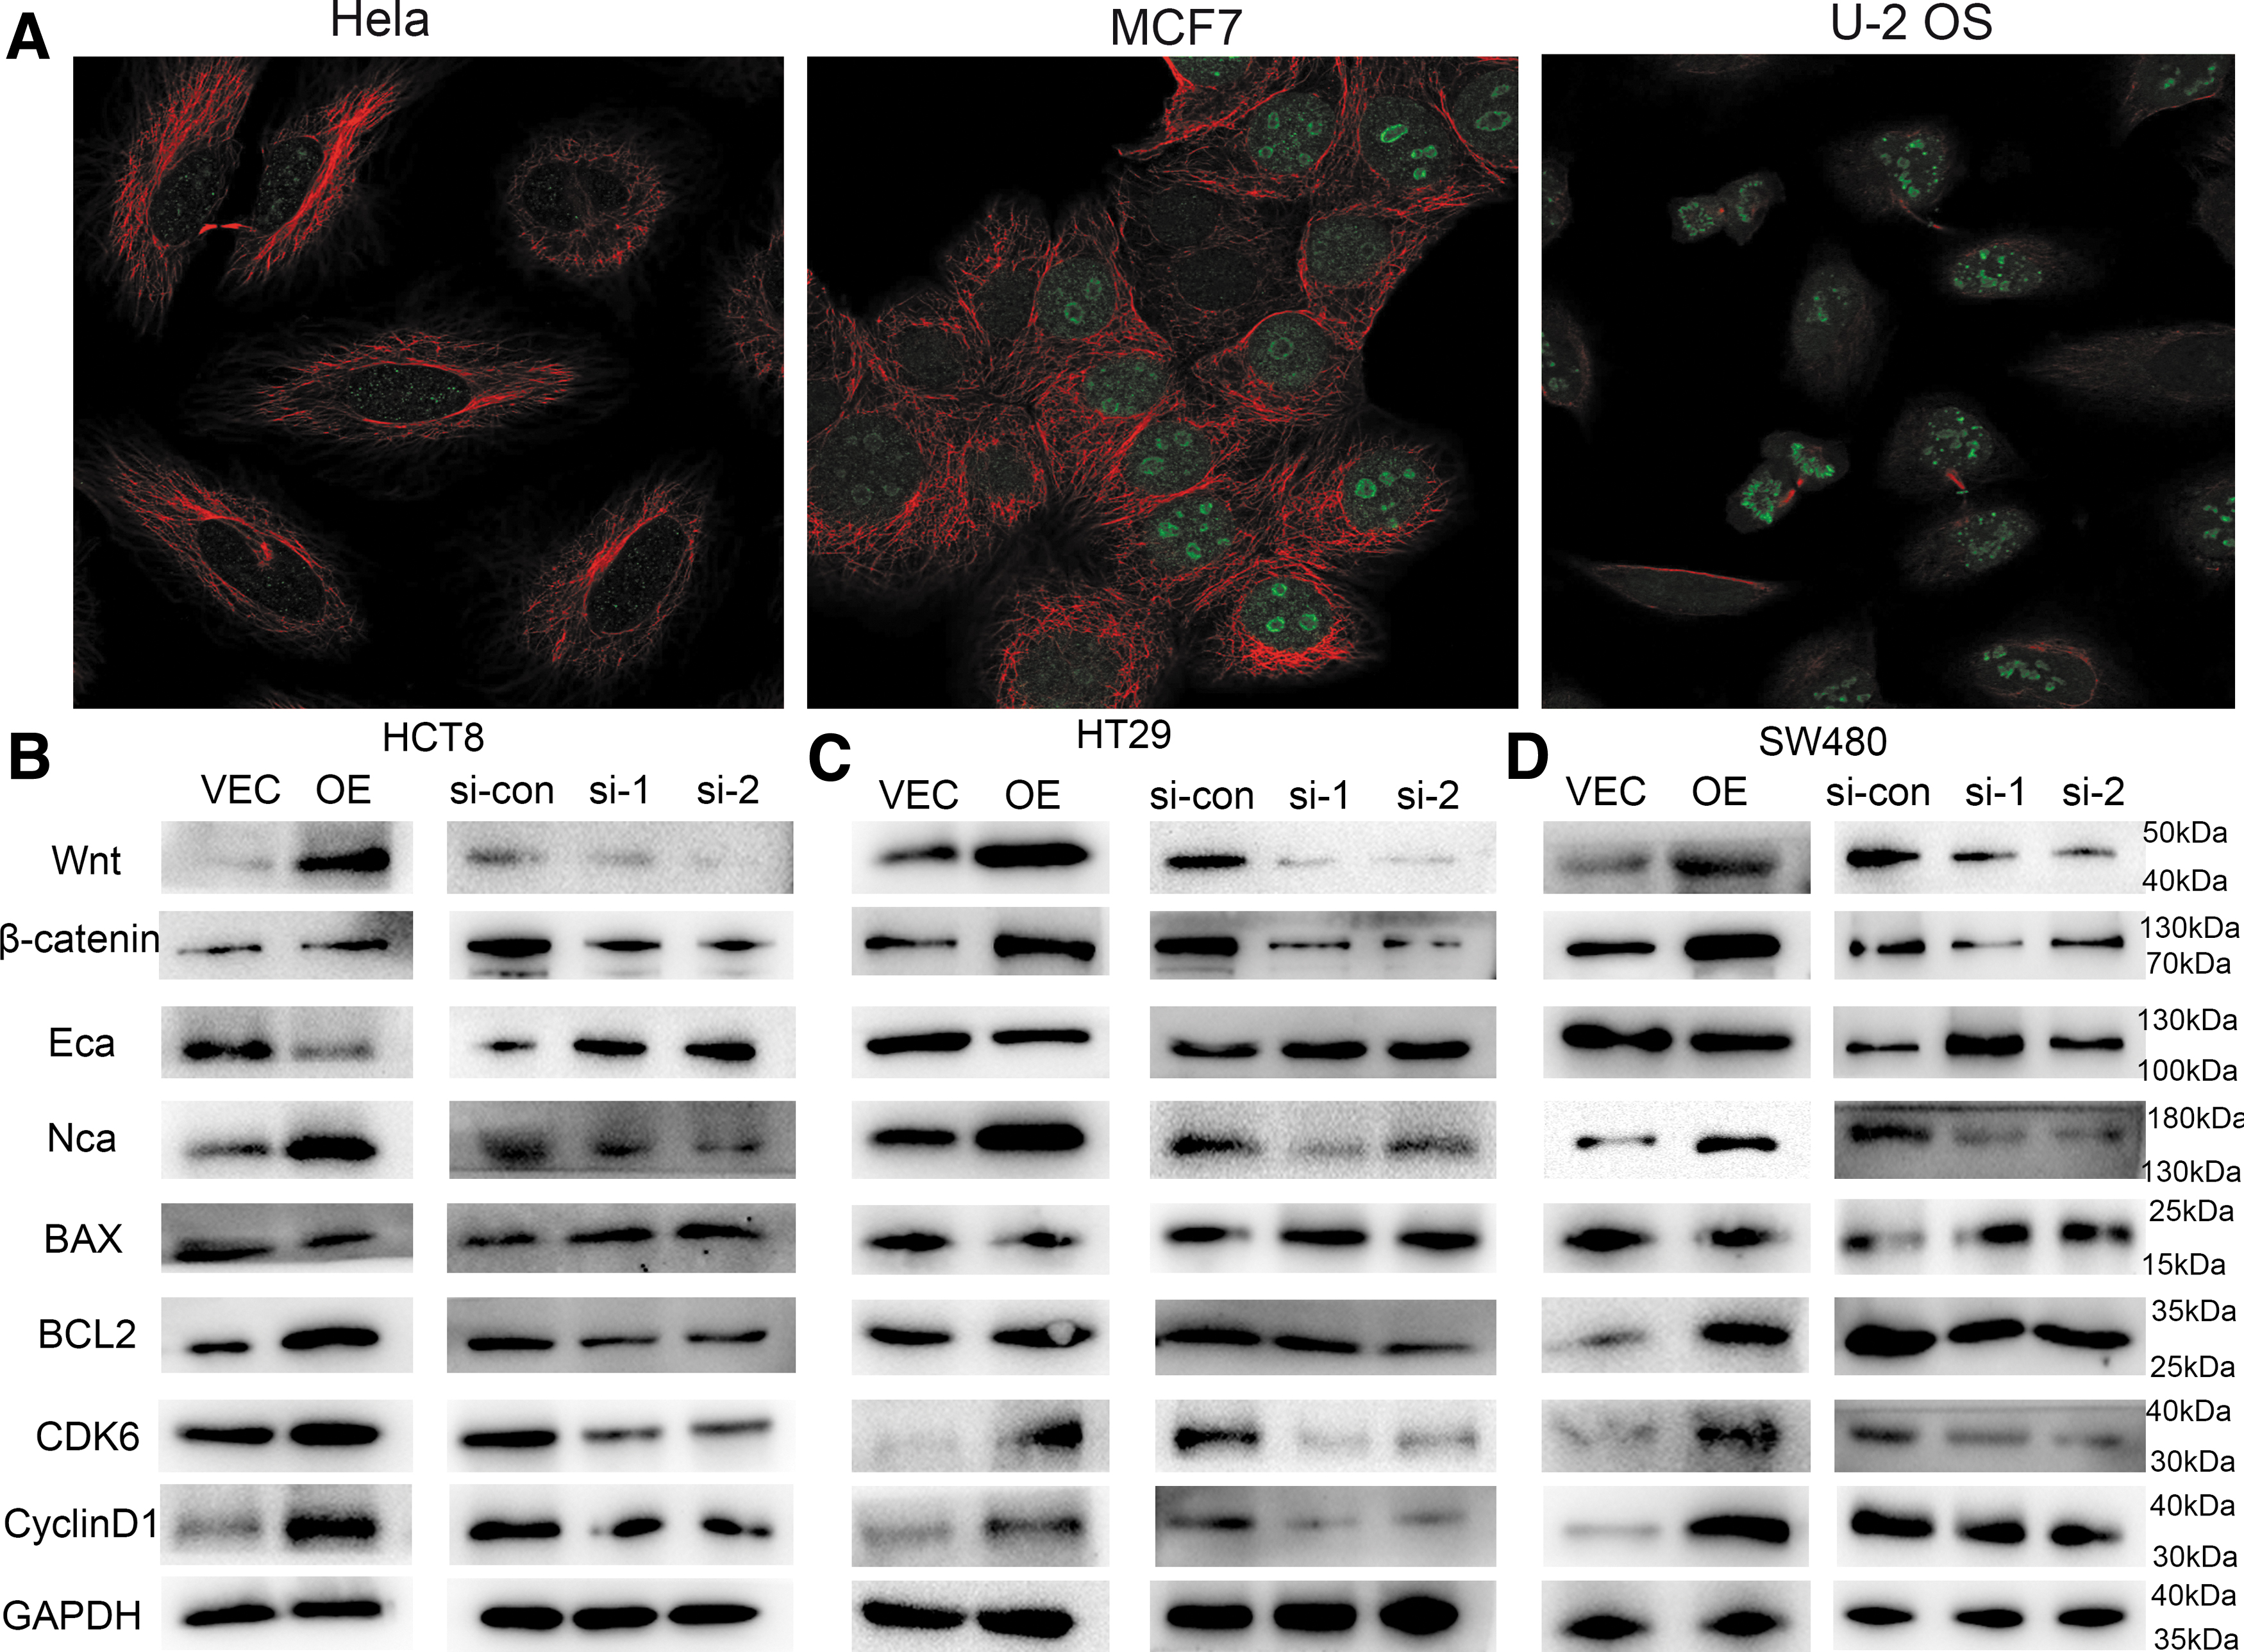
Related pathways involved in TIGD1 in colon cancer.
In addition, the authors found that overexpression of TIGD1 caused a decrease in E-cadherin expression, as well as an elevation in N-cadherin levels, with the opposite result being observed in the TIGD1 silencing group (Fig. 7B–D). Further, the authors discovered that overexpression of TIGD1 can enhance the expression of Bcl-2, whereas the silencing of TIGD1 can promote the expression of BAX. Finally, the overexpression of TIGD1 was found to enhance the expression of CDK6 and CyclinD1, whereas the silencing of TIGD1 inhibited the expression of these two molecules.
Taken together, these findings proved that TIGD1 can maintain the malignant characteristics of tumor cells through the earlier mentioned pathways.
Discussion
Over the past few decades, advances in endoscopic technology and a better understanding of tumor biology have led to significant increases in early detection and cure rates for colon cancer. 17 The TNM grading system remains the gold standard for selecting cancer treatment or predicting prognostic parameters. 18 However, due to the individual heterogeneity of colon cancer patients, this TNM grading system fails to accurately predict the prognosis and treatment required for individual patients. 19,20 Therefore, it is particularly important to explore new tumor markers for predicting patient prognosis and guiding subsequent treatment.
Previously, our research team discovered that TIGD1 was considerably enhanced in colon cancer in the TCGA and GEO datasets. This was confirmed by comparing colon cancer cell lines with normal cell lines, and tumor tissues from colon cancer patients with corresponding peri-tumor tissues. Clinical correlation analysis affirmed that TIGD1 expression was elevated in the tissues of advanced-stage patients, and it was substantially elevated among individuals with lymph node and distant metastasis.
TIGD1 is composed of 591 amino acids (AA) and has an isoelectric point (pI) of 8.75. According to the ensemble database, it comprises three pfam domains, namely DNA binding HTH (9–60 AA), HTH CenpB-type DNA binding HTH (80–147 AA), and DDE endonuclease domain (216–403 AA). 6,21 Also, it is mainly located in the nuclear plasma. Further investigation revealed that increased TIGD1 expression was associated with shorter patient survival, and TIGD1 is an independent prognostic factor. Thus, a nomogram was designed to predict patient prognosis utilizing TIGD1 expression levels.
The investigation of the impact of TIGD1 on the proliferation, migration, and death of colon cancer cells revealed that TIGD1 can substantially enhance the proliferation and migration of tumor cells and inhibit apoptosis. These findings demonstrated that TIGD1 enhances the malignant behavior of tumor cells and are consistent with the bioinformatics analysis that TIGD1 expression was elevated in the tissues of advanced-stage patients, and individuals with lymph node and distant metastasis.
The Wnt/β-catenin signaling pathway, commonly referred to as the canonical Wnt signaling pathway, is a conserved signaling axis engaged in proliferation, apoptosis, and migration-related physiological processes. 22 TIGD1 overexpression increased Wnt and β-catenin expression, indicating that TIGD1 can affect the proliferation, migration, and apoptosis processes of colon cancer cells via the Wnt signaling pathway.
E-cadherin and N-cadherin are involved in cell migration, as decreased E-cadherin expression can reduce adhesion between cancerous cells, resulting in shedding and metastasis, whereas N-cadherin mediates the transformation of tumor cells from epithelial to mesenchymal cells, thereby promoting tumor cell invasion. 23 –25 TIGD1 overexpression decreased E-cadherin and increased N-cadherin expression, whereas the opposite results were observed in the TIGD1 silencing group, thus explaining why TIGD1 overexpression promotes cancer cell migration, whereas TIGD1 knockdown inhibits migration.
Apoptosis is regulated by various proteins, among which Bcl-2 and BAX play anti-apoptotic and pro-apoptotic functions, respectively. 26 TIGD1 overexpression promoted Bcl-2 expression, whereas TIGD1 silencing promoted BAX expression, thus explaining why TIGD1 overexpression can inhibit the apoptosis of tumor cells.
Cell cycle deregulation is the basis of the abnormal proliferation of cancerous cells, and the loss of cell cycle checkpoint control promotes genetic instability. 27 The cell cycle can also affect cell migration and apoptosis, 28 –30 so the authors investigated the impact of TIGD1 on the cell cycle, and the authors found that TIGD1 overexpression significantly promoted G1-S transition whereas the silencing of TIGD1 produced the opposite result.
These results are consistent with a previous study. 6 Also, TIGD1 overexpression enhanced the expression of CDK6 and CyclinD1, important molecules in cell cycle progression and G1-S transition, 31,32 whereas TIGD1 silencing suppressed their expression.
This study has some limitations. One is the lack of animal studies to show whether TIGD1 has the same effect in living organisms. Another is the lack of research into the specific mechanisms of TIGD1 action. Thus, future studies will involve chromatin immunoprecipitation, co-immunoprecipitation, and animal experiments to confirm these findings.
In conclusion, this is the first study to show that TIGD1 is highly upregulated in colon cancer and is linked to poor outcomes; thus, it is an independent prognostic factor for colon cancer. TIGD1 overexpression significantly enhanced the proliferation and metastasis of colon cancer cells and suppressed apoptosis by promoting the transition of tumor cells from the G1 to the S phase through the Wnt/β-catenin signaling pathway, E-cadherin, N-cadherin, Bcl-2, BAX, CDK6, and CyclinD1.
Footnotes
Acknowledgments
The authors thank Bullet Edits Limited for the linguistic editing and proofreading of the manuscript, and they thank Zhihao Wu (Research laboratory of Tumor Microenvironment, Wannan Medical College, Wuhu, Anhui, China) and Dong Wang (Department of Hepatobiliary Surgery, The First Affiliated Hospital of Wannan Medical College, Wuhu, Anhui, China) for constructive suggestions during the manuscript revision stage.
Authors' Contributions
All authors contributed to the study conception and design. Material preparation, data collection, and analysis were performed by JZ, WH, TZ, HX, and YH. The first draft of the manuscript was modified by JZ, HZ, ZW, and HZ. All authors commented on previous versions of the manuscript. All authors read and approved the final manuscript.
Ethics Approval and Consent to Participate
The study was conducted in accordance with the Declaration of Helsinki (as revised in 2013). The study was approved by the ethics board of The Second Affiliated Hospital of Wannan Medical College, and individual consent for this retrospective analysis was waived.
Availability of Data and Materials
The datasets generated and/or analyzed during the current study are available in the TCGA, GEO. Data are available on request due to privacy or other restrictions. The data that support the findings of this study are available on request from the corresponding author.
Disclosure Statement
There are no existing financial conflicts.
Funding Information
This work was funded and supported by the Key project of Natural Science Foundation of Wannan Medical College (WK2022ZF29), the Young Science and Technology Talent Support Project of Jiangsu Association for Science and Technology (TJ-2022-063), and the Climbing Scientific Peak Project for Talents, the Second Affiliated Hospital of Wannan Medical College (No. DFJH2022018).
Supplementary Material
Supplementary Figure S1
Supplementary Figure S2
Supplementary Figure S3
Supplementary Figure S4
Supplementary Table S1
Supplementary Table S2
Supplementary Table S3
Supplementary Table S4
Supplementary Table S5
References
Supplementary Material
Please find the following supplemental material available below.
For Open Access articles published under a Creative Commons License, all supplemental material carries the same license as the article it is associated with.
For non-Open Access articles published, all supplemental material carries a non-exclusive license, and permission requests for re-use of supplemental material or any part of supplemental material shall be sent directly to the copyright owner as specified in the copyright notice associated with the article.