




Abstract
Background:
Osteosarcoma (OS) is an aggressive pediatric cancer with unmet therapeutic needs. Glutaminase 1 (GLS1) inhibition, alone and in combination with metformin, disrupts the bioenergetic demands of tumor progression and metastasis, showing promise for clinical translation.
Materials and Methods:
Three positron emission tomography (PET) clinical imaging agents, [18F]fluoro-2-deoxy-2-D-glucose ([18F]FDG), 3′-[18F]fluoro-3′-deoxythymidine ([18F]FLT), and (2S, 4R)-4-[18F]fluoroglutamine ([18F]GLN), were evaluated in the MG63.3 human OS xenograft mouse model, as companion imaging biomarkers after treatment for 7 d with a selective GLS1 inhibitor (CB-839, telaglenastat) and metformin, alone and in combination. Imaging and biodistribution data were collected from tumors and reference tissues before and after treatment.
Results:
Drug treatment altered tumor uptake of all three PET agents. Relative [18F]FDG uptake decreased significantly after telaglenastat treatment, but not within control and metformin-only groups. [18F]FLT tumor uptake appears to be negatively affected by tumor size. Evidence of a flare effect was seen with [18F]FLT imaging after treatment. Telaglenastat had a broad influence on [18F]GLN uptake in tumor and normal tissues.
Conclusions:
Image-based tumor volume quantification is recommended for this paratibial tumor model. The performance of [18F]FLT and [18F]GLN was affected by tumor size. [18F]FDG may be useful in detecting telaglenastat's impact on glycolysis. Exploration of kinetic tracer uptake protocols is needed to define clinically relevant patterns of [18F]GLN uptake in patients receiving telaglenastat.
Introduction
Osteosarcoma (OS) is a rare and aggressive malignancy affecting mainly children, adolescents, and young adults during the period of rapid skeletal growth. 1,2 The disease is characterized by a chaotic genome, with a high incidence of structural variations and mutations in genes such as TP53, RB1, MYC, PTEN, RUNX2, CDKN2A/B, and others. 3 OS is highly metastatic despite routine use of aggressive local tumor therapy and adjuvant chemotherapy.
Currently, the 5-year survival rate is ∼70%, which has not improved substantially in the past 30 years. 4,5 Thus, novel approaches to OS therapy are clearly needed. The authors' group has focused on the metabolic vulnerabilities of OS, specific to the bioenergetic demands of tumor metastasis, as this is the main cause of morbidity and mortality in patients.
The authors have recently shown that depletion of key nutrients such as glutamine through pharmacologic inhibition of glutaminase 1 (GLS1) using telaglenastat (CB-839; Calithera Biosciences), particularly when combined with metformin treatment, slows tumor growth and reduces metastatic progression in animal models of OS. 6
This synergistic drug combination reduces mitochondrial respiration, through metformin's inhibition of mitochondrial complex I, and reduces cellular access to glutamine as a source for tricarboxylic acid cycle (TCA) intermediates through telaglenastat's inhibition of GLS. This forces cells to rely on alternate carbon sources that are insufficient to meet bioenergetic demands, translating into a potentially promising approach for further clinical development.
With this finding, the authors next sought to establish a companion imaging biomarker for this therapeutic strategy for patients. The identification of pharmacodynamic (PD) biomarkers for novel anticancer strategies enhances the ability to monitor therapeutic effects on tumor progression, to define the patient population most likely to benefit, and to improve patient selection for specific therapeutics. Validated imaging PD biomarkers of the drug effect and patient response are not only noninvasive but also provide a global view of the drug effect on surrounding tissues as well as the tumor in real time.
Many available positron emission tomography (PET) imaging agents are well suited to monitor tumor metabolism through reporting on key cellular biochemical pathways and nutrient utilization. The best example is the most widely used oncologic PET imaging agent, [ 18 F]fluoro-2-deoxy-2-D-glucose ([ 18 F]FDG), which reports on tumor glucose uptake and is predictive of patient outcomes, such as response to drug therapy or prognosis, in several tumor types. 7,8 The PET agent 3′-[ 18 F]fluoro-3′-deoxythymidine ([ 18 F]FLT), an 18 F-labeled thymidine analog, has been used to demonstrate cellular thymidine kinase-1 (TK1) activity, reflecting the salvage pathway of DNA synthesis. 9,10
A number of other PET agents that report on tumor metabolism have been developed in recent years, including those based on natural and non-natural amino acids (methionine, choline, leucine, etc.), fatty acids, and nucleic acids, for investigation of other biochemical pathways that are critical to tumor growth and disease progression. 11 –16
Recent work with (2S, 4R)-4-[ 18 F]fluoroglutamine ([ 18 F]GLN) has suggested an association between tracer kinetics and response to GLS1 inhibition, specifically in the context of telaglenastat exposure. 17 In addition, GLS1 inhibitors are under investigation in other cancer types known to depend on glutamine, particularly triple-negative breast cancer and leukemia. 18 –26
In this study, three PET metabolic imaging agents, [ 18 F]FDG, [ 18 F]FLT, and [ 18 F]GLN, were evaluated in the setting of telaglenastat±metformin treatment of human OS xenografts utilizing PET/computed tomography (PET/CT) technology. These PET agents were selected based on the nuclear magnetic resonance metabolite profiling conducted previously by the authors' group, which confirmed the PD effects of each drug, individually and in combination, while also revealing the metabolic consequences of such a treatment strategy on key cellular bioenergetic pathways such as glycolysis, mitochondrial respiration, and TCA cycle functionality. 6
The authors hypothesized that [ 18 F]FDG uptake would decrease with drug treatment, but this effect may be masked by concurrent metformin exposure; [ 18 F]FLT uptake may also change depending on which DNA synthetic pathway is dominant during nutrient deprivation; and [ 18 F]GLN uptake as a surrogate for glutamine pool size would increase as a consequence of GLS1 inhibition. These data could elucidate the optimal imaging agent to accompany the clinical application of telaglenastat±metformin in OS patients.
Materials and Methods
Cell lines and reagents
The highly metastatic human OS cell line, MG63.3, was cultured with DMEM supplemented with 10% fetal bovine serum, 2 mM glutamine, and Pen/Strep at 37°C in 5% CO2.
Telaglenastat and vehicle (2-hydroxypropyl-β-cyclodextrin [HPBCD]) were kindly provided by Calithera Biosciences (chemical structure shown in Fig. 1A). Metformin was obtained from Sigma-Aldrich (D150959-5G).
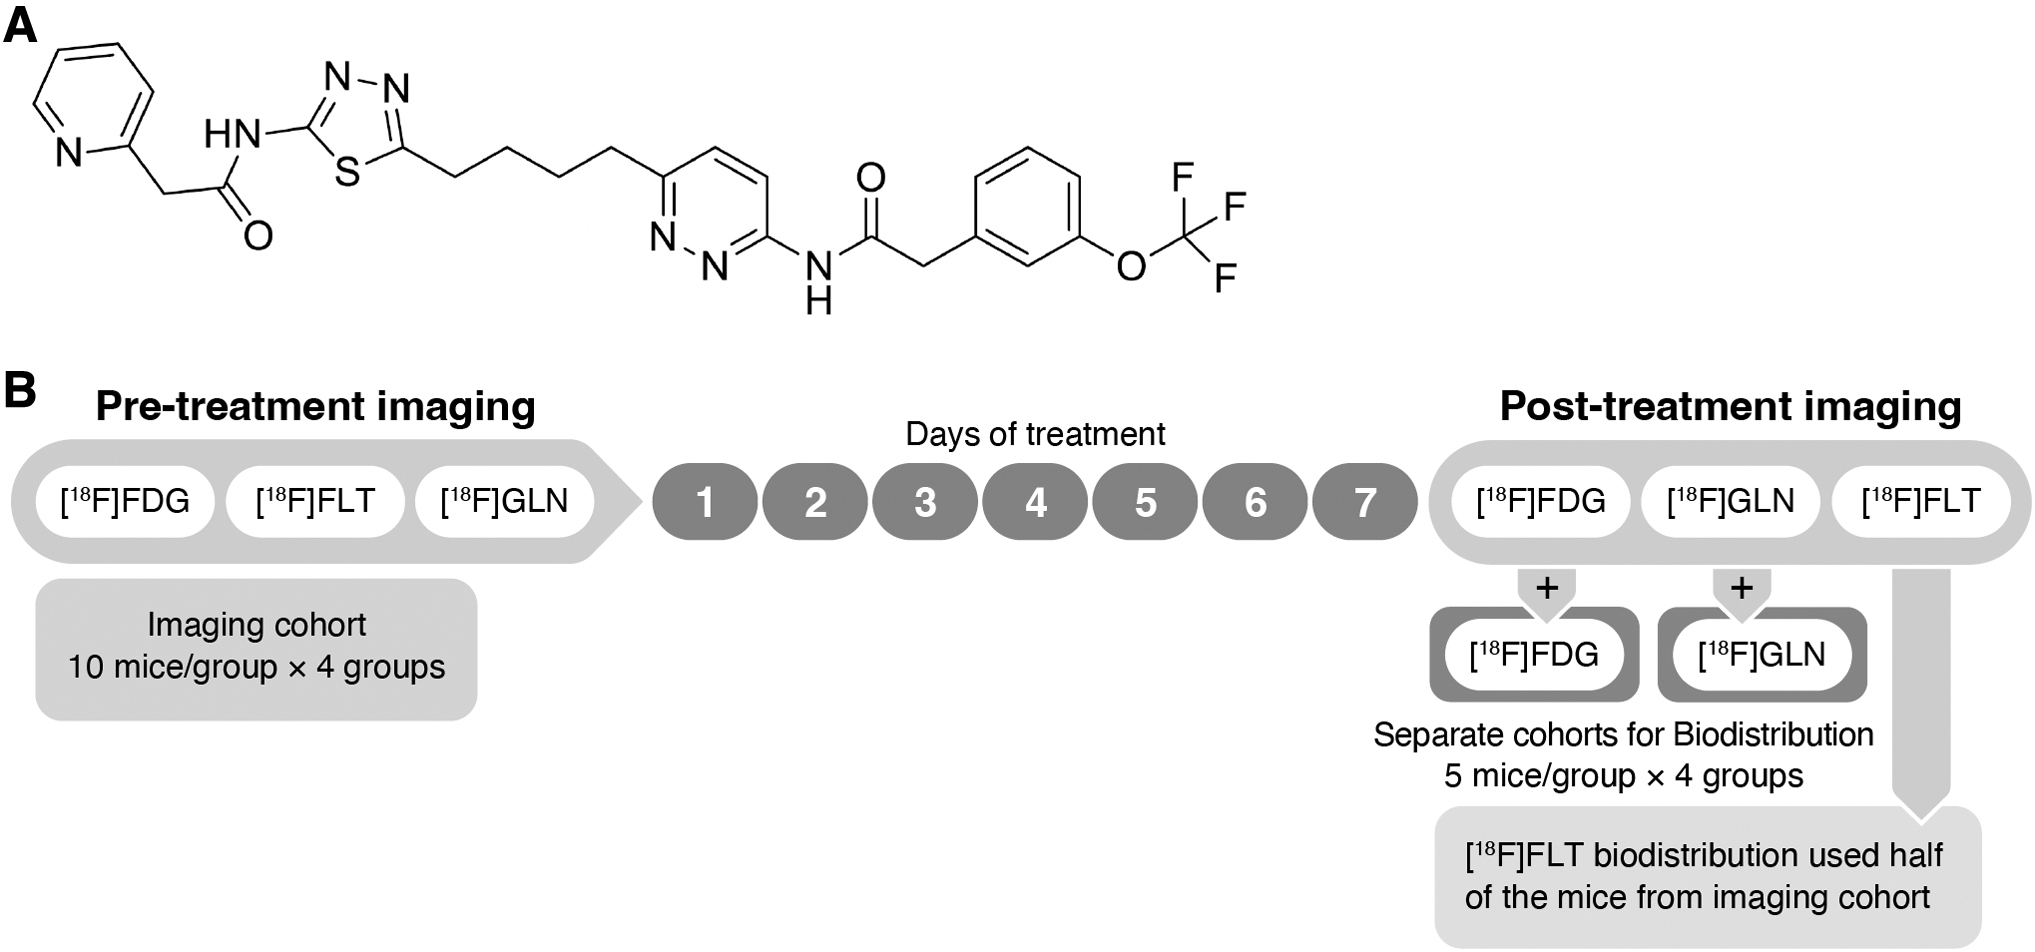
Telaglenastat chemical structure
Animal tumor model
All animal studies were performed with the approval of the Animal Care and Use Committee of the National Cancer Institute. Generation of the MG63.3 tumor model followed the same procedure described previously. 6 Briefly, 1 million MG63.3 cells in Hanks' balanced salt solution were injected into a paraosseous site adjacent to the left tibia of 6-week-old, female, SCID beige mice (Fox Chase CB17.B6-PrkdcscidLyst bg/Crl; NCI, Frederick, MD, USA). Body weight and tumor caliper measurements were obtained weekly.
Tumor volume is calculated as an ellipsoid model where volume = (π × length × width × height)/6. Mice received gavage of vehicle (HPBCD), telaglenastat (200 mg/kg in HPBCD; 2 treatments/day), metformin (300 mg/kg; 1 treatment/day), or the combination of telaglenastat and metformin for 7 d.
Study design
MG63.3 xenografts were generated within 80 SCID mice, allowing 3 weeks for tumor growth. When tumors reached ∼7 mm in diameter, 40 mice were randomized into four treatment groups of n = 10 each for PET/CT imaging, with the remaining 40 mice assigned to [ 18 F]FDG and [ 18 F]GLN biodistribution cohorts (Fig. 1B). Pretreatment (PR) PET/CT scans for [ 18 F]FDG, [ 18 F]GLN, and [ 18 F]FLT were performed sequentially, separated by 24 h, on the same imaging cohort before initiation of drug treatment.
Treatment with vehicle control, metformin, telaglenastat, and the metformin/telaglenastat combination was started thereafter and continued for 7 consecutive days. Post-treatment (PO) PET/CT scans of the three imaging agents were scheduled sequentially after completion of drug treatment. PO tissue biodistribution studies (5 mice per treatment group) for each imaging agent were completed on the same day as the PO PET/CT scans.
Biodistribution studies for [ 18 F]FDG and [ 18 F]GLN each used 20 separate mice, whereas the [ 18 F]FLT biodistribution data were generated from the [ 18 F]FLT imaging cohort following their last PET/CT scan.
Radiochemical synthesis
[ 18 F]GLN and [ 18 F]FLT were prepared following a published procedure. 27,28 The isolated radiochemical yields were in the range of 15%–25% (n > 5) for [ 18 F]GLN and 13%–17% (n > 5) for [ 18 F]FLT with a radiochemical purity of >99%. The molar activity of [ 18 F]FLT was 4.5–6.5 Ci/μmol (166.5–240.5 GBq/μmol). [ 18 F]FDG was acquired from Cardinal Health (Greenbelt, MD, USA).
The activity for all three tracers was measured with a dose calibrator (Capintec CRC®-25W, Florham Park, NJ, USA), followed by dilution with 0.9% saline, as needed before administration.
PET/CT imaging studies
PET/CT scans were conducted at two time points (i.e., PR and PO) when mice were injected through the tail vein with 100 μCi (3.7 MBq) of [ 18 F]FDG, [ 18 F]GLN, or [ 18 F]FLT. At 60 min post-tracer injection, tumor-bearing mice were anesthetized with isoflurane/O2 (1.5%–3% v/v) to obtain whole-body static PET images (2 bed positions, field of view = 2.0 cm, and total imaging time = 10 min), followed by a CT scan (2 bed positions, 10 min) using the BioPET (Bioscan, Inc., Washington District of Columbia, USA).
The images were reconstructed by a three-dimensional ordered subset expectation maximization method and analyzed (MIM, version 6.9.4; MIM Software, Inc.). Regions of interests (ROIs) were manually drawn around the entire tumor mass, excluding tissue consistent with bone or muscle, to obtain the mean standard uptake value (SUVmean) to compare tracer uptake between experiments. To evaluate relative tumor uptake, muscle from the nontumor-bearing leg was used as reference for the [ 18 F]FLT images.
For [ 18 F]GLN, a small ROI within the heart at a consistent location (representing blood) was used as the reference. For the [ 18 F]FDG imaging studies, although mice were kept within the anesthesia chamber for 10 min after injection to minimize physiologic muscle [ 18 F]FDG uptake, some increased limb muscle activity was identified during imaging analysis compared with lower back muscle, which was consistently inactive.
Therefore, lower back muscles were used as the reference for [ 18 F]FDG imaging analysis.
Biodistribution studies
For the [ 18 F]FDG and [ 18 F]GLN biodistribution cohort, mouse groups were injected through the tail vein with [ 18 F]FDG and [ 18 F]GLN (50 μCi, 1.85 MBq) and euthanized (through CO2 inhalation) at 60 min postinjection. For the [ 18 F]FLT biodistribution cohort, mice were euthanized (through CO2 inhalation) following PET/CT imaging at 80 min (additional 20 min to allow for imaging). Blood samples and tissues were collected from each animal.
Muscle was collected from the nontumor-bearing leg. Radioactivity content in the blood and tissue was calculated (PerkinElmer 2480 Wizard3) and expressed as % injected dose per gram (%ID/g) of tissue normalized for body weight to a 20 g mouse. Tumor:tissue ratios were calculated using %ID/g values for the respective tissues such that %ID/g = (counts per minute [cpm]tissue × body weight)/(tissue weight × cpmtotal injected × 20) × 100.
Statistical analysis
One-way ANOVA with multiple comparison analysis was used to compare the difference between the four groups using GraphPad 8.3. Data within the figures are presented as mean ± standard error of the mean; *p < 0.05, **p < 0.01, ***p < 0.001, ****p < 0.0001, Veh = vehicle, CB = telaglenastat (CB-839), MET = metformin, and CM = CB-839+metformin.
Results
Tumor volumes
Based on caliper measurements and imaging quantification, the tumor volumes of all treated mice increased during the 7-d period between the two PET/CT scans. Since this was a paratibial tumor model, 29 tumors typically grow into irregular shapes, usually spanning from the distal tibia to mid-femur, surrounding the associated bone and joint. This necessitates using a geometric formula based on dimensional measurements, which may not be wholly accurate in estimating tumor volume, whereas volume quantification using data from a high signal intensity scan (i.e., [ 18 F]FLT) could provide a more precise readout representing tumor size and weight (Fig. 2A).
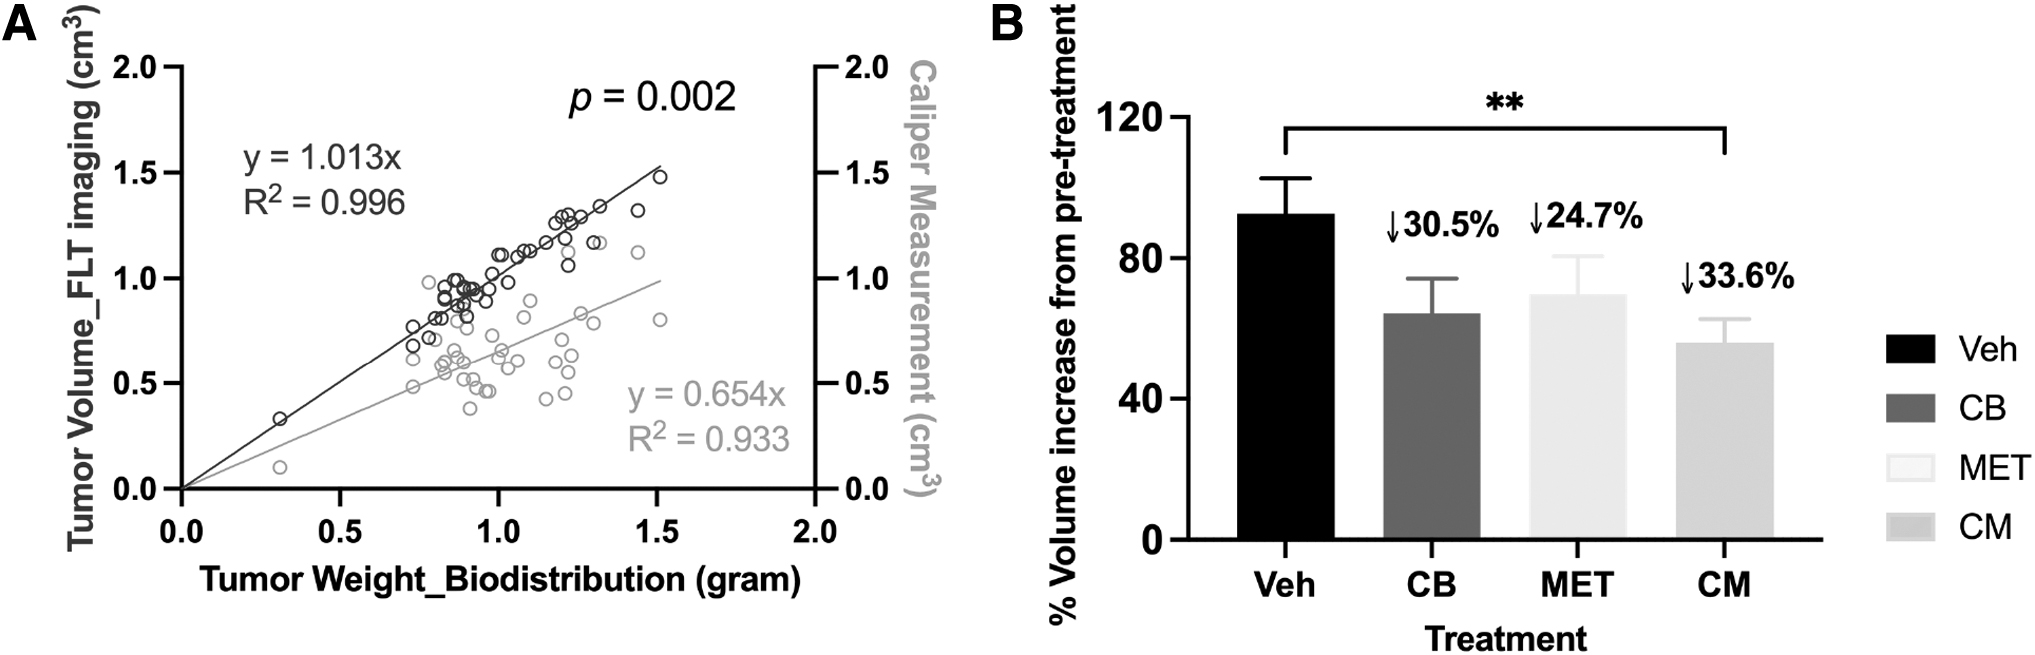
Tumor volume measurement.
After one week of treatment, modest decreases (24%–34%) in tumor volumes were observed in all the treated groups relative to the control group, with only the combination-treated group showing a significant difference (Fig. 2B). Based on prior studies, the difference between control and treated groups would most likely have been more robust if treatment had been extended beyond 7 d. 6
[ 18 F]FDG PET imaging and biodistribution
In the human MG63.3 xenografts, PR [ 18 F]FDG tumor uptake values (average SUVmean = 0.76 ± 0.20) were relatively low with tumor:muscle (T:M) ratios ranging between 2.05 and 3.30 (95% CI of mean), indicating that this OS tumor model is not highly glucose avid (Fig. 3A). Compared with PR, PO [ 18 F]FDG tumor uptake (T:M ratio) was not significantly different in the metformin- and vehicle-treated mice, whereas in the telaglenastat- and combination-treated groups, it decreased significantly by 27% and 30.2%, respectively (Fig. 3B).

Imaging and biodistribution data of [ 18 F]FDG.
[ 18 F]FDG tumor uptake values of vehicle PO were slightly decreased compared with its PR, which might be expected since the tumors were larger (ranging from 1 to 1.5 g) by approximately twofold and may have poor vascularization and more necrosis. Further statistical analysis to establish the relationship between tumor size and [ 18 F]FDG uptake showed that [ 18 F]FDG uptake was not affected by the larger tumor size, but [ 18 F]FDG uptake values in individual tumors of similar weight were variable by as much as 2.5-fold (Fig. 3C).
Biodistribution data were only collected at the PO time point from a separate cohort of mice, therefore comparisons of tumor uptake of the treated groups were made with the control group, in which the average tumor size tended to be larger (Fig. 3D). The biodistribution data were not completely comparable with imaging data, but showed similar trends. In the biodistribution, the muscle uptake data were collected from a different location (nontumor-bearing leg) than imaging, which would affect the T:M ratio value.
Since the tumors were taken from different mice in the biodistribution cohort, the inherent variability in the tracer uptake of individual tumors may have precluded the ability to achieve the same statistical significance, which may have been possible in imaging studies conducted with a repeated measure in the same tumor.
[ 18 F]FLT PET imaging and biodistribution
The average of PR [ 18 F]FLT SUVmean was 2.51 ± 0.53 (n = 40) with a T:M ratio of 5.20 (images shown in Fig. 4A). The [ 18 F]FLT tumor uptake in the vehicle PO group was decreased compared with its PR group, which seemed to result from the larger tumor size (1 to 1.5 g) at PO (Fig. 4B, C). This decrease in [ 18 F]FLT uptake in the larger tumors may be due to differences in the vascularity of certain tumor regions, resulting in the heterogeneous signal observed in the images (Fig. 4A).
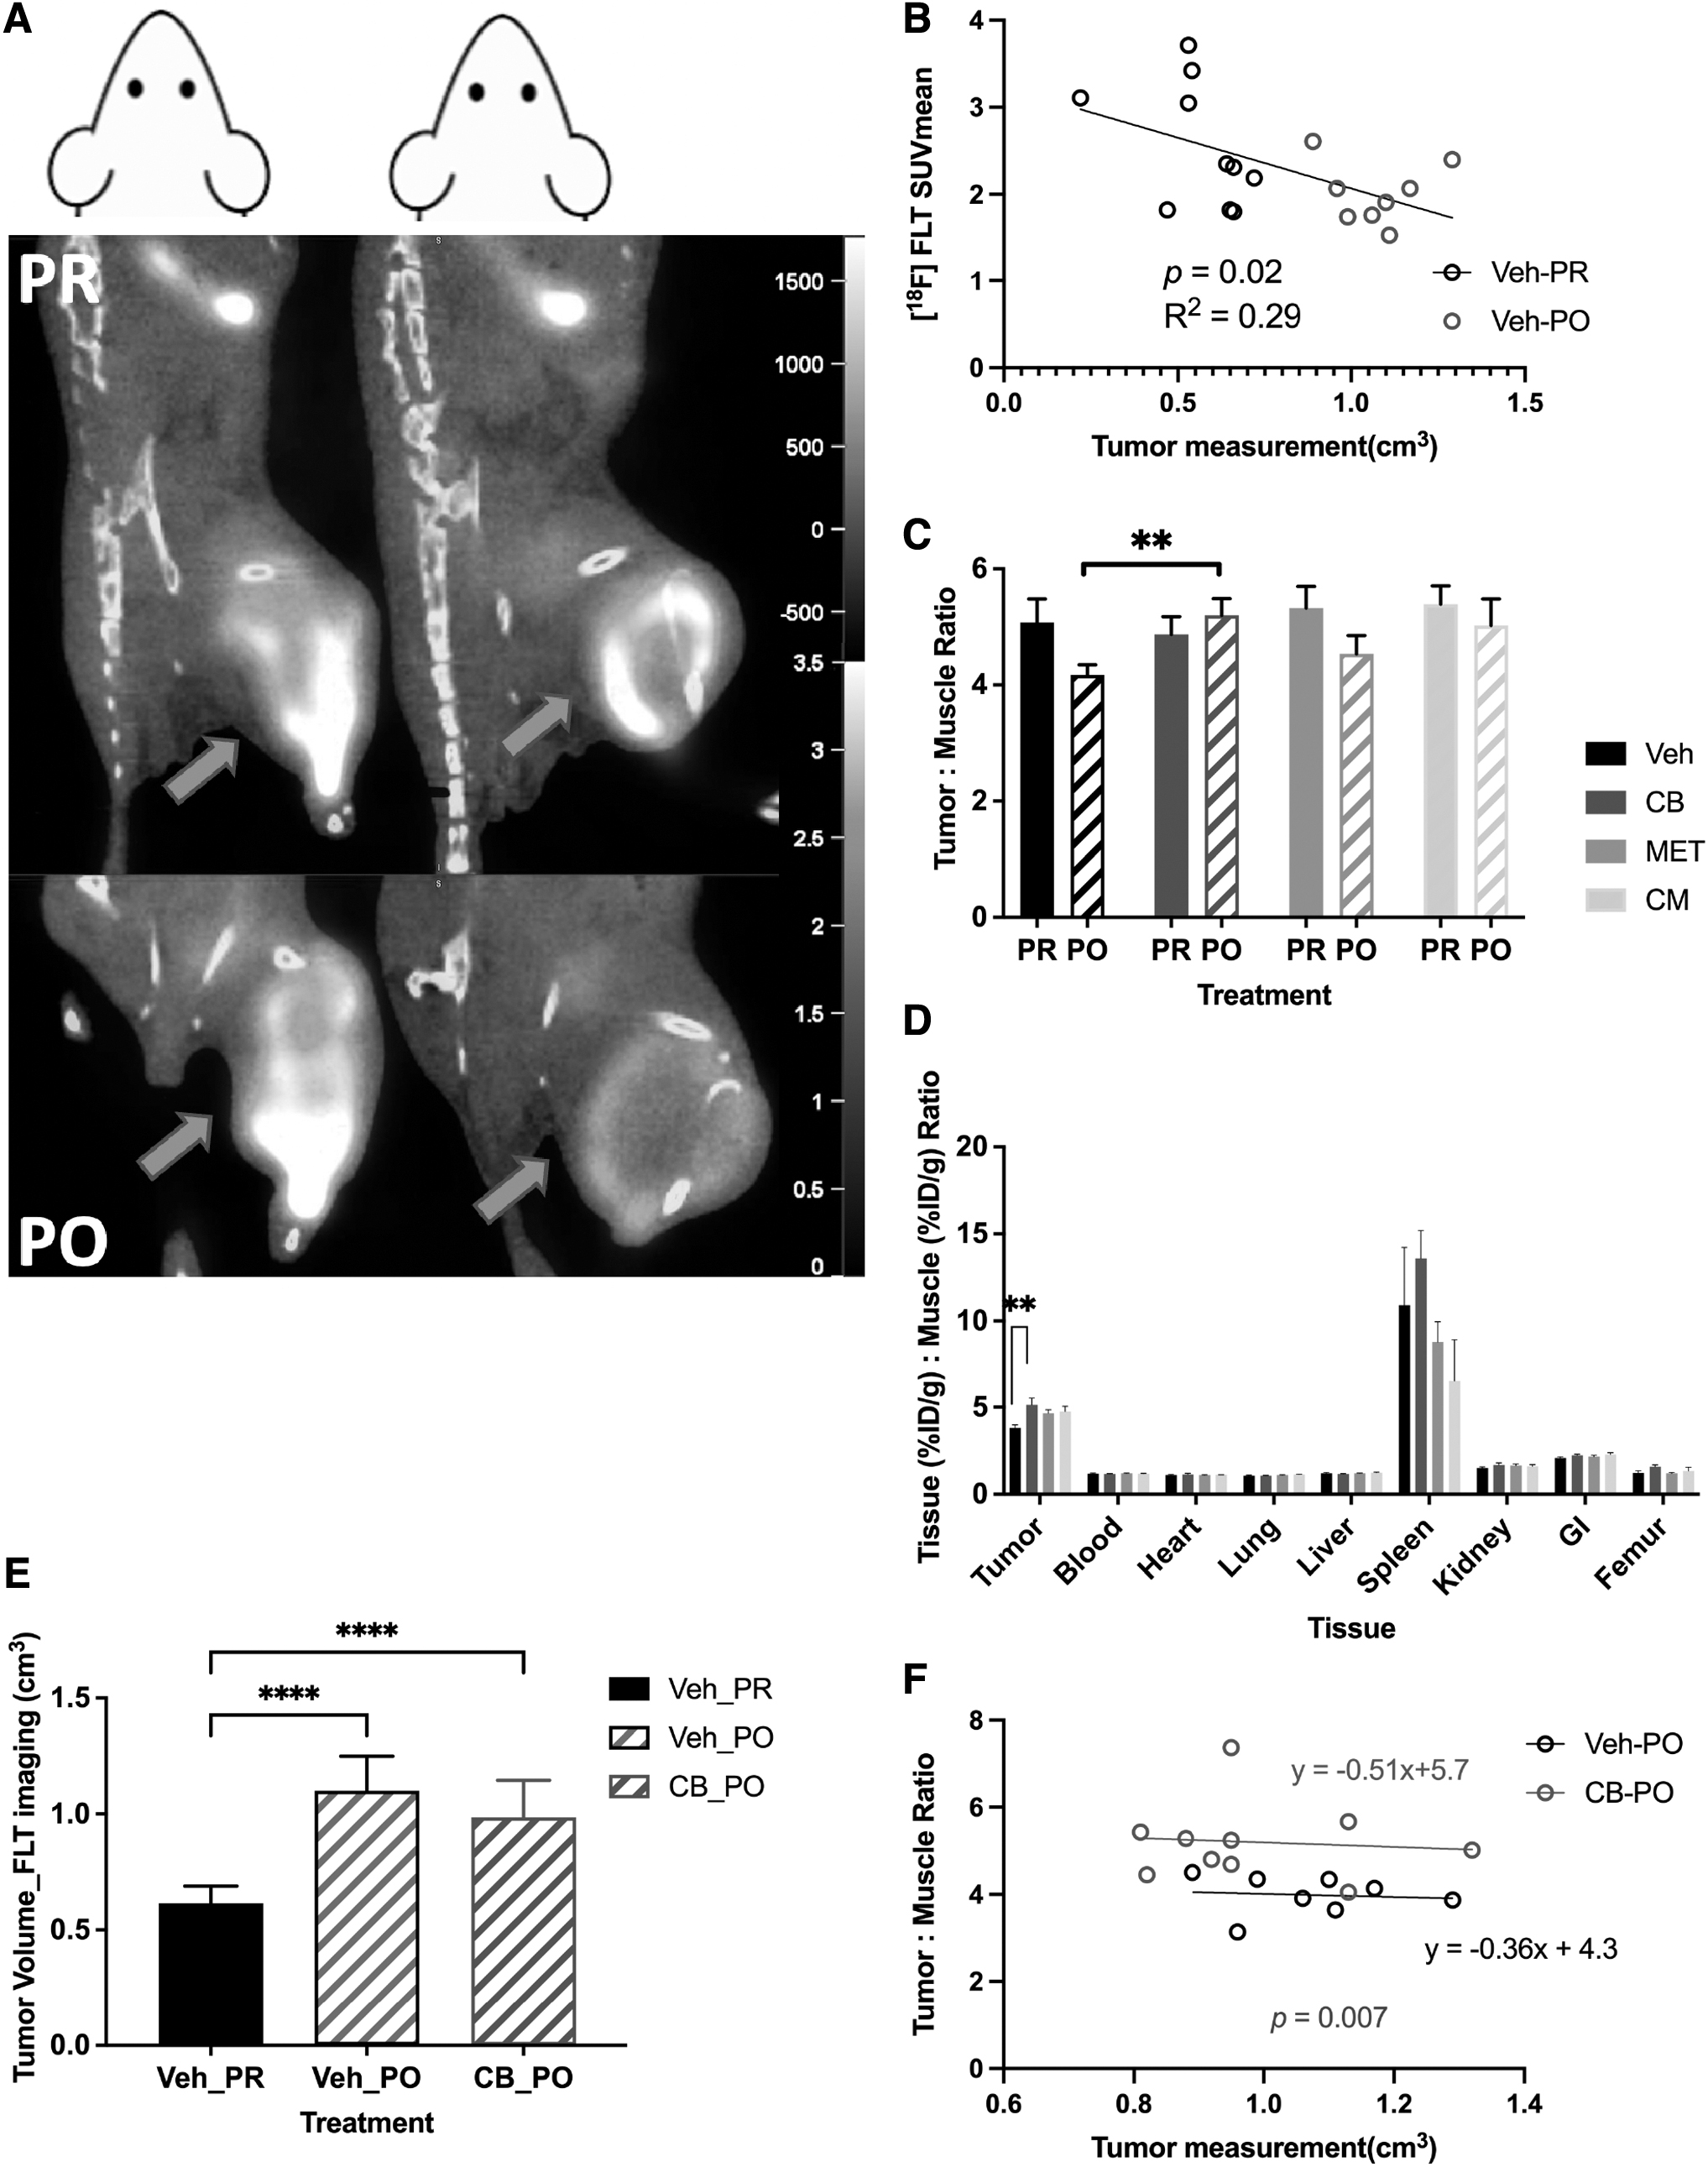
Imaging and biodistribution data of [ 18 F]FLT.
This finding helps explain the decreasing trend of the T:M ratio seen in the vehicle and metformin PO groups compared with their respective PR groups, although the telaglenastat PO tended to increase (Fig. 4C). Moreover, the T:M ratio in the telaglenastat PO group increased by 25% (p = 0.007) compared with the vehicle PO group, which was similar to the increase observed in the telaglenastat PO group of the biodistribution (p = 0.008) (Fig. 4D), while tumor volumes in these two groups were rather similar (Fig. 4E).
Regarding the correlation between tumor volume and the T:M ratio, although the vehicle PO and telaglenastat PO presented similar slopes, the intercept for the latter was significantly higher (p = 0.007) (Fig. 4F). This result suggests that the difference between vehicle PO and telaglenastat PO was significantly affected by tumor size. A tumor from the telaglenastat PO group would likely demonstrate a higher uptake than a tumor of equivalent size from the vehicle PO group.
Other nontarget tissue uptake values with biodistribution were similar across the four groups, except for the wide variability in the high uptake observed for the spleen, which might be due to active immune cell proliferation (Fig. 4D). 30 –32
[ 18 F]GLN PET imaging and biodistribution
The average of PR [ 18 F]GLN SUVmean was 0.86 ± 0.08 (n = 40) for tumors, whereas it was 0.42 ± 0.07 for muscles (images shown in Fig. 5A). Blood, tumor, and nontarget tissue uptake values (%ID/g) from the biodistribution were increased with telaglenastat therapy compared with their respective control values (Fig. 5B). Therefore, the heart was chosen to represent blood as a reference tissue for both imaging and biodistribution to adjust for input differences.
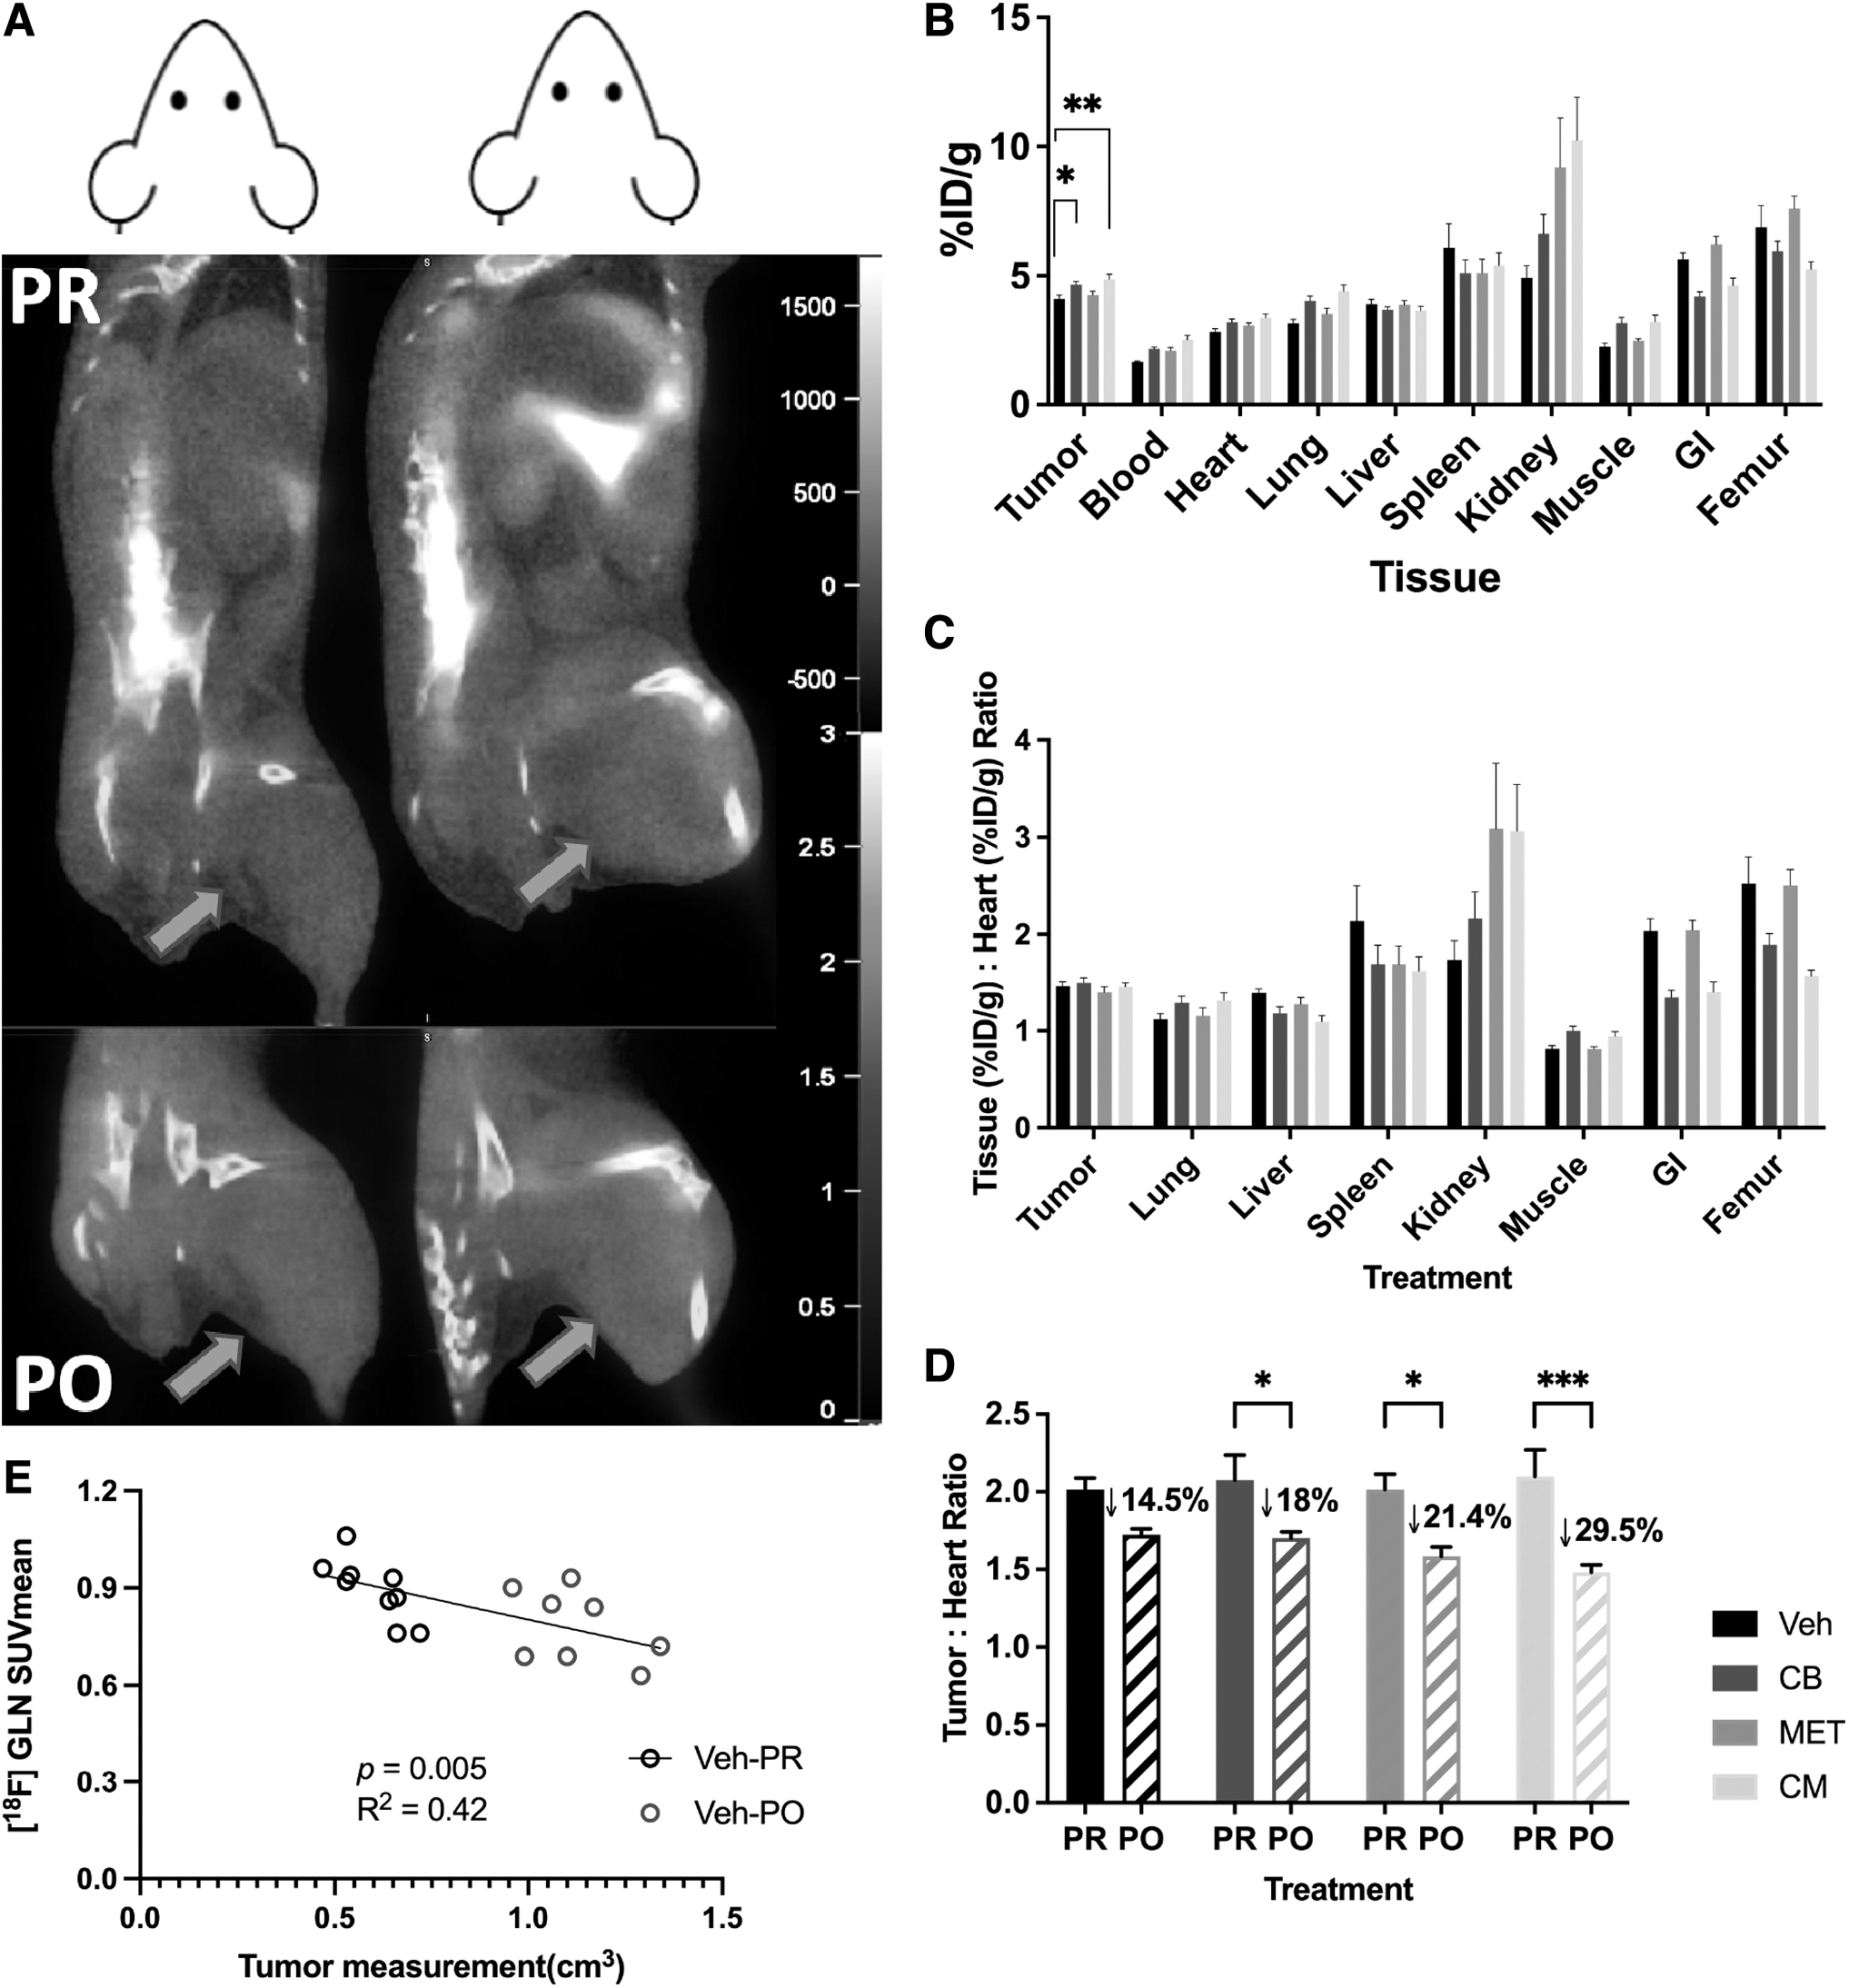
Imaging and biodistribution data of [ 18 F]GLN.
For biodistribution studies, the tumor:heart ratios of the control group were not significantly different from the treated groups (Fig. 5C). Compared with PR imaging data, [ 18 F]GLN was significantly decreased by 18%–30% after all treatments (Fig. 5D). This may be partially due to poor tumor vascularity and the onset of necrosis in larger tumors since [ 18 F]GLN uptake seemed to be affected by tumor size (Fig. 5E).
Discussion
Noninvasive PD imaging techniques that are clinically deployable are highly valued during anticancer drug trials, provided that the imaging reporters provide a valid measure of the drug's biological effect in tumor and normal tissues. 33 This is particularly critical in pediatric patients who often cannot undergo serial tumor biopsies to confirm therapeutic responses. In these patients, a validated imaging reporter could provide in vivo proof of mechanism and response data before anatomic changes in solid tumors.
Ideally, the agent can be assessed in both preclinical and clinical platforms and show translational value across species. 34 In the present study, a panel of clinically deployable PET imaging agents was evaluated to determine the ability of each agent to accurately report distinct metabolic effects of telaglenastat and metformin treatment of mouse OS xenografts by examining imaging agent uptake and tissue biodistribution.
The three PET imaging agents evaluated in this study, [ 18 F]FDG, [ 18 F]GLN, and [ 18 F]FLT, were identified as potential companion imaging agents based on the authors' previous studies of GLS inhibition in tumor growth and metastatic progression. 6 The performance of these three agents is summarized in Table 1.
Summary of PET Imaging Agent Performance in a Preclinical Xenograft Study of Human Osteosarcoma Treatment with Metabolically Targeted Agents, Metformin and Telaglenastat, both Alone and in Combination
[ 18 F]FDG uptake is a widely used, nonspecific molecular imaging technique that plays a clear role in staging OS as it is more sensitive in identifying skeletal and distant bone metastases than bone scintigraphy. 35,36 Some studies also showed that SUVmax, or the ratio between SUVmax at diagnosis and following neoadjuvant chemotherapy, correlates with the histologic response and can serve as a prognostic indicator in OS. 37 –40
In this study, MG63.3 xenografts demonstrated decreased [ 18 F]FDG uptake after one week of treatment with telaglenastat. This is consistent with observations from the authors' previously published data on both cell line and tumor tissue samples, which demonstrated the impact of telaglenastat on glycolysis through reductions in tumor lactate and glucose-derived pyruvate, which occurred after 7 d of combination treatment. 6
Across all three tracers, [ 18 F]FDG showed the most obvious difference in uptake within the combination-treated animals when compared with vehicle control tumors. Given that this is the most widely used oncologic PET tracer, it is reasonable for this to be a starting point for monitoring treatment response for a novel, metabolically targeted treatment strategy.
The discrepancies between imaging and biodistribution data for [ 18 F]FDG are largely attributable to the poor avidity of the xenograft model of OS for [ 18 F]FDG and lack of paired imaging data from the same tumor before and after treatment. These types of data would be readily available in patients where OS is a highly [ 18 F]FDG-avid tumor type. The increase, compared with control, in %ID/g in mice receiving only metformin is somewhat expected given metformin's mechanism of action and is not indicative of an antitumor effect.
[ 18 F]FLT was introduced as a noninvasive marker to visualize proliferation within tissues. Although its tumor-to-normal tissue ratio is generally lower than [ 18 F]FDG in most cancers outside the brain, 41 –43 the selectivity for neoplasms is better. 44 In this study, [ 18 F]FLT provided improved tumor delineation for this nonglucose-avid OS tumor model, compared with other imaging agents, and generated tumor volume readout more accurately than caliper measurements.
[ 18 F]FLT is phosphorylated by cytosolic TK1 and this activity peaks in the S phase, 45 –47 controlling the entry of nucleotides into the DNA salvage biosynthesis pathway. 9,48 The effectiveness of [ 18 F]FLT as a cell proliferation marker could be influenced by the relative contributions of the salvage versus de novo pathways. 42,49 –51 A so-called flare response, indicated by an increase in [ 18 F]FLT uptake, may be seen when a drug inhibits the other arm, the de novo pathway. 52
The authors' previous metabolic profiling of tumor tissue revealed that the downstream metabolite, aspartate, was also reduced after telaglenastat treatment, which is a key oxidized precursor for both purines and pyrimidines within the de novo pathway. Thus, the difference observed between vehicle PO and telaglenastat PO groups is likely reflective of a telaglenastat-induced flare effect, which has also been observed with 5-fluorouracil, 53,54 methotrexate, 54 capecitabine, 55 and BGC 945 (α-folate receptor-targeted antifolate thymidylate synthase inhibitor). 56
[ 18 F]GLN was developed as a PET tracer for mapping glutaminolytic tumors. Rapid selective uptake is mediated by ASCT2 [SLC1A5 gene] and remains consistent over 2 h with a slow washout rate. 57 Meanwhile, the reversibility of [ 18 F]GLN uptake has also been reported and that [ 18 F]GLN competes with the native, unlabeled GLN pool for efflux. Cells with low GLS1 activity, or under GLS1 suppression, or an original, large, native GLN pool (e.g., muscle with GLN representing about 40%–60% of the total amino acid pool 58 ) could lead to higher retention of administered [ 18 F]GLN. 17,59
According to the literature, telaglenastat does not inhibit the uptake of available [ 18 F]GLN, but can affect intracellular retention due to increase of the native, unlabeled GLN pool available for efflux. 17,59 Theoretically, this study expected to see increased [ 18 F]GLN uptake with telaglenastat treatment. Unfortunately, the increase was widely observed across tissues and organs, instead of being tumor specific. After adjusting the input influence, [ 18 F]GLN did not show any advantage in detecting a drug effect. Still, it is possible that kinetic studies, rather than single-time point SUVs, would be more informative in this context. 17,60
Ongoing development and validation of noninvasive molecular imaging reporters are particularly relevant in OS. It has been shown that standard Response Evaluation Criteria in Solid Tumors (RECIST) criteria applied to primary bone OS patients are a poor surrogate endpoint for survival. 61 This is mainly due to primary lesion calcification and location within the bone, for which anatomical changes, as assessed by radiographic or tomographic measures during therapy, are not readily detected.
It remains possible that RECIST is a better marker of response in a tissue-specific context, specifically for patients presenting with relapsed/refractory soft-tissue lesions in the lung or other organs. However, in both bone and pulmonary settings, a noninvasive imaging reporter that can provide valid evidence of a drug's PD response would have correlative value in clinical trials of novel agents.
[ 18 F]GLN PET/CT could be explored as a PD imaging tool in human OS patients undergoing telaglenastat therapy, but should be explored in the context of kinetic tracer studies rather than static time point uptake studies.
Conclusions
Although this study was not designed to determine which imaging agent(s) were predictive of drug responses, as assessed by anatomical changes in tumor growth, these data support the clinical translation of PET imaging as a noninvasive biomarker of PD effect in OS patients. The authors suggest here that [ 18 F]FDG PET is a potential PD imaging tool for patients receiving the novel, small-molecule GLS1 inhibitor, telaglenastat. Additional exploration of kinetic imaging protocols may identify tumor-specific [ 18 F]FLT and [ 18 F]GLN uptake patterns that are indicative of drug response in vivo.
Metabolically targeted anticancer therapies can induce a variety of changes in tumors and normal tissues at the cellular level, which can be detected and quantified with available PET imaging reporters. In this study, the authors showed that [ 18 F]FDG uptake decreased in response to telaglenastat treatment in this mouse model of OS. [ 18 F]FLT imaging data demonstrated a difference between control and telaglenastat-treated groups, which may relate to tumor size and telaglenastat-induced flare effect. Further study of [ 18 F]GLN uptake is warranted to define the optimal method for lesion evaluation given the global impact of telaglenastat across a variety of tissues.
Footnotes
Acknowledgment
The authors wish to thank Calithera Biosciences for providing telaglenastat and vehicle for the animal experiments.
Authors' Contributions
A.K.L., S.H., L.R., and E.M.J. were involved in concept and design. T.E.P., S.A., S.H., L.R., A.K.L., and E.M.J. were involved in development of experimental methodology. S.H., C.O., A.T., T.E.P., M.E.W., J.R., E.M.J., K.W., L.R., A.C., X.Z., and F.B. performed the experiments. S.H., J.A.B., and E.M.J. analyzed the data. A.K.L., S.H., J.A.B., L.R., P.L.C., and E.M.J. were involved in writing and revision of the article. Conceptual advice was provided by A.K.L., P.L.C., and E.M.J.
All coauthors reviewed and approved the article before submission.
Disclaimer
The content of this publication does not necessarily reflect the views or policies of the Department of Health and Human Services, nor does mention of trade names, commercial products, or organizations imply endorsement by the U.S. Government.
Disclosure Statement
The authors declare no conflicts of interest.
Funding Information
This work has been supported by the Intramural Program of the National Cancer Institute, National Institutes of Health, No. ZIA BC 011692. This project was also made possible through federal funds from the National Cancer Institute, National Institutes of Health, under Contract No. HHSN261200800001E and Contract No. 75N9109D00024.