
Abstract
Background:
Amino acid positron emission tomography (PET) imaging plays a significant role in the diagnosis of gliomas and in differentiating tumor recurrence from necrosis. In this study, the authors evaluated the diagnostic efficacy of [99mTc]Tc-methionine single-photon emission computed tomography–computed tomography (SPECT-CT) in comparison with [11C]methionine PET-magnetic resonance imaging (MRI) in delineating tumors.
Methods:
Thirty-one (primary: 16 and postoperative: 15) patients of confirmed (either MRI or histopathological proven) glioma underwent both [99mTc]Tc-methionine SPECT-CT and [11C]methionine PET-MRI. A comparative analysis was performed between SPECT, PET, and MR images to calculate the concordance between the modalities and to evaluate the diagnostic efficacy of the [99mTc]Tc-methionine SPECT.
Results:
[99mTc]Tc-methionine SPECT showed comparable uptake in the tumor lesions in comparison to [11C]methionine PET. A significant and strong positive correlation was observed between the volume of tumor (Vt) in PET and Vt MR (p < 0.004). Likewise, a significant and strong positive correlation was found between Vt SPECT and Vt MR. [99mTc]-methionine has a sensitivity and specificity of 91% and 75%, respectively, compared with 82% and 100% for [11C]methionine in postoperative cases to differentiate the tumor recurrence from necrosis. The sensitivity and specificity of [99mTc]Tc-methionine was 92% and 100%, respectively, compared with 92% and 67% for [11C]methionine in primary tumors.
Conclusion:
[99mTc]Tc-methionine SPECT-CT is as equally good as [11C]methionine for diagnosing and differentiating it from necrosis especially in high-grade glioma.
Introduction
Positron emission tomography (PET) plays an important role in the management of cancer. It plays a decisive role in the diagnosis, staging, monitoring treatment response, and image-guided therapy planning.
1
–4
[
18
F]fluoro-2-deoxy-2-
The AA tracers, such as
Even though the PET has revolutionized the management of cancer, in developing countries, there are a greater number of single-photon emission computed tomography–computed tomography (SPECT-CT) scanners because of its cost-effectiveness. Citing the utility of amino acid-based tracers, Mishra and colleagues had developed single-vial (ready to label with 99mTc) formulation of methionine {[99mTc]Tc-Bis-methionine-DTPA ([99mTc]Tc-methionine)} for SPECT imaging. 15 The clinical trials have been performed in patients by Kumar and colleagues and Singh et al. Singh et al. evaluated the detection efficacy of [99mTc]Tc-methionine in 28 patients with glioma and compared with contrast-enhanced magnetic resonance imaging (MRI) data. They concluded that combining both studies may improve the diagnosis. 16,17
Kumar and colleagues enrolled 44 patients with glioma and compared the efficacy of [99mTc]Tc-methionine with [ 18 F]FDG and MRI. They found that [99mTc]Tc-methionine is a promising and affordable tool for developing countries. The advancement in the medical imaging has improved the diagnosis and characterization of the tumor. 18 Nagaraj and colleagues reported the diagnostic efficacy of [ 11 C]methionine PET-MR in diagnosing the tumor recurrence in post-treatment glioma patients. 19 In the present study, the authors have performed a head-to-head comparison of [99mTc]Tc-methionine SPECT-CT with [ 11 C]methionine PET-MR scan in primary and postoperative glioma patients.
Materials and Methods
General
The precursor
[ 11 C]methionine radiosynthesis
1.5 ± 0.2 Ci of gaseous [
11
C]carbon dioxide (CO2) was pushed into the conditioned methane trap of Tracerlab FX2N radiochemistry module (GE Healthcare, Chicago, IL). [
11
C]CO2 reacted with hydrogen gas at 350°C in the presence of a nickel catalyst to produce [
11
C]CH4. [
11
C]CH4 was first trapped onto a carbosphere trap column and then released to undergo iodination at 740°C to produce [
11
C]CH3I. [
11
C]CH3I was cycled into a loop till it reached up to a plateau concentration. Finally, [
11
C]CH3I was released over the unconditioned C18 Sep-Pak Plus Cartridge containing precursor
[99mTc]Tc-methionine radiosynthesis
740 ± 20 MBq of freshly eluted 99mTc pertechnetate was added to ready to use lyophilized bis-methionine-diethylenetriaminepentaacetic acid [DTPA-bis(Met)] vial and incubated at room temperature for 30 min. After 30 min, the radiochemical purity was tested by thin layer chromatography using acetone as a solvent. The final preparation was passed through 0.2 μm filter for human injection formulation.
Patients
The study was conducted at the MR-PET Center, Department of Neuroimaging and Interventional Radiology (NIIR), National Institute of Mental Health and Neurosciences (NIMHANS). A total of 38 patients from December 2019 to 2022 were enrolled in this study after obtaining written informed consent. The patients underwent [ 11 C]methionine PET-MRI, followed by [99mTc]Tc-methionine SPECT-CT imaging within a period of 2.3 ± 0.5 d. The inclusion criteria included the absence of any severe comorbidities and ability to cooperate in the study as two subsequent scans were acquired within a span of 2–3 d. Among the group of 31 patients, 15 patients (11 males and 4 females, with mean age of 39.9 ± 13.2 years) had undergone primary tumor excision, followed by chemotherapy/radiotherapy.
The images were analyzed to differentiate between tumor recurrence and radiation necrosis. The mean interval between the surgery and PET/SPECT scans was around 6.0 ± 0.2 months. The other 16 patients (8 males and 8 females, with mean age of 36.4 ± 15.1 years) who were clinically and radiologically diagnosed with primary glioma were included, and they underwent PET and SPECT scans to assess the primary tumor. Seven patients were excluded from the study as they could not complete both the scans. Overall, a total of 62 scans (31 PET scans, 31 SPECT scans) along with 31 MRIs were evaluated in this study. In postoperative gliomas, a final diagnosis of tumor recurrence and radiation necrosis was confirmed through histopathologic examination of the tumor resected out during the surgery.
The 16 patients (8 males and 8 females, with mean age of 36.4 ± 15.1 years) were diagnosed with primary glioma through MRI scan at the time of enrollment in this study and followed up with histopathology findings and MRI. The final diagnosis of low-grade and high-grade tumors was confirmed by following up with the patient's tumor histopathology report on the day of surgery. For a total of 16 primary glioma cases, the mean interval between the PET/SPECT scans and the surgery was around 9 ± 0.5 months. Table 1 summarizes the patient enrollment in the research study.
The Enrollment of the Patients
HCG, human chorionic gonadotropin.
PET-magnetic resonance imaging
The patients were asked to fast (4–6 h) to ensure stable basal metabolic conditions. All the patients were screened for any metallic object or any allergy to radiopharmaceuticals. The patients were positioned on the scanner table with an eight-channel head coil and secured intravenous (i.v.) line. All the patients underwent dynamic simultaneous PET/MRI. The scout images were acquired, followed by 170 ± 20 MBq of the [ 11 C]methionine injected intravenously and flushed with 20 mL normal saline as a slow i.v. bolus. The dynamic scan was acquired in the LIST mode, over 90 min with standard and advance imaging MRI sequences (such as T2 FLAIR MR sequence and T1 MPRAGE). Ultrashort time echo (UTE) sequence was used to generate the attenuation maps. The attenuation-corrected images were split/reframed into [(10 frame × 30 s) + (10 frame × 60 s) + (15 frame × 300 s) = 5400 s (90 min)].
SPECT-CT imaging
Imaging was performed using dual-head gamma camera SPECT/CT (Symbia T6, Germany) equipped with low-energy high-resolution (LEHR) collimator in the supine position, with the fixed head using a head holder. Along with SPECT, the CT was acquired to localize the anatomical details of the brain. Imaging acquisition was performed in the matrix size of 128 × 128, zoom of 1.00, and 360° arcs with 64 projections and 30 s per projection. Images were reconstructed using FLASH 3D (8 iterations, 8 subsets and 6 iterations, 16 subsets) by Gaussian filter with full-width at half maximum (FWHM) of 8 mm. Briefly, 555–740 MBq of freshly prepared [99mTc]Tc-methionine was injected intravenously. After 2 h of injection, the patients were placed in the supine position on the imaging table, and static images were acquired over 180° rotation in 128 × 128 matrix with zoom of 1.23.
Image analysis
The scans were interpreted separately by two experienced nuclear medicine physicians and neuroradiologists. For the analysis, images were processed using the OsiriX MD software (Pixmeo SARL, Switzerland). For PET images, activity counts were normalized to standardized uptake value (SUV). The mean SUV (SUVmean) and the maximum SUV (SUVmax) were calculated over the volume of interest (VOI). The mean lesion-to-normal tissue ratio (L/Nmean) was calculated by dividing the SUVmean of the lesion volume by the SUVmean of the contralateral normal tissue region. Similarly, the maximum lesion-to-normal tissue ratio (L/Nmax) was calculated. For SPECT images, the mean tumor-to-normal tissue ratio (T/NTmean) was calculated by dividing the mean activity counts of the lesion volume by the mean activity counts of the contralateral normal tissue region. Similarly, the maximum tumor-to-normal tissue ratio (T/NTmax) was calculated. The total volume of the tumor was generated for PET and SPECT images. The images were compared using visual analysis.
For calculating the Dice coefficient, both the SPECT and PET raw DICOM images for each individual subject were converted to the NIFTI format, and SUV volumes for PET were extracted through PET DICOM Extension plugin in the 3D-Slicer software. These volumes were then co-registered to the structural volume (T2-FLAIR, T2 or T1 MPRAGE) using the “co-register” module of SPM12. Semi-automatic tumor segmentation was performed on the structural volume using the 3D-Slicer, and the masks were further refined with assistance from an experienced neuroradiologist using the ITK-Snap software. In the postoperative patients, the tumor cavity and necrotic regions were carefully excluded. A contralateral spherical region of interest of uniform size was also defined on the structural image, placed within a region that showed minimal uptake in both the modalities.
Referring to the previous literature, the regions of maximal uptake were defined as voxels that showed a tumor-to-background ratio (TBR) of >1.3 on the PET images and >1.5 on the SPECT images. These regions were delineated within the tumor masks defined on the structural image and binarized to form separate PET and SPECT tumor masks. The volumes of these masks were also computed. FSL tools were employed to perform these operations. Finally, the extent of spatial overlap between the PET and SPECT tumor masks was quantified by computing their Dice coefficient. The Dice coefficient between two regions A and B is defined as twice the area intersecting A and B divided by the sum of their respective areas (
Histopathological analysis
The standard histological stains were done to evaluate the isocitrate dehydrogenase 1 (IDH-1) wild or mutant status and Mindbomb E3 ubiquitin protein ligase 1 (MIB-1) status for the patients operated at the NIMHANS (n = 9).
Statistical analyses
All the statistical analyses were performed using the Jamovi software, version 2.2.5. The Mann–Whitney nonparametric test was used to determine the level of significance for each index (T/NTmean, T/NTmax, SUVmean, SUVmax, L/Nmean, and L/Nmax) in differentiating the tumor recurrence from radiation necrosis. The p-value was calculated for alternative hypothesis Hα: μnecrosis < μrecurrence, where “μ” is the mean for the respective groups. Similarly, the test was also used to check the level of significance for each index in differentiating low-grade gliomas from high-grade gliomas. The p-value was calculated for alternative hypothesis Hα: μLGG < μHGG. Significance was defined as a p-value of <0.05. The receiver operating characteristic (ROC) curve was used to determine the optimal cutoff values for diagnosing recurrence, necrosis, low grade glioma (LGG), and high grade glioma (HGG) with best possible sensitivity and specificity. The statistical analysis of association was tested hypothesizing Hα: μPFS < μAWD.
Results
Radiopharmaceuticals
The radiochemical purity of [99mTc]Tc-methionine and [ 11 C]methionine was >95% and injected only after passing the required quality control parameters, as reported previously. 20
Patient characteristics
Patient demographics are summarized in Supplementary Table S1. A total of 31 patients were enrolled for both the scans and analysis. The mean age of patients was 37.0 ± 14.8 years. The primary glioma patients' scans were carried out after the confirmation of the diagnosis either through MRI or by pathology report. The postoperative patients were enrolled within 6 months or at the end of primary treatment.
PET and SPECT indices
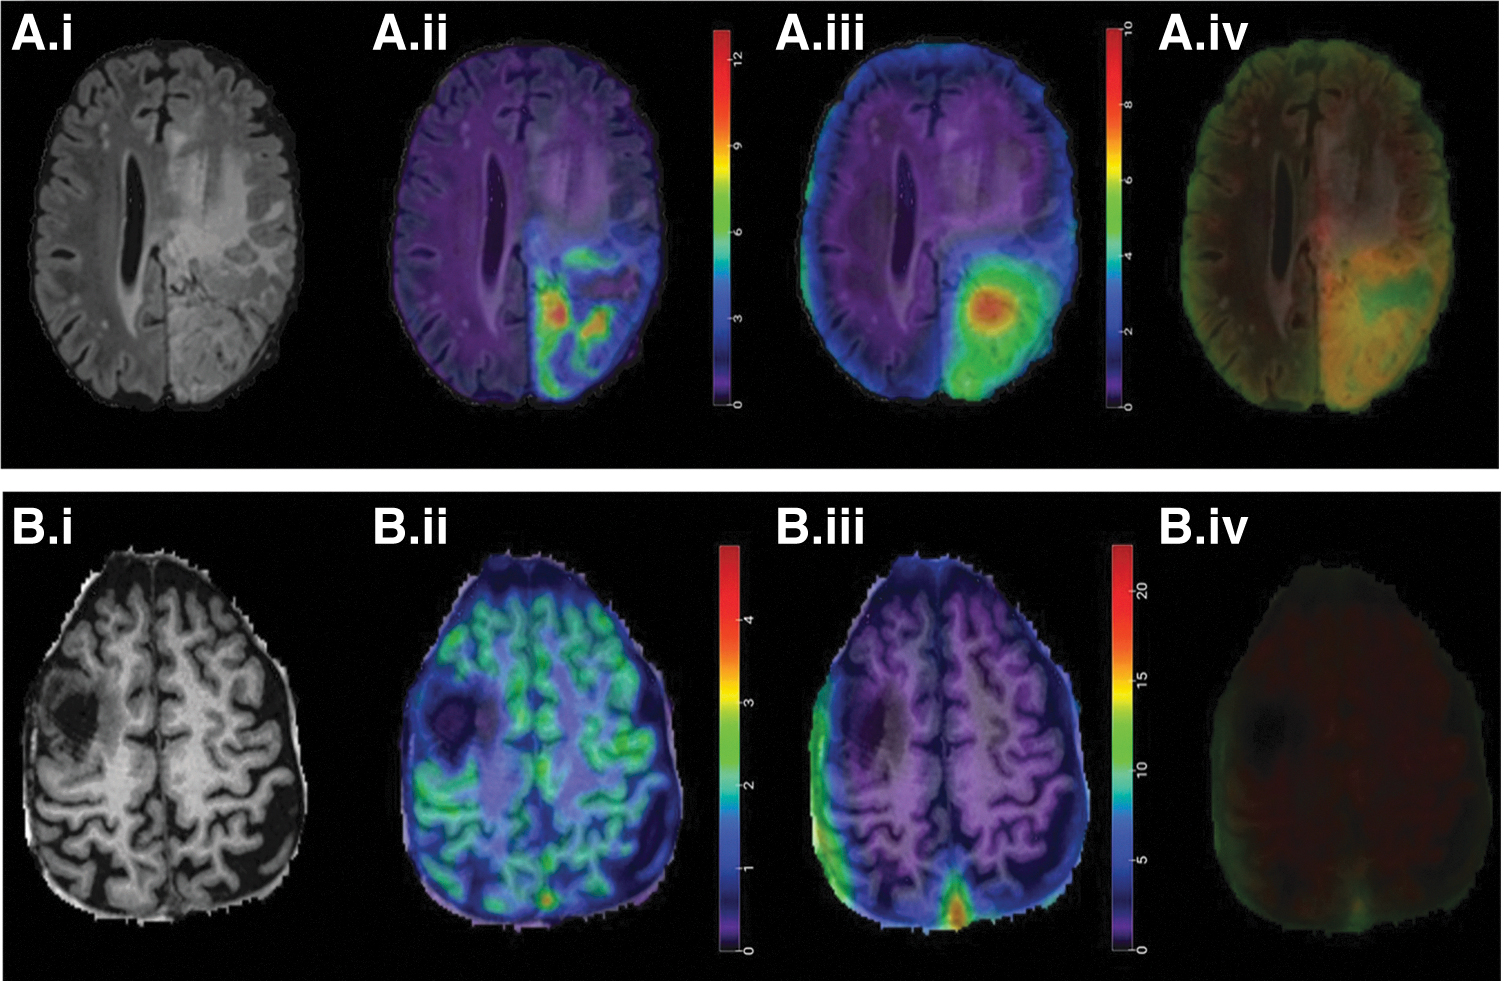
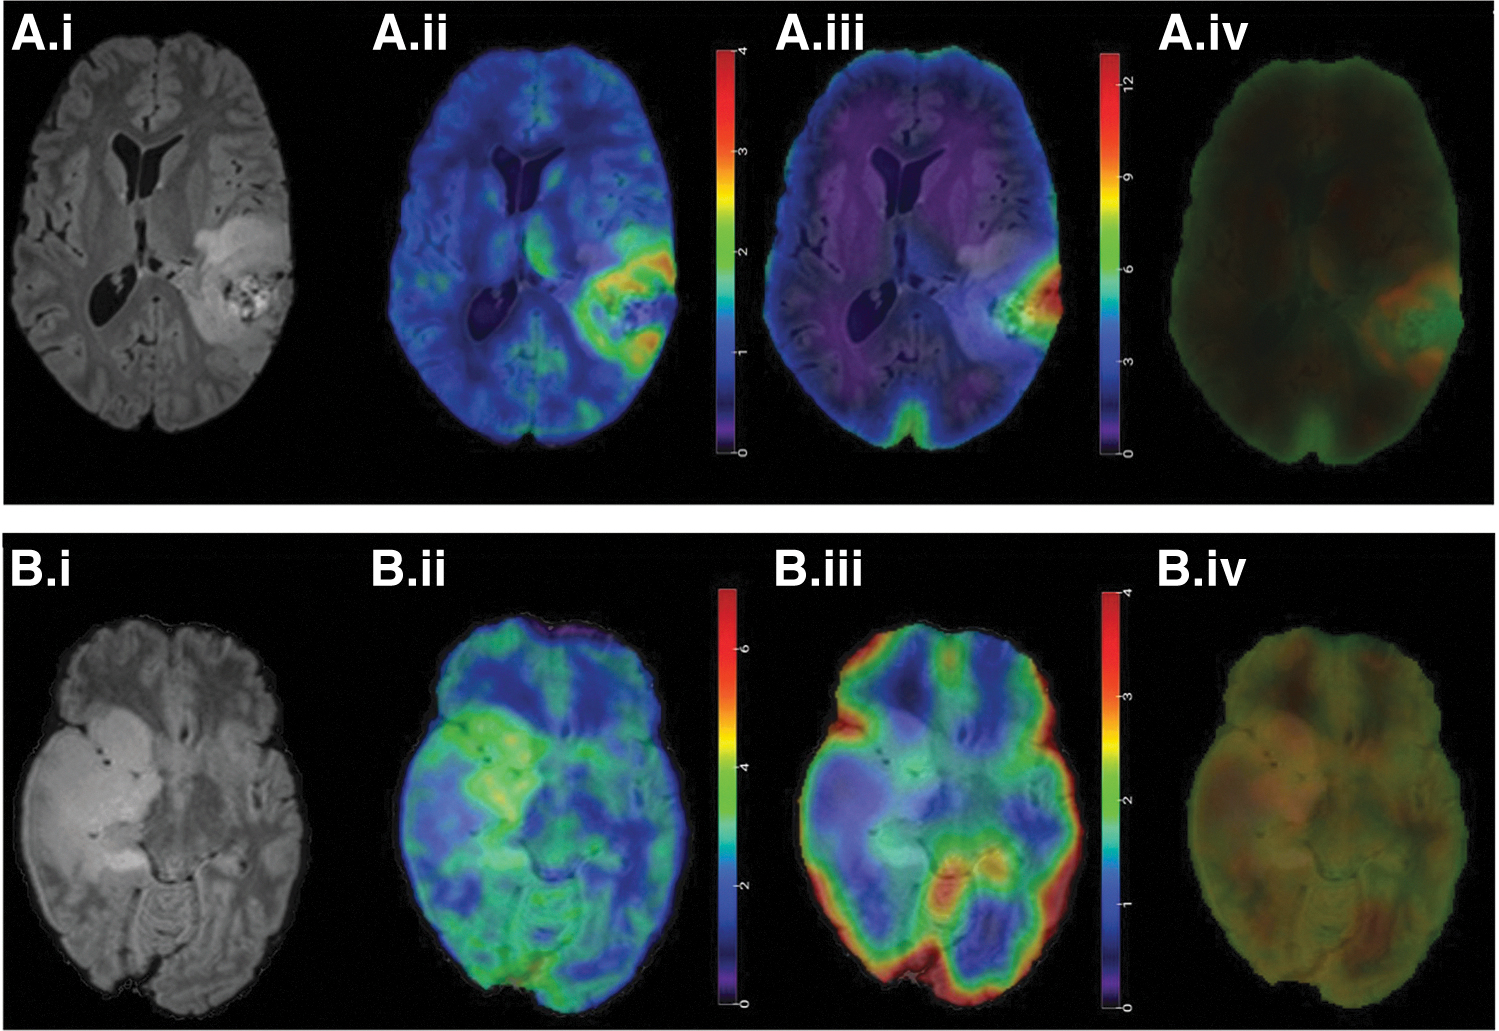
Figure 1A shows the uptake of [ 11 C]methionine in recurrent tumor (histopathological proven), and [99mTc]Tc-methionine showed similar pattern of uptake in the lesion area. Both PET (SUVmean = 4.72) and SPECT (T/NTmean = 5.47) demonstrated the tumor recurrence corresponding to the pathological confirmation after the second surgery. Both [ 11 C]methionine and [99mTc]Tc-methionine showed no or minimal uptake in the necrotic lesion area (Fig. 1B). Figure 2A shows a case of primary tumor where [ 11 C]methionine PET showed higher uptake in the left temporoparietal region. Both PET and SPECT showed concordance in a high-grade tumor area. The uptake of [ 11 C]methionine and [99mTc]Tc-methionine in low-grade gliomas showed uptake with low SUV and T/NT ratio (Fig. 2B).
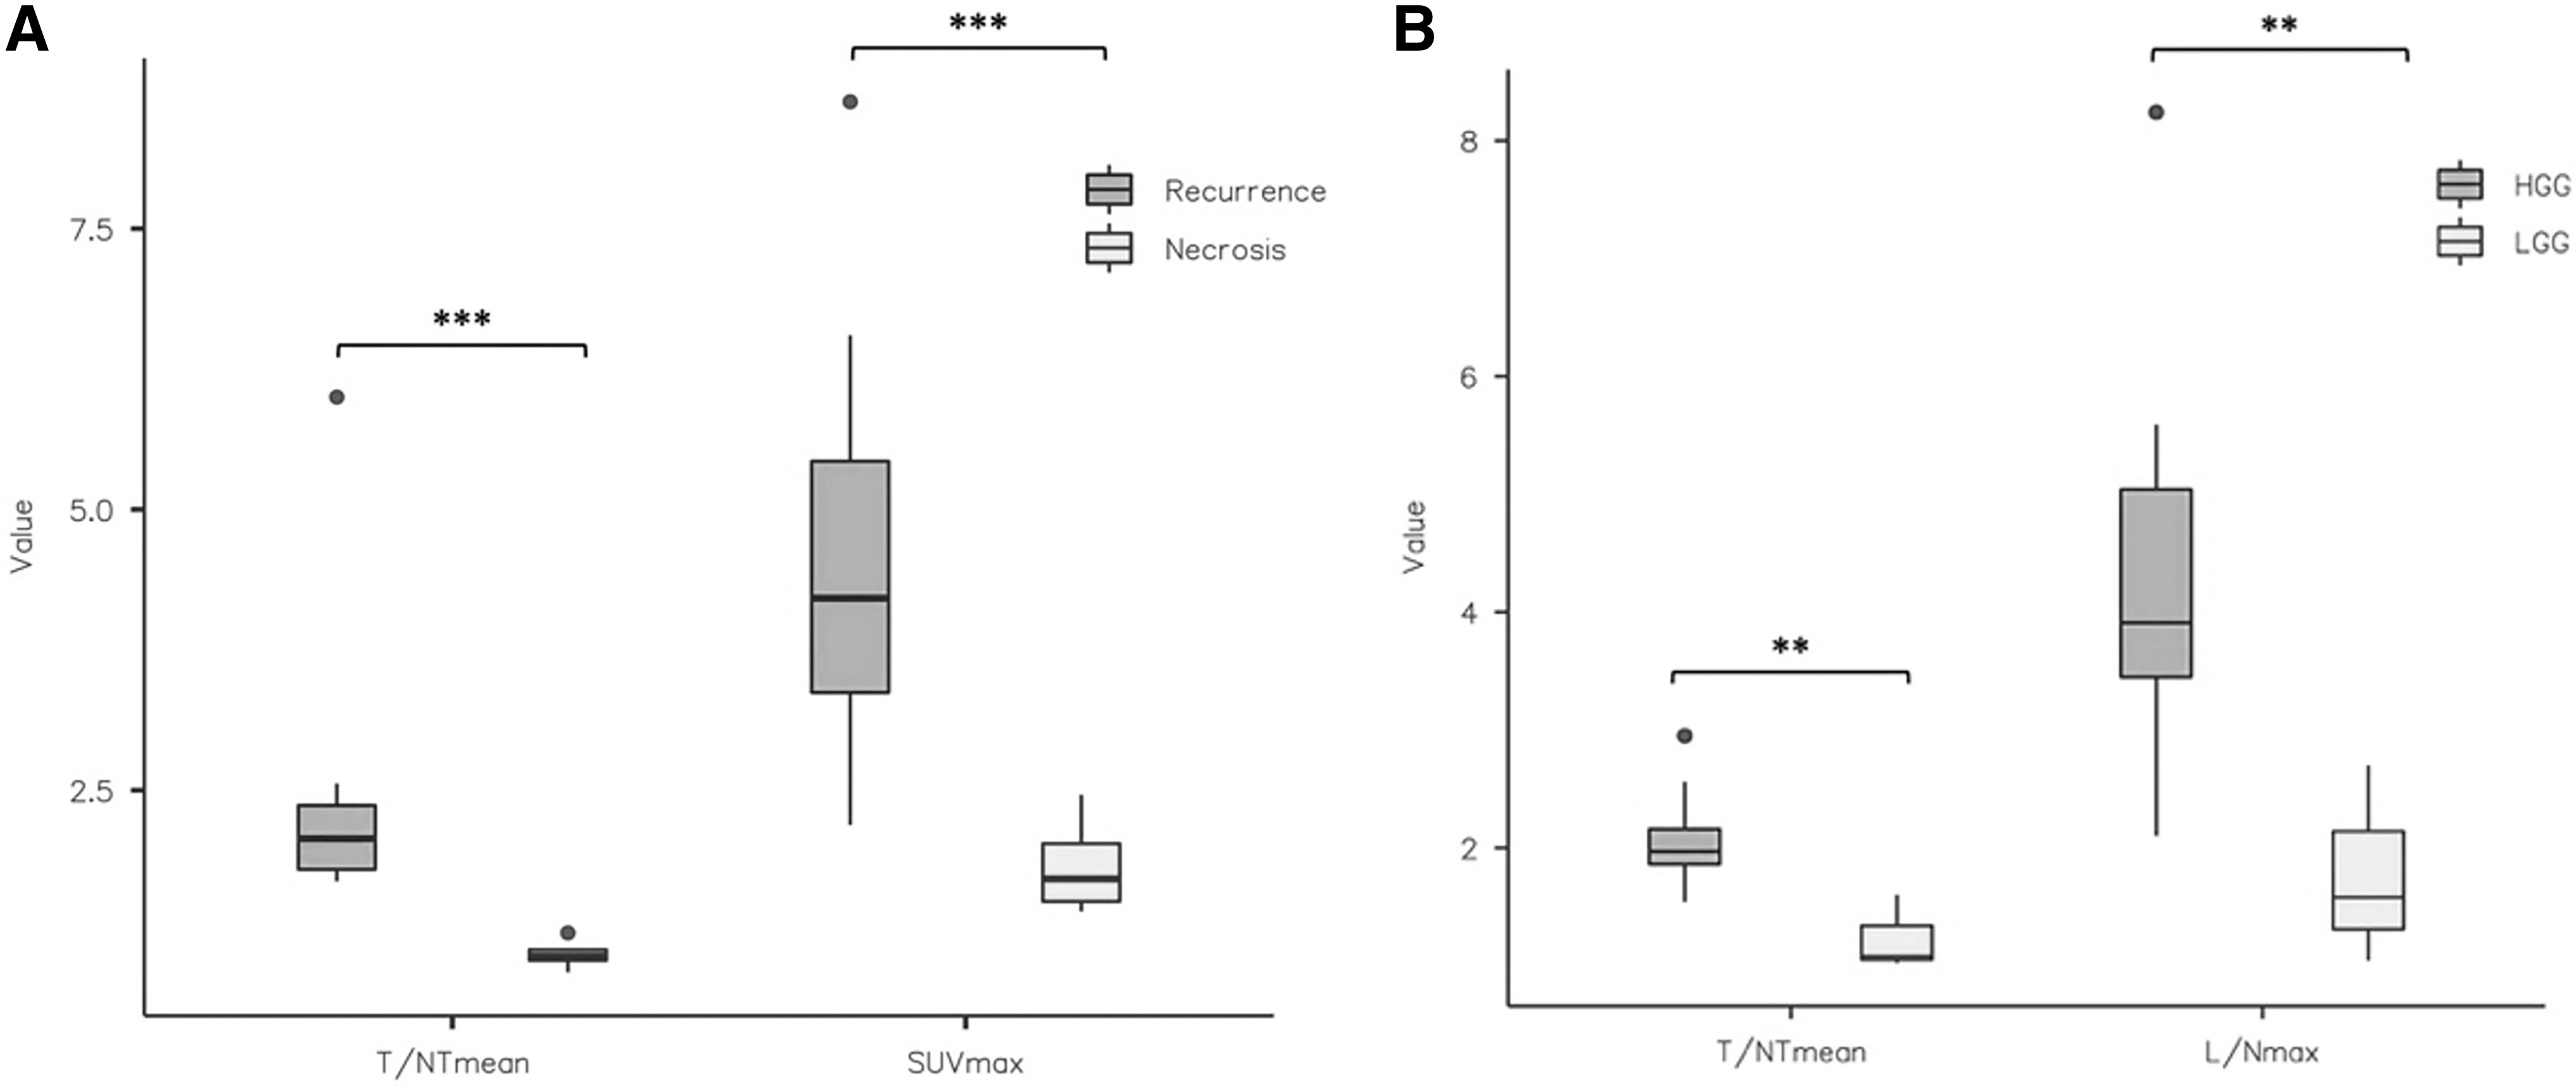
For all the images, various indices were calculated and compared. The PET and SPECT indices were compared using the Mann–Whitney nonparametric test. With respect to postoperative gliomas, all the indices were able to discriminate tumor recurrence from radiation necrosis (p < 0.05 for T/NTmean, T/NTmax, L/Nmean, SUVmax, and L/Nmax, except for SUVmean, p = 0.089). Likewise, with respect to primary gliomas, all the indices significantly discriminated low-grade gliomas from high-grade gliomas (p < 0.05), except for L/Nmean (p = 0.067). Figure 3 shows the box and whisker plots for T/NTmean and SUVmax to compare their statistical range in case of recurrence and necrosis as well as low-grade and high-grade gliomas.
ROC curve analysis
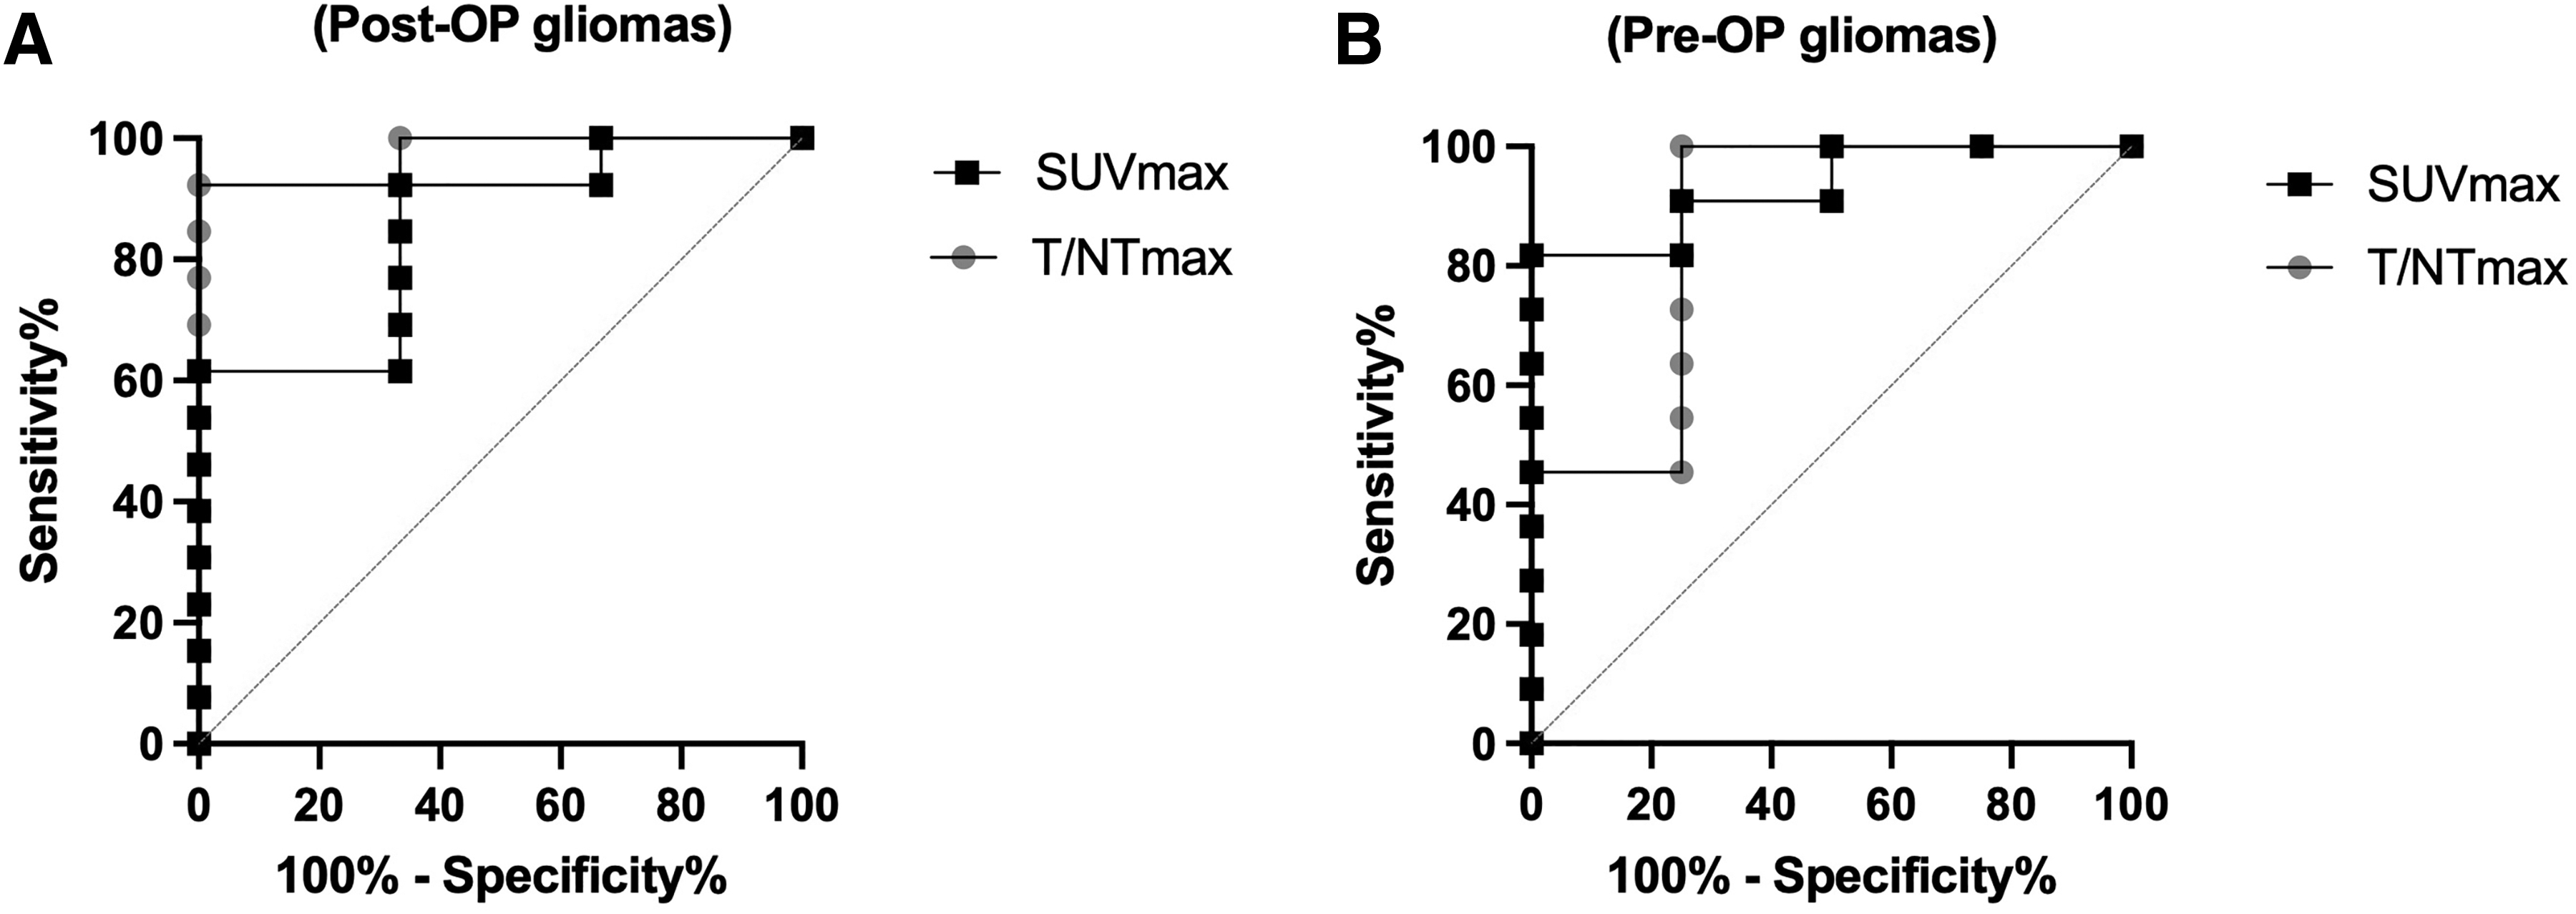
As shown in Figure 4, the ROC curves were plotted separately for preoperative and postoperative gliomas considering each index (T/NTmean, T/NTmax, SUVmean, SUVmax, L/Nmean, and L/Nmax). The area under the ROC curve (Az) for postoperative gliomas was 0.937 for T/NTmean, 0.812 for T/NTmax, 0.937 for L/Nmean, 0.937 for L/Nmax, 0.75 for SUVmean, and 0.1 for SUVmax. The Az for preoperative gliomas was 0.812 for T/NTmean, 0.75 for T/NTmax, 0.92 for L/Nmean, 0.96 for L/Nmax, 0.96 for SUVmean, and 0.1 for SUVmax. These data indicate (Supplementary Table S2) that the SUVmax is the most sensitive and specific index for the differential diagnosis of tumor recurrence and radiation necrosis as well as for low-grade and high-grade gliomas.
The indices (T/NTmean, SUVmax) were compared with clinical response in postoperative gliomas. The T/NTmean index was able to discriminate (p < 0.05) between clinically stable patients who showed progression-free survival (PFS) from those who are alive with disease (AWD) progression. The T/NTmean values in these groups of patients were 1.31 ± 0.33 (n = 3) and 2.56 ± 1.63 (n = 5), respectively. Likewise, the SUVmax index was also able to discriminate (p < 0.05) between the two groups of patients, and the values were 2.9 ± 1.9 (n = 3) and 8.9 ± 5.5 (n = 5), respectively (Fig. 5).

Box and whisker plot showing the association of T/NTmean (***p < 0.001, PFS vs. AWD) and L/Nmax (**p < 0.01, PFS vs. AWD) with the clinical status of the patients in postoperative gliomas. AWD, alive with disease; L/Nmax, maximum lesion-to-normal tissue ratio; PFS, progression-free survival.
Volumetric comparison
The volume of tumor in PET imaging (Vt PET), SPECT imaging (Vt SPECT), and MRI (Vt MR) was compared (Supplementary Fig. S1) and is summarized in Supplementary Table S3. A significant and strong positive correlation (Spearman's coefficient [rs] = 0.611, p < 0.004) was observed between Vt PET and Vt MR. Likewise, a significant and strong positive correlation (Spearman's coefficient [rs] = 0.610, p < 0.004) was found between Vt SPECT and Vt MR. The Dice coefficient was calculated for PET and SPECT images to find a quantitative correlation between the tumor area shown by each modality. The Dice coefficient values displayed that primary tumor showed greater overlapping of the PET and SPECT compared with postoperative cases. The visual analysis showed difference between the MRI volume and PET volume.
Sensitivity and specificity
The sensitivity and specificity of [99mTc]Tc-methionine was 91% and 75% in postoperative gliomas and 92% and 100% in primary gliomas at T/NTmax of 1.9, respectively. The sensitivity and specificity of [99mTc]Tc-methionine was 91% and 75% in postoperative gliomas and 92% and 100% in primary gliomas, respectively, when a cutoff value of 1.9 was chosen for T/NTmax. [ 11 C]-methionine showed a sensitivity and specificity of 82% and 100% in postoperative cases at SUVmax cutoff value of 4.0 and 92% and 67% in primary gliomas at SUVmax cutoff value of 3.2 (Supplementary Table S2).
Histopathological correlation
None of the SUV parameters showed any correlation with MIB-1 score, which is indicative of proliferative index except T/NTmax that showed some correlation (p = 0.035).
Discussion
Amino acid PET imaging has contributed to the diagnosis of the gliomas especially in differentiating the recurrent tumor from necrosis. [99mTc]Tc-methionine has been tested in the two groups and proved to be significantly effective in differentiating the recurrent tumor from necrosis. There are other groups that are using this tracer, but the present study focused on its direct comparison with [ 11 C]methionine PET-MR. The authors have performed a head-to-head comparison of [99mTc]Tc-methionine with [ 11 C]methionine in primary and postoperative glioma cases.
[99mTc]Tc-methionine and [ 11 C]methionine uptake was based on the upregulation of amino acid metabolism in the tumor cells and overexpression of the LAT-1 in the glioma cells. Methionine is transported into the cell via LAT-1 and utilized for the formation of proteins. Therefore, it is labeled with 11 C and used for the localization of tumors exploiting the overexpression of LAT-1 in tumors. Methionine being natural amino acid can easily cross the intact BBB. 21
The patients, who are diagnosed with primary glioma, usually undergo surgery during which most part of the tumor portion is resected out. Following the surgery, the patients are put on a defined chemotherapy/radiotherapy regimen. Both tumor recurrence and radiation necrosis present a similar pattern of contrast enhancement on MRI. In this context, several groups have reported studies comparing several modalities as well as radiotracers in their efficacy to diagnose recurrence and necrosis precisely. Rani et al. compared the efficacy of [99mTc]Tc-methionine SPECT imaging and dynamic susceptibility contrast-enhanced perfusion MRI (DSCE-MR) for the first time in differential diagnosis of recurrent glioma and radiation necrosis. They reported a sensitivity of 92% and a specificity of 71.4% for DSCE-MR. In contrast, [99mTc]Tc-methionine SPECT imaging showed a sensitivity of 92% and a specificity of 78.6%.
Such promising results motivated the authors to conduct this present study where the goal was to compare the diagnostic efficacy of [99mTc]Tc-methionine SPECT with another amino acid tracer only. [ 11 C]methionine is another well-established PET radiotracer for detecting brain tumors, and several groups have reported about its high-contrast presentation between tumor tissue and adjacent healthy tissue. Considering such high diagnostic efficacy of [ 11 C]methionine PET imaging, the authors have compared [99mTc]Tc-methionine SPECT with [ 11 C]methionine PET imaging. This diagnostic comparison is more reliable from the previously conducted comparative studies because the authors have compared one methionine-based radiotracer with another standard methionine-based (PET) tracer.
Rani et al. reported that the T/NTmax of [99mTc]Tc-methionine SPECT imaging in tumor recurrence (3.59 ± 1.70) was significantly higher than that observed in radiation necrosis (1.16 ± 0.42). In the present study, the authors have also observed a T/NTmax of 3.53 ± 2.10 in tumor recurrence, which is significantly higher than 1.49 ± 0.75 observed in radiation necrosis. Likewise, the authors found a T/NTmax of 3.82 ± 3.16 in high-grade glioma, which is significantly higher than 1.34 ± 0.42 observed in low-grade glioma.
These results confirmed that the [99mTc]Tc-methionine SPECT imaging has a high efficacy not only in diagnosing recurrence and necrosis but also in diagnosing low-grade glioma from high-grade glioma. The authors deduced the association of SUVmax and T/NTmean with the clinical status (PFS and AWD) of the patients. The reason for selecting these two indices was that they showed the highest sensitivity and specificity in their respective imaging modalities. The T/NTmean was found to be significantly higher than that observed in AWD. The authors could not find any significant association between the indices and the clinical status of the dead patients. One probable reason might be the small sample size (n = 2).
At a cutoff value of 1.9, the T/NTmean provided the best sensitivity and specificity of 91% and 75%, respectively, in postoperative gliomas. In primary gliomas, the T/NTmax of 1.9 provided a sensitivity and specificity of 92% and 100%, respectively. In a recent study, Terekawa et al. reported an Az equal to 0.696 for SUVmax detected in patients who underwent [ 11 C]methionine PET imaging. 22 In the current study, the authors found Az equal to 0.1 for SUVmax index in postoperative gliomas; this observation is not in a good agreement with previously reported studies. The authors strongly believe it to be a result of the small sample size (n = 15). Figure 2B shows the representative image of a necrotic patient. It was difficult to diagnose by visual analysis of T2-weighed MR image, but both [ 11 C]methionine PET imaging and [99mTc]Tc-methionine SPECT showed no abnormal uptake of the tracers and attributed the case as of radiation necrosis. Therefore, PET and SPECT image always add a confidence in reporting such cases.
For tumor resection part, surgeon needs an exact idea about the total volume of the tumor so that the tumor can be fully resected out during the surgery. Keeping the relevance of the tumor size and volume, the authors compared the volume of tumor detected through PET imaging and SPECT imaging by taking standard reference as volume of tumor detected through MRI. The authors found a positive correlation between Vt PET and Vt MR signifying that PET imaging also discriminated tumor sizes among patients in concurrence with the MRI. Likewise, Vt SPECT also showed a positive correlation signifying its almost exact tumor size demarcating ability. The Dice coefficient of above 0.5 was considered a satisfactory overlap on visual analysis.
The Dice coefficient values as low as 0.05 (Case 15, Supplementary Table S3) and as high as 0.45 (Case 1, Supplementary Table S3) were observed in cases with low tumor volume. This may be probably due to the differential spatial uptake of the two amino acid-based radiotracers in the same tumor region. The comparison of the two tracers was performed in terms of uptake in the lesions, although the biodistribution pattern was different for both tracers. The difference in core structure of the molecules may be the reason for their difference in uptake pattern. [ 11 C]methionine mimics the natural amino acid, whereas technetium-99m[99mTc]-bis-methionine-DTPA contains two methionine bounded by a DTPA molecule. 15,23
The higher spatial resolution of PET over SPECT always gives it an edge in delineating tumor in a better way, but low-cost [99mTc]Tc-methionine SPECT provides it an edge to be used in a SPECT-based amino acid tracer. Previous study (reported by Singh et al.) did not show any correlation between the proliferate index (Ki67) with [99mTc]Tc-methionine uptake, 24 and in agreement with that study, the present study also did not support any correlation between the lesion and proliferative index.
Conclusions
[99mTc]Tc-methionine can be conveniently labeled and used for amino acid SPECT scan. It showed good diagnostic efficacy in high-grade tumor and especially in differentiating the tumor recurrence from necrosis. It can be used as tracer for small facilities or who cannot afford expensive infrastructure such as cyclotron and PET. However, a larger amount of data are required for its validation in clinical use.
Ethics Approval and Consent to Participate
This study was approved by the Institute Ethics Committee (IEC-NIMHANS/19thIEC/2019) and Institute Biosafety Committee (IBSC-NIMHANS/DO/IBSC MEETING/2019). Informed consent was obtained from all individual participants included in the study.
Consent to Publication
The authors affirm that due permission was taken from respective human participants for publication of the images in Figures 1 and 2.
Data Availability
The data sets generated/analyzed during the current study are available from the corresponding author on reasonable request.
Footnotes
Acknowledgment
The authors acknowledged the financial assistance from Science and Engineering Research Board (SERB), Department of Science and Technology, Government of India [SERB project reference (CRG/2018/002600)].
Authors' Contributions
Study conception and design: P.K., P.P.H., and A.K.M. Acquiring data: P.K., A.K., C.N., S.M., and K.S. Analysis of data: P.K., A.K., J.S., C.N., K.S., S.M., and A.R. Patient referral: N.S. and M.B. Drafting the article: P.K. and A.K. All the authors contributed to the article and approved the submitted version.
Disclosure Statement
The authors have no relevant financial or nonfinancial interests to disclose.
Funding Information
The work is supported by Science and Engineering Research Board, India (Grant No. CRG/2018/002600).
Supplementary Material
Supplementary Table S1
Supplementary Table S2
Supplementary Table S3
Supplementary Figure S1
References
Supplementary Material
Please find the following supplemental material available below.
For Open Access articles published under a Creative Commons License, all supplemental material carries the same license as the article it is associated with.
For non-Open Access articles published, all supplemental material carries a non-exclusive license, and permission requests for re-use of supplemental material or any part of supplemental material shall be sent directly to the copyright owner as specified in the copyright notice associated with the article.