
Abstract
Background:
Colorectal cancer (CRC) is a major global health challenge with a need for new biomarkers and therapeutic targets. This work investigated the biological mechanisms and clinical value of Ly1 antibody reactive (LYAR) in CRC.
Methods:
We analyzed LYAR mRNA expression across multiple public databases, including genotype-tissue expression, gene expression omnibus, Oncomine, and the cancer genome atlas, alongside in-house immunohistochemical data to evaluate LYAR protein expression in CRC and non-CRC colorectal tissues. Gene set enrichment analysis (GSEA) was used to elucidate LYAR’s biological functions, and its impact on the tumor immune microenvironment was assessed using CIBERSORT, ESTIMATE, and single-cell RNA sequencing techniques. In addition, LYAR’s association with clinicopathological features and patient prognosis was explored, and its influence on drug sensitivity was investigated using the Connectivity Map database.
Results:
LYAR was significantly upregulated in CRC tissues compared with non-CRC colorectal counterparts, associated with altered immune cell composition and enhanced RNA processing, splicing, and cell cycle regulation. High LYAR expression correlated with poor disease-free and overall survival, underscoring its prognostic value. GSEA revealed LYAR’s involvement in critical cellular processes and pathways, including DNA repair, cell cycle, and mTORC1 signaling. Correlation analysis identified genes positively and negatively associated with LYAR, leading to the discovery of temsirolimus and WYE-354, mTOR inhibitors, as potential therapeutic agents for CRC. Furthermore, LYAR expression predicted increased sensitivity to cetuximab in RAS wild-type metastatic CRC, indicating its utility as a biomarker for treatment responsiveness.
Conclusions:
LYAR’s upregulation in CRC highlights its potential as a biomarker for prognosis and therapeutic targeting, offering insights into CRC pathology and suggesting new avenues for treatment optimization.
Introduction
Colorectal cancer (CRC) ranks as the second leading cause of cancer mortality and the third most common cancer in terms of incidence. 1 The multifactorial pathogenesis of CRC encompasses environmental, dietary, nutritional aspects, physical activity levels, sedentary lifestyle, obesity, smoking, and alcohol consumption. 2 Despite advancements in treatment modalities, the prognosis for CRC patients remains suboptimal. 3,4 Hence, further exploration into CRC tumorigenesis and the identification of novel biomarkers are necessary.
Ly1 antibody reactive (LYAR), a transcription factor characterized by a specific DNA-binding domain (GGTTAT/G), plays a critical role in cell proliferation, differentiation, and genomic stability maintenance. 5 –7 Recent evidence suggests LYAR dysregulation is implicated in the etiology of various cancers, influencing key cellular processes including apoptosis, metastasis, and angiogenesis. 8 –10 Notably, LYAR expression was found to be upregulated in CRC and influenced the modulation of tumorigenesis, proliferation, and invasion. 11 Nonetheless, in-depth studies on LYAR’s clinical relevance and prognostic value in CRC are lacking.
This research aims to enhance the understanding of LYAR’s function in CRC, proposing its value as a potential biomarker and therapeutic target. This research elucidated LYAR’s biological mechanisms and clinical utility in CRC through an extensive analysis of public databases. Furthermore, LYAR protein expression was confirmed using data from the Human Protein Atlas (HPA) and in-house immunohistochemistry. The study also assessed LYAR’s influence on clinicopathological features and patient prognosis. Gene set enrichment analysis (GSEA) disclosed LYAR’s biological functions, whereas its influence on the tumor immune microenvironment (TIME) was assessed via CIBERSORT, ESTIMATE, and single-cell sequencing techniques. Correlated genes with LYAR were identified through Pearson correlation analysis, and performed a deeper investigation into LYAR’s impact on drug sensitivity.
Methods
Data acquisition and processing for LYAR mRNA expression analysis
LYAR mRNA expression data were sourced from comprehensive databases including the Genotype-Tissue Expression (GTEx), Gene Expression Omnibus (GEO), Oncomine, and The Cancer Genome Atlas (TCGA). To ensure consistency and comparability, all mRNA expression datasets underwent normalization. Datasets originating from the same platform were consolidated, and batch effects were removed using the surrogate variable analysis (SVA) package. Subsequently, the data matrices from TCGA and GTEx were combined to facilitate further in-depth analysis.
Evaluating LYAR mRNA expression and its diagnostic utility in CRC
To visualize the distribution and variation of LYAR mRNA expression across different sample groups, violin diagrams were generated using GraphPad Prism (version 9.5.0). The rank-sum test was used to ascertain the statistical significance of expression differences between groups. The diagnostic accuracy of LYAR mRNA in differentiating CRC tissues from non-CRC colorectal tissues was evaluated through receiver operating characteristic (ROC) curves and summary ROC analysis. The standardized mean difference (SMD) was calculated using STATA software (version 16.0) to quantify the magnitude of LYAR expression differences. In addition, Begg’s test and sensitivity analysis were undertaken to assess potential publication bias and the stability of our results.
Furthermore, we leveraged the TCGA database to explore the association between LYAR expression and a wide array of clinicopathological characteristics. This comprehensive analysis included evaluating the impact of age, cancer stage, body mass index (BMI), tumor size (T), lymph node involvement (N), metastasis (M), histological type, and gender on LYAR mRNA expression levels, aiming to provide deeper insights into its relevance in the clinical setting of CRC.
Assessing LYAR protein expression in CRC through immunohistochemical analysis
Using the HPA database, we acquired immunohistochemical data for colorectal and CRC tissues treated with the HPA035881 antibody. Following ethical approval from the Ethics Committee of the First Affiliated Hospital of Guangxi Medical University [Approval Number: NO.2022-KY-E (047)], two tissue microarrays (HColA180Su10 and HColA150CS02) were procured from Shanghai Outdo Biotech Company Limited. These arrays included samples from 175 patients diagnosed with CRC and 155 individuals with non-CRC colorectal conditions, enabling further validation of LYAR protein expression. The immunohistochemical processing of these tissues was performed using the anti-LYAR antibody (ab233082), as outlined in our prior publications. 12 –15 Immunohistochemistry results were independently evaluated by two seasoned pathologists.
The evaluation of LYAR protein expression was quantified using the immunoreactivity score (IRS), which combines staining intensity and the percentage of positive cells; higher IRS values signify increased LYAR protein expression. In addition, clinicopathological data were gathered from the aforementioned patient groups to assess the impact of LYAR expression on various clinicopathological parameters. The Mann−Whitney U test, conducted using SPSS software (version 26.0), facilitated the comparison of expression levels between groups. A p-value of less than 0.05 was considered indicative of statistical significance.
Assessing the impact of LYAR expression on survival outcomes in CRC patients
In this study, survival information datasets for CRC patients were curated from the GEO database. The ‘surv_cutpoint’ function within the ‘survminer’ R package was used to determine the optimal cutoff value for distinguishing between high and low expression groups of patients based on LYAR mRNA levels. Patients were then classified into either high or low LYAR mRNA expression groups according to this cutoff value. Survival analysis was conducted using Kaplan–Meier survival curves to explore the relationship between LYAR mRNA expression levels and patient survival time. In addition, to further validate the impact of LYAR expression levels on the prognosis of CRC patients, analysis was conducted using follow-up data from internal tissue microarray samples. By comparing the survival outcomes of patient groups with different levels of LYAR protein expression, we assessed the association between increased LYAR protein expression and CRC patient prognosis.
Investigating the biological functions and signaling pathways of LYAR in CRC using GSEA
To decipher the biological roles and signaling pathways associated with LYAR in CRC, we used GSEA. This analysis used the GSEA software along with five specific gene sets: the c5.go.bp.v7.4.symbols.gmt subset (biological processes), c5.go.cc.v7.4.symbols.gmt subset (cellular components), c5.go.mf.v7.4.symbols.gmt subset (molecular functions), c2.cp.kegg.v7.4.symbols.gmt subset (KEGG pathways), and h.all.v7.4.symbols.gmt subset (hallmark gene sets). These gene sets were selected to provide comprehensive insights into the molecular biological mechanisms and pathways LYAR may influence within CRC.
The analysis classified carcinoma samples from the TCGA dataset based on the median value of LYAR mRNA expression to create two groups for comparison. Using these groups alongside the aforementioned gene expression profiles and subsets, GSEA was conducted to identify statistically significant associations. Terms exhibiting a p-value less than 0.05 and a false discovery rate (FDR) less than 0.25 were considered to indicate statistically significant enrichment, shedding light on the potential biological functions and pathways mediated by LYAR in the context of CRC.
Assessing LYAR mRNA expression’s impact on the TIME in CRC
Despite the remarkable success of various immunotherapeutic drugs in cancer treatment, the response to immunotherapy remains variable among patients. Therefore, a detailed analysis of the TIME is critical for enhancing the efficacy of immunotherapeutic responses.
To investigate the impact of LYAR mRNA expression on immune cell infiltration within the tumor microenvironment, we used data from the tumor immune single-cell hub 2 (TISCH2) database, the CIBERSORT algorithm, and the ESTIMATE algorithm. CRC samples from the TCGA dataset were divided into two groups based on the median value of LYAR mRNA expression: low and high LYAR expression groups. The degree of immune infiltration in these groups was quantitatively assessed using CIBERSORT and the ESTIMATE method, implemented in R software (version 4.0.5). Further, the expression of LYAR in the TIME at the single-cell level was examined using the TISCH2 database.
Tumor mutational burden (TMB), which quantifies the number of somatic mutations within the tumor genome, indirectly reflects a tumor’s capability to generate novel antigens. As a promising marker for immunotherapy alongside PD-L1, TMB could potentially forecast the efficacy of immunotherapy treatments. Somatic mutation and gene expression data from CRC patients were extracted from the TCGA database. Subsequently, a Spearman correlation analysis was performed to ascertain the relationship between TMB and LYAR expression, aiming to illuminate LYAR’s role as a biomarker for immunotherapy responsiveness.
Evaluating drug sensitivity relative to LYAR expression in CRC
The half maximal inhibitory concentration (IC50) is a metric that denotes the concentration of a drug needed to inhibit cell viability by 50% and serves as a critical indicator of a drug’s potency in inducing apoptosis. Generally, a lower IC50 value signifies a stronger capability of the drug to induce apoptosis. In our analysis, the TCGA dataset was divided based on the median mRNA expression level of LYAR. The pRRophetic R package was then used to develop a ridge regression model, aiming to predict the IC50 values for various commonly used antitumor drugs. This model leveraged cell line expression profiles from the Cancer Genome Project alongside the processed gene expression profiles from the TCGA dataset. Through this approach, we aimed to elucidate the relationship between LYAR mRNA expression levels and the sensitivity of cancer cells to therapeutic agents, potentially guiding more effective treatment strategies for CRC.
Identifying potential therapeutic drugs for CRC
To uncover therapeutic agents with potential efficacy against CRC, we conducted Pearson correlation analysis on gene expression data from the TCGA datasets using the cor function in R (version 4.0.5). The strength and direction of the association between pairs of genes were determined by the Pearson correlation coefficient, denoted as the r value. A positive association between two genes was identified when r > 0.65 and p < 0.05, whereas a negative correlation was recognized at r < −0.4 and p < 0.05.
Following this correlation analysis, we compiled a signature list composed of genes both positively and negatively correlated as identified above. This signature list was then matched against the gene expression profiles in the Connectivity Map (cMap) database using its query tool. The degree of similarity between our signature list and the drug-induced gene expression changes in cMap was quantified with similarity scores. Drugs yielding scores closer to −100 were interpreted as having gene expression effects inversely related to our signature list, suggesting their potential utility in CRC treatment.
Results
Significant upregulation of LYAR mRNA in CRC tissues
In this investigation, we selected 21 datasets from the GTEx, Oncomine, TCGA, and GEO databases, including GSE47063, GSE156355, GSE44076, GSE87211, GSE21815, GSE75548, GSE35279, GSE81558, GSE54986, GSE106582, GSE20842, GSE28000, GSE25071, GSE15021, GSE126092, GSE103512, GSE41174, GSE15781, GSE62321, GSE113513, and the amalgamated TCGA+GTEx dataset (Table 1). Through a rigorous process of data integration and batch effect elimination, we successfully consolidated these into 17 datasets for in-depth analysis. This finalized dataset collection included 1,356 CRC samples and 925 non-CRC colorectal tissue samples.
Characteristics of Gene Expression Omnibus Datasets Used in the Comprehensive Analysis
The comparative analysis of LYAR mRNA expression revealed a statistically significant upregulation in CRC tissues compared with non-CRC colorectal tissues in 14 out of 17 datasets (Fig. 1). Using a random effects model, the summary analysis further substantiated the marked overexpression of LYAR in CRC samples, as evidenced by an SMD of 1.98 and a 95% confidence interval of 1.62–2.35 (Fig. 2A). The robustness of these findings was affirmed by a sensitivity analysis, which indicated a remarkable consistency across the studies without significant heterogeneity (Fig. 2B). Moreover, the analysis through a funnel plot revealed no evidence of publication bias, enhancing the reliability of our results (Fig. 2C).

Comparative analysis of LYAR mRNA expression in colorectal cancer (CRC) and non-CRC colorectal tissues. Analysis of 17 datasets indicated that LYAR mRNA expression was significantly upregulated in CRC tissues in 14 of these datasets when compared with non-CRC colorectal tissues.
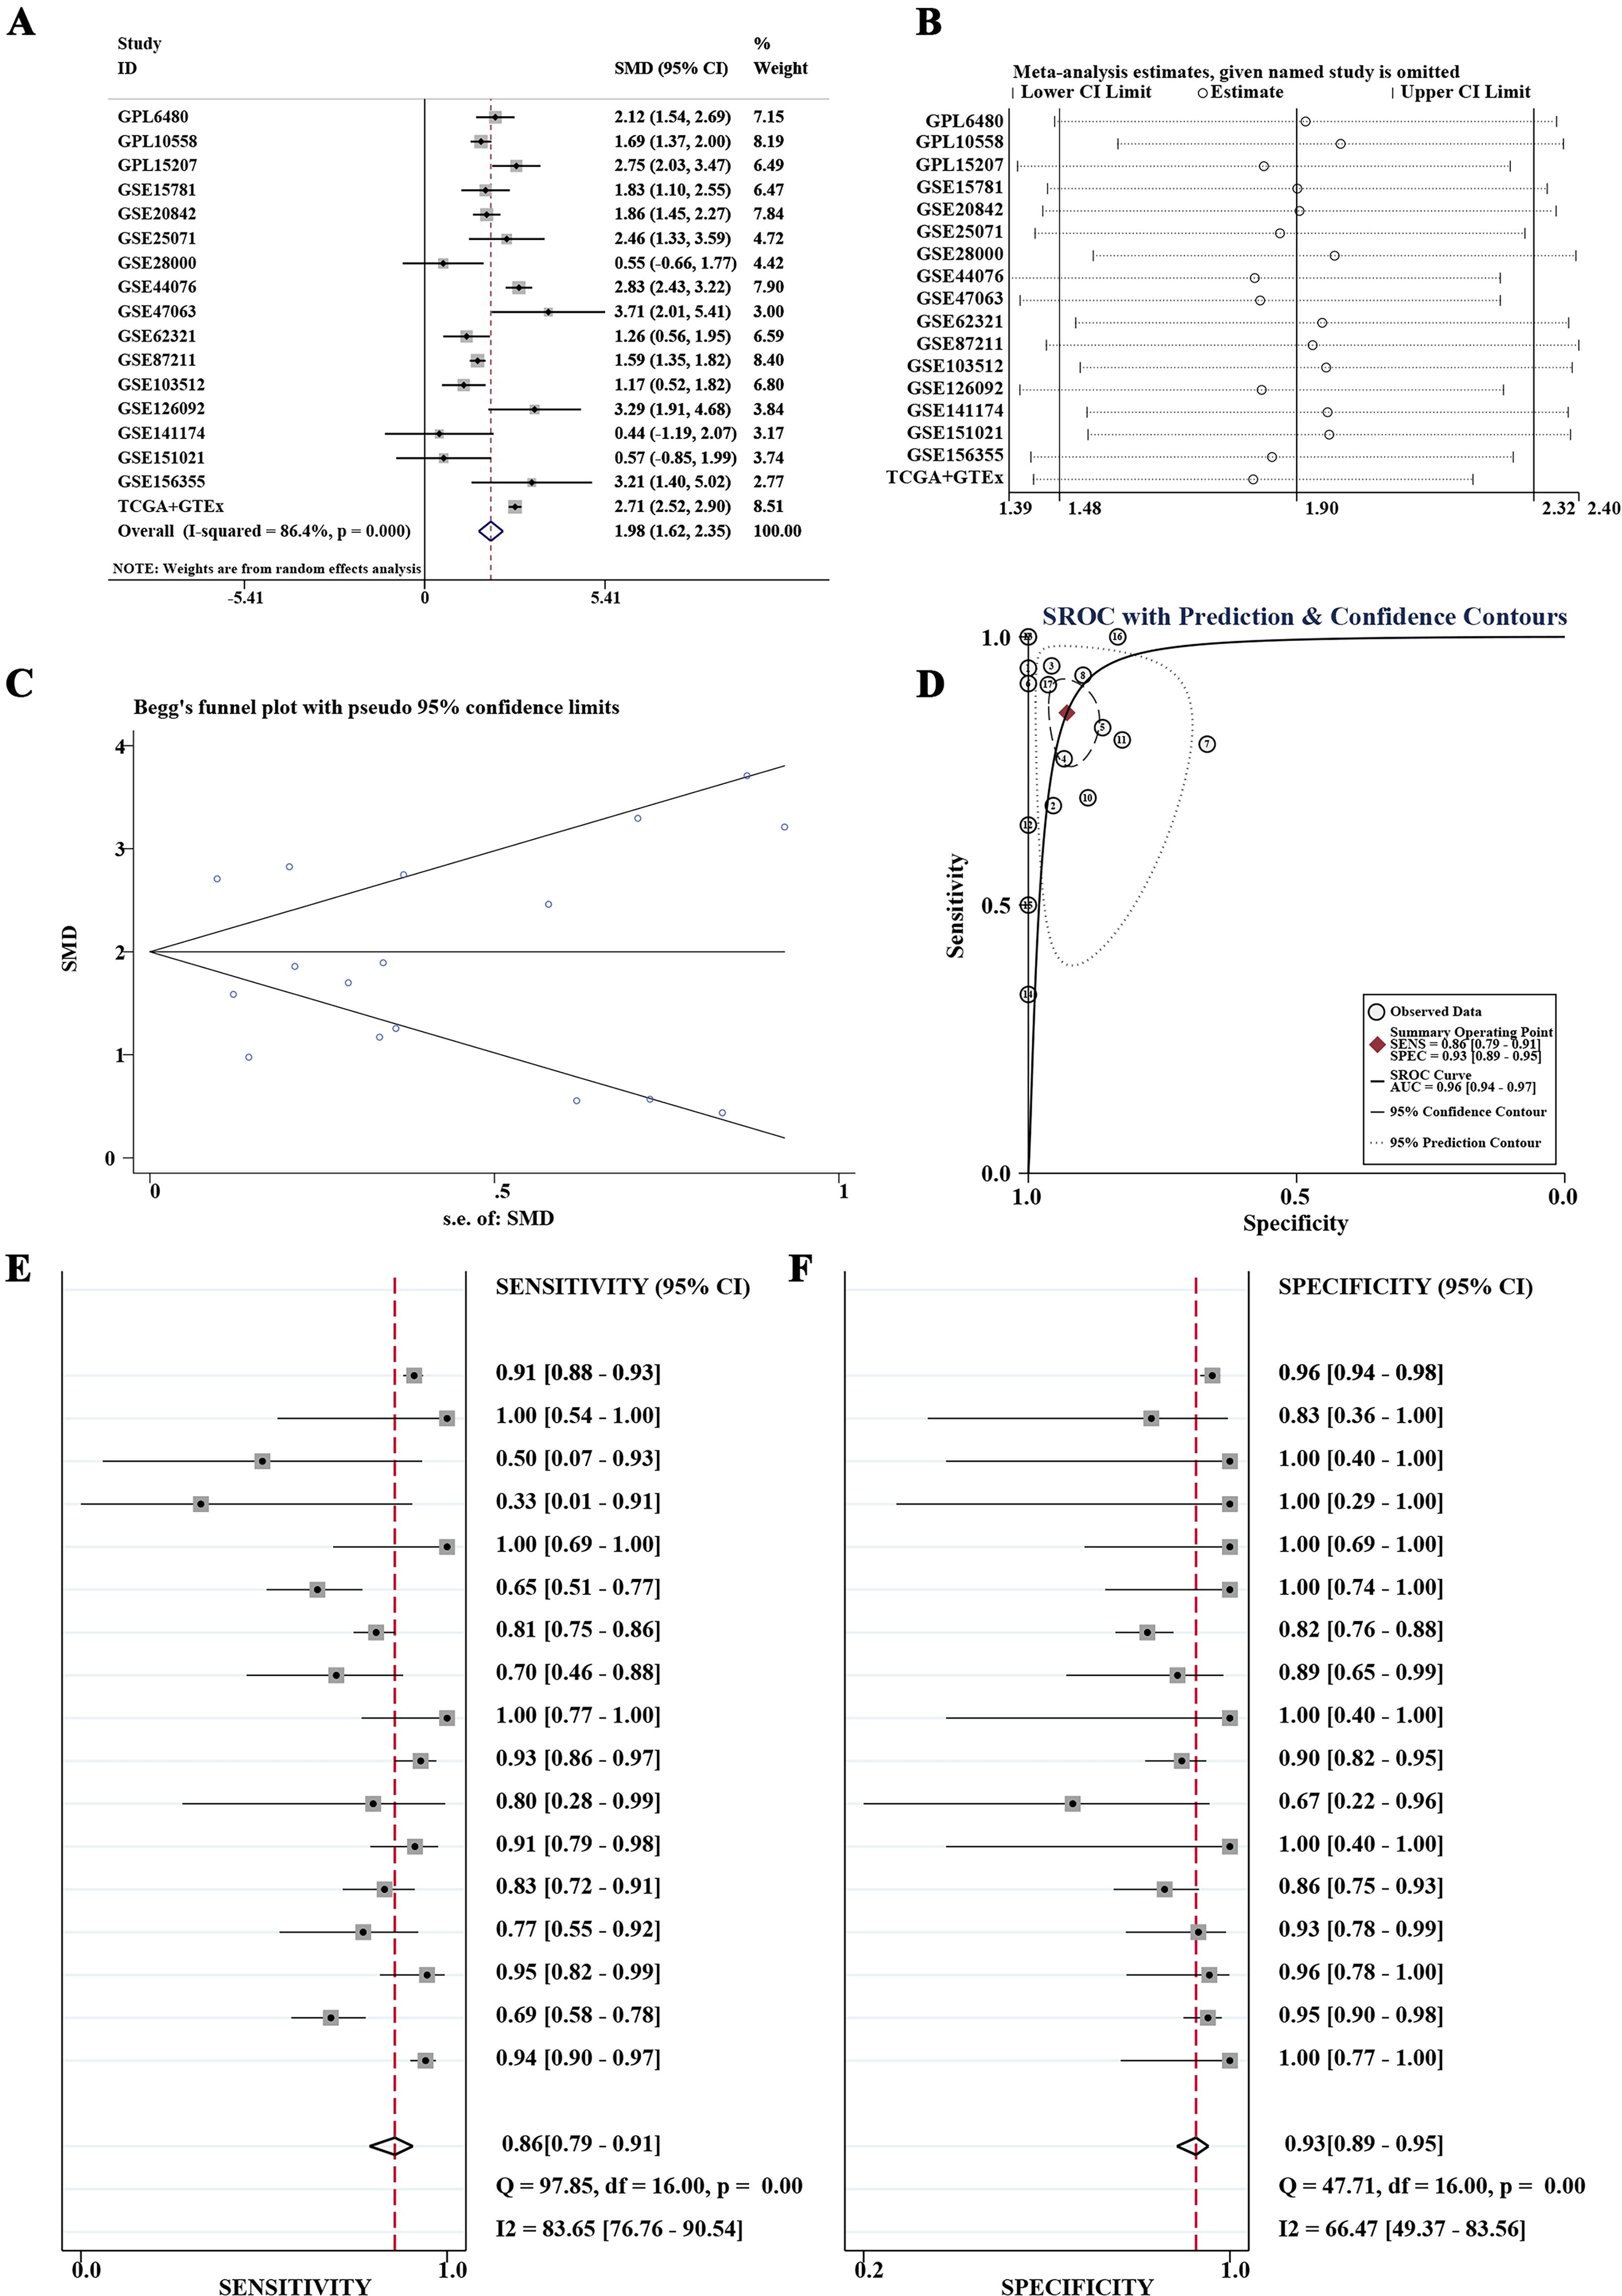
Comprehensive evaluation of LYAR mRNA overexpression in colorectal cancer (CRC) tissues.
The diagnostic utility of LYAR mRNA expression was evaluated via ROC curve analyses. This analysis demonstrated that in 14 out of 17 datasets, LYAR mRNA expression could differentiate CRC with high accuracy, with areas under the ROC curves (AUCs) exceeding 0.8 and p-values less than 0.05 (Fig. 3). The summary SROC curve analysis further underscored the high diagnostic accuracy of LYAR mRNA expression, exhibiting an AUC of 0.96, alongside a specificity of 0.93 and a sensitivity of 0.86 (Fig. 2D–F).
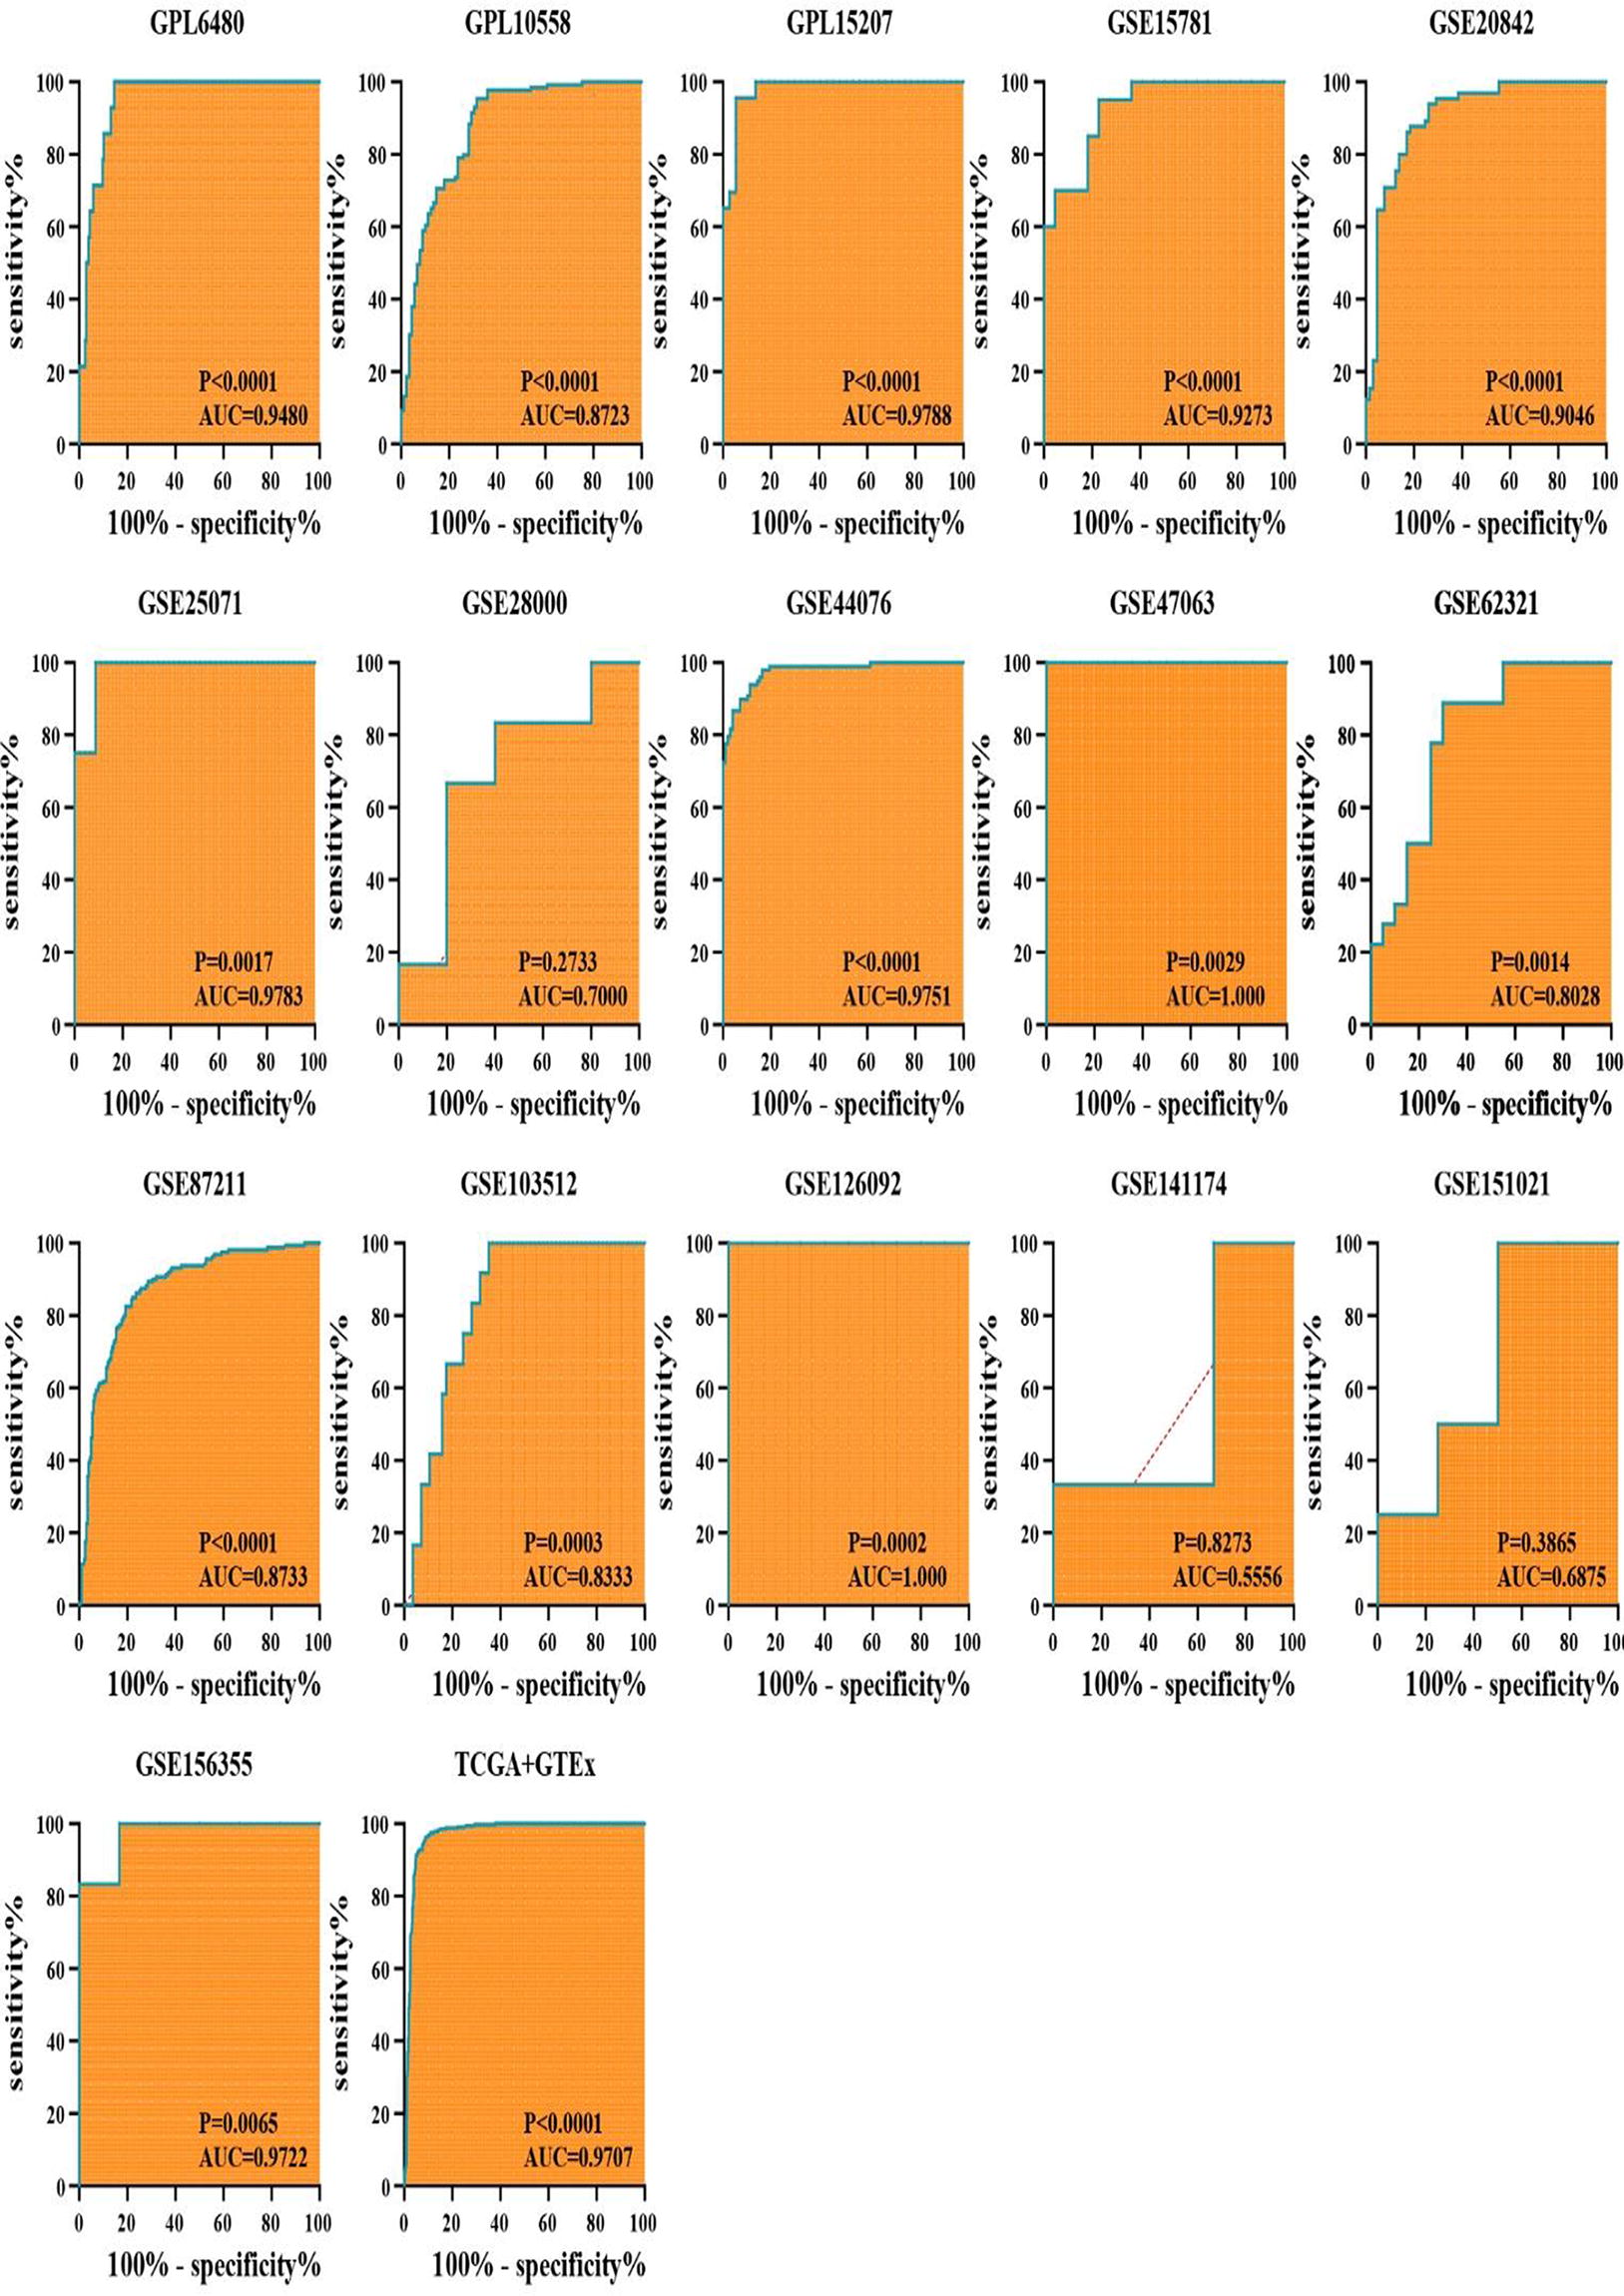
Diagnostic accuracy of LYAR mRNA expression in colorectal cancer (CRC). The analysis of receiver operating characteristic (ROC) curves across 17 datasets demonstrated that LYAR mRNA expression distinguished CRC from non-CRC colorectal tissues with high accuracy in 14 datasets, where the areas under the ROC curves exceeded 0.8 and the p-values were less than 0.05.
Differential LYAR mRNA expression across age groups and pathological subtypes
Preliminary subgroup analysis based on clinical parameters of LYAR mRNA expression in CRC patients from the TCGA database was conducted. The analysis revealed that among different age groups, the 41–60 years patient cohort exhibited the highest level of LYAR mRNA expression, followed by the 0–40 years age group, whereas the over 60 years patient group showed relatively lower levels of LYAR mRNA expression (Fig. 4A). In terms of pathological subtypes, patients with adenocarcinoma demonstrated higher LYAR mRNA expression levels compared with those with mucinous adenocarcinoma (Fig. 4B). However, no significant differences in LYAR mRNA expression levels were observed across different cancer stages (Fig. 4C), TNM staging (Fig. 4D–F), BMI (Fig. 4G), and gender subgroups (Fig. 4H).
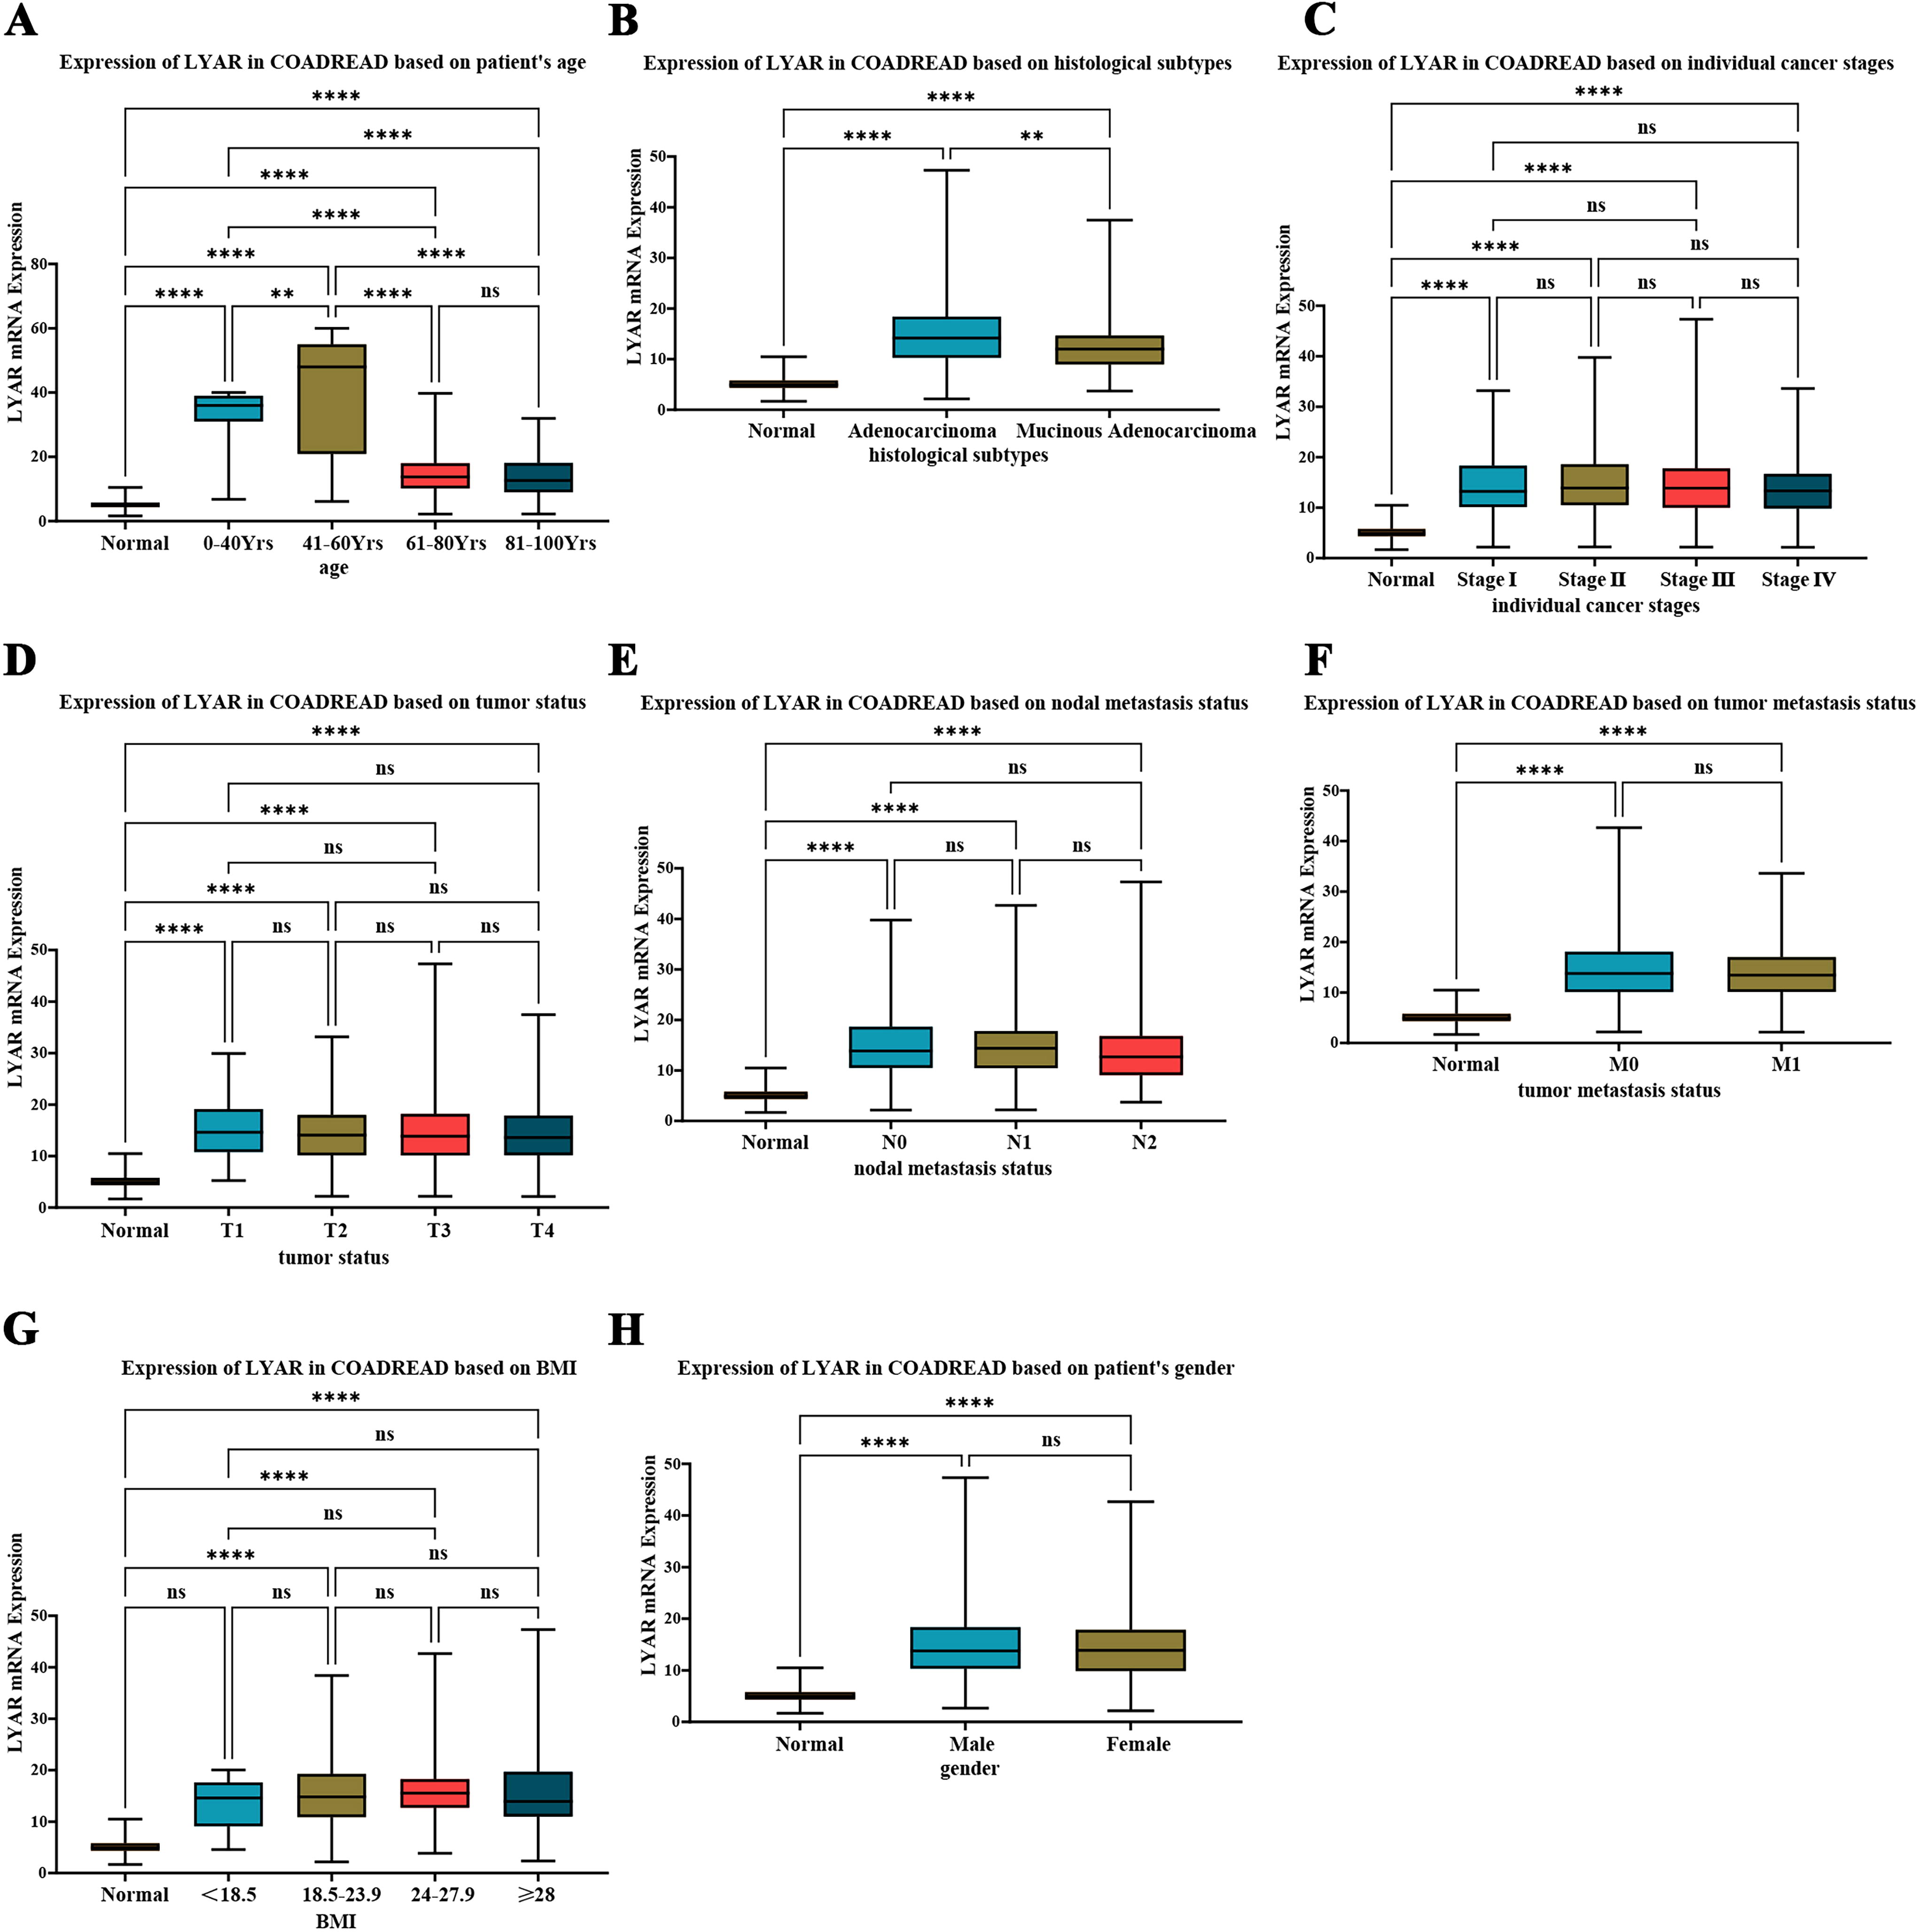
Preliminary subgroup analysis of LYAR mRNA expression in colorectal cancer (CRC) patients.
Elevated expression of LYAR protein in CRC tissues
Initial immunohistochemistry data sourced from the HPA database revealed LYAR protein expression in colon, rectal, and CRC tissues (Fig. 5). LYAR protein was undetectable in colon and rectal tissues. In CRC tissues, nuclear localization of LYAR protein was observed with moderate intensity, covering 25%–75% of cells.

LYAR protein expression in colorectal tissues from the human protein atlas. Immunohistochemical data obtained using the HPA035881 antibody. No LYAR protein was observed in colon or rectal tissues. In colorectal cancer tissues, LYAR protein prominently localized to the nucleus, exhibiting moderate staining across 25%–75% of the observed cells.
Building on insights from public databases, we used our internal dataset for further validation, encompassing 175 CRC and 155 non-CRC colorectal samples. Immunohistochemical evaluation with the anti-LYAR antibody (ab233082) uncovered distinct patterns of LYAR protein expression. Figures 6 and 7D illustrated a notable elevation in LYAR protein expression in CRC tissues when compared with non-CRC colorectal tissues (p < 0.05). Moreover, detailed statistical exploration via the Mann−Whitney U test demonstrated significant disparities in LYAR protein expression tied to various clinical indicators, such as age, T, N, M, and overall cancer stage (p < 0.05; Fig. 7E–K; Table 2).
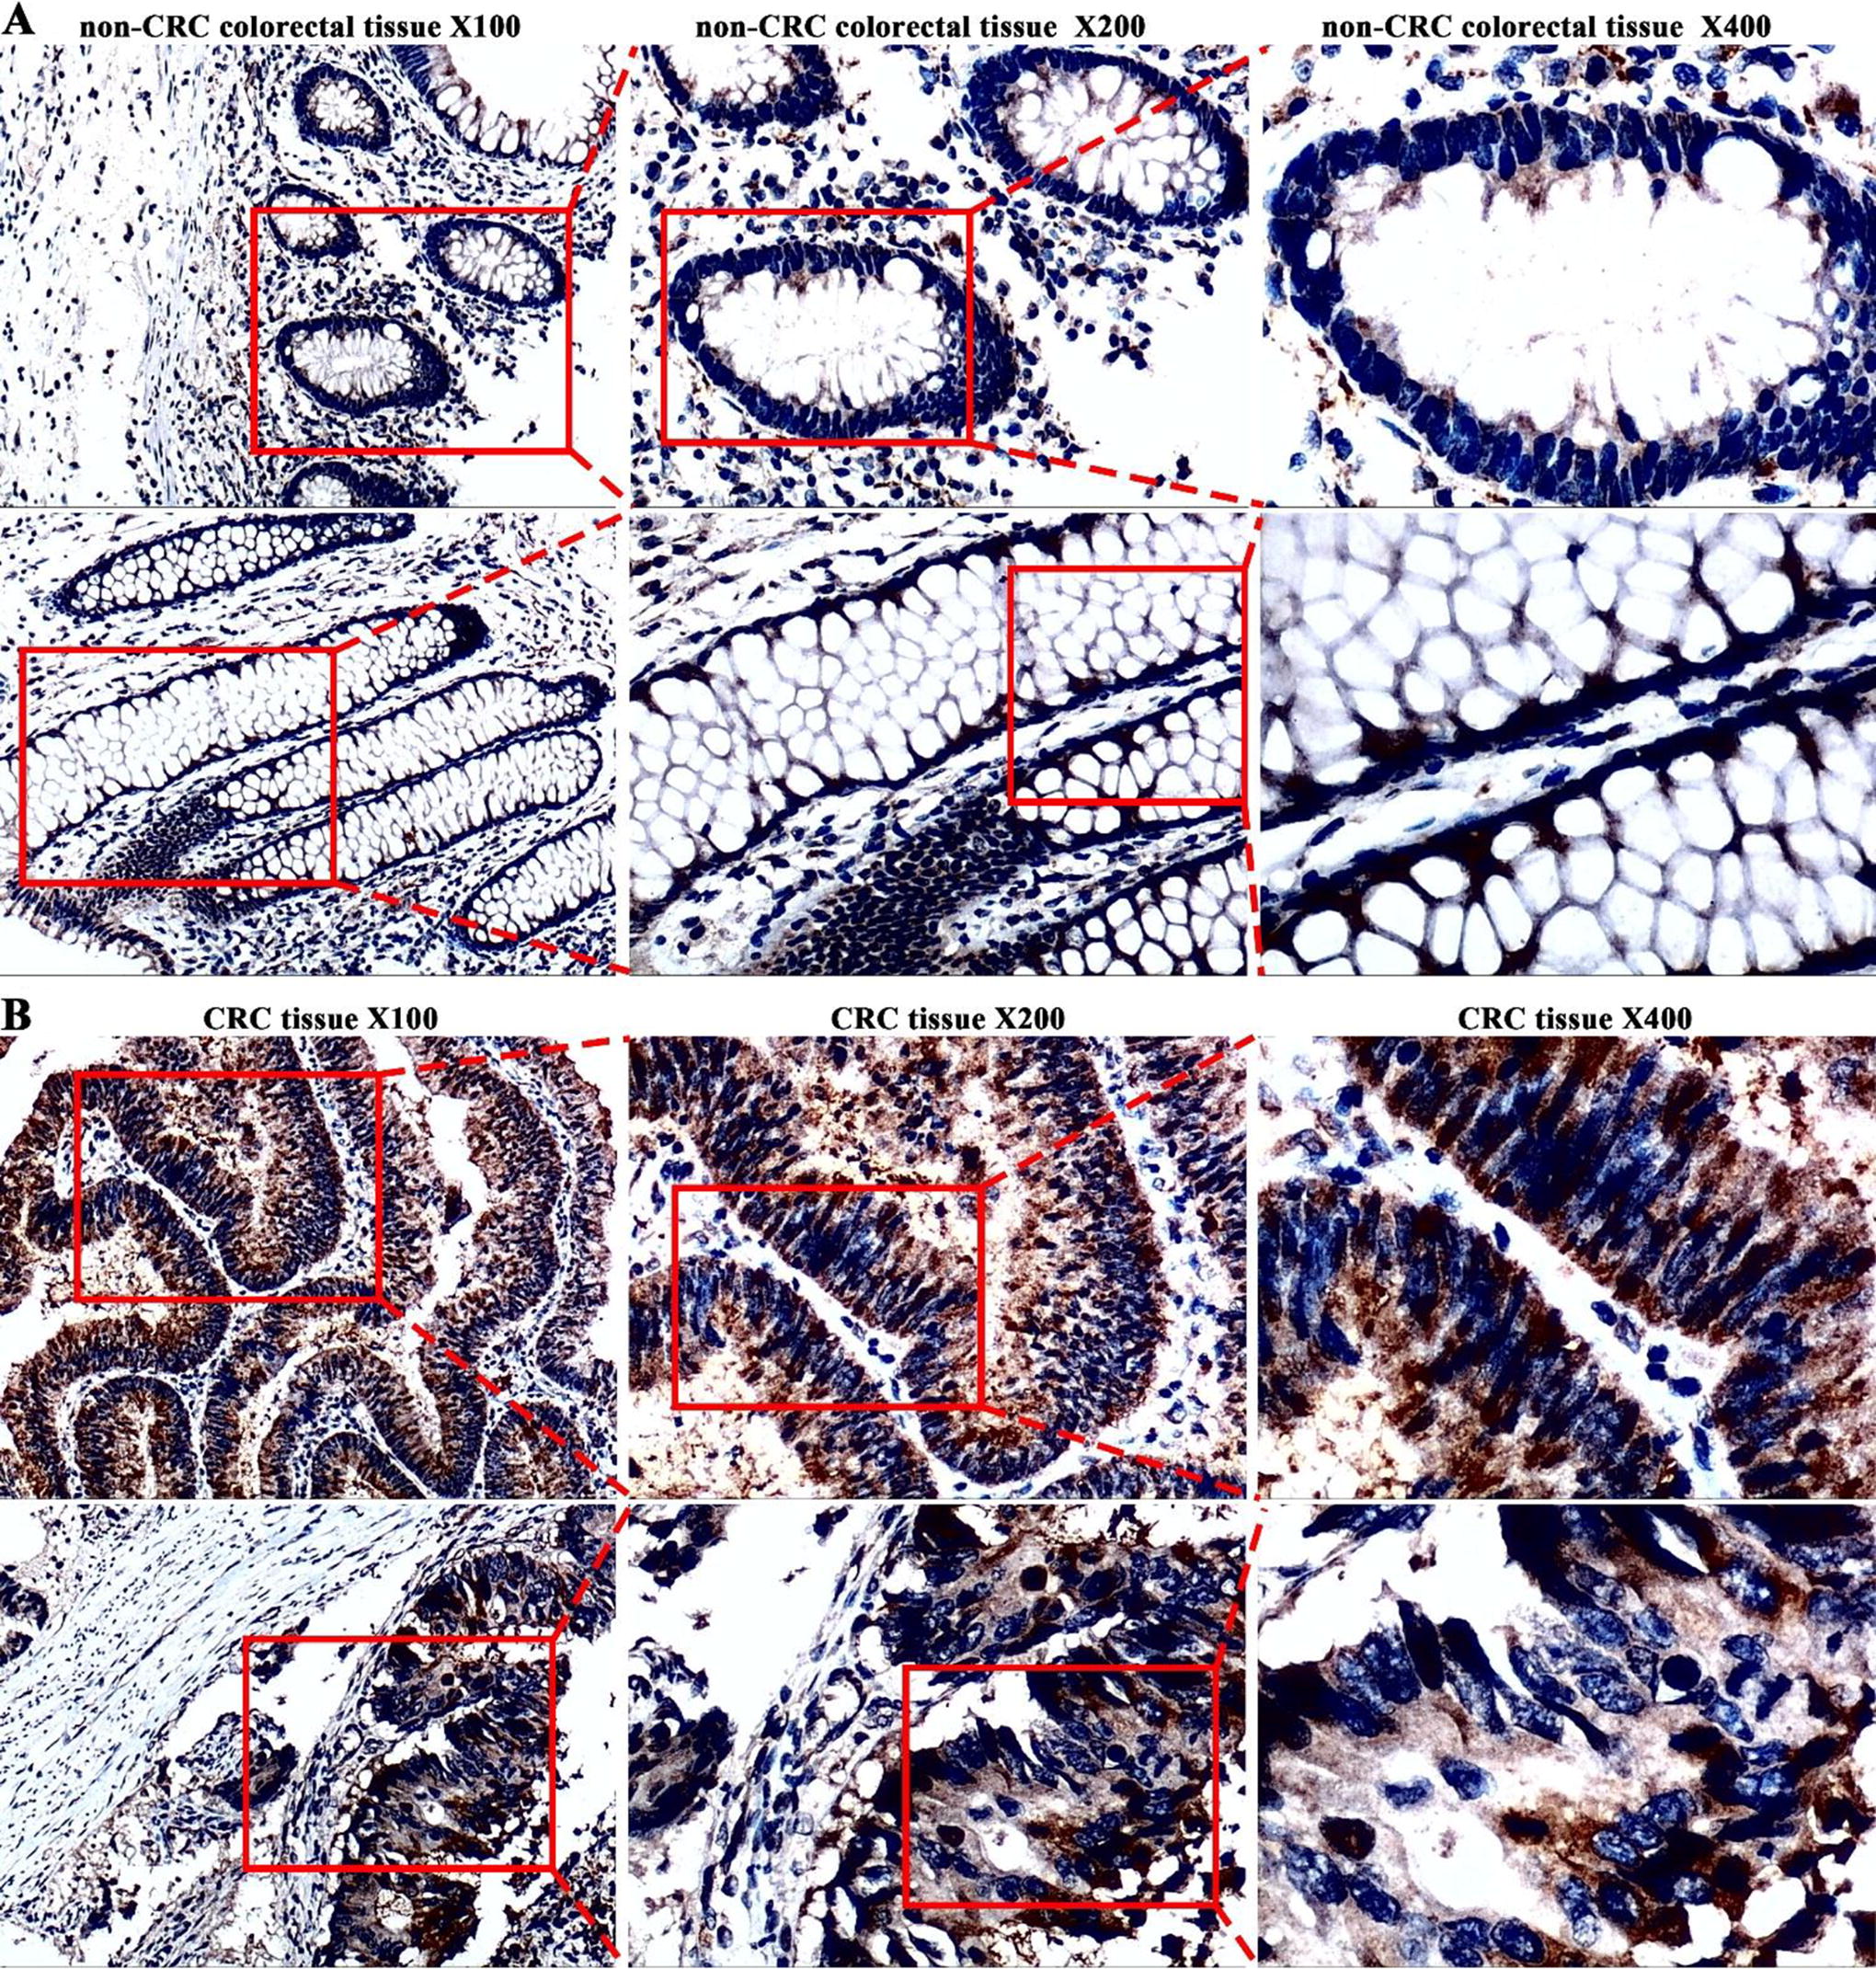
According to the immunohistochemistry, colorectal cancer (CRC) tissues have high levels of Ly1 antibody reactive (LYAR) protein expression.
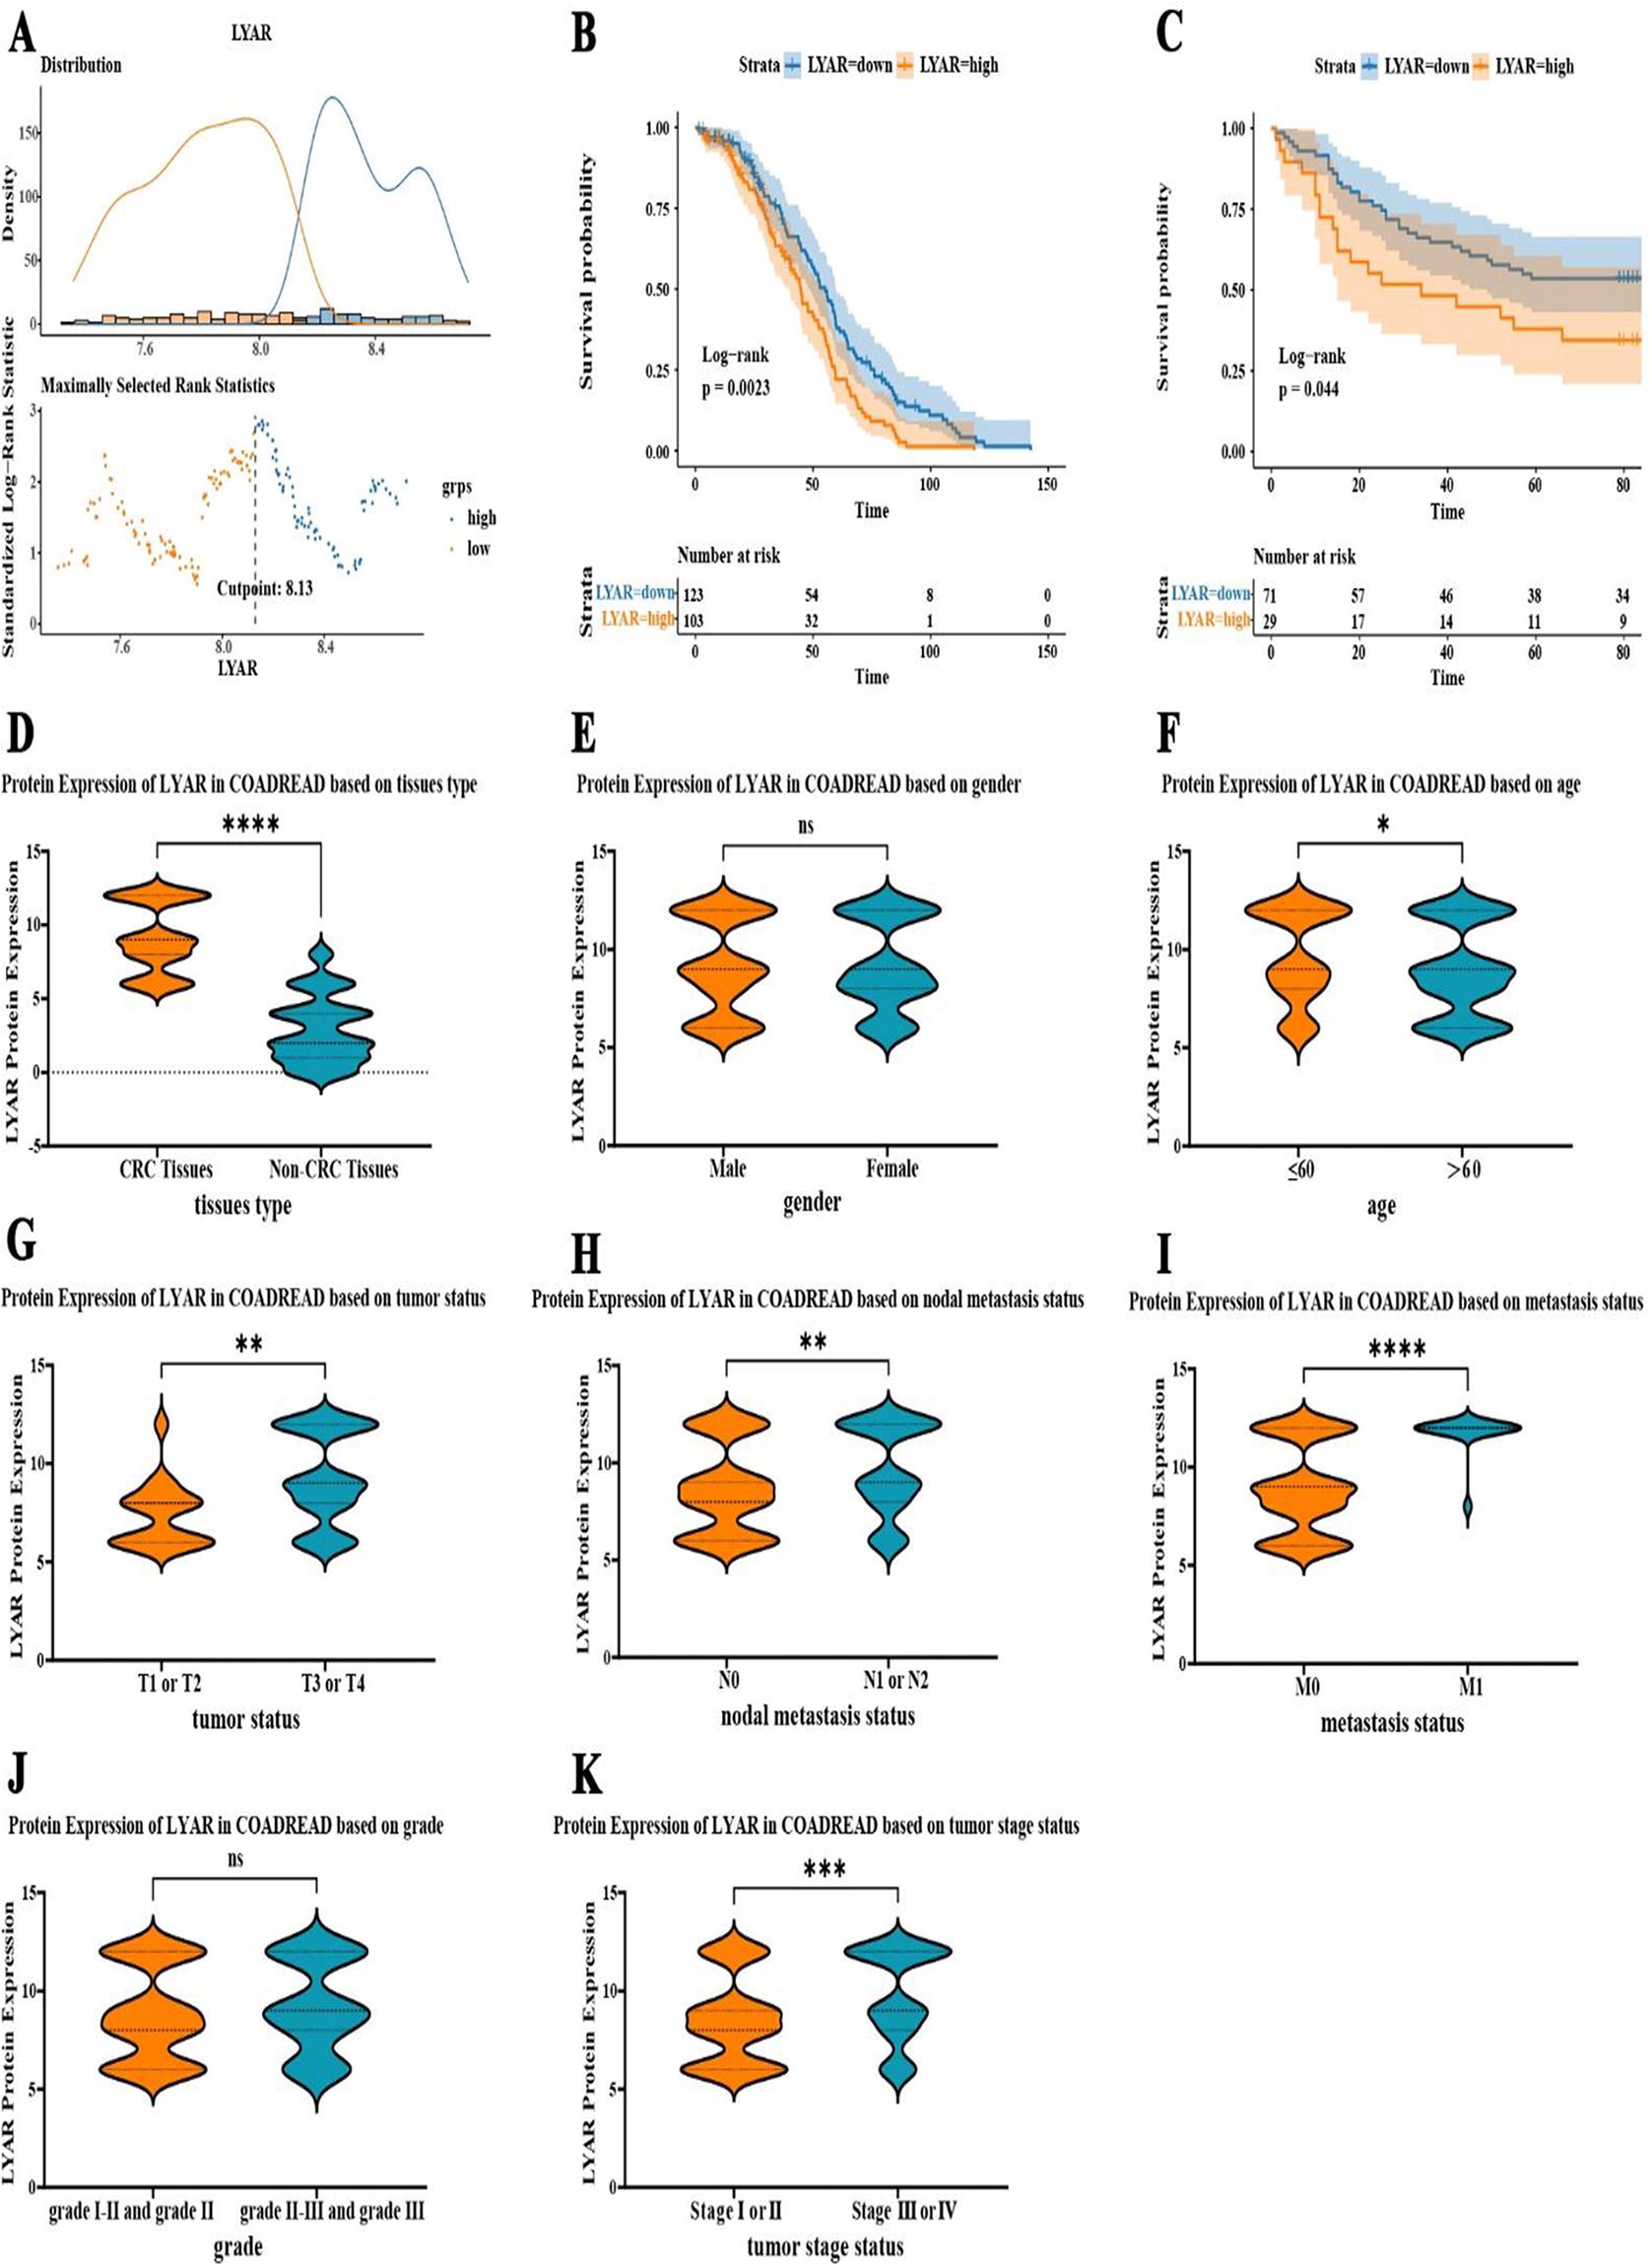
Ly1 antibody reactive (LYAR) Expression as a prognostic indicator in colorectal cancer (CRC).
Correlation Between Ly1 Antibody Reactive Protein Expression and Clinicopathological Features Based on Internal Immunohistochemistry Data
High LYAR expression indicated poor prognosis in CRC
In this study, the GSE14333 dataset from the GEO database was analyzed, including the information on disease-free survival (DFS), LYAR mRNA expression, and survival status. The optimal cutoff for gene expression was identified using the surv_cutpoint function in the survminer package, and the 226 CRC patients from GSE14333 were divided into high and low LYAR mRNA expression groups based on this threshold (Fig. 7A). Survival analysis based on this classification revealed that patients with higher LYAR mRNA expression exhibited shorter DFS time (Fig. 7B; p-value = 0.0023). Moreover, the prognostic significance of LYAR expression was further validated through analysis of follow-up data from internal samples. Survival analysis, using overall survival (OS) data and LYAR protein expression levels from 100 CRC patients, indicated that CRC patients with increased LYAR protein expression had reduced OS time (Fig. 7C; p-value = 0.044).
Impact of LYAR expression on the TIME and its correlation with TMB
In an effort to elucidate LYAR expression within immune cell populations, we meticulously analyzed six single-cell RNA sequencing (scRNA-seq) datasets obtained from the TISCH2 database. Figure 8A delineated the expression profiles of LYAR across various immune cells, offering a comprehensive view of its distribution. Subsequent visualization of LYAR expression within three scRNA-seq datasets was presented in Figure 8B, revealing the expression patterns across different cell clusters. In the CRC_GSE139555 dataset, LYAR expression was concentrated in CD8T, NK, and CD4Tconv cell clusters, indicating a significant presence in these immune cell subsets. Similarly, the CRC_GSE146771_Smartseq2 dataset exhibited a predominant LYAR expression in CD8T, CD8Tex, Tprolif, CD4Tconv, Treg, and NK cell clusters, underscoring its extensive involvement across a broad spectrum of immune cells. Furthermore, the CRC_GSE166555 dataset showed LYAR’s main expression in CD8T, Tprolif, CD4Tconv, mono/macro, endothelial, DC, and malignant cell clusters, suggesting LYAR’s multifaceted role in the tumor microenvironment.
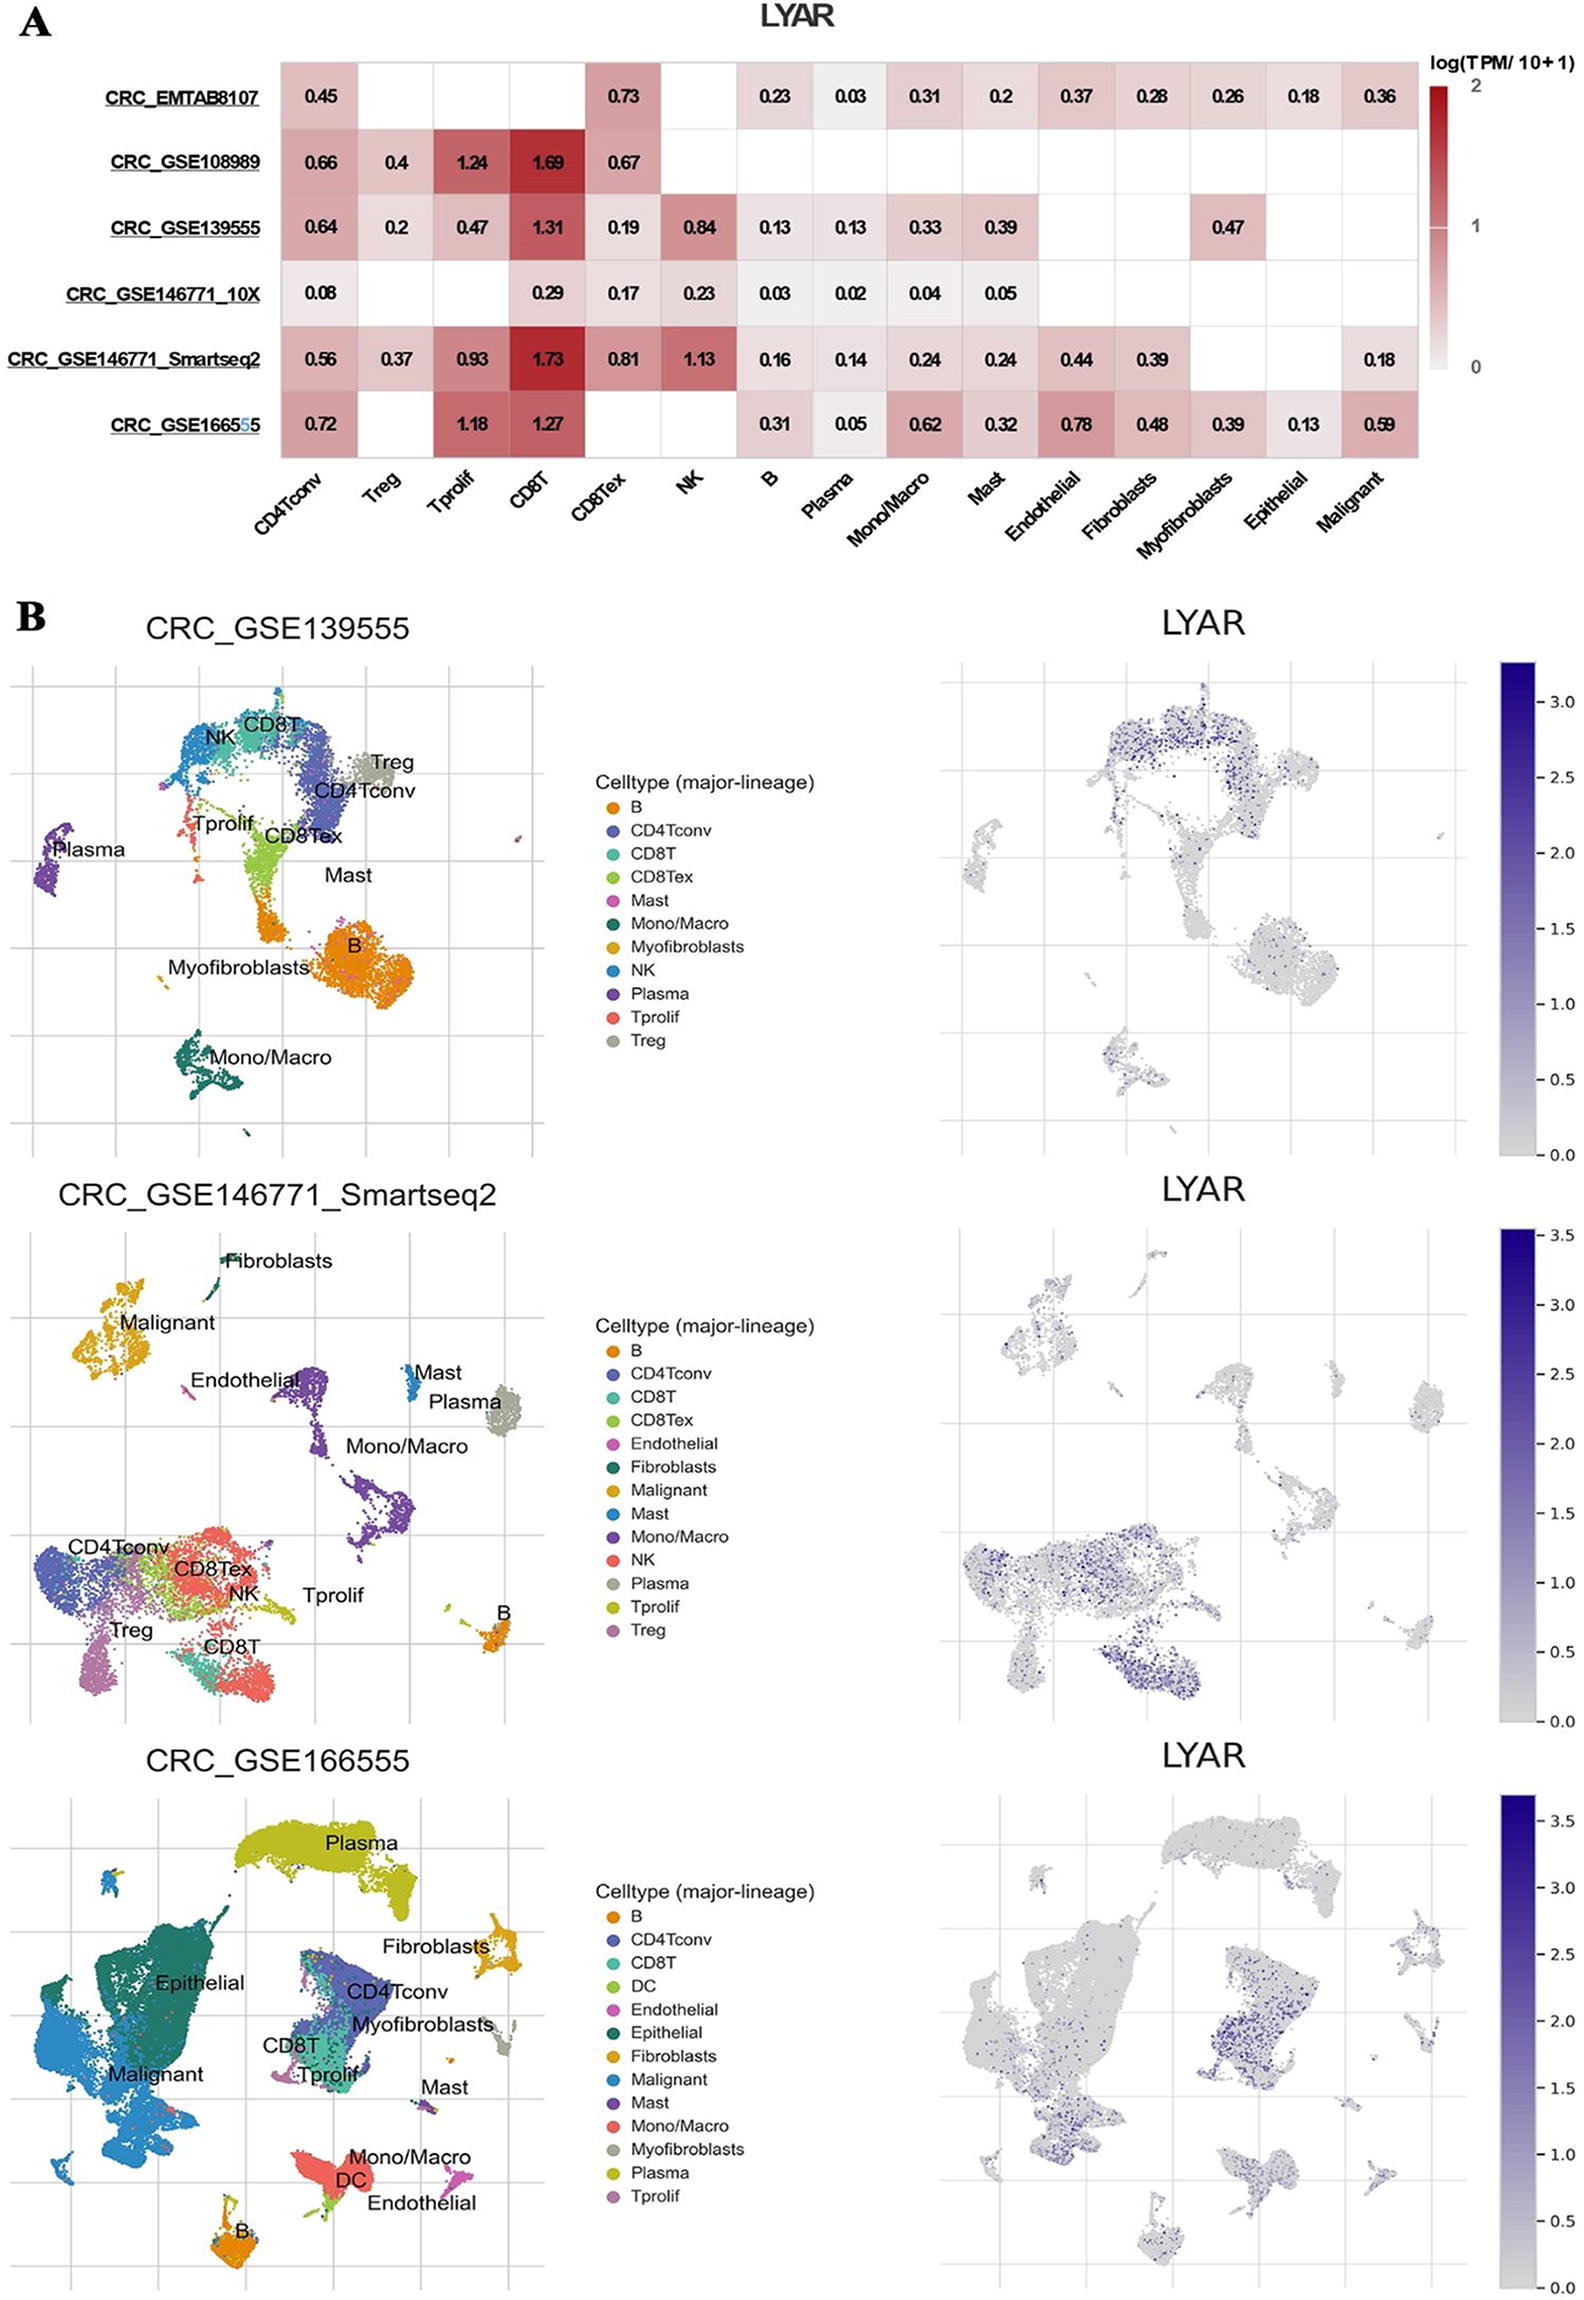
LYAR Expression in immune cells analyzed through scRNA-seq datasets.
To further elucidate LYAR expression’s effect on the TIME, we analyzed the composition of immune cells in low and high LYAR expression groups using CIBERSORT and ESTIMATE methodologies. In the high LYAR expression group, there was a notable increase in resting mast cells, M1 macrophages, activated memory CD4 T cells, and follicular helper T cells. Conversely, the low LYAR expression group exhibited a higher proportion of regulatory T cells (Tregs) and neutrophils (p < 0.05; Fig. 9B). The correlation between immune cell infiltration and LYAR mRNA expression was further explored (Fig. 9H), revealing a positive correlation with M1 macrophages, follicular helper T cells, and activated memory CD4 T cells (p < 0.05; Fig. 9C–E), whereas LYAR expression negatively correlated with the presence of Tregs and neutrophils (p < 0.05; Fig. 9F–G). ESTIMATE analysis indicated that the high LYAR expression group had lower stromal and immune scores, implying higher tumor purity (Fig. 9A). Additional findings suggested a positive correlation between LYAR expression and TMB, and higher TMB was associated with an increased likelihood of T cell recognition and improved immunotherapy outcomes (Fig. 9I).

LYAR expression and its correlation with immune cell composition, tumor mutational burden, and potential therapeutic targets in colorectal cancer (CRC).
LYAR expression impacted key cellular processes and pathways in CRC
GSEA focused on GO subsets indicated that LYAR expression predominantly enriched in the nucleolus, nuclear protein-containing complexes, and ribonucleoprotein complexes, among others (Fig. 10A). In addition, elevated LYAR levels were found to enhance RNA processing, mRNA binding, and RNA splicing and were linked to critical cellular mechanisms including the cell cycle checkpoint, DNA integrity checkpoint, and macromolecule methylation (Fig. 10B and C). Using the KEGG subset for GSEA further highlighted that increased LYAR expression impacted RNA degradation, the cell cycle, ubiquitin-mediated proteolysis, and the spliceosome, among other processes (Fig. 10D). Hallmark gene set analysis underlined that high LYAR expression correlated significantly with DNA repair, the G2M checkpoint, unfolded protein response, MYC targets V1 and V2, E2F targets, and mTORC1 signaling (p < 0.05, FDR < 0.25; Fig. 10E). This comprehensive analysis underscored the multifaceted role of LYAR in regulating crucial cellular functions and pathways in CRC.
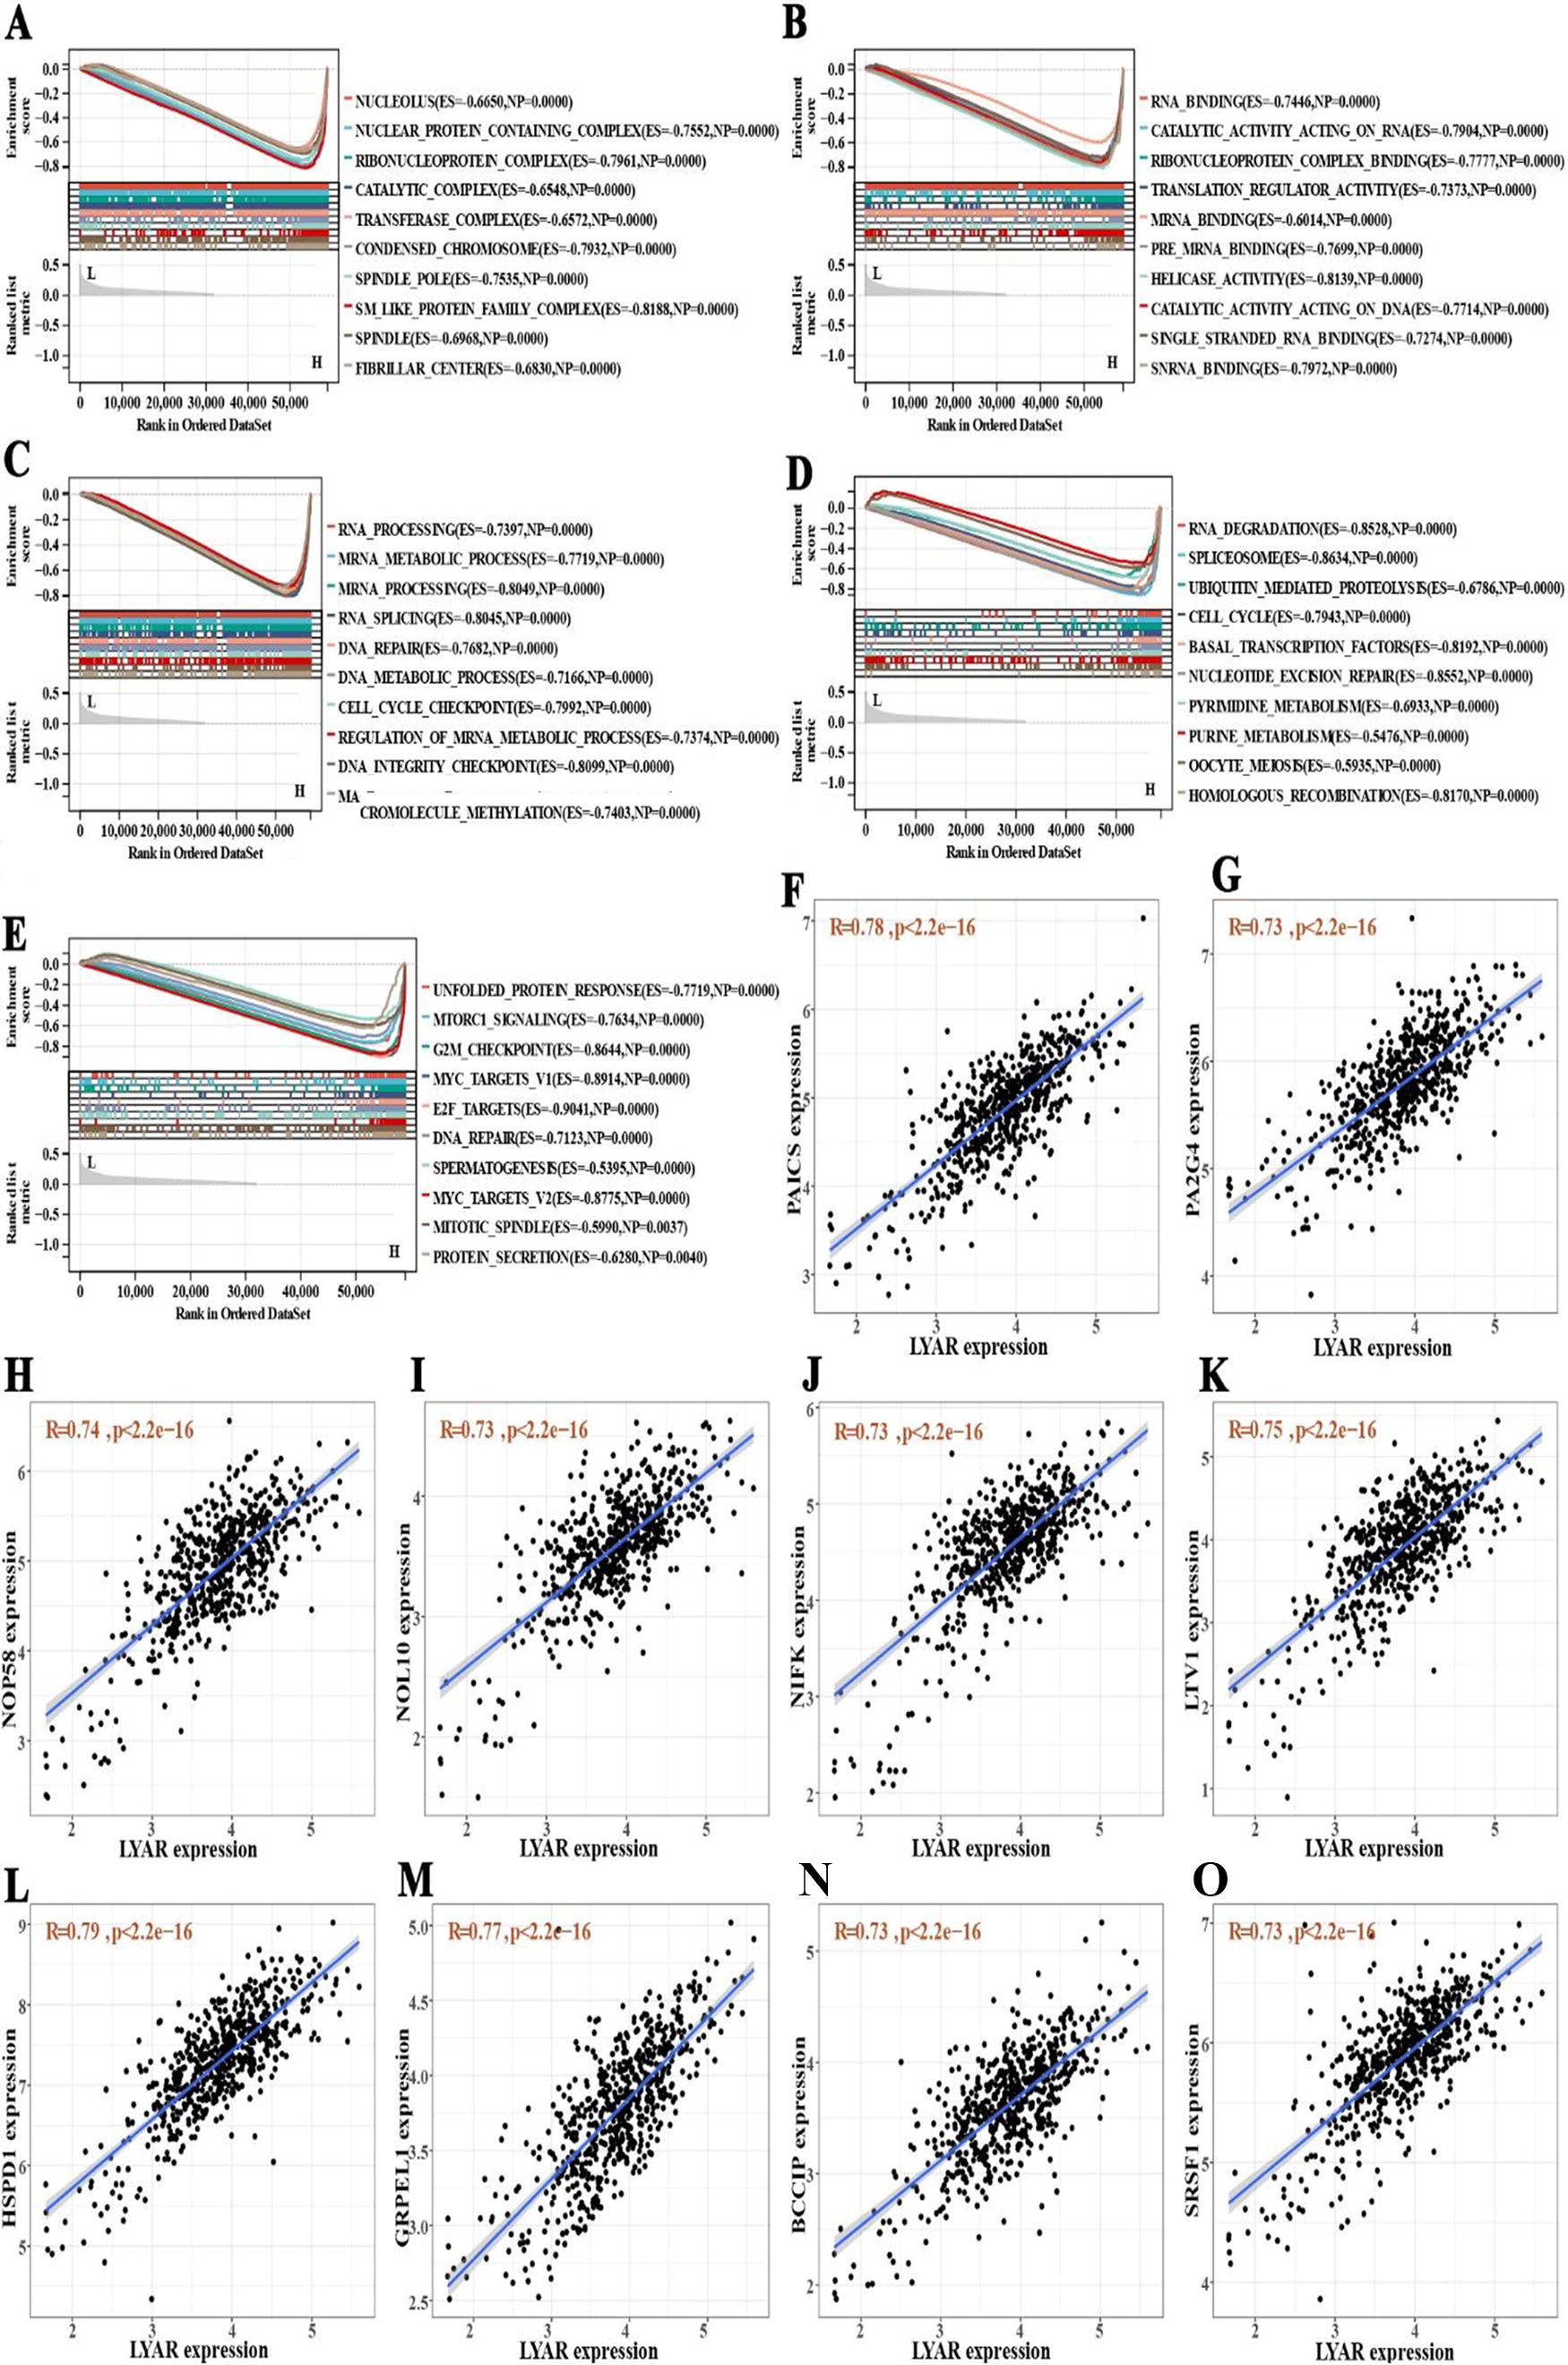
Analysis of Ly1 antibody reactive (LYAR) expression impact on cellular functions and identification of correlated genes in colorectal cancer.
Identification of LYAR-Associated genes and potential therapeutic targets for CRC
Through correlation analysis, we successfully identified 75 positively correlated genes and 38 negatively correlated genes (Supplementary Table S1). Figure 10G–P highlighted the top 10 genes exhibiting the strongest positive correlation with LYAR. Building upon these identified gene relationships, we constructed a gene list from both positively and negatively correlated genes. Using the cMap database’s query tool, we examined the similarity between our gene list and the expression profiles of the cMap database. This exploration through the cMap database led to the identification of two mTOR inhibitors, temsirolimus and WYE-354, as potential therapeutic agents for CRC treatment (Fig. 9K and L; Supplementary Table S2).
LYAR expression predicted sensitivity to cetuximab in RAS Wild-Type metastatic CRC
The European Society for Medical Oncology and the National Comprehensive Cancer Network clinical guidelines both recommend cetuximab combined with FOLFOX or FOLFIRI as the first-line treatment for patients with RAS wild-type metastatic CRC. Our analysis using the pRRophetic R package indicated that patients exhibiting high LYAR expression showed increased sensitivity to cetuximab (Fig. 9J). This finding highlighted the potential of LYAR expression as a biomarker for predicting treatment response in CRC patients.
Discussion
This study marks the first comprehensive investigation into the expression of LYAR in CRC at both the transcriptional and protein levels, using large-scale samples. We validated LYAR’s expression, examined its effects on clinicopathological characteristics and prognosis, and delved into its role in immune infiltration and biological mechanisms. Furthermore, the relationship between LYAR expression and drug sensitivity was explored, establishing LYAR’s overexpression in CRC as linked to poor prognosis and advanced disease stages. Our findings suggest LYAR plays a critical role in CRC tumorigenesis and invasion by affecting immune cell infiltration, protein translation and modification, and cell cycle processes.
As a novel transcription factor, LYAR was found to influence the generation and progression of several cancers, including neuroblastoma and lung squamous cell carcinoma. 16 LYAR has also been verified to be upregulated in CRC. However, the biological roles played by LYAR in CRC tumorigenesis, invasion, and prognosis remain undefined.
Initially, we confirmed LYAR’s elevated expression in CRC through pooled analysis of 1,356 CRC samples and 925 non-CRC colorectal tissue samples. Cox analysis and Kaplan–Meier curves revealed that patients with higher LYAR mRNA and protein levels faced significantly worse outcomes, positioning LYAR as a potential prognostic marker for CRC. Moreover, CRC patients with higher LYAR expression tended to present with more advanced tumor stages, indicating LYAR’s role in promoting disease progression. Therefore, we further explored the biological mechanisms and immune infiltration of LYAR in CRC.
Subsequently, the immune infiltration analysis confirmed that the expression of LYAR was positively linked with the infiltration of M1 macrophages. Tumor-associated macrophages occupy a high proportion in tumor microenvironment. The M1 type and M2 type of tumor-associated macrophages can be classified depending on their functions, and the main type of tumor-associated macrophages is M2 type macrophages. 17,18 Polarization of macrophages has been demonstrated to influence tumorigenesis and progression. 19 M2 macrophages promote tumor development and suppress immunity. 20 Contrary to the function of M2 type macrophages, M1 macrophages inhibit tumor growth, invasion, and metastasis and are associated with better immunotherapy response. 21 In addition, analysis of scRNA-seq data confirmed that LYAR was mainly expressed in CD8 T cells. The group with high LYAR expression tended to have more CD8 T cell infiltration. And LYAR expression was also positively correlated with TMB. Therefore, upregulation of LYAR expression may lead to better immunotherapy response.
The GSEA analysis based on GO and KEGG subsets suggests that high expression of LYAR mainly involve in RNA processing, mRNA metabolic processing, cell cycle checkpoint, DNA integrity checkpoint, and macromolecule methylation. In addition, the results of GSEA using the hallmarks gene set demonstrated that the high LYAR expression group was enriched in DNA repair, the G2M checkpoint, unfolded protein response, MYC targets V1 and V2, E2F targets, and mTORC1 signaling. The DNA damage checkpoint in G2/M-phase can make the cell with DNA damage unable to enter the M phase to complete mitosis by cell cycle delay or arrest. 22 Aberrations in checkpoint mechanisms cause the persistent proliferation of cells and result in tumorigenesis. 23 Inducing G2/M cell cycle arrest can exert tumor suppressive effects in CRC. 24 MYC is a nuclear transcription factor with a critical impact on cell proliferation, metabolism, apoptosis, tumorigenesis, and drug resistance of tumor. 25 –27 Promoting MYC expression is reported to enhance CRC cell proliferation. 28 The upregulation of E2F7 expression has also been demonstrated to promote CRC tumorigenesis and progression. 29 According to Liu et al., blockage of the E2F1/TS pathway can significantly increase the drug susceptibility of human 5-fu-resistant CRC cells to 5-fluorouracil while inhibiting the proliferation of CRC cells. 30 In addition, it has been demonstrated that mTOR is essential for cell growth, apoptosis, autophagy, tumorigenesis, metabolism, and TIME. 31 Hence, we suggest that LYAR is involved in tumor generation and the progression of CRC by regulating the biological processes and cellular pathways described above. Results from the cMap database also suggested that two mTOR inhibitors were promising therapeutic drugs for CRC, including temsirolimus and WYE-354.
In conclusion, this study identifies LYAR as a novel prognostic marker for CRC, elucidating its influence on cellular pathways, immune infiltration, and biological processes involved in CRC carcinogenesis and invasion. Although providing new research directions and a theoretical basis for CRC studies, the absence of cell and animal models to validate LYAR’s biological mechanisms in CRC remains a limitation, necessitating further experimental investigations.
Conclusion
LYAR has an important impact on the tumorigenesis and progression of CRC. LYAR is expected to be a prognostic marker of CRC.
Footnotes
Acknowledgment
The technical assistance given by Guangxi Key Laboratory of Medical Pathology is gratefully appreciated by all authors.
Authors’ Contributions
J.-Y.W. and H.-Q.H. contributed to the drafting of this study and performed most data statistics. Y.-F.P., Y.-Y.P., and H.L. analyzed clinical data and wrote the article. Y.-L.T., D.-M.L., Y.-W.D., D.-T.Z., and W.-J.H. operated experiments and analyzed the immunohistochemical results. L.-M.L., J.-H.Z., and G.C. designed this study and modified the article.
Ethical Approval
This study has received the approval from the First Affiliated Hospital of Guangxi Medical University’s ethics committee [Approval Number: NO.2022-KY-E (047)].
Data Availability Statement
When necessary, you could get in touch with the corresponding author to get the pertinent data needed for this study.
Disclosure Statement
No conflict of interest.
Funding Information
This study is supported by Guangxi Medical University Youth Science Foundation (GXMUYSF202423), Guangxi Educational Science Planning Key Project (2021B167), Guangxi Zhuang Autonomous Region Health Commission Self-financed Scientific Research Project (Z20210442, Z20190406), The First Affiliated Hospital of Guangxi Medical University Provincial and Ministerial Key Laboratory Cultivation Project: Guangxi Laboratory of Enhanced Recovery after Surgery for Gastrointestinal Cancer (No.YYZS2020003), Guangxi Zhuang Autonomous Region Health Commission Self-financed Scientific Research Project of Western Medicine Category (Z-A20220415), and Guangxi Medical University Future Academic Star (WLXSZX20085).
Supplementary Material
Supplementary Table S1
Supplementary Table S2
References
Supplementary Material
Please find the following supplemental material available below.
For Open Access articles published under a Creative Commons License, all supplemental material carries the same license as the article it is associated with.
For non-Open Access articles published, all supplemental material carries a non-exclusive license, and permission requests for re-use of supplemental material or any part of supplemental material shall be sent directly to the copyright owner as specified in the copyright notice associated with the article.