
Abstract
Background:
Osteosarcoma (OS) is undeniably a formidable bone malignancy characterized by a scarcity of effective treatment options. Reprogramming of amino acid (AA) metabolism has been associated with OS development. The present study was designed to identify metabolism-associated genes (MAGs) that are differentially expressed in OS and to construct a MAG-based prognostic risk signature for this disease.
Methods:
Expression profiles and clinicopathological data were downloaded from Gene Expression Omnibus (GEO) and UCSC Xena databases. A set of AA MAGs was obtained from the MSigDB database. Differentially expressed genes (DEGs) in GEO dataset were identified using “limma.” Prognostic MAGs from UCSC Xena database were determined through univariate Cox regression and used in the prognostic signature development. This signature was validated using another dataset from GEO database. Gene Ontology, Kyoto Encyclopedia of Genes and Genomes, single sample gene set enrichment analysis, and GDSC2 analyses were performed to explore the biological functions of the MAGs. A MAG-based nomogram was established to predict 1-, 3-, and 5-year survival. Real-time quantitative polymerase chain reaction, Western blot, and immunohistochemical staining confirmed the expression of MAGs in primary OS and paired adjacent normal tissues.
Results:
A total of 790 DEGs and 62 prognostic MAGs were identified. A MAG-based signature was constructed based on four MAGs: PIPOX, PSMC2, SMOX, and PSAT1. The prognostic value of this signature was successfully validated, with areas under the receiver operating characteristic curves for 1-, 3-, and 5-year survival of 0.714, 0.719, and 0.715, respectively. This MAG-based signature was correlated with the infiltration of CD56dim natural killer cells and resistance to several antiangiogenic agents. The nomogram was accurate in predictions, with a C-index of 0.77. The expression of MAGs verified by experiment was consistent with the trends observed in GEO database.
Conclusion:
Four AA MAGs were prognostic of survival in OS patients. This MAG-based signature has the potential to offer valuable insights into the development of treatments for OS.
Introduction
Osteosarcoma (OS) remains the most common type of primary bone malignancy, presenting a poor prognosis. 1 In 1970s, the development of high-intensity combination chemotherapy and advanced surgical techniques enhanced 5-year survival rates from 20% to ∼60%. 1,2 Nevertheless, despite recent clinical trials evaluating the effectiveness of various molecular-targeted therapies and immune checkpoint inhibitors (ICIs), the overall response among OS patients remains relatively unsatisfactory. 3 –6 As an illustration, the well-known SARC028 study demonstrated that only 1 out of 22 (5%) OS patients achieved a partial response, indicating a limited response to ICIs. 6 Consequently, the quest to better understand and address OS necessitates a fresh and innovative perspective.
Cancer cell proliferation is driven by heightened nutritional and biosynthetic requirements. To fulfill these demands, particularly within a hypoxic and nutrient-restricted microenvironment, malignant cells frequently undergo metabolic alterations, a characteristic feature of cancer referred to as “metabolism reprogramming.” 7 Amino acids (AAs) not only serve as the basis of protein synthesis but also provide intermediate metabolites in glycogenesis and the tricarboxylic acid (TCA) cycle. 8 AAs also play crucial roles in cancer, by participating in the maintenance of redox homeostasis, energy generation, biomass production, epigenetic modification, drug resistance, and immune escape. 8 –10 AA metabolism reprogramming is involved in multiple types of cancers, including pancreatic ductal adenocarcinoma, 11,12 breast cancer, 13,14 leukemia, 15 glioblastoma, 16 melanoma, 17 nonsmall cell lung cancer (NSCLC), 18 and OS. 19,20
Dysregulated AA metabolism has been observed in various types of cancer, involving AAs like glutamine (Gln), methionine (Met), and branched-chain amino acids (BCAAs) such as valine, leucine, and isoleucine. Gln serves as a critical source of amide (γ) nitrogen for nucleotide biosynthesis, α-ketoglutarate (α-KG) in the TCA cycle, and glutathione, which plays a role in maintaining redox balance. These metabolic alterations are key factors contributing to the development and progression of cancer. 14,21 Met plays a crucial role in one-carbon metabolism and can be converted into S-adenosyl methionine (SAM), a molecule involved in epigenetic modifications through nucleic acid methylation. 22 In contrast, BCAAs, including valine, leucine, and isoleucine, have regulatory roles in mitochondrial acetyl-coenzyme A (acetyl-CoA) and succinyl-CoA metabolism. 23 In addition, BCAAs can activate the mechanistic target of rapamycin complex 1 (mTORC1). 24 Abnormal mTORC1 activation is associated with uncontrolled tumor cell proliferation and tumor progression. Therefore, targeting the metabolic reprogramming of AAs holds promise as a therapeutic approach for various malignancies.
The prevalence of AA metabolism reprogramming in OS suggests that targeting metabolic changes could be a potential therapeutic strategy. 19,25 Advances in high-throughput next-generation sequencing and gene chip technology have transformed transcriptomic research. In addition, bioinformatics has emerged as a powerful tool for deciphering molecular mechanisms and identifying biomarkers for cancer diagnosis and prognosis. Consequently, this study conducted a comprehensive and systematic analysis of AA metabolism-associated genes (MAGs) using RNA-sequencing (RNA-seq) data from the UCSC Xena database and array expression profiles from the Gene Expression Omnibus (GEO) database. A multigene model was constructed to predict the prognosis of OS patients, along with a nomogram that incorporates this multigene signature and clinical patient characteristics. Furthermore, the expression of these identified AA MAGs was confirmed in primary tissue samples from OS patients. Collectively, these results offer the potential for risk quantification and a deeper comprehension of AA metabolism reprogramming in individuals with OS.
Materials and Methods
Data collection
Transcriptomic and clinicopathological data of patients with OS were downloaded from UCSC Xena. RNA-seq expression profiles were from GDC Target-OS; and clinical annotation files were from Xena Target-OS Hub. Eighty-five patients with intact phenotype and survival data were enrolled; their clinicopathological features are shown in Supplementary Table S1.
Two OS data sets, GSE19276_GPL6848 and GSE16102_GPL96, were downloaded from the GEO database (https://www.ncbi.nlm.nih.gov/geo/). Expression data from the GSE19276_GPL6848 dataset, which included 44 OS and five normal tissue specimens, were examined by the “limma” function. Data from the GSE16102_GPL96 dataset were used for validation. Empty probes, probes corresponding to multiple genes, and multiple probes corresponding to the same gene were deleted.
MAGs were collected from the Molecular Signature Database v7.5.1 (MSigDB). A total of 374 genes were obtained from REACTOME_METABOLISM_OF_AMINO_ACIDS_AND_DERIVATIVES.
Identification of differentially expressed MAGs and construction of a MAG-based prognostic signature
Differentially expressed genes (DEGs) in OS and normal tissues from the GSE19276_GPL6848 dataset were identified using the R package “limma.” Fold change (FC) of >1.5 and adjusted p of <0.05 were defined as the cutoff values.
Univariate Cox regression was used to screen candidate prognostic MAGs using GDC Target-OS; multivariate Cox regression was used to calculate the weight coefficient of each candidate gene for model construction. To obtain larger numbers of prognostic MAGs, genes with p < 0.1 were selected for further analysis. 26,27 The outcomes were presented as hazard ratios (HRs) and 95% confidence intervals (CIs).
MAG-based prognostic signatures were shown as risk scores, which were calculated using the formula: SCORE = ∑βi *χi , where βi is the weight coefficient of each gene, and χi is its expression level. Based on the median risk score, patients were divided into high-risk and low-risk groups. Differences in survival between the two groups were analyzed using the “survminer” package and Kaplan–Meier analyses. Time-dependent receiver operating characteristics (tdROC) curves were determined, and the predictive accuracy of prognostic models was evaluated by calculating the area under the curve (AUC) using the “timeROC” package.
The test cohort (GSE16102_GPL96) was analyzed to verify the prognostic value, with the risk scores for each patient calculated as described. Survival and predictive value were analyzed as described above.
Enrichment analysis of the prognostic MAGs
Representative biological functions and potential pathways of candidate prognostic MAGs were evaluated by Gene Ontology (GO) enrichment analysis and Kyoto Encyclopedia of Genes and Genomes (KEGG) pathway analysis using the R package “clusterProfiler.” The parameters used were pvalueCutoff = 0.05, pAdjustMethod = “BH,” and qvalueCutoff = 0.2.
Development and validation of a prognostic nomogram based on MAG signature and clinicopathological features
Clinicopathological features (Supplementary Table S1) and MAG scores significantly predictive of survival outcomes were calculated using univariate and multivariate Cox analyses. Factors significantly predictive of survival were integrated into the nomogram, as described using the R packages “rms” and “survival.” 28 The discriminatory ability of the nomogram was determined by calculating the Harrell concordance index (C-index), calibration curves, and AUC of tdROC using the R packages “rms,” “pec,” “dplyr,” and “timeROC.” The nomogram was validated using the GSE16102_GPL96 dataset.
The distribution of risk scores across clinicopathological features was determined to further explore the independence of the prognostic model.
Correlations between risk score and immune cell infiltration
Despite clinical trials showing that ICIs are ineffective in OS patients, studies have suggested that nonspecific immune cells and abundant genomic changes may be used in immunotherapy for OS. 29 Thus, the correlation between risk score and immune cell infiltration was investigated using the R package “estimate” and single sample gene set enrichment analysis (ssGSEA).
The immune-stromal component in the tumor microenvironment (TME) was calculated using the ESTIMATE algorithm of the “estimate” package. Three types of scores were calculated: ImmuneScore, StromalScore, and ESTIMATEScore. Differences in immune-stromal scores between the two risk score groups were compared using the Pearson test.
The relative infiltration of 28 immune cell types in the TME was calculated using ssGSEA and the parameters kcdf = “Gaussian”, method = “ssgsea”, abs.ranking = FALSE, min.sz = 2, and ssgsea = TRUE.
Assessment of risk group responses to antitumor agents
The responses of OS patients to antitumor agents were assessed using the R package “oncoPredict,” as described by the Genomics of Drug Sensitivity in Cancer 2 dataset (GDSC2). Combined with the expression data in the training set (Target-OS), the log(IC50) of each drug in the GDSC2 dataset and its relationship to risk score were calculated using the R package “oncoPredict.”
Real-time quantitative PCR
Ten OS tissues and paired normal tissues were obtained from patients who underwent surgery at Union Hospital, Tongji Medical College, Huazhong University of Science and Technology. The clinicopathological features of these patients are shown in Supplementary Table S2.
Total RNA was extracted from ten patients' tissues using Trizol Reagents (T9424; Sigma, USA). Reverse transcription assay was conducted with HiScript III RT Super Mix (+gDNA wiper) (R323; Vazyme, China). Real-time quantitative polymerase chain reaction (RT-qPCR) was performed on a StepOnePlus Real-Time PCR System (Thermo Fisher Scientific, USA) using ChamQ SYBR qPCR Master Mix (q311; Vazyme) to amplify cDNA for 40 cycles. Relative mRNA levels were normalized ACTB mRNA using the ΔΔCt method. The sequence of each primer is listed in Supplementary Table S3. All primers in the study were synthesized by Comate Bioscience Co. Ltd.
Western blot analysis
Protein samples from five patients' tissues were prepared using RIPA lysis buffer (P0013; Beyotime, China) and resolved by SDS-PAGE. The concentrations of proteins were detected by BCA Kit (P0010; Beyotime). Protein lysates were then separated in 8% or 10% sodium dodecyl sulfate–polyacrylamide gels according to the protein molecular weight and then transferred to polyvinylidene fluoride (PVDF) membranes. Western blots were performed under standard conditions using the primary antibodies, including PSMC2 (14905; Proteintech Group, USA), SMOX (15052; Proteintech Group), and PSAT1 (10501; Proteintech Group). After incubation with the appropriate secondary antibodies conjugated to horseradish peroxidase (HRP), protein expression visualization was conducted using an ultrasensitive ECL luminescence reagent (MA0186; Dalian Meilun Biotechnology Co. Ltd., China) with an infrared imaging system (UVP ChemiDoc-It 510; Thermo Fisher Scientific, USA).
Immunohistochemical staining
Samples were immunohistochemically stained with specific antibodies to identify the protein levels of two MAGs that were elevated in OS (PSMC2 and PSAT1). Tissue samples were sent to Wuhan Servicebio Co. Ltd. for paraffin embedding and serial sectioning. After deparaffinization, antigen retrieval, blockage of endogenous peroxidase activity, and serum sealing, the sections were incubated overnight at 4°C with primary antibodies to PSMC2 (14905; Proteintech Group) and PSAT1 (67619; Proteintech Group). The samples were subsequently incubated with a secondary antibody conjugated to HRP and stained with DAB (brownish yellow), and nuclei were counterstained with hematoxylin (blue).
Statistical analyses
Statistical analyses and visualization were performed by R 4.1.1 software (R core team, Austria), Origin 9.9 (OriginLab Corporation, USA), and GraphPad Prism 7.0.0 (GraphPad Software, USA). Differences among the paired groups were compared using the Wilcoxon test. Kaplan–Meier curves were compared using the log-rank test. The sensitivity and specificity of the signature score were evaluated using ROC analysis; the accuracy of prediction was determined by AUC. If not otherwise stated, p < 0.05 was considered statistically significant.
Ethical statement
This study was conducted in accordance with the Declaration of Helsinki (as revised in 2013). The study was approved by the Ethics Committee of Union Hospital, Tongji Medical College, Huazhong University of Science and Technology [No. 2022 (0032)]. Written informed consent was obtained from the adult patients and the parents of juvenile patients included in the study.
Results
Differentially expressed MAGs
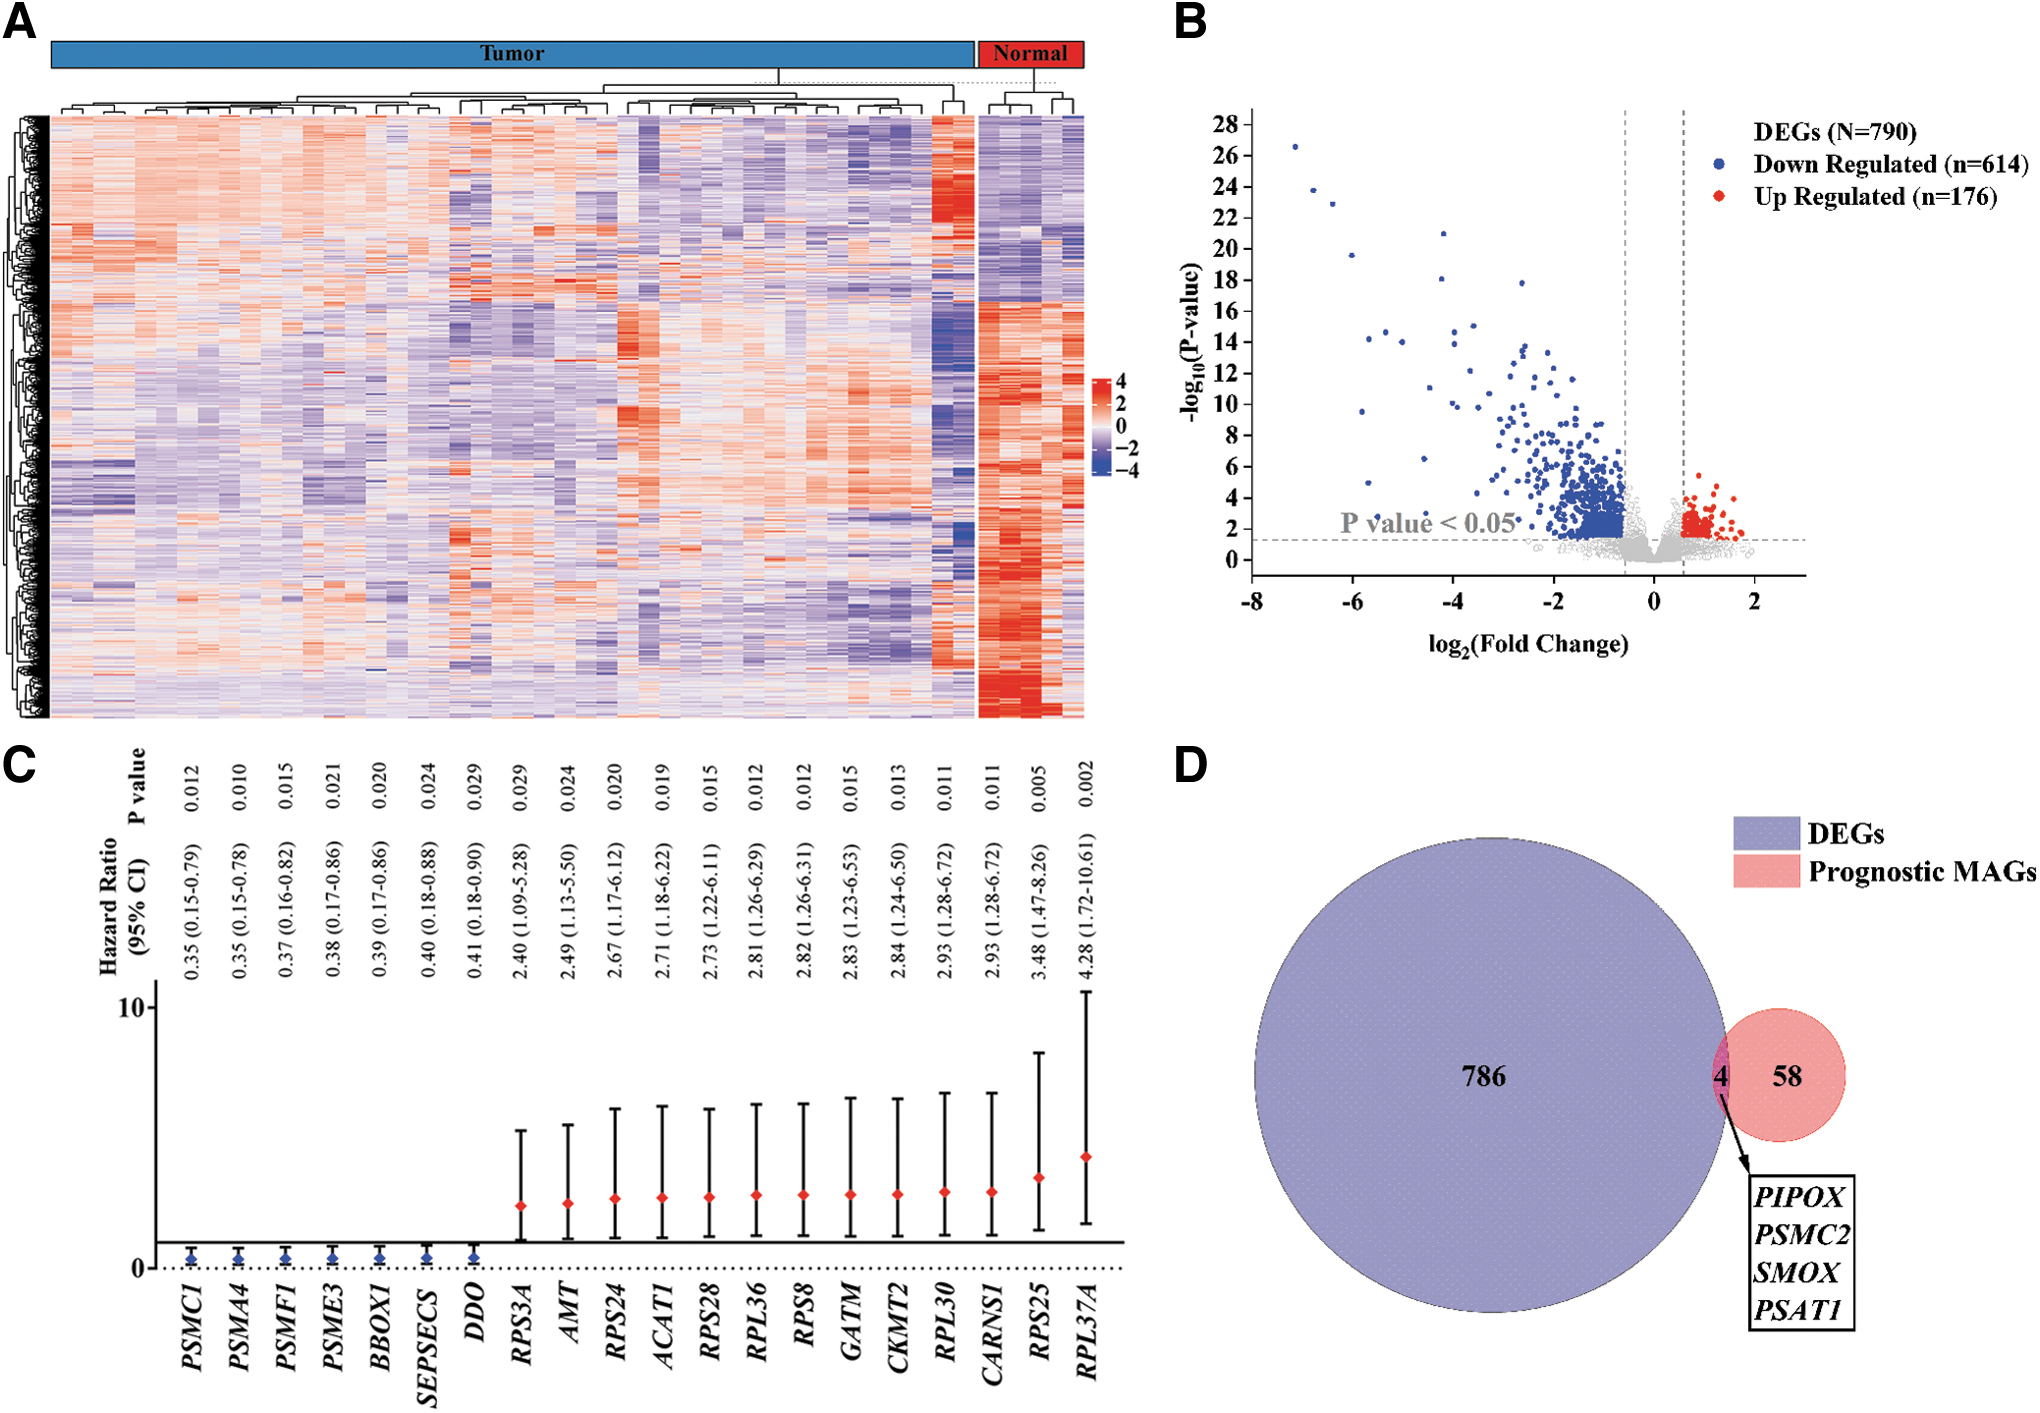
A comparison of gene expression in OS and normal tissue samples from the GEO dataset (GSE19276_GPL6848) identified 790 DEGs, including 176 upregulated and 614 downregulated genes in OS samples (Fig. 1A, B). The detailed differences in the expression of these 790 genes in OS and normal tissue are shown in Supplementary Table S4.
Differentially expressed MAGs in OS.
Evaluation of the MSigDB AA metabolism gene set (REACTOME_METABOLISM_OF_AMINO_ACIDS_AND_DERIVATIVES) identified 374 MAGs. These 374 genes were matched with those in the Target-OS dataset and correlated with patient survival data for univariate Cox analysis. Sixty-two MAGs were considered potentially prognostic (p < 0.1; Fig. 1C). A Venn diagram showed prognostic MAGs that were both differentially expressed and had prognostic significance in OS tissues (Fig. 1D). Four key MAGs were identified and integrated into a prognostic signature for OS.
Prognostic value of the four-gene signature
A forest map based on univariate COX regression analysis was generated (Fig. 2A), showing that two of the identified genes, PIPOX, encoding pipecolic acid and sarcosine oxidase, and PSMC2, encoding proteasome 26S subunit (ATPase 2), were considered protective factors with HR <1. The other two genes, SMOX, encoding spermine oxidase, and PSAT1, encoding phosphoserine aminotransferase 1, were regarded as risk factors with HR >1. Kaplan–Meier analysis also showed that these four MAGs were significantly associated with prognosis in OS patients (Fig. 2B). Specifically, higher levels of SMOX and PSAT1 expression were associated with poorer survival, whereas higher levels of PIPOX and PSMC2 expression were associated with improved survival.

Prognostic value of key MAGs.
A multivariate Cox regression analysis was performed to calculate the weight coefficient of each of these four MAGs for model construction. The prognosis score for each patient was calculated using the formula: SCORE = (0.1854 × expression of PSAT1) + (0.4144 × expression of SMOX) + (−0.263 × expression of PIPOX) + (−0.8096 × expression of PSMC2).
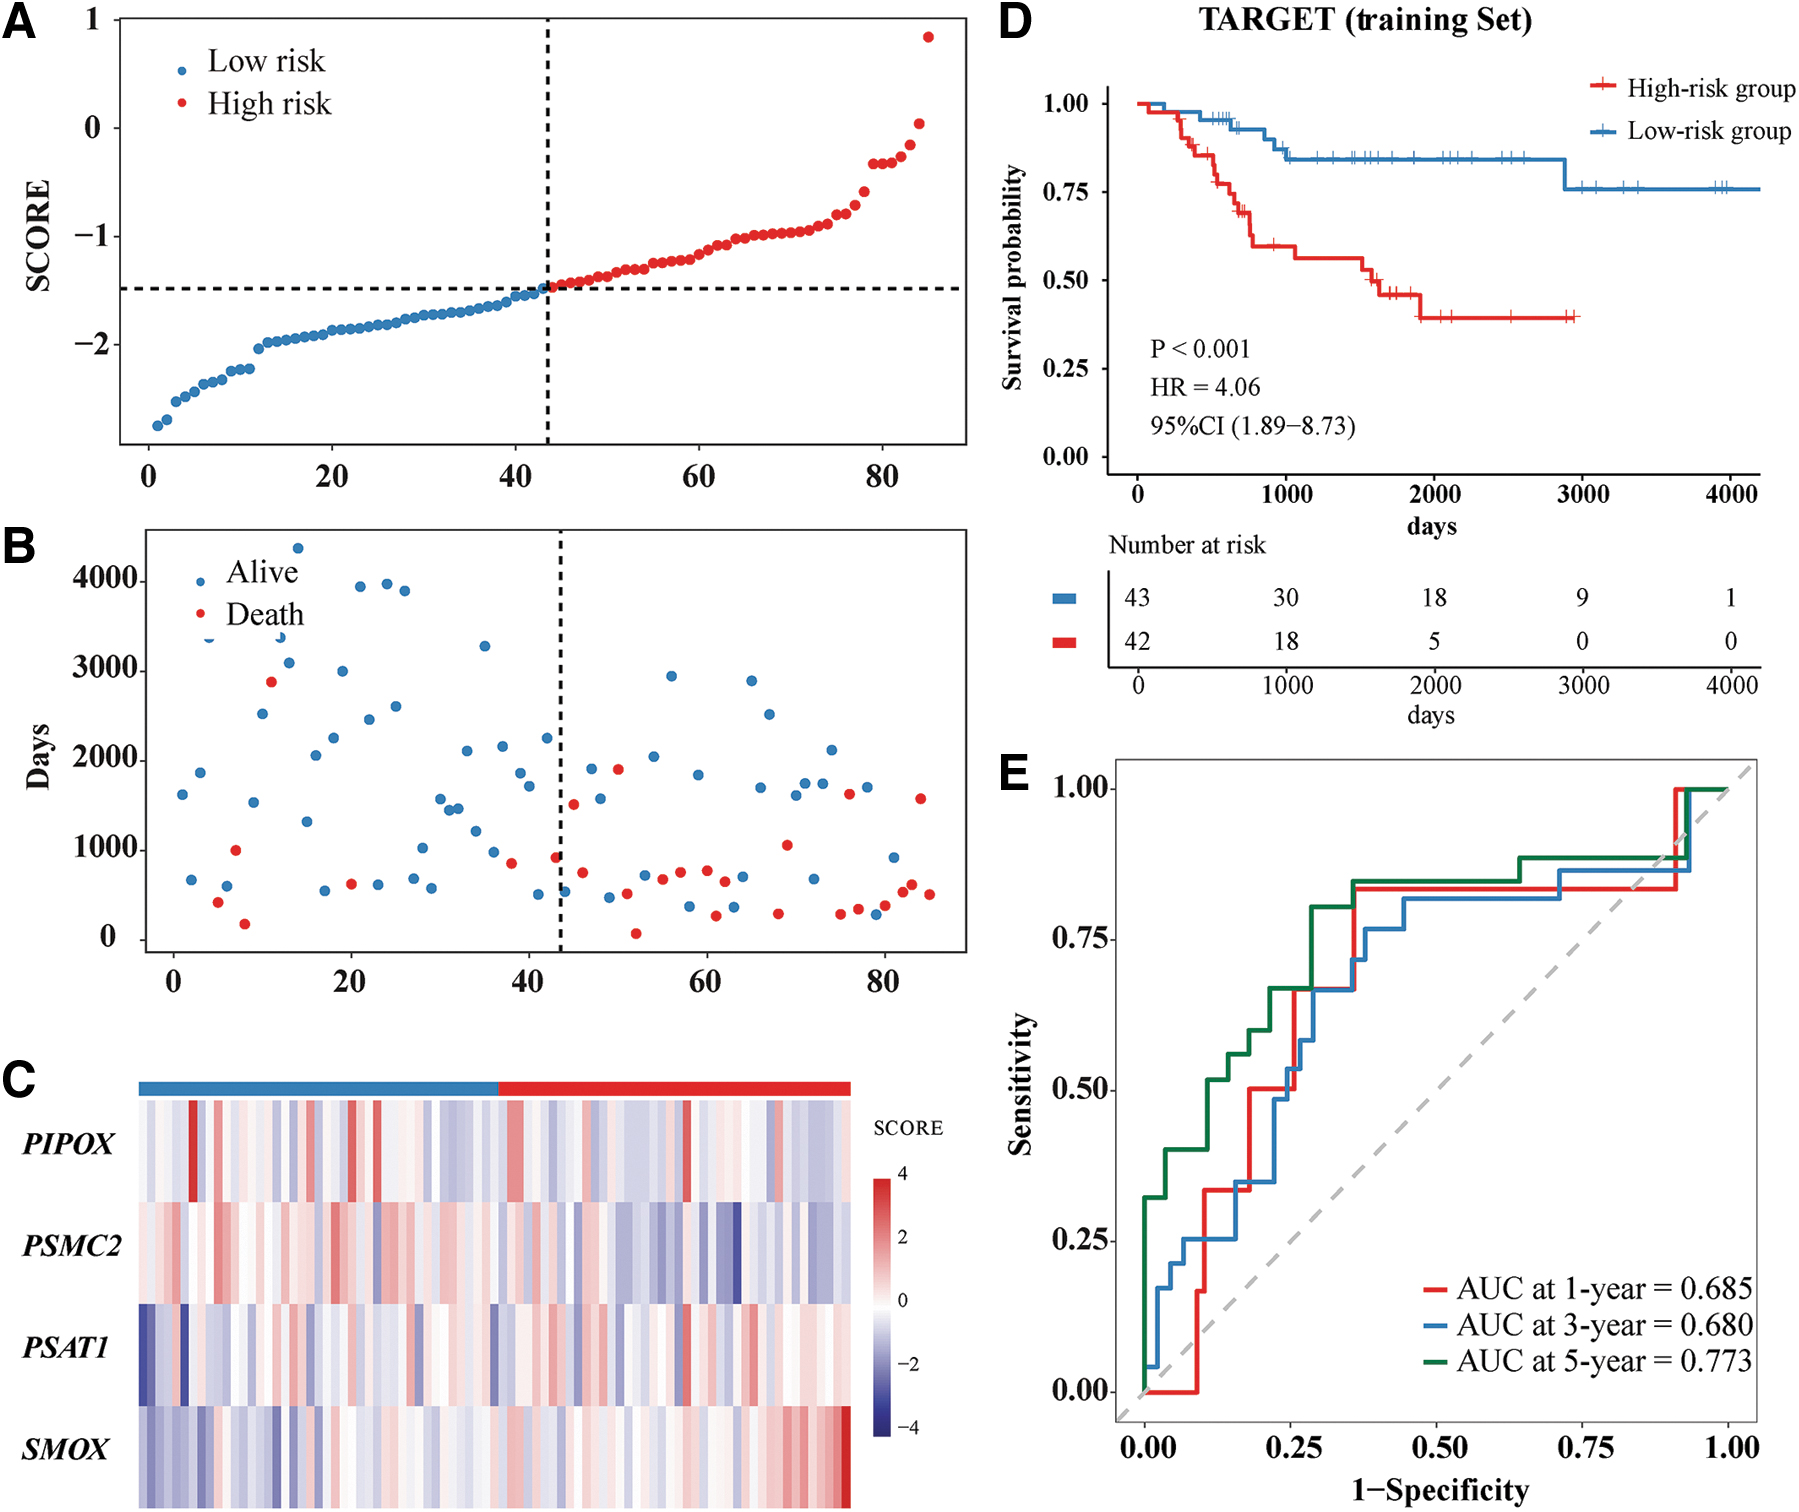
The SCORE for each OS patient in the training set (Target-OS) was calculated, and the median SCORE was determined. Based on the median score, 85 OS patients could be divided into a high-risk group containing 42 patients and a low-risk group containing 43 patients. The SCORE (Fig. 3A), survival status (Fig. 3B), and prognostic signature expression (Fig. 3C) were calculated. Kaplan–Meier analysis showed that survival was significantly poorer in the high-risk group (Fig. 3D). Moreover, the AUCs of the SCORE model for 1-, 3-, and 5-year survival were 0.685, 0.680, and 0.773, respectively, indicating that this model had acceptable predictive accuracy (Fig. 3E).
Construction of the prognostic signature based on MAGs in the Target-OS cohort.
To assess the stability of the SCORE model, it was used to evaluate the test set (GSE16102_GPL96). Based on the median score, the high-risk and low-risk groups each contained 17 patients. Their SCORE distribution (Fig. 4A), survival status (Fig. 4B), and prognostic signature expression (Fig. 4C) were calculated. Consistent with results derived from the Target-OS, patients in the high-risk group had poorer survival outcomes (Fig. 4D). The AUCs for 1-, 3-, and 5-year survival were 0.714, 0.719, and 0.715, respectively (Fig. 4E), in good agreement with the AUCs in the Target-OS dataset.

Validation of the prognostic signature based on MAGs in the GSE16102_GPL96 cohort.
Functional enrichment analyses
To further understand the potential functional implications of the prognostic signature based on four MAGs, the latter were subjected to GO and KEGG analyses (Fig. 5). The GO results indicated that the four MAGs were mainly distributed under the categories “proteasome regulatory particles” and “proteasome accessory complexes” (CC, cellular component). These MAGs were associated with the molecular function (MF) category “oxidoreductase activity” and the biological process (BP) “alpha-amino acid metabolic process” and “cellular amino acids.” KEGG enrichment analysis showed that these four MAGs were mainly associated with signaling pathways associated with “glycine, serine, and threonine metabolism” and “beta-alanine metabolism.”
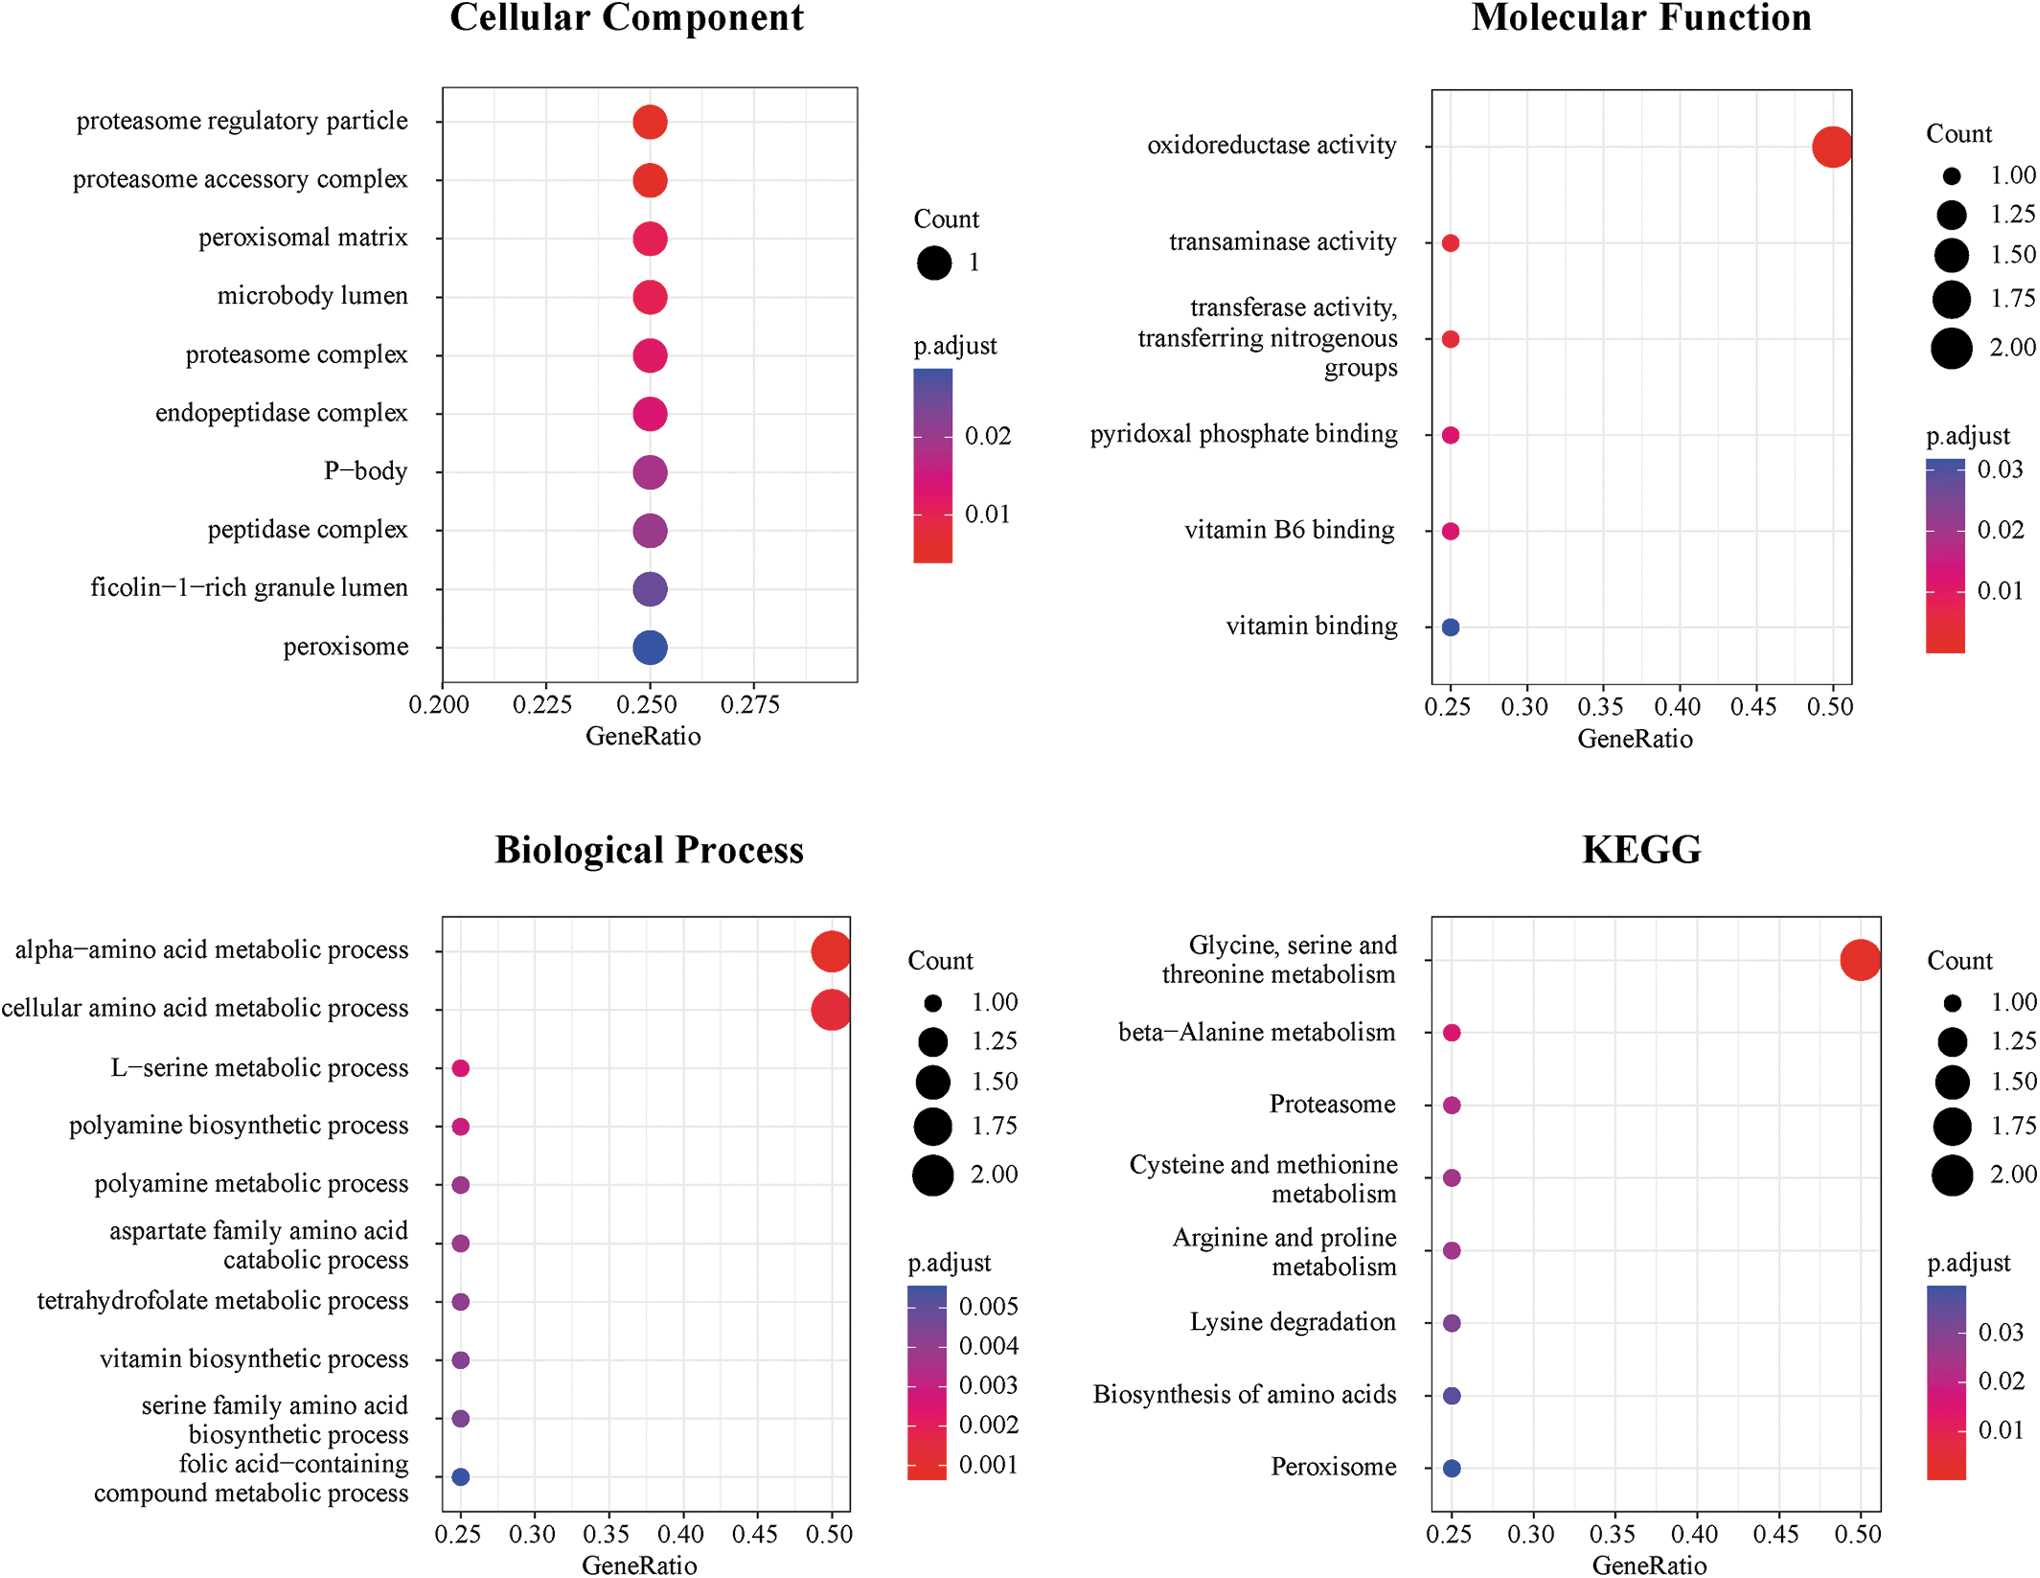
GO and KEGG enrichment analysis of the prognostic MAGs. GO enrichment analysis includes cellular component, molecular function, and biological process. GO, Gene Ontology; KEGG, Kyoto Encyclopedia of Genes and Genomes.
Predictive nomogram and evaluation
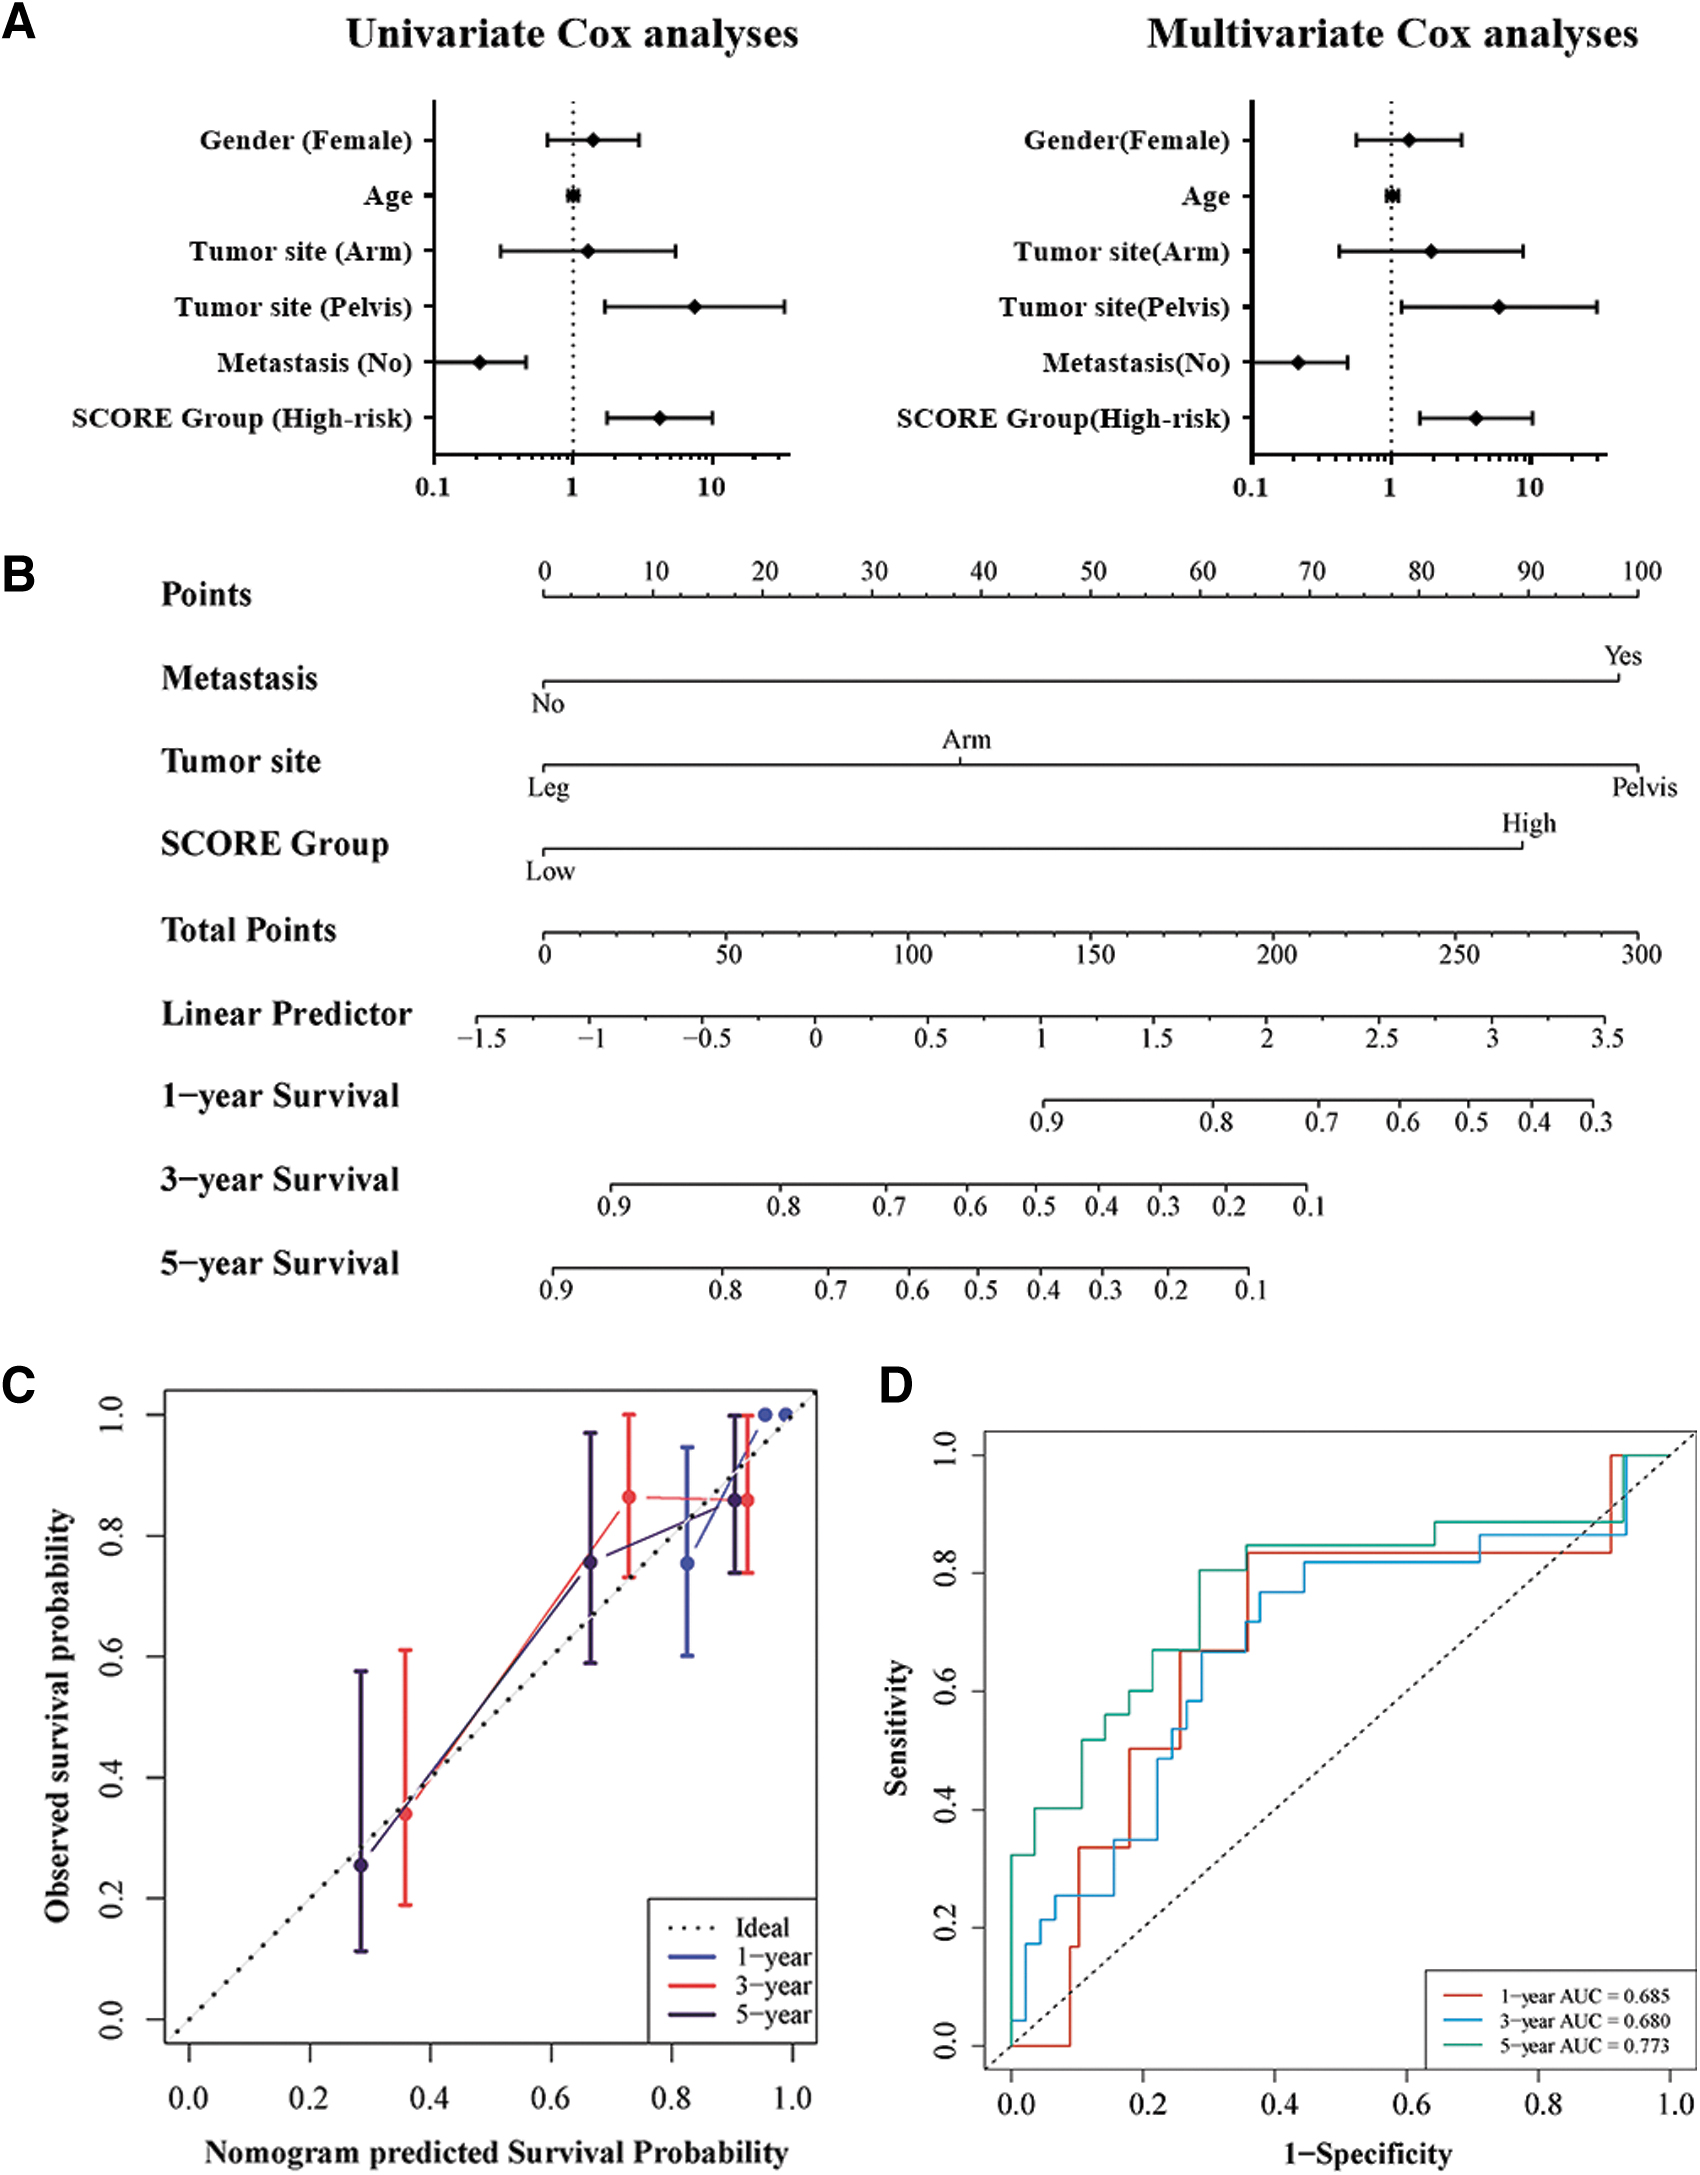
Univariate and multivariate COX analyses were performed to evaluate the predictive values of risk group and clinicopathologic features, including age, gender, tumor site, and metastasis (yes/no). Because of the general absence of metastases in included patients and the lack of tumor stage data, these variables were not included in the analyses. The factors such as pelvic site, metastasis, and high-risk group were independently indicative of poor prognosis in OS patients (p < 0.05 each; Table 1 and Fig. 6A). These factors were subsequently integrated to build a predictive nomogram model. This nomogram assigned a score to each prognostic factor and calculated the total number of points, enabling the determination of the estimated survival times at 1, 3, or 5 years for individual patients (Fig. 6B). A higher total point score correlated with worse patient survival.
Construction and validation of the predictive nomogram.
Univariate and Multivariate Cox Analyses of Prognostic Clinicopathological Factors for Overall Survival in Xena Target-OS Hub
p < 0.05.
CI, confidence interval; HR, hazard ratio.
The nomograms were subsequently verified and had a C-index of 0.77 (95% CI: 0.68–0.87), indicating that the discriminative ability was acceptable. All the calibration curves were close to the diagonal, suggesting that the nomogram exhibited favorable concordance between the predicted and actual outcomes (Fig. 6C). The AUCs for 1-, 3-, and 5-year survival were 0.685, 0.680, and 0.773, respectively (Fig. 6D).
Evaluation of the associations between risk scores and clinicopathological features showed that a high score correlated with the risk of metastasis (p < 0.05) (Fig. 7A). Although risk score was unrelated to gender, tumor site, tumor region, or stage (all p > 0.05) (Fig. 7B–E), the results of Kaplan–Meier analyses in most clinicopathological feature subgroups indicated that risk score was prognostic of survival in both men and women, patients with metastases, patients with tumor sites in the arms and legs, and patients with proximal tumors (all p < 0.05) (Fig. 7F–J).
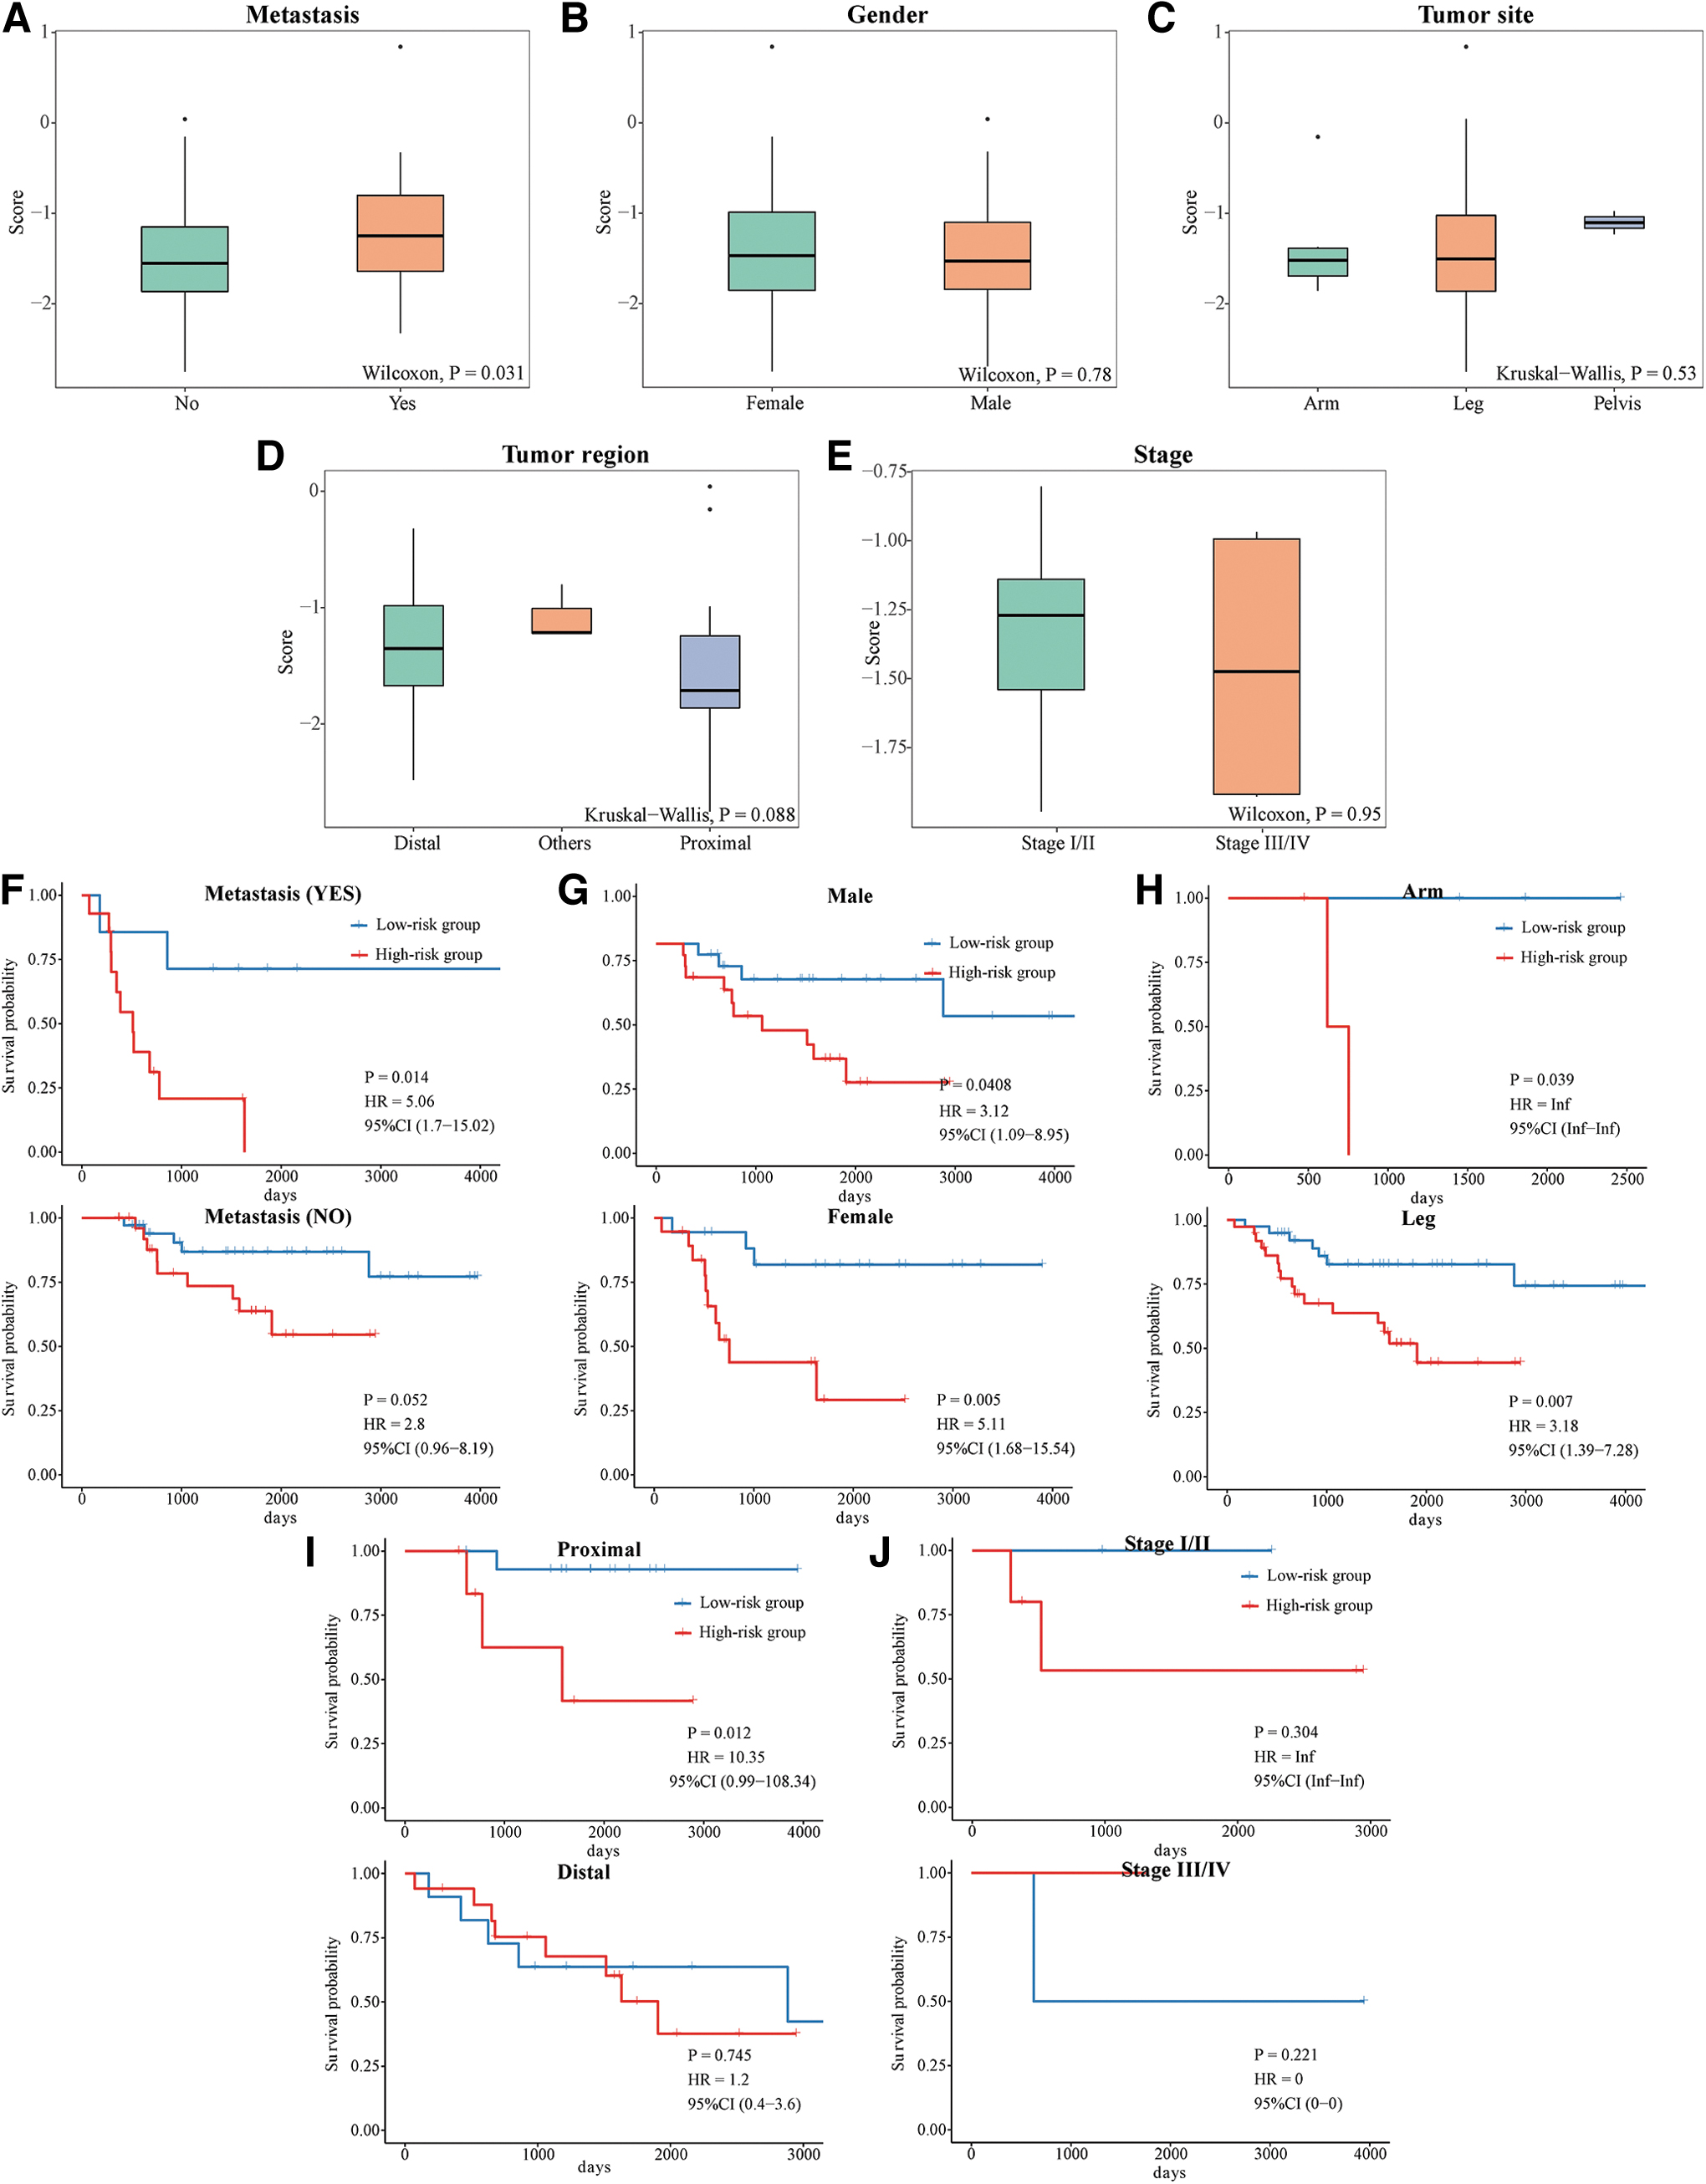
Relationships between signature scores based on MAGs and clinicopathological features in patients with OS. Box plots of
Immune cell infiltration in the risk groups
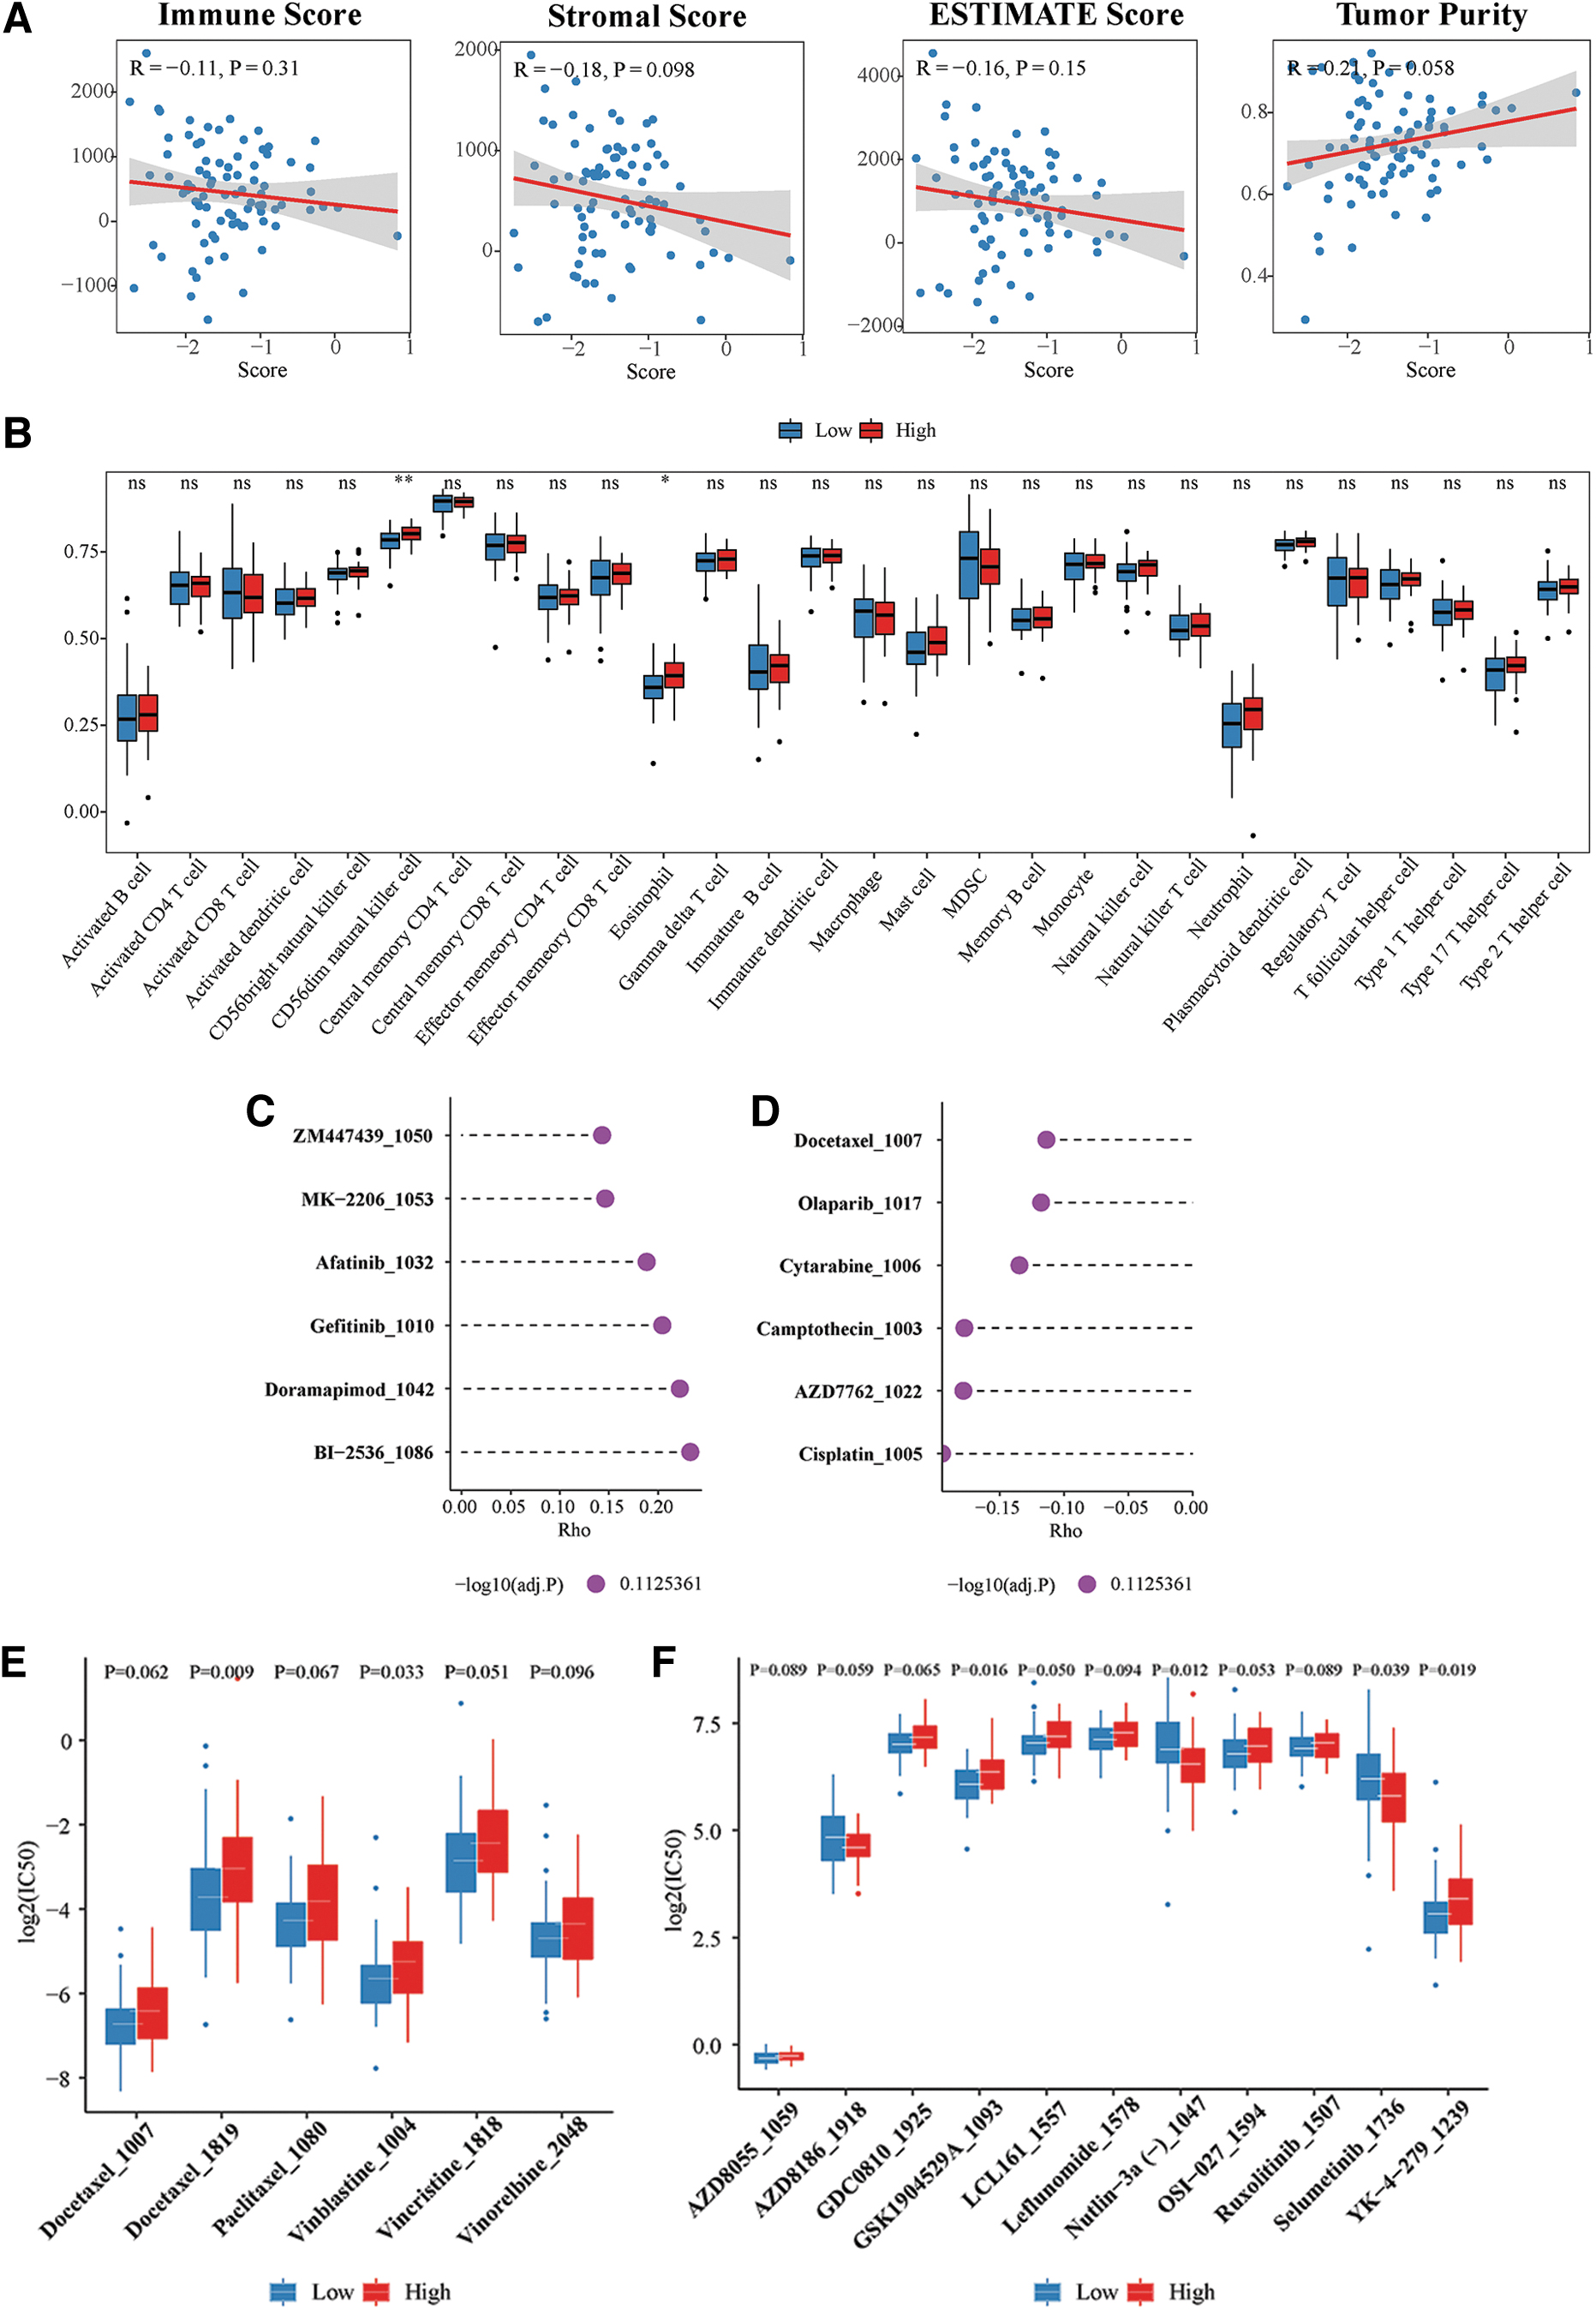
The results of the ESTIMATE algorithm suggested that the overall levels of infiltration of stromal cells and immune cells into OS tumors were not associated with MAG-based signature (all p > 0.05) (Fig. 8A). The correlations between infiltration of various immune cell subtypes and MAG-based signatures were further explored by ssGSEA, demonstrating that risk scores were positively associated with the infiltration of CD56dim natural killer (NK) cells and eosinophils (both p < 0.05) (Fig. 8B). In addition, the molecular pathways related to the MAG-based signature suggested by the ssGSEA method are shown in Supplementary Figure S1.
Relationships of
Responses of risk groups to antitumor agents
The GDSC2 database was evaluated to approximate the response to antitumor agents of patients in different SCORE groups. Evaluation of drugs most positively (Fig. 8C) and negatively (Fig. 8D) correlating with risk scores showed that several antiangiogenic agents, such as MK-2206, afatinib, and gefitinib, had higher log(IC50) values in the high-risk cohort, suggesting that SCORE might be positively associated with resistance to antiangiogenic agents. The distribution of log(IC50) values in relation to risk scores was also determined for several chemotherapeutic and molecular targeting agents (Fig. 8E, F).
Validation of expression of MAGs in the clinical samples
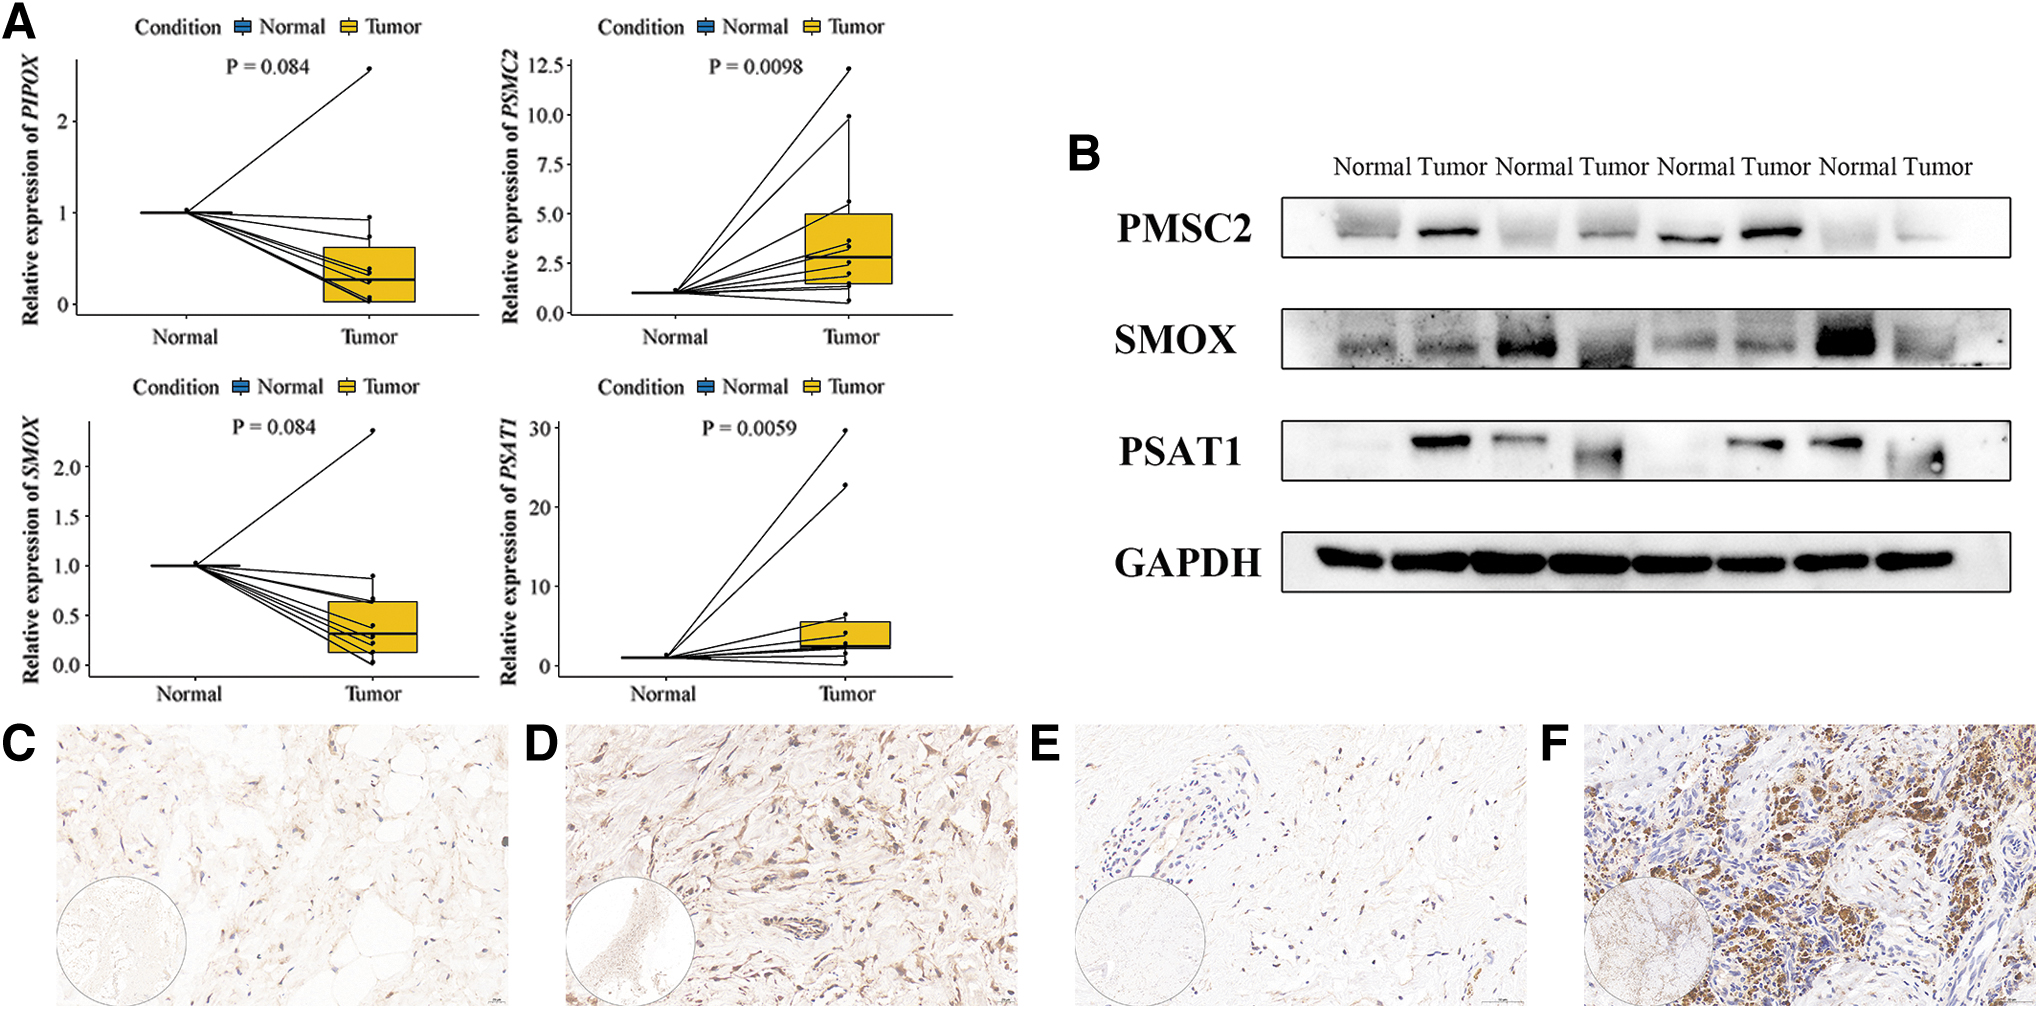
As shown in Figure 9A, the mRNA expression levels of PIPOX, PSMC2, SMOX, and PSAT1 were investigated in 10 primary OS and paired normal tissue samples using the analysis of RT-qPCR. Compared with normal tissues, the expression of PSMC2 and PSAT1 was elevated in most OS tissues, whereas the expression of PIPOX and SMOX was decreased (Fig. 9A). These findings are consistent with the results in the GEO database (Supplementary Table S4).
Experimental validation of MAGs expression.
The protein expression levels of several MAGs were also investigated in clinical samples. The results of Western blot were also the same as bioinformatics results (Supplementary Table S4), showing that the expression of PSMC2 and PSAT1 was increased, whereas the expression of SMOX was decreased, compared with paired normal tissues (Fig. 9B). Furthermore, the expression of PSMC2 and PSAT1 was assessed immunohistochemically, and representative pictures are shown in Figure 9C–F.
Discussion
The present study utilized bioinformatics tools to investigate the prognostic role of AA MAGs in OS. Elevated expression levels of SMOX and PSAT1 were identified as adverse factors associated with reduced survival in OS patients. Conversely, high levels of PIPOX and PSMC2 mRNAs were identified as protective factors. A prognostic signature based on these four MAGs was developed, and all enrolled patients were categorized into either the high-risk or low-risk groups based on the median signature score. Patients in the high-risk group had significantly poorer survival outcomes than those in the low-risk group. Kaplan–Meier and tdROC analyses showed that the signature score provided a reasonably accurate predictive capability, and its prognostic value was confirmed in the GSE16102_GPL96 dataset.
Furthermore, a predictive nomogram model incorporating clinicopathological features was developed to assess individual patient survival. The model's C-index and calibration curves demonstrated its ability to differentiate between high- and low-risk patients effectively. The potential functional implication of the gene signature was further evaluated by functional enrichment analysis, immune cell infiltration assay, and determination of responses to antitumor agents. The signature score was found to be associated with glycine, serine, and threonine metabolism, as well as oxidoreductases. These findings underscore the importance of further investigating AA MAGs in OS.
Several previous studies have investigated the role of molecular events associated with AA metabolism in OS progression. Analyses of serum and urinary metabolomics in OS patients have indicated the upregulation of aromatic amino acid (AAA) metabolism. 30 In addition, both in vivo and in vitro investigations have suggested that the differential expression of various AA transporters and metabolic enzymes significantly contributes to the metabolic adaptations observed in OS. 19,20,25 For instance, it was observed that BCAA transaminases were overexpressed in the OS cell line 143B. Inhibitors targeting these enzymes or disruption of leucine uptake had the effect of enhancing the phosphorylation of AMP-activated protein kinase and subsequently reducing mTORC1 activity, which in turn led to decreased cell viability.
Interestingly, none of these outcomes was observed in the benign tumorigenic chondrosarcoma cell line PCB0023. 19 In addition, elevated glutaminase-1 (GLS1) level was significantly associated with poorer survival in OS patients. 31 Notably, exposure to CB-839, an inhibitor of GLS1, had the effect of suppressing both primary tumor growth and metastasis in vivo.
The four MAGs identified as prognostic factors in OS, PSMC2, SMOX, PIPOX, and PSAT1, have previously been investigated in tumors. For instance, the protein encoded by PSMC2 plays an essential role in the assembly of the 26S proteasome, responsible for protein degradation in eukaryotic cells. This function is critical for maintaining the integrity of the proteome. 32,33 An analysis of 56 candidate Copy-number alterations Yielding Cancer Liabilities Owing to Partial loss (CYCLOPS) genes, which represent a unique subset of essential genes linked to cancer cell viability, revealed that PSMC2 held the highest ranking. 34 PSMC2 has been found to be upregulated in most human cancers and is considered a promoter of tumorigenesis in ovarian cancer, 34,35 pancreatic cancer, 36 and hepatocellular carcinoma. 37 Notably, knockdown of PSMC2 has been shown to suppress tumor growth and progression in vitro and in vivo in these cancer types. However, in contrast to findings in other tumor types, the present study discovered that PSMC2 was upregulated in OS, and intriguingly, a higher level of PSMC2 expression in OS was associated with a more favorable prognosis.
The influence of PSMC2 on the regulation of OS cell proliferation, apoptosis, and migration has been thoroughly examined. 38 Intriguingly, the outcomes of both PSMC2 knockdown and overexpression experiments suggested that PSMC2 inhibited tumor cell proliferation and the formation of colonies. It's worth noting that while this study demonstrated the upregulation of PSMC2 in OS tissues, it lacked follow-up survival data for further analysis. The results of several other studies have corroborated our findings. For instance, analyses of PSMC2 expression and its prognostic relevance in 31 different types of tumors from the Cancer Genome Atlas (TCGA) and the Genotype-Tissue Expression (GTEx) databases have consistently indicated elevated PSMC2 expression in sarcomas (SARC).
Importantly, this increased PSMC2 expression was found to be positively correlated with improved overall survival. 39 A comprehensive analysis of the transcriptional levels of PSMC family members in breast cancer samples, conducted using data from the cBioPortal and Oncomine databases, has revealed intriguing findings. While PSMC2 expression was significantly higher in breast cancer compared to adjacent normal tissue, high levels of PSMC2 expression were associated with a more favorable prognosis. This included better outcomes in terms of recurrence-free survival (HR = 0.61, p < 0.001) and distant metastasis-free survival (HR = 0.67, p = 0.025). 40 Given the complexity of the molecular regulation of PSMC2 during tumorigenesis, further investigations are warranted to unravel the underlying mechanisms.
SMOX is a highly inducible enzyme that plays an essential role in polyamine homeostasis by catalyzing the oxidation of spermine to spermidine. 41 This metabolic activity produces oxidant by-products, and therefore, overexpression of SMOX has been linked to disruptions in cellular reactive oxygen species balance. 42 Oxidative stress is closely related to cell death, and its imbalance also plays a dual role in tumorigenesis. 43 Notably, overexpression of SMOX has been associated with an increased risk of Helicobacter pylori-associated gastric cancer. In this context, H. pylori infection prompts SMOX to metabolize the polyamine spermine, leading to the production of hydrogen peroxide, activation of β-catenin, and oxidative damage to DNA. This cascade of events contributes to the development of gastric cancer. 44,45
The findings of the current study indicated that increased SMOX expression was linked to a poorer prognosis in OS patients and could be considered a potential risk factor. Interestingly, SMOX expression tended to be reduced in OS compared to normal tissues. These results were further validated through RT-qPCR assays conducted on 10 paired OS and normal tissues, and the outcomes were consistent with SMOX mRNA expression in the GEO database. It's noteworthy that while SMOX has been explored as a potential target in colon cancer and NSCLC, 46,47 there has been a lack of research investigating its role in OS until now.
PIPOX protein possesses both L-pipecolate and sarcosine oxidase activities. 48 Notably, metabonomic profiling conducted in a study involving 262 patients with metastatic prostate cancer revealed a significant increase in sarcosine (N-methyl glycine) levels (AUC = 0.71). 49 Subsequently, PIPOX plays a crucial role as a key enzyme in reducing the oncogenic potential of prostate cells by metabolizing sarcosine. 48 PIPOX has also shown promise as a sensitive biomarker for distinguishing molecular subtypes in breast cancer. 50,51 Notably, the present study is the first to reveal that the expression of PIPOX mRNA is lower in OS compared to adjacent normal tissue, and this lower expression is associated with potentially better survival outcomes. This finding was consistent with results in other types of cancer, particularly prostate cancer. However, the underlying mechanisms behind this phenomenon require further investigation.
PSAT1 encodes a member of the class-V pyridoxal-phosphate-dependent aminotransferase family and maintains proper serine biosynthesis by catalyzing the reversible conversion of 3-phosphohydroxypyruvate to phosphoserine. 52 As a nonessential AA, serine can be produced by the serine synthesis pathway (SSP) in vivo and plays an important role in one-carbon metabolism, protein biosynthesis, and lipid metabolism. 52 While a diet that restricts serine has been shown to limit tumor growth in vivo, 53 cancer cells can adapt and survive under conditions of serine starvation by increasing the expression of enzymes involved in the SSP. 54,55 Overexpression of PSAT1, in particular, not only enhances the conversion of phosphoserine but also leads to increased production of α-ketoglutarate (α-KG), a metabolic intermediate in the TCA cycle that plays a role in tumor development. 54 –57 Targeting SSP or PSAT1 seems to be promising in oncotherapy, with our findings suggesting the need for further studies to elucidate the role of PSAT1 in OS.
The results of KEGG and GO pathway enrichment analysis showed that the signature composed of the four genes, SMOX, PSAT1, PIPOX, and PSMC2, could effectively differentiate between risk groups in OS patients. There were significant differences in metabolic pathways between high-risk and low-risk patients. The GO enrichment analysis highlighted the association with oxidoreductase activity, while KEGG analysis suggested that both the glycine, serine, and threonine metabolic pathway and the beta-alanine metabolic pathway were significantly activated in OS.
Invasion of the TME by cells of the innate immune system holds potential benefits for treating OS. 29 The effects of MAG signatures on immune cell infiltration were analyzed by determining immune-stromal scores using the ESTIMATE algorithm and the ssGSEA method. Although the overall levels of infiltration of stromal cells and immune cells in OS were not associated with MAG-based signatures (all p > 0.05), invasion of the TME by CD56dim NK cells and eosinophils was positively associated with the MAG-based signature (both p < 0.05). CD56dim NK cells, accounting for more than 90% of NK cells, primarily play a cytotoxic role in tumors. 58 Arginine metabolism is a significant pathway associated with both innate and adaptive immune responses, with arginine consumption in the TME inhibiting NK cell proliferation. 59,60 SMOX, a member of the four-gene MAG signature, encodes a crucial enzyme involved in arginine metabolism, which could potentially impact the metabolism of NK cells. However, it's important to interpret these results cautiously, as there has been no prior experimental verification of these findings in OS patients.
The findings in this study indicate that a higher risk score is associated with resistance to antiangiogenic agents, including MK-2206, afatinib, and gefitinib. These observations are of clinical significance as antiangiogenic agents have shown effectiveness as targeted therapies in metastatic OS patients. However, it's essential to note that these findings should be experimentally confirmed, and further research is needed to explore the underlying mechanisms behind this resistance.
This study has several limitations. First, despite the utilization of various public databases, including the Target database with a relatively large cohort of OS patients, the sample size of 85 patients remains relatively small due to the rare nature of OS. Larger sample sizes might uncover additional prognostic MAGs. Second, this study primarily relied on bioinformatics analysis and tissue validation. Further experimental studies are required to delve into the potential molecular mechanisms of these MAGs in OS. These experiments could provide more substantial evidence and a deeper understanding of the role of these genes in OS.
Conclusion
The current study successfully pinpointed four crucial MAGs, namely PIPOX, PSMC2, SMOX, and PSAT1, which serve as reliable prognostic markers for survival in OS patients. It's noteworthy that these four MAGs are intricately involved in AA metabolism pathways, particularly in glycine, serine, and threonine metabolism. The development of an integrated signature based on these MAGs holds great promise for enhancing our understanding of OS treatment strategies.
Footnotes
Acknowledgments
The authors thank the researchers and institutions who shared their data to UCSC Xena and GEO databases.
Authors' Contributions
L.F. designed the study, undertook the experiments, analyzed the data, and wrote the article. Y.C. aided in the methodology, data visualization, and article editing. X.M. and L.W. aided in the experiments and article editing. W.Z. helped provision of clinical issue samples, data curation, and article editing. J.Y. assisted in article editing, conception, and administrative support. All authors contributed to the article and approved the submitted version.
Data Availability Statement
Most of the data supporting the findings of this study are available within the article and its Supplementary Material. Additional data are from the authors, please contact fengliwen2012@163.com
Disclosure Statement
No competing financial interests exist.
Funding Information
This work was supported by the National Natural Science Foundation of China [Grant No. 81600482] and Beijing Chao-Yang Hospital Golden Seeds Foundation [Grant No. CYJZ202341].
Supplementary Material
Supplementary Figure S1
Supplementary Table S1
Supplementary Table S2
Supplementary Table S3
Supplementary Table S4