
Abstract
Background:
The abnormal expression of kinase family member 4A (KIF4A) is linked to breast cancer progression, with numerous miRNAs exhibiting abnormal expression. Thus, there is an urgent need to investigate the mechanisms of action of miRNAs and their target genes for the diagnosis and treatment of breast cancer.
Materials and Methods:
A bioinformatics analysis was conducted to screen for KIF4A, a key gene involved in oxidative stress in breast cancer cells. Using CCK8, EdU, cell healing, and Transwell assays, the knockdown of KIF4A was found to effectively inhibit the proliferation, migration, and invasion of breast cancer cells. Dual-luciferase assay and Western blotting confirmed that miR-223-3p targets and regulates KIF4A expression. The impact of miR-223-3p and KIF4A on oxidative stress in breast cancer cells was assessed through reactive oxygen species (ROS), superoxide dismutase (SOD), and malondialdehyde (MDA) measurements. Flow cytometry was used to evaluate tumor cell apoptosis.
Results:
Our results suggest that KIF4A is a downstream target of miR-223-3p. miR-223-3p inhibits the proliferation and invasion of breast cancer cells by directly targeting and downregulating KIF4A. Importantly, we found that miR-223-3p and KIF4A play important roles in regulating oxidative stress and apoptosis in breast cancer cells. Specifically, miR-223-3p promoted apoptosis by inhibiting the expression of KIF4A, increasing the accumulation level of ROS and MDA, and inhibiting the activity of SOD while KIF4A was overexpressed.
Introduction
Breast cancer accounts for more than two million new cases annually, approximately one-eighth of all cancer diagnoses, and has become the most common cancer worldwide. 1,2 Significant geographical differences have been observed in the survival rates of patients with breast cancer. In areas where health care is well developed, early diagnosis and effective treatment are the main reasons for low mortality. 3 Breast cancer can be divided into ductal carcinoma in situ, early invasive, locally advanced, and tumor metastasis stage. 4 Effective treatment modalities were selected according to the cancer stage. Current treatments include lumpectomy, mastectomy, radiotherapy, chemotherapy, endocrine therapy, and immunotherapy. 5 Owing to the heterogeneity of breast cancer, the study of the molecular mechanisms underlying tumorigenesis has become relatively complex. Treatment resistance also leads to increased requirements for diverse treatment regimens. Therefore, investigating the molecular mechanisms and signaling pathways underlying tumor development could aid in the discovery of diagnostic markers and the application of new therapeutic strategies. 6
MiRNAs have been shown to play a role in regulating gene expression. 7 MiRNA expression can become dysregulated in human malignancies for a variety of reasons, such as aberrant gene amplification, deregulated transcription factors, and epigenetic modifications. 8 Dysregulated miRNAs, in turn, affect functions such as the proliferation, migration, invasion, and apoptosis of cancer cells. 9 In addition, miRNAs can be used as biomarkers and therapeutic targets in cancer diagnosis and treatment. 10 MiR-223-3p plays an important role in various common tumors, including a carcinogenic role in gastric cancer, 11,12 colorectal cancer, 13 and ovarian cancer. 14 In contrast, miR-223-3p mainly shows tumor-suppressive effects in liver cancer, 15 nonsmall cell lung cancer, 16 and glioblastoma. 17 In addition, there is no consensus regarding the role of miR-223-3p in breast cancer. The results of RT-qPCR in the blood of patients with breast cancer showed that the expression level of miR-223-3p was much higher than that in healthy control group. 18 miR-223-3p exerts its cancer-promoting effects by inhibiting the expression of its target gene FBXW7. 19 Wang et al. showed that exosome-associated miR-223-3p promotes lung metastasis in breast cancer. 20 Other studies have shown that miR-223-3p inhibits the activity of NLRP3 inflammasome, thereby inhibiting the growth of breast cancer cells. 21
Kinesin is a motor protein that regulates the trafficking of intracellular components. To date, 45 members of the kinesin superfamily of proteins (KIFs) have been identified in humans. 22 Several KIF family members have been shown to be biomarkers for breast cancer. 23 Protein family member 4A (KIF4A) is a member of the KIFs, and KIF4A plays an important role in physiological processes. KIF4A is involved in chromosome separation and spindle formation during mitosis 24 and affects DNA damage repair and gene transcription regulation. 25 In the field of tumor research, the expression of KIF4A is dysregulated in a variety of cancers and is often closely related to the proliferation, invasion, and metastasis of tumor cells. It may play a procancer role in glioma, 26,27 bladder cancer, 28 prostate cancer, 29 and laryngeal squamous cell carcinoma 30 by influencing cell cycle progression and regulating tumor-related signaling pathways. At present, studies on KIF4A in breast cancer remain scarce. 31 KIF4A is upregulated in breast cancer tissues 32 and may be associated with a poor prognosis in patients with breast cancer. 33 This study aimed to screen for the key gene in breast cancer, KIF4A, by gene expression to predict the miRNA regulating its expression and explore the mechanism of KIF4A in oxidative stress and apoptosis in breast cancer.
Materials and Methods
Public data access
The breast cancer dataset GSE37751 34 was obtained from the GEO database (https://www.ncbi.nlm.nih.gov/geo/), which contained tumor tissues from 61 patients with breast cancer and nontumor tissues from 47 healthy volunteers.
Differential gene expression analysis auto
The R software package “FactoMineR” 35 was used to perform principal components analysis (PCA) on the data of two groups of breast cancer primary tumor tissue (Case) and nontumor tissue (Ctrl), and principal components with eigenvalue >1 were extracted for subsequent analysis. The “factoextra” software package 36 was then used to visualize the PCA results and plot the principal component score. We used Reads Per Kilobase per Million mapped reads (RPKM)as a normalization method 37 for standardization. Then, glmFit and glmLRT in edgeR were used to analyze differentially expressed genes, 38 and p-value <0.05 and |log2FC| ≥ 1 were screened. Next, the “clusterProfiler” software package was used for gene ontology (GO) and Kyoto Encyclopedia of Genes and Genomes (KEGG) functional enrichment analysis, and pathways with p < 0.05 were considered statistically significant. Finally, the top-ranking results for display were selected.
Intersection gene analysis
The GeneCards database (https://www.genecards.org/) was used to search for target genes in the oxidative metabolism with “protein-coding” genes associated with screening. Selected oxidative metabolic targets intersected with differentially expressed genes. Subsequently, the STRING database (http://string-db.org/) was used to construct a protein–protein interaction (PPI) network map based on the intersecting genes. In the STRING database, a medium confidence level (score ≥0.4) was set to filter for reliable interactions. The resulting data were imported into Cytoscape 3.9.1. for visualization. The Maximal Clique Centrality algorithm of Cytoscape’s CytoHubba plug-in was used to screen the top 10 hub genes in the interaction network.
Screening key genes based on clinical survival data
GEPIA (Gene Expression Profiling Interactive Analysis, http://gepia.cancer-pku.cn/) was used to evaluate the expression levels and overall survival (OS) of 10 genes in breast cancer, and screen for genes associated with poor prognosis of breast cancer. To adjust for potential confounding factors, we performed a multifactor Cox proportional hazards regression analysis. Survival curves were drawn using the Kaplan−Meier method, and survival differences among groups were compared using the log-rank test. Four genes associated with a poor prognosis in breast cancer were screened. To further screen key genes in the breast cancer process, a large amount of sample data from the public database TCGA-BRCA (The Cancer Genome Atlas Breast Invasive Carcinoma, https://portal.gdc.cancer.gov/) was extracted to obtain data related to gene expression and the tumor stage of patients with breast cancer. Spearman’s rank correlation analysis was used to evaluate the degree of correlation between the gene expression levels and the breast cancer stage. Genes associated with the breast cancer stage were also identified.
Cell culture
All the cell lines were purchased from Pricella (Shanghai, China). Malondialdehyde (MDA-MB-157) (CVCL_0618), MDA-MB-453 (CVCL_0418), and MDA-MB-231 (CVCL_0062) were cultured in Leibovitz’s L-15 medium supplemented with 10% fetal bovine serum (FBS) and 1% penicillin/streptomycin (P/S). MCF-10A (CVCL_0598) was cultured with Dulbecco’s modified Eagle medium/Nutrient Mixture F-12 + 5% HS + 20 ng/mL epidermal growth factor + 0.5 μg/mL hydrocortisone + 10 μg/mL insulin + 1% nonessential amino acids + 1% P/S. MCF-7 cells (CVCL_0031) were cultured in minimum essential medium + 10 µg/mL insulin + 10% FBS + 1% P/S. The T47D (CVCL_0553) cell line was cultured at the Roswell Park Memorial Institute-1640 + 10 μg/mL insulin + 10% FBS + 1% P/S. HEK-293T (CVCL_ZD87) cells were cultured in Dulbecco’s modified Eagle medium + 10% FBS + 1% P/S. These cells were cultured at 37°C in a 5% CO2 incubator.
Small interfering RNA/microRNA transfection experiment
Small interfering RNA (siRNAs) (si-KIF4A-1, si-KIF4A-2, si-KIF4A-3, and si-NC) were designed using the siDirect website (19948054) (http://sidirect2.rnai.jp/). Sequences were synthesized by Genomeditech Biotechnology Co., Ltd. (Shanghai, China). Sequence information is presented in Supplementary Table S1. The siRNA powder was dissolved with RNase-free H2O (9012; Takara, Japan) to reach 20 µM. The miR-223-3p mimic (HY-R00467; MedChemExpress, USA) and miRNA mimic negative control (HY-R04602; MedChemExpress, USA) were dissolved in RNase-free H2O to obtain a 50 nM stock solution.
The day before the transfection experiment, cells were seeded in 24-well plates at a density of 1 × 10⁵ cells/well. The siRNA/miRNA was mixed with transfection reagent at a ratio of 1:2 (HY-K2017; MedChemexpress, USA) and incubated at 25°C for 3 min. Then, 100 µL of serum-free medium was added and incubated at 25°C for 15 min. Subsequently, 400 μL of the above complex was added to breast cancer cells, and the cells were cultured in a 37°C, 5% CO2 incubator for 48 h.
Gene overexpression
The full-length DNA sequence of KIF4A (Gene ID: 24137) was synthesized by Sangon Biotech Co., Ltd. (Shanghai, China). The overexpression vector was constructed using the pc-DNA3.1 plasmid, which was double-digested with BamHI (R3136V; New England Biolabs, Ipswich, MA, USA) and EcoRI (R0101T; New England Biolabs). The vector fragments were separated and recovered by agarose gel electrophoresis. The linearized vector fragments and the KIF4A gene fragments were mixed, and T4 DNA ligase (M0202V; New England Biolabs, USA) and reaction buffer were added for a 30 min ligation reaction at 16°C to insert the KIF4A gene fragment into the vector. Subsequently, the ligation product was transformed into competent Escherichia coli cells (TSC-C14; Tsingke, China) using the heat shock method. The transformed bacteria were cultured on agar plates containing antibiotics, and single colonies were picked and cultured at 37°C. The extracted pcDNA3.1-KIF4A vector plasmid was transfected into breast cancer cells using the transfection protocol described above. The primer sequences are shown in Supplementary Table S2.
Quantitative real-time reverse transcription PCR
The cell culture medium was discarded and Redzol (FTR-50; SBS Genetech Co., Ltd., Beijing, China) was added to completely lyse the cells. Next, 0.2 mL of chloroform (ES-8522; ECOTOP, Guangzhou, China) was added to the mixture and allowed to sit for 2 min. Then, 500 µL of isopropyl alcohol (67-63-0; Baishi Chemical Industry Co., Ltd, Tianjin, China) was added to the supernatant, mixed well, allowed to sit at 25°C for 10 min, and centrifuged at 12,000 × g for 10 min. This was followed by rinsing with 75% ethanol (E101601; Yonghua Chemical Co., Ltd., Suzhou, China) three times, followed by centrifugation at 4°C, 7500 × g for 5 min. The RNA samples were dissolved with H2O treated with 50 µL of diethyl pyrocarbonate (DEPC) incubated at 60°C for 10 min to completely dissolve the RNA. cDNA was synthesized according to PrimeScript™ RT kit (RR037Q; Takara, Beijing, China). BeyoFast™ SYBR Green One-Step Quantitative Real-Time Reverse Transcription PCR (qRT-PCR) kit (D7268S; Beyotime, Shanghai, China) was used to configure the reaction system, and the reaction was amplified using a real-time PCR amplification apparatus (T100; Bio-Rad Laboratories, USA). The data were quantitatively analyzed by 2−ΔΔCT. 39 The primer sequences and qRT-PCR cycle conditions are listed in Supplementary Table S3.
Western blotting
The cells were lysed on ice using RIPA lysis solution (89900; Thermo Fisher Scientific, USA), followed by centrifugation at 2000 × g and 4°C for 10 min. The resulting supernatant was used as the protein extract. The protein concentration was determined using the bicinchoninic acid method (20201ES76; Yeasen, Shanghai, China). A polyacrylamide gel was prepared, and the protein samples were successively added to the sample holes. When the voltage was adjusted to 80V, the sample was passed through the concentrated glue for approximately 35 min, and 120 V passed through the separated glue for approximately 60 min, after which electrophoresis was completed. The isolated proteins were transferred to a Polyvinylidene Fluoride (PVDF) membrane (88518; Thermo Fisher Scientific, USA) and sealed using Tris-buffered saline with Tween-20 (TBST) and a 5% skim milk powder mixture (AR0104; Boster Biological Technology, Wuhan, China). After rinsing with TBST buffer (HY-K1025; MedChemExpress, USA), the primary antibody was added and incubated at 4°C for 12 h. The PVDF membrane was then washed three times with TBST. Before incubation, the secondary antibody was diluted with 5% skimmed milk powder and incubated with the secondary antibody working solution at 25°C for 1 h. An ultrasensitive Electrochemiluminescence (ECL) chemiluminescence reagent (P2200; NCM Biotech, Suzhou, China) was used to detect protein bands using an exposure multifunctional imaging system (SH-510; Shenhuabio, Hangzhou, China). Glyceraldehyde-3-phosphate dehydrogenase (GAPDH) was used as an endogenous control, and ImageJ (https://imagej.net/contribute/citing) was used to analyze the images. Details on the antibodies is provided in Supplementary Table S4.
CCK-8
The cells were first rinsed with phosphate-buffered saline (PBS) (AM9624; Thermo Fisher Scientific, USA), followed by the addition of 1 mL of trypsin to digest the cells (T1300; Solarbio, Beijing, China). The cell suspension was transferred to a centrifuge tube and centrifuged at 25°C at 200×g for 5 min. The supernatant was discarded, and complete medium was added to resuspend the cells. After the cells were counted, the cell suspensions were placed in 96-well plates (2000 cells per well) and incubated (50162972; Thermo Fisher Scientific, USA) for 24 h. Then, 10 µL of CCK-8 (CA1210; Solarbio, Beijing, China) was added to each well and incubated in the incubator for 1 h. Finally, the absorbency of each sample was measured at 450 nm.
Transwell
Matrigel (M8370; Solarbio, Beijing, China) was diluted with PBS buffer at a ratio of 1:8 at 4°C, 100 µL was evenly applied to the upper chamber, and placed at 37°C for 1 h and polymerized into a gel. Next, 500 µL of medium containing 20% FBS was added to the lower chamber of the 24-well plate, and 200 µL of cell suspension was added to the upper chamber. The cells were inoculated in the wells and cultured in an incubator for 12, 48, and 72 h, respectively. The chamber and medium were removed, and matrigel and cells in the upper chamber were gently swabbed. The 24-well plate was added 600 µL of 4% paraformaldehyde (P0099; Beyotime, Shanghai, China), and the chamber was placed and fixed for 30 min. The fixative was discarded, the cells were stained with 0.1% crystal violet for 10 min (C0121; Beyotime, Shanghai, China), and washed with PBS three times. The cells were observed under a high-power microscope and counted using ImageJ.
Wound healing
Approximately 5 × 10⁵ cells were inoculated into a six-well cell culture plate, added to the medium, and cultured overnight. Then, the board was lined vertically with a toothpick. The cells were washed three times with sterile PBS and cultured in a 5% CO2 incubator at 37°C. The culture plates were removed after 0 and 48 h, observed under a microscope, and photographed. Last, the average distance between the cells was calculated using ImageJ.
Colony formation assay
Cells exhibiting exponential growth were selected, the cell suspension was diluted to 200 cells/mL after cell counting, and the diluted cell suspension was added to a six-well plate with 1 mL of cell suspension per well. After 14 d of cell culture, the old medium was discarded and cleaned three times with PBS before adding 1 mL of paraformaldehyde to each well, followed by fixing for 30 min. After discarding the solution, the wells were cleaned three times with PBS before adding crystal violet dye and staining for 3 min. The wells were cleaned again three times with PBS and dried naturally. The number of cells was calculated using ImageJ.
Dual-luciferase reporter assay
TargetScan (https://www.targetscan.org/) was used to predict the binding sites of miR-223-3p on KIF4A. We searched for the 3′-UTR of KIF4A and used Primer Premier 5.0 to design primers for the amplification of the KIF4A 3′-UTR sequence. The reporter plasmid pmirGLO was obtained by connecting the cut sites of the XhoI (R0146V; New England Biolabs, USA) and Sall enzymes (R0138V; New England Biolabs, USA) to the pmirGLO plasmids KIF4A-WT and pmirGLO-KIF4A-Mut. The reporter plasmid and miR-223-3p were cotransfected into T47D cells. After transfection for 48 h, a dual-luciferase reporter gene detection kit (RG027; Beyotime, Shanghai, China) and a Promega Glo Max 20/20 luminescence detector (YPH Bio, Beijing, China) were used. The primer sequences are listed in Supplementary Table S5.
Determination of MDA content and activity of SOD
The cells were collected in a centrifuge tube to which extraction solution was added. Cells were broken into a suspension, and the supernatant was collected. The content of MDA in the supernatant was determined using the MDA colorimetric assay kit (E-EL-0060; Elabscience, Wuhan, China). Meanwhile, the activity of SOD in the samples was measured using the SOD activity assay kit (E-BC-K020-M; Elabscience, Wuhan, China).
EdU cell proliferation assay
The assay was performed using BeyoClickTM EdU-594 Cell Proliferation Assay Kit (C0078S; Beyotime, Shanghai, China). A 2× EdU working solution was prepared and predicted at 37°C for labeling the cells. The click reaction solution was added and incubated for 30 min in the dark. Finally, the nuclei were stained with Hoechst 33342. The cells were observed under a confocal laser scanning microscope (TCS SP8 X; Leica, Germany). The ratio of EdU-positive cells (red) to Hoechst 33342-stained cells (blue) was calculated, the results of which were analyzed using ImageJ.
Detection of ROS levels
The reactive oxygen species (ROS) content was evaluated using a reactive oxygen species assay kit (S0033M; Beyotime, Shanghai, China). 2',7'-Dichlorodihydrofluorescein Diacetate (DCFH-DA) was diluted (1:1000) in serum-free medium. After removing the cell culture medium, diluted DCFH-DA (1 mL) was added, followed by incubation at 37°C in an incubator for 20 min. The cells were washed three times with serum-free cell culture medium, and the results were observed using a confocal laser scanning microscope. The relative fluorescence intensities were determined using ImageJ.
Flow cytometry
Apoptosis was detected using an Annexin V-FITC/PI Apoptosis Detection Kit (40302ES20; Yeasen, Shanghai, China). The cells were digested with pancreatin in the absence of Ethylenediaminetetraacetic acid (EDTA). The cells were washed twice with PBS and resuspended in 1× Binding Buffer. Annexin V-FITC and PI staining solutions were added, mixed well, and allowed to react for 15 min at 25°C in the dark. Then, 1× Binding Buffer was added, and the cells were detected by flow cytometry (FACSCanto II; Becton, Dickinson and Company, USA).
Statistical analysis
All experiments were repeated three times, with values expressed as mean ± standard deviation. Statistical analyses were performed using GraphPad Prism 9.0 statistical software. One-way analysis of variance was used for all the other groups. Statistical significance was set at p < 0.05.
Results
Analysis of differentially expressed genes
In this study, we used the GSE37751 dataset to explore the differential expression between primary tumor tissues (case) and nontumor tissues (control) of breast cancer. PCA was first performed on the two groups of samples, and the scatter plot results showed that the tumor and nontumor tissues clustered (Fig. 1A). A total of 1,799 differentially expressed genes (DEGs) were screened from the dataset, of which 760 and 1039 were significantly upregulated and downregulated, respectively (Fig. 1B). The heat map shows the top 20 significant DEGs in the dataset (Fig. 1C). GO enrichment analysis of the above resulting differential genes was performed using the R software package “clusterProfiler” and the top-ranked results are shown in Figure 1D. We primarily focused on the enrichment of DEGs in various biological processes. Five of the top six biological processes were related to adhesion between cells. KEGG analysis revealed the top 15 pathways in which a large number of DEGs functioned as cell adhesion molecules. Cell adhesion molecules play a key role in adhesion between tumors and normal cells, thereby causing cell migration, invasion, and canceration. 40 Breast cancer metastasis is an important cause of cancer-related deaths. Extracellular Matrix (ECM) -receptor interactions can affect cell proliferation and differentiation by activating intracellular signaling pathways. Several genes associated with breast cancer have been shown to interact with ECM-receptor pathways. 41 This indicates that many DEGs are involved in several major molecular pathways, including the PI3K-Akt, Rap1, and PPAR signaling pathways (Fig. 1E).
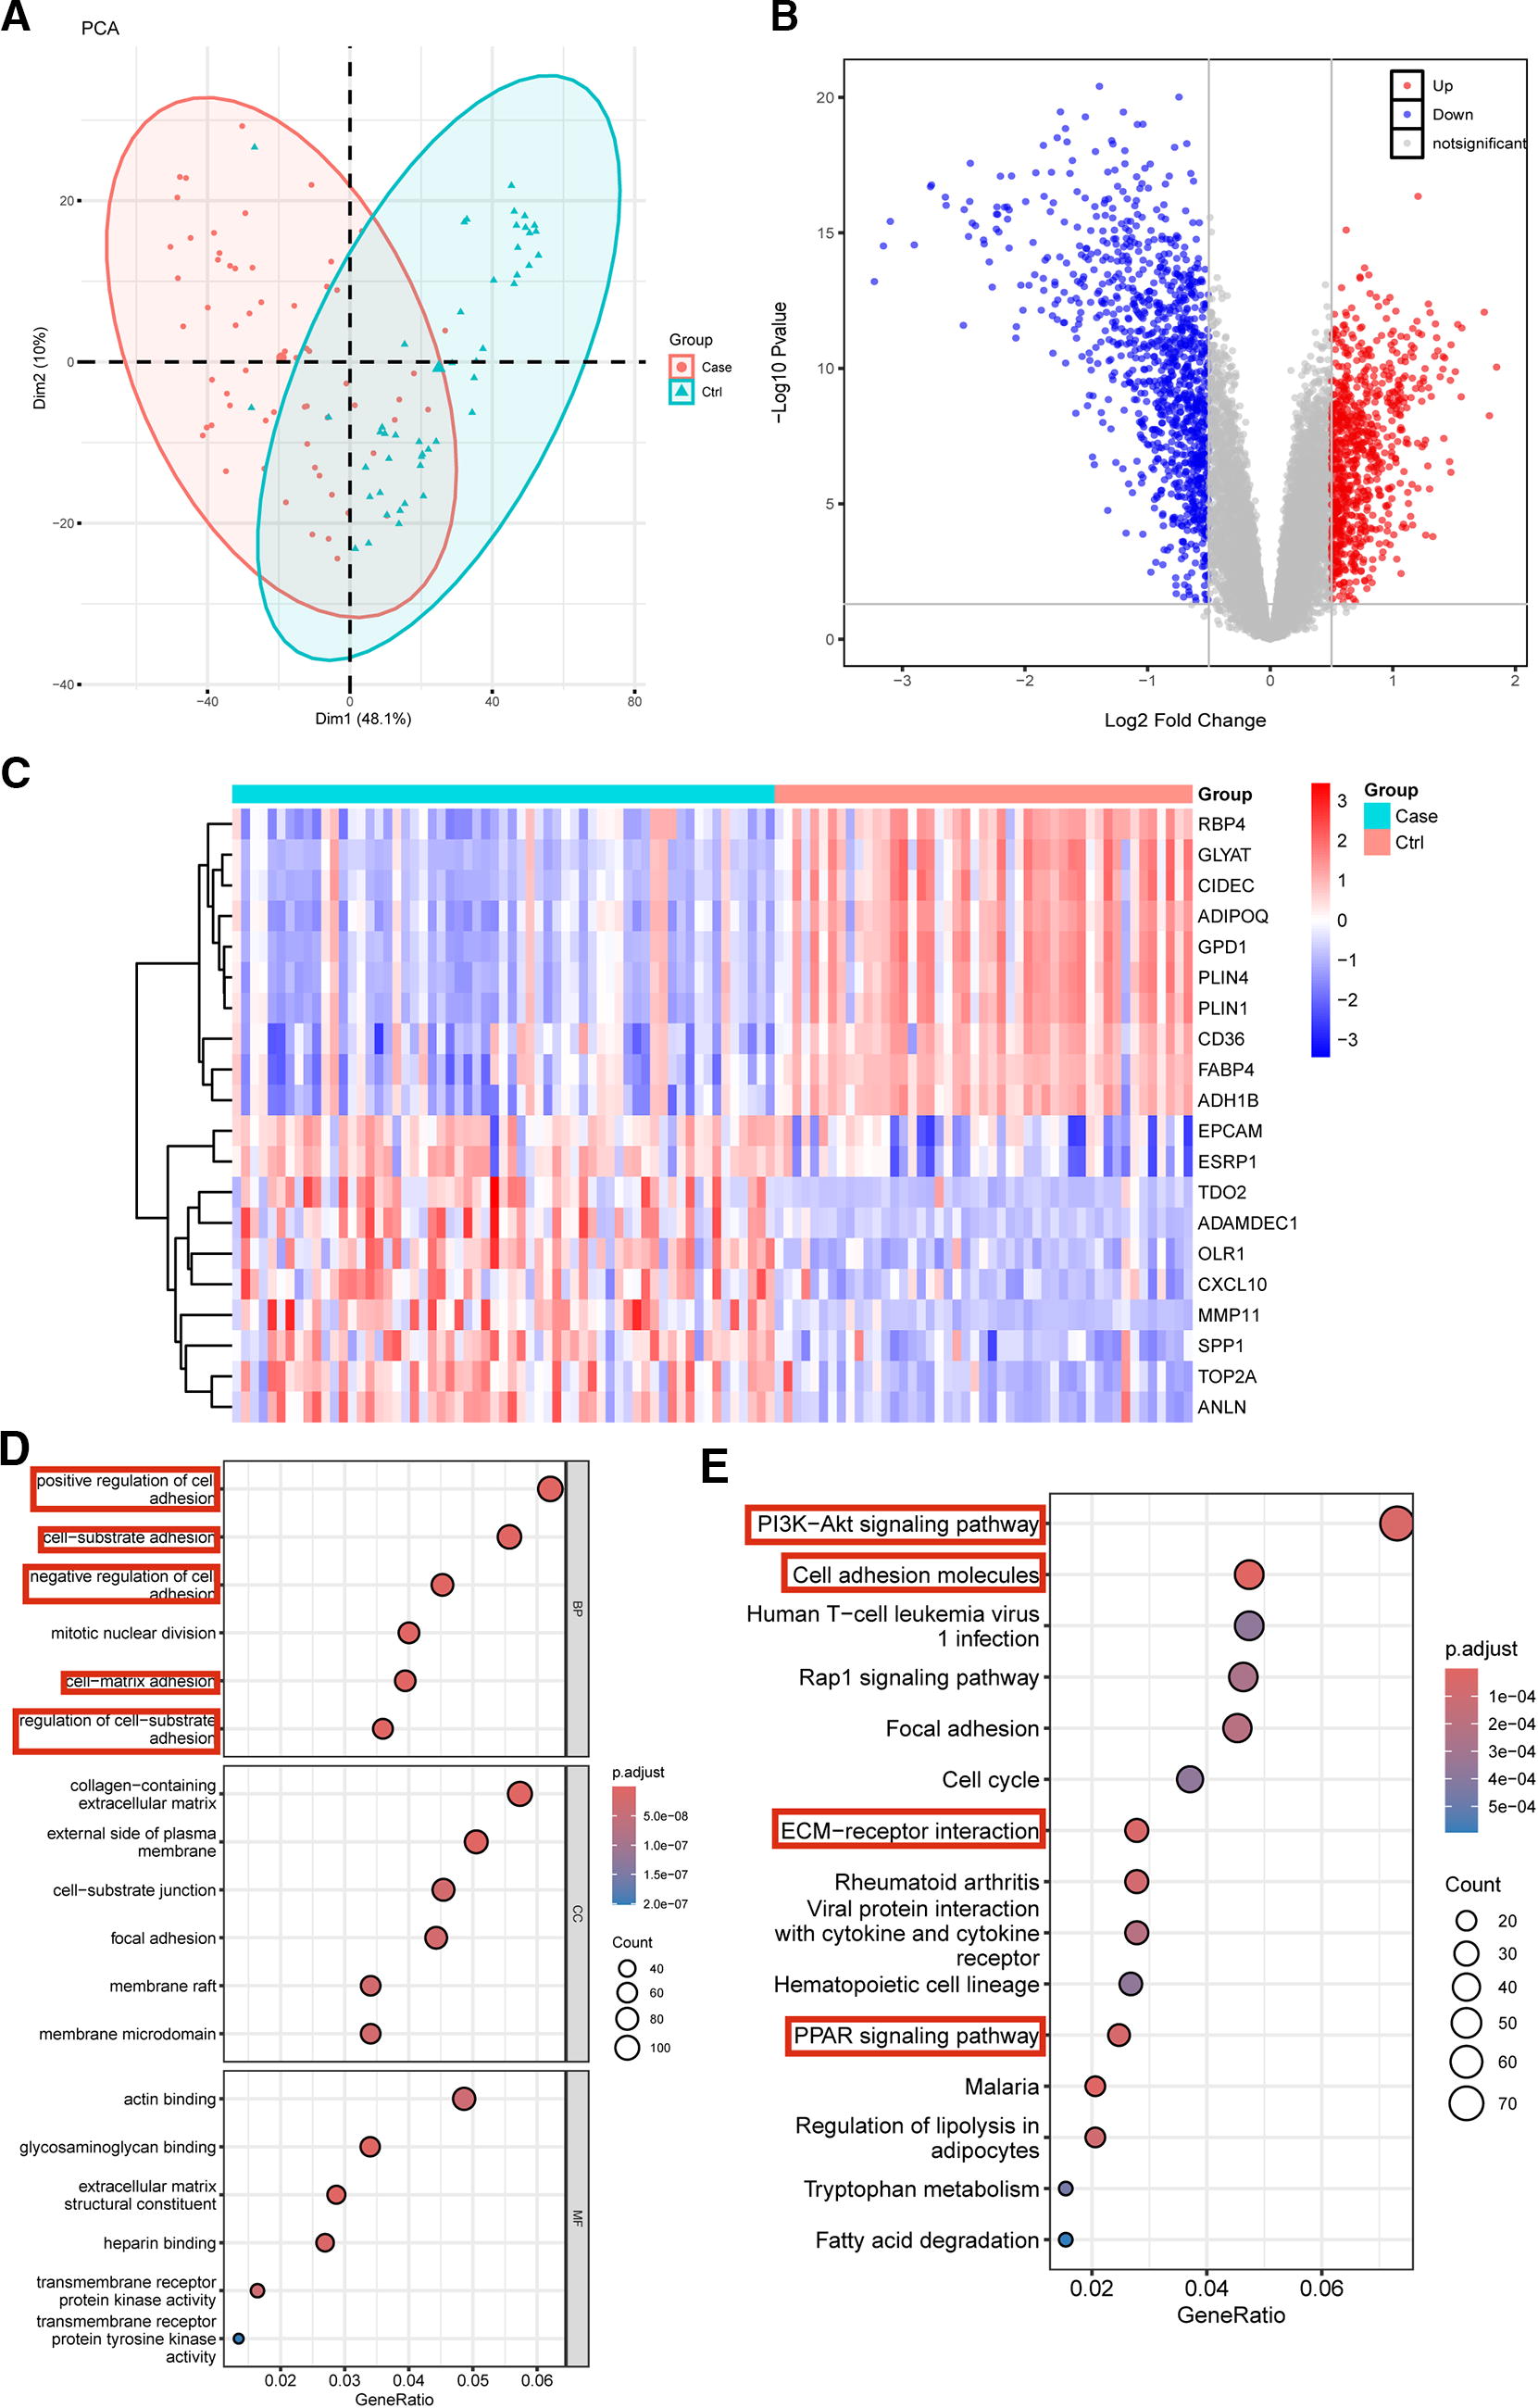
Analysis of differentially expressed genes.
Breast cancer and oxidative metabolism target gene intersection
In the GeneCards database, genes related to oxidative metabolism were searched, and “protein-coding” genes were filtered to obtain oxidative metabolism target genes. Subsequently, by intersecting the oxidative metabolism targets with the DEGs obtained from the dataset, 1214 intersecting genes were obtained (Fig. 2A). Using the STRING database, a PPI network based on the intersecting genes was constructed (Supplementary Fig. S1). The top 10 hub genes in the screened interaction network are shown in Figure 2B. Next, GEPIA (http://gepia.cancer-pku.cn/) was used to verify the expression levels of the 10 hub genes in breast cancer tissues. Compared with the normal controls, all 10 genes were significantly upregulated in breast cancer. The expression levels of KIF4A are shown in Figure 2C, while those of the other nine genes are shown in Supplementary Figure S2. Next, we evaluated the OS of these genes. Among the 10 genes, only the high expression of KIF4A was significantly associated with a significant reduction in OS (p = 0.025) (Fig. 2D), and only the expression level of KIF4A was significantly correlated with different stages of breast cancer (Pr[>F] = 0.00097) (Fig. 2E). The relationship between other genes and OS in patient with breast cancer is shown in Supplementary Figure S3. These findings suggest that KIF4A is a key gene in the progression of breast cancer.
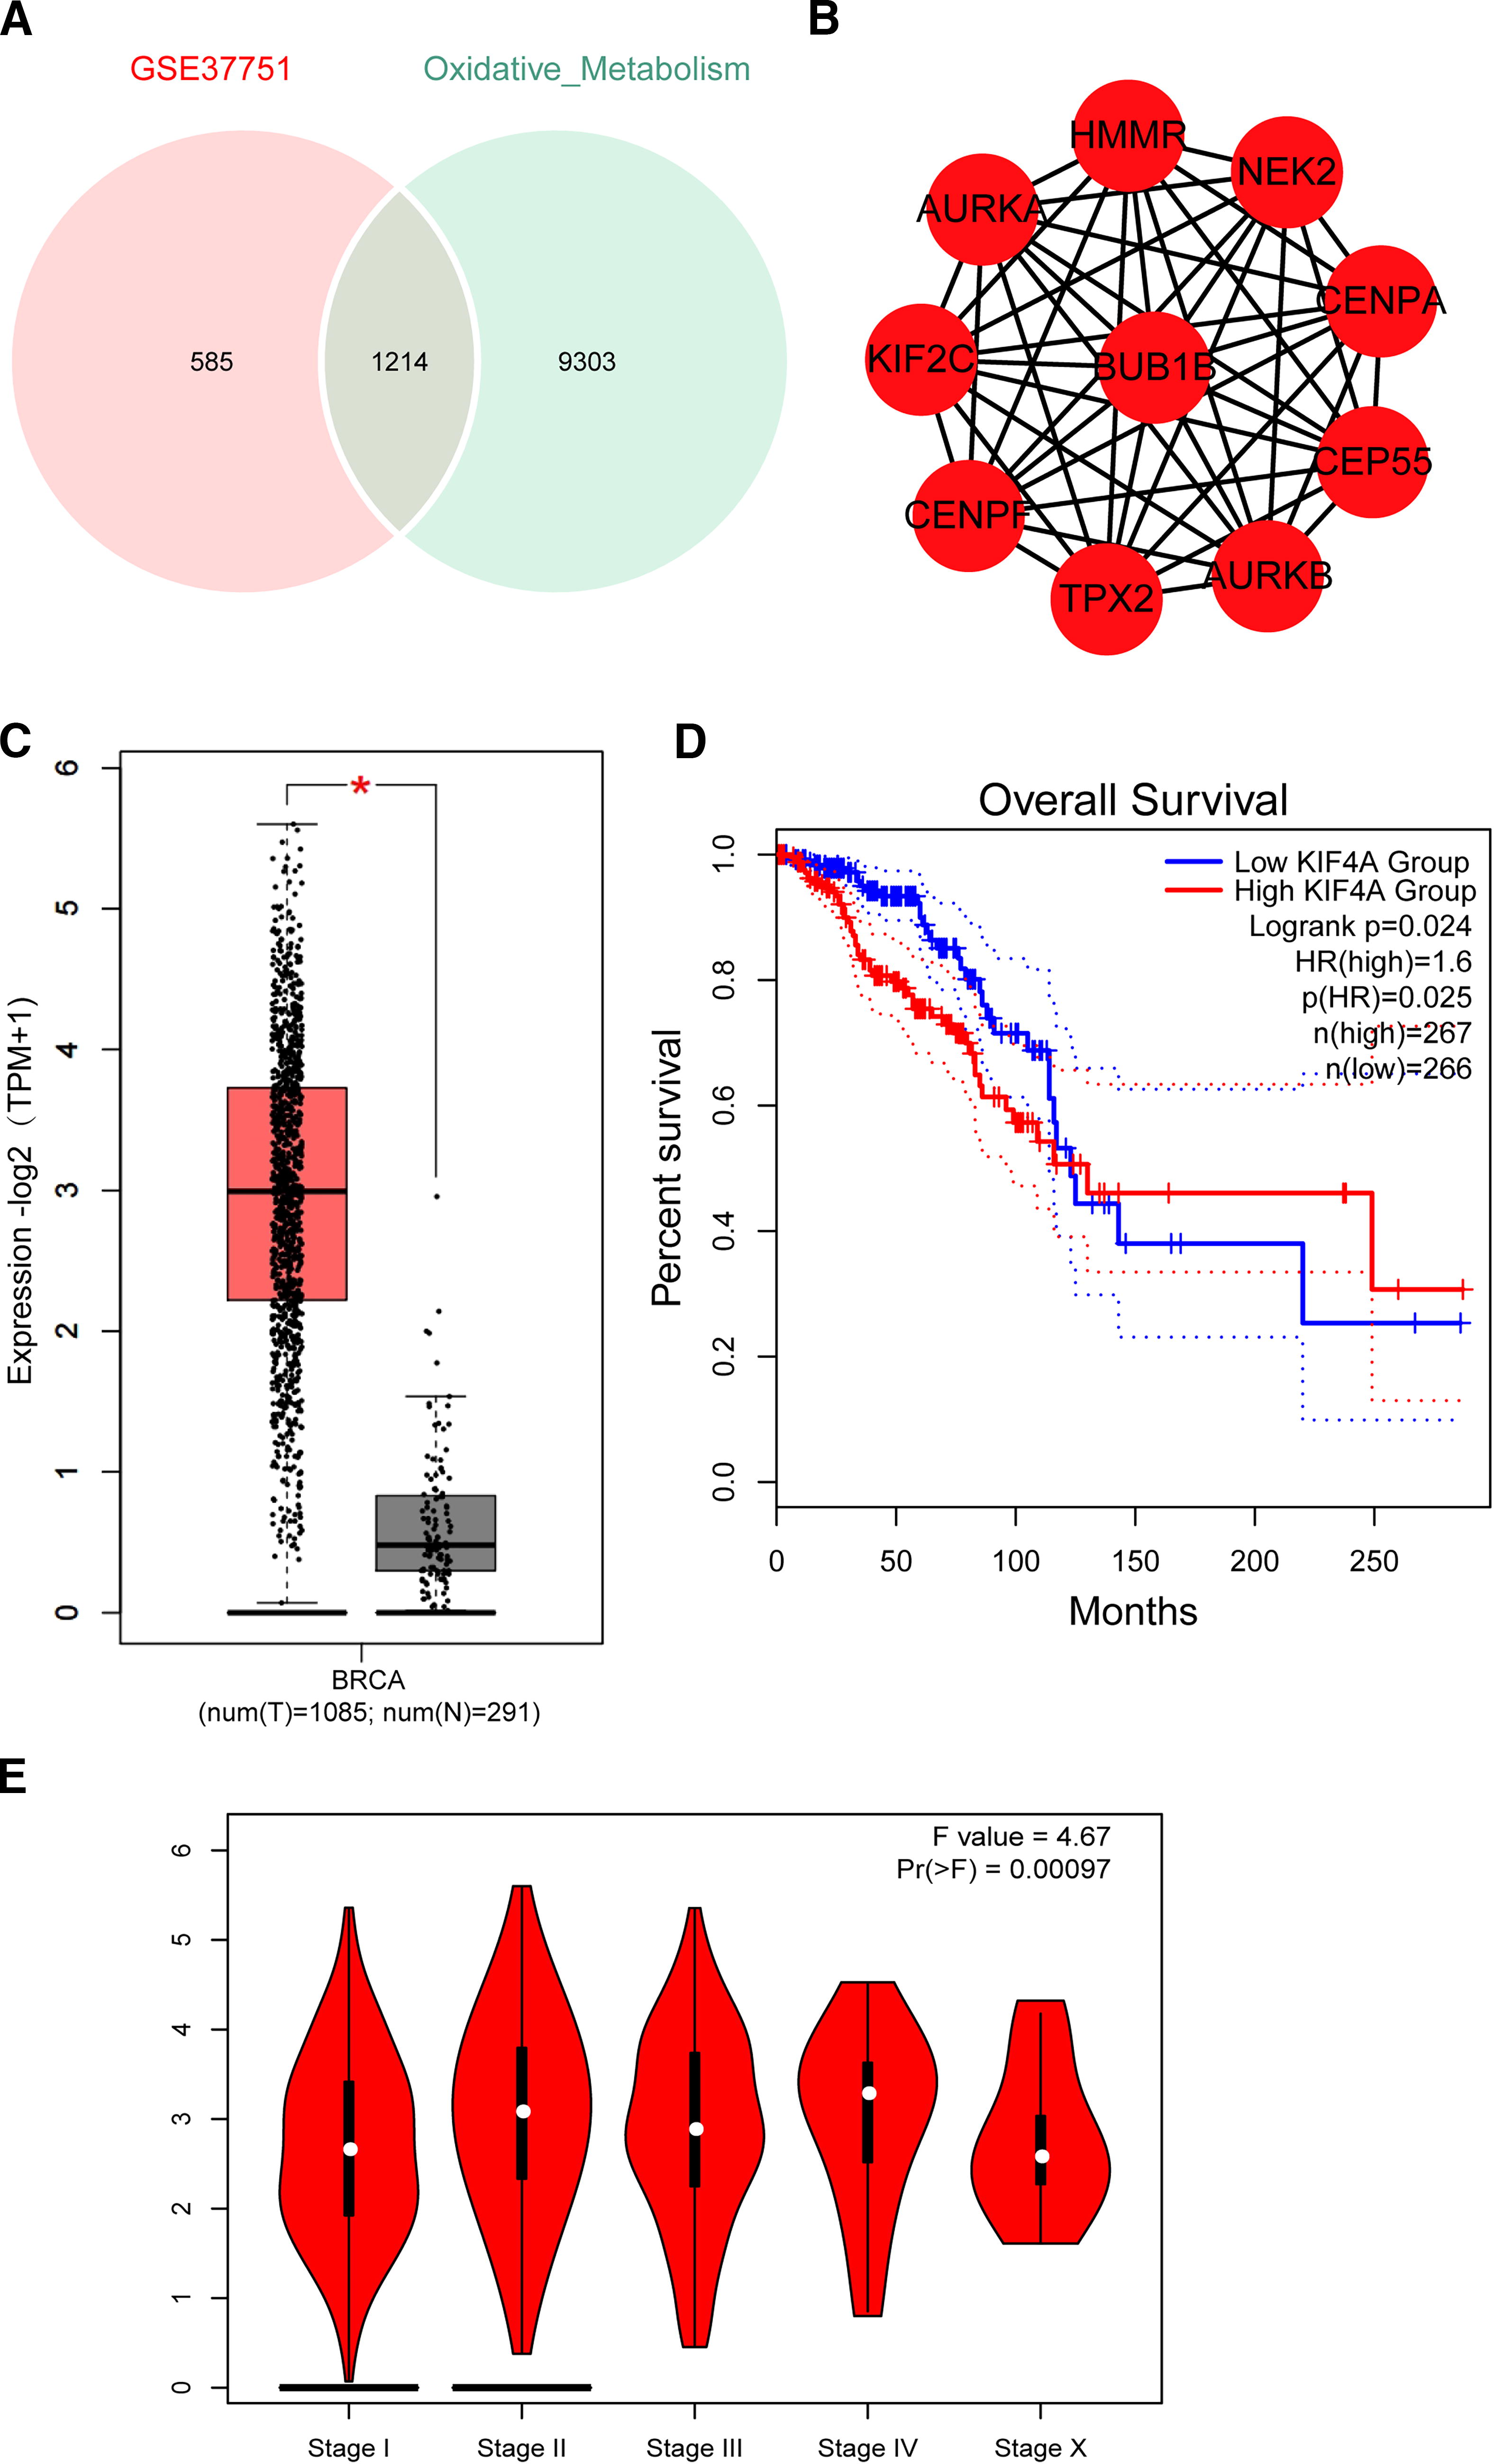
Intersection of breast cancer and oxidative metabolism target genes.
KIF4A is highly expressed in breast cancer cells
We examined the relative mRNA and protein expression of KIF4A in six breast cancer cell lines (MDA-MB-157, MDA-MB-231, MDA-MB-453, MDA-MB-468, MCF-7, and T47D) and in normal breast epithelial cells (MCF-10A). As a result, both the mRNA and protein expression levels of KIF4A were found to be higher in breast cancer cells than in normal breast epithelial cells. The gene and protein expression levels of KIF4A were the highest in the MDA-MB-231 cell line and lowest in the T47D cell line (Fig. 3A, B). To assess the pathological significance of KIF4A in human breast cancer, MDA-MB-231 cells were transfected with si-KIF4A. The cells with the highest si-KIF4A-2 knockdown efficiency were used in subsequent experiments (Supplementary Fig. S4). The knockdown efficiency of KIF4A was confirmed using qRT-PCR and Western blotting. The relative mRNA and protein levels in the KIF4A knockdown group were significantly lower than those in the si-NC group (Fig. 3C).

KIF4A is highly expressed in breast cancer cells.
KIF4A knockdown inhibits breast cancer cell proliferation, migration, and invasion
The CCK8 assay was used to verify the effect of KIF4A on the proliferation of MDA-MB-231 cells (Fig. 4A). The results showed that the cell viability of the si-KIF4A group was significantly different from that of the control group with an increase in the cell incubation time, and the cell viability of the KIF4A knockdown group was significantly lower than that of the blank control and si-NC groups. The EdU assay results showed that KIF4A knockdown significantly inhibited the proliferation of MDA-MB-231 cells compared with the negative control (Fig. 4B). The results of the wound healing assay showed that the si-KIF4A group had the lowest wound healing rate, and that the KIF4A knockdown significantly inhibited MDA-MB-231 cell migration (Fig. 4C). In addition, we used a Transwell assay to verify the effect of KIF4A on cell invasion. Cell invasion was significantly lower in the si-KIF4A group than that in the si-NC group (Fig. 4D).

KIF4A knockdown inhibits breast cancer cell proliferation, migration, and invasion.
KIF4A is a direct target gene of miR-223-3p
We predicted miRNAs that regulate KIF4A expression using TargetScan. All miRNAs showing potential to target KIF4A are listed in Figure 5A. When sorted by Aggregate Pct, the highest score was obtained for miR-223-3p expression. We further aligned the binding sites of miR-223-3p to the 3′-UTR of KIF4A (Fig. 5B). After treatment with miR-223-3p mimics, the luciferase activity in breast cancer cells transfected with KIF4A WT was significantly decreased, whereas the luciferase activity in cells transfected with the miR-223-3p inhibitor and KIF4A WT was significantly increased. These changes were not observed after treatment with the KIF4A MUT (Fig. 5C).
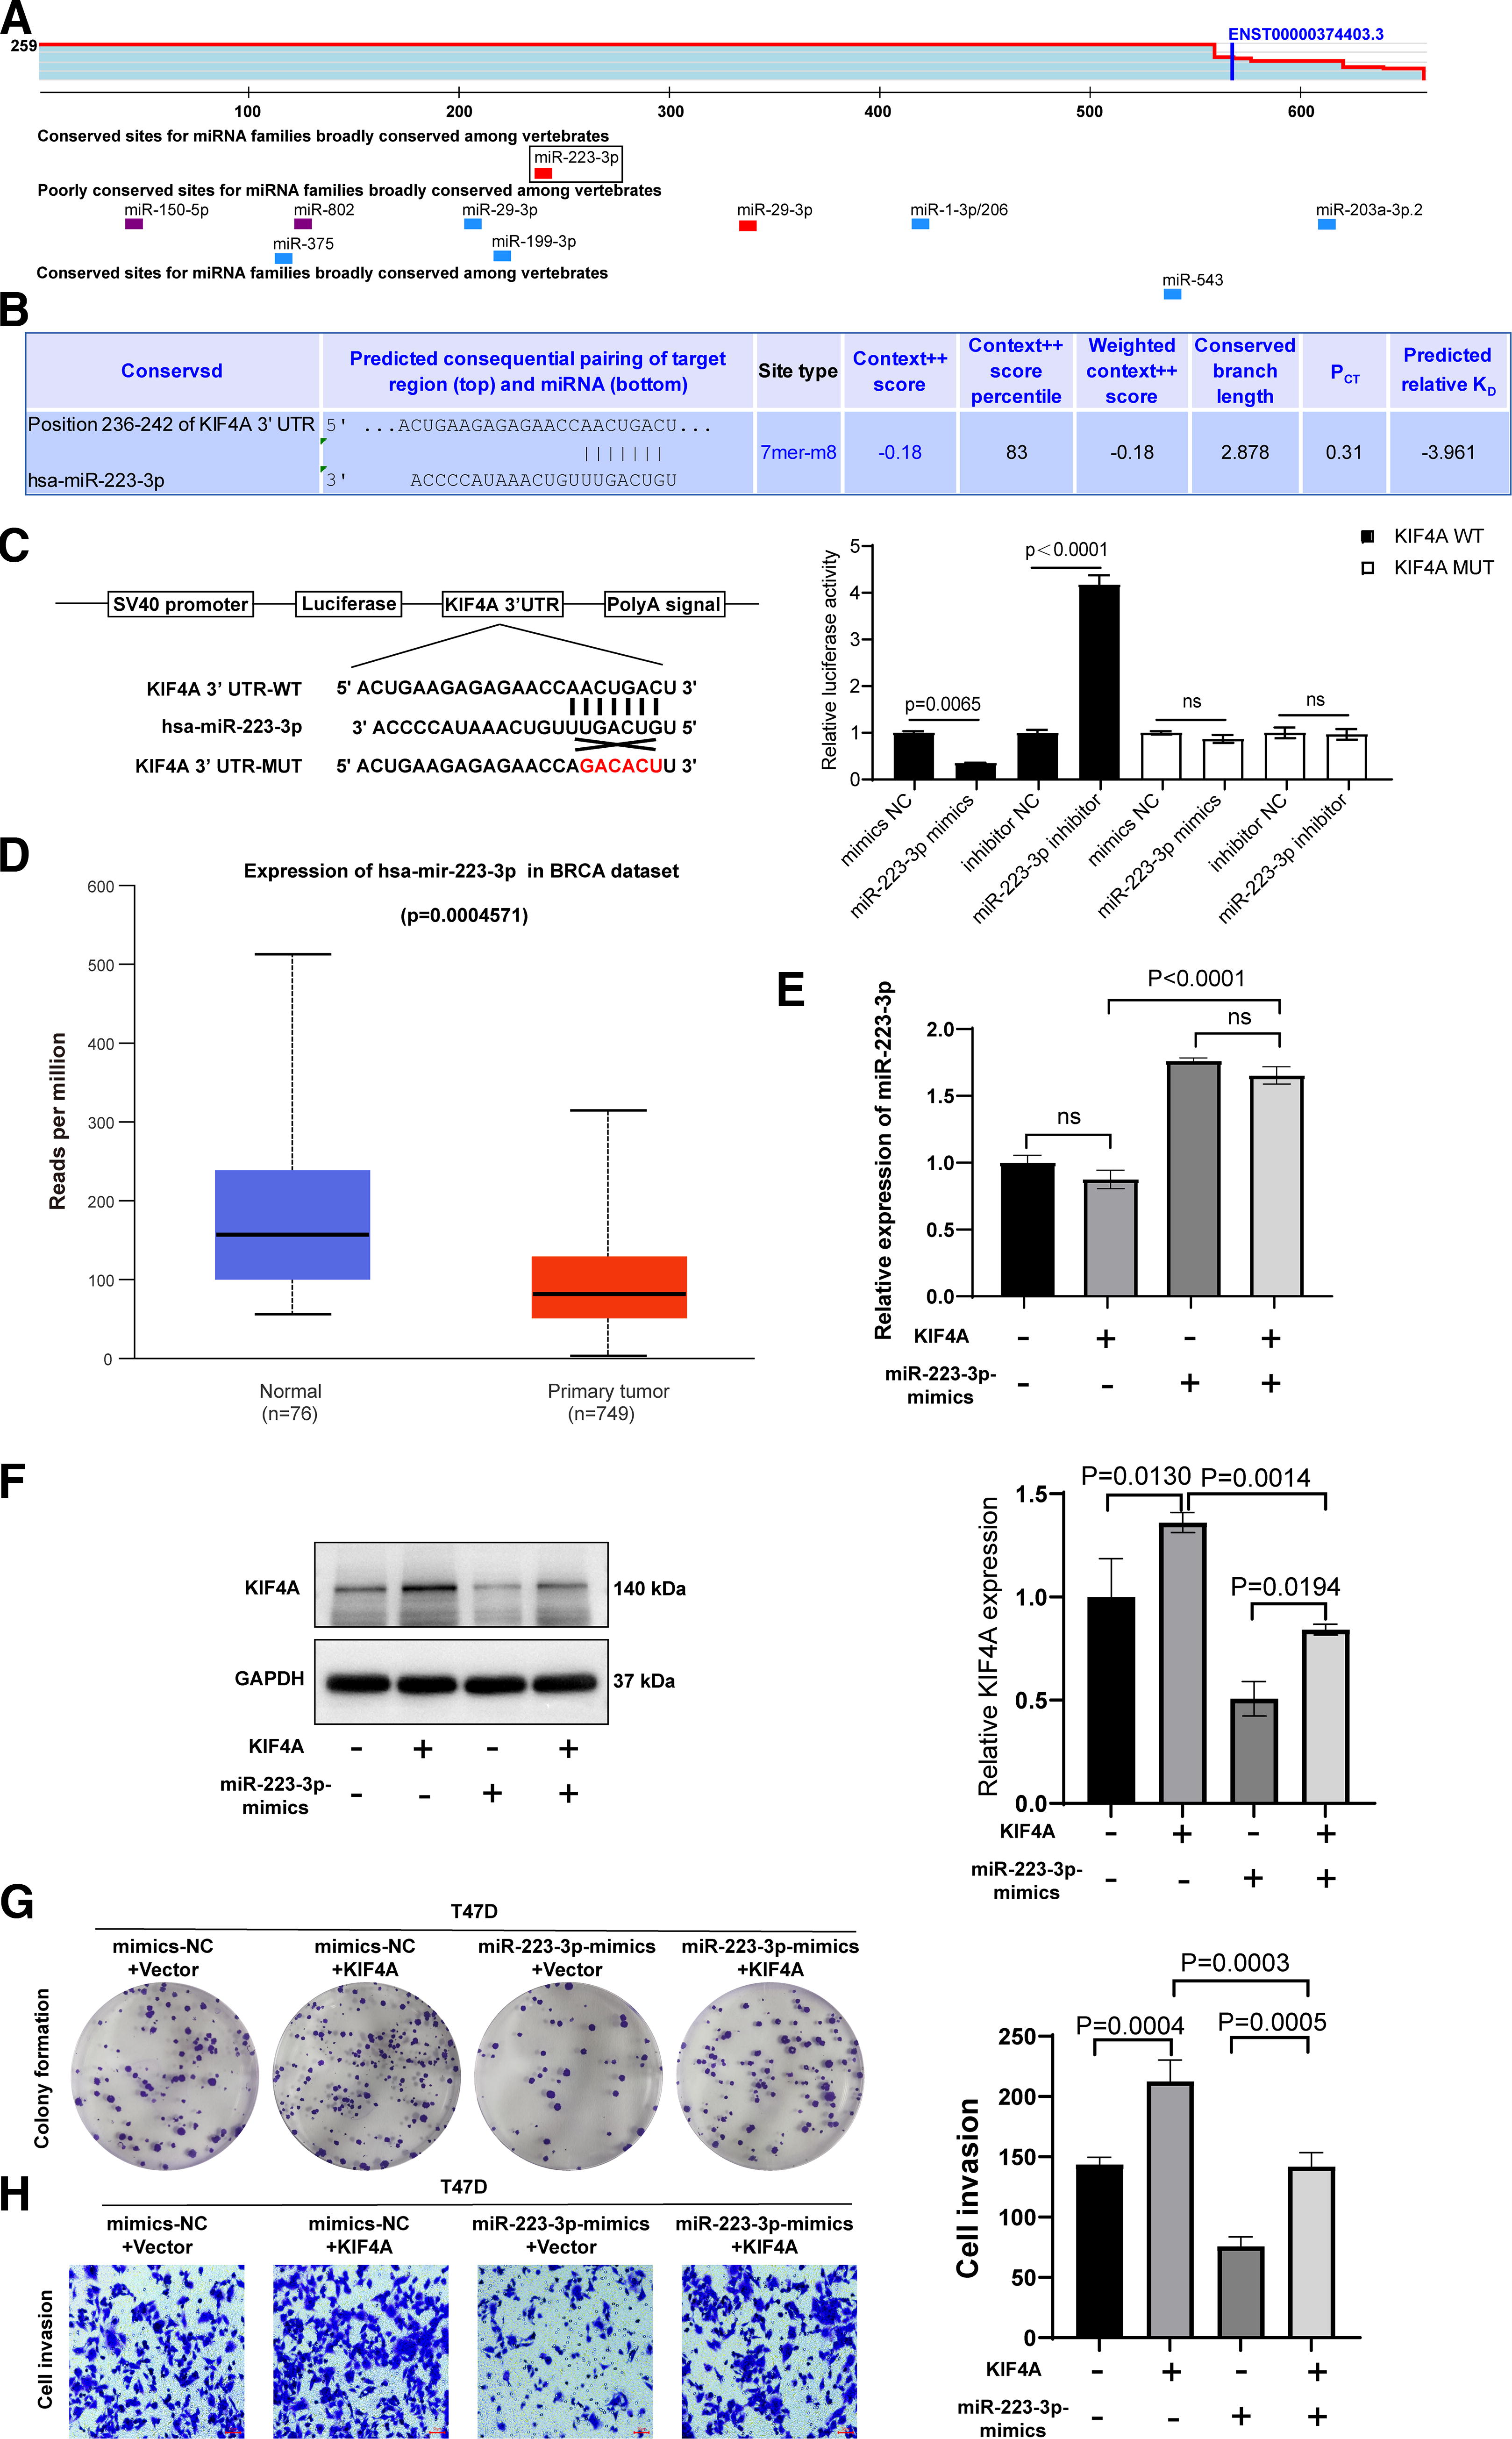
KIF4A is a direct target gene of miR-223-3p.
MiR-223-3p inhibits the proliferation, migration, and invasion of breast cancer cells by inhibiting the expression of KIF4A
UALCAN (https://ualcan.path.uab.edu/analysis.html) was used to evaluate miR-223-3p expression in patients with breast cancer compared with normal tissue. As a result, miR-223-3p expression was found to decrease significantly in breast cancer tissue. To investigate the interaction between miR-223-3p and KIF4A in breast cancer cells, we overexpressed KIF4A and miR-223-3p mimics in T47D cells. The qRT-PCR results showed that KIF4A overexpression had no significant effect on the expression level of miR-223-3p, whereas the Western blotting results showed that miR-223-3p mimics downregulated KIF4A expression in T47D cells (Fig. 5D). In the colony formation assay, the number of cell colonies was highest in the KIF4A overexpression group and lowest in the miR-223-3p overexpression group, whereas the number of cell colonies in the miR-223-3p-mimics + KIF4A group was not significantly different from that in the blank control group (Fig. 5E). Transwell assays showed that KIF4A overexpression significantly promoted the migration and invasion of T47D cells compared to the controls, whereas miR-223-3p mimics significantly inhibited the migration and invasion of cells. KIF4A overexpression reversed the effects of miR-223-3p on the cancer cells (Fig. 5F).
MiR-223-3p targets KIF4A to promote ROS accumulation in breast cancer cells
Using the fluorescent probe DCFH-DA to detect ROS, KIF4A overexpression was found to significantly attenuate fluorescence intensity, whereas miR-223-3p mimics significantly enhanced fluorescence intensity. The fluorescence intensity was restored in the group miR-223-3p mimics + KIF4A (Fig. 6A). In addition, the MDA content was significantly decreased in the mimics-NC + KIF4A group compared to that in the mimics-NC + vector group and was significantly upregulated in the mimics-NC group. However, the effect of miR-223-3p-mimics on T47D cells was partially inhibited by the cotransfection of miR-223-3p-mimics with KIF4A (Fig. 6B). Changes in the SOD activity in each group are shown in Figure 6C. In T47D cells, KIF4A overexpression promoted SOD expression. However, the miR-223-3p mimics suppressed SOD expression, and this inhibition was abolished in the miR-223-3p-mimics-KIF4A group.
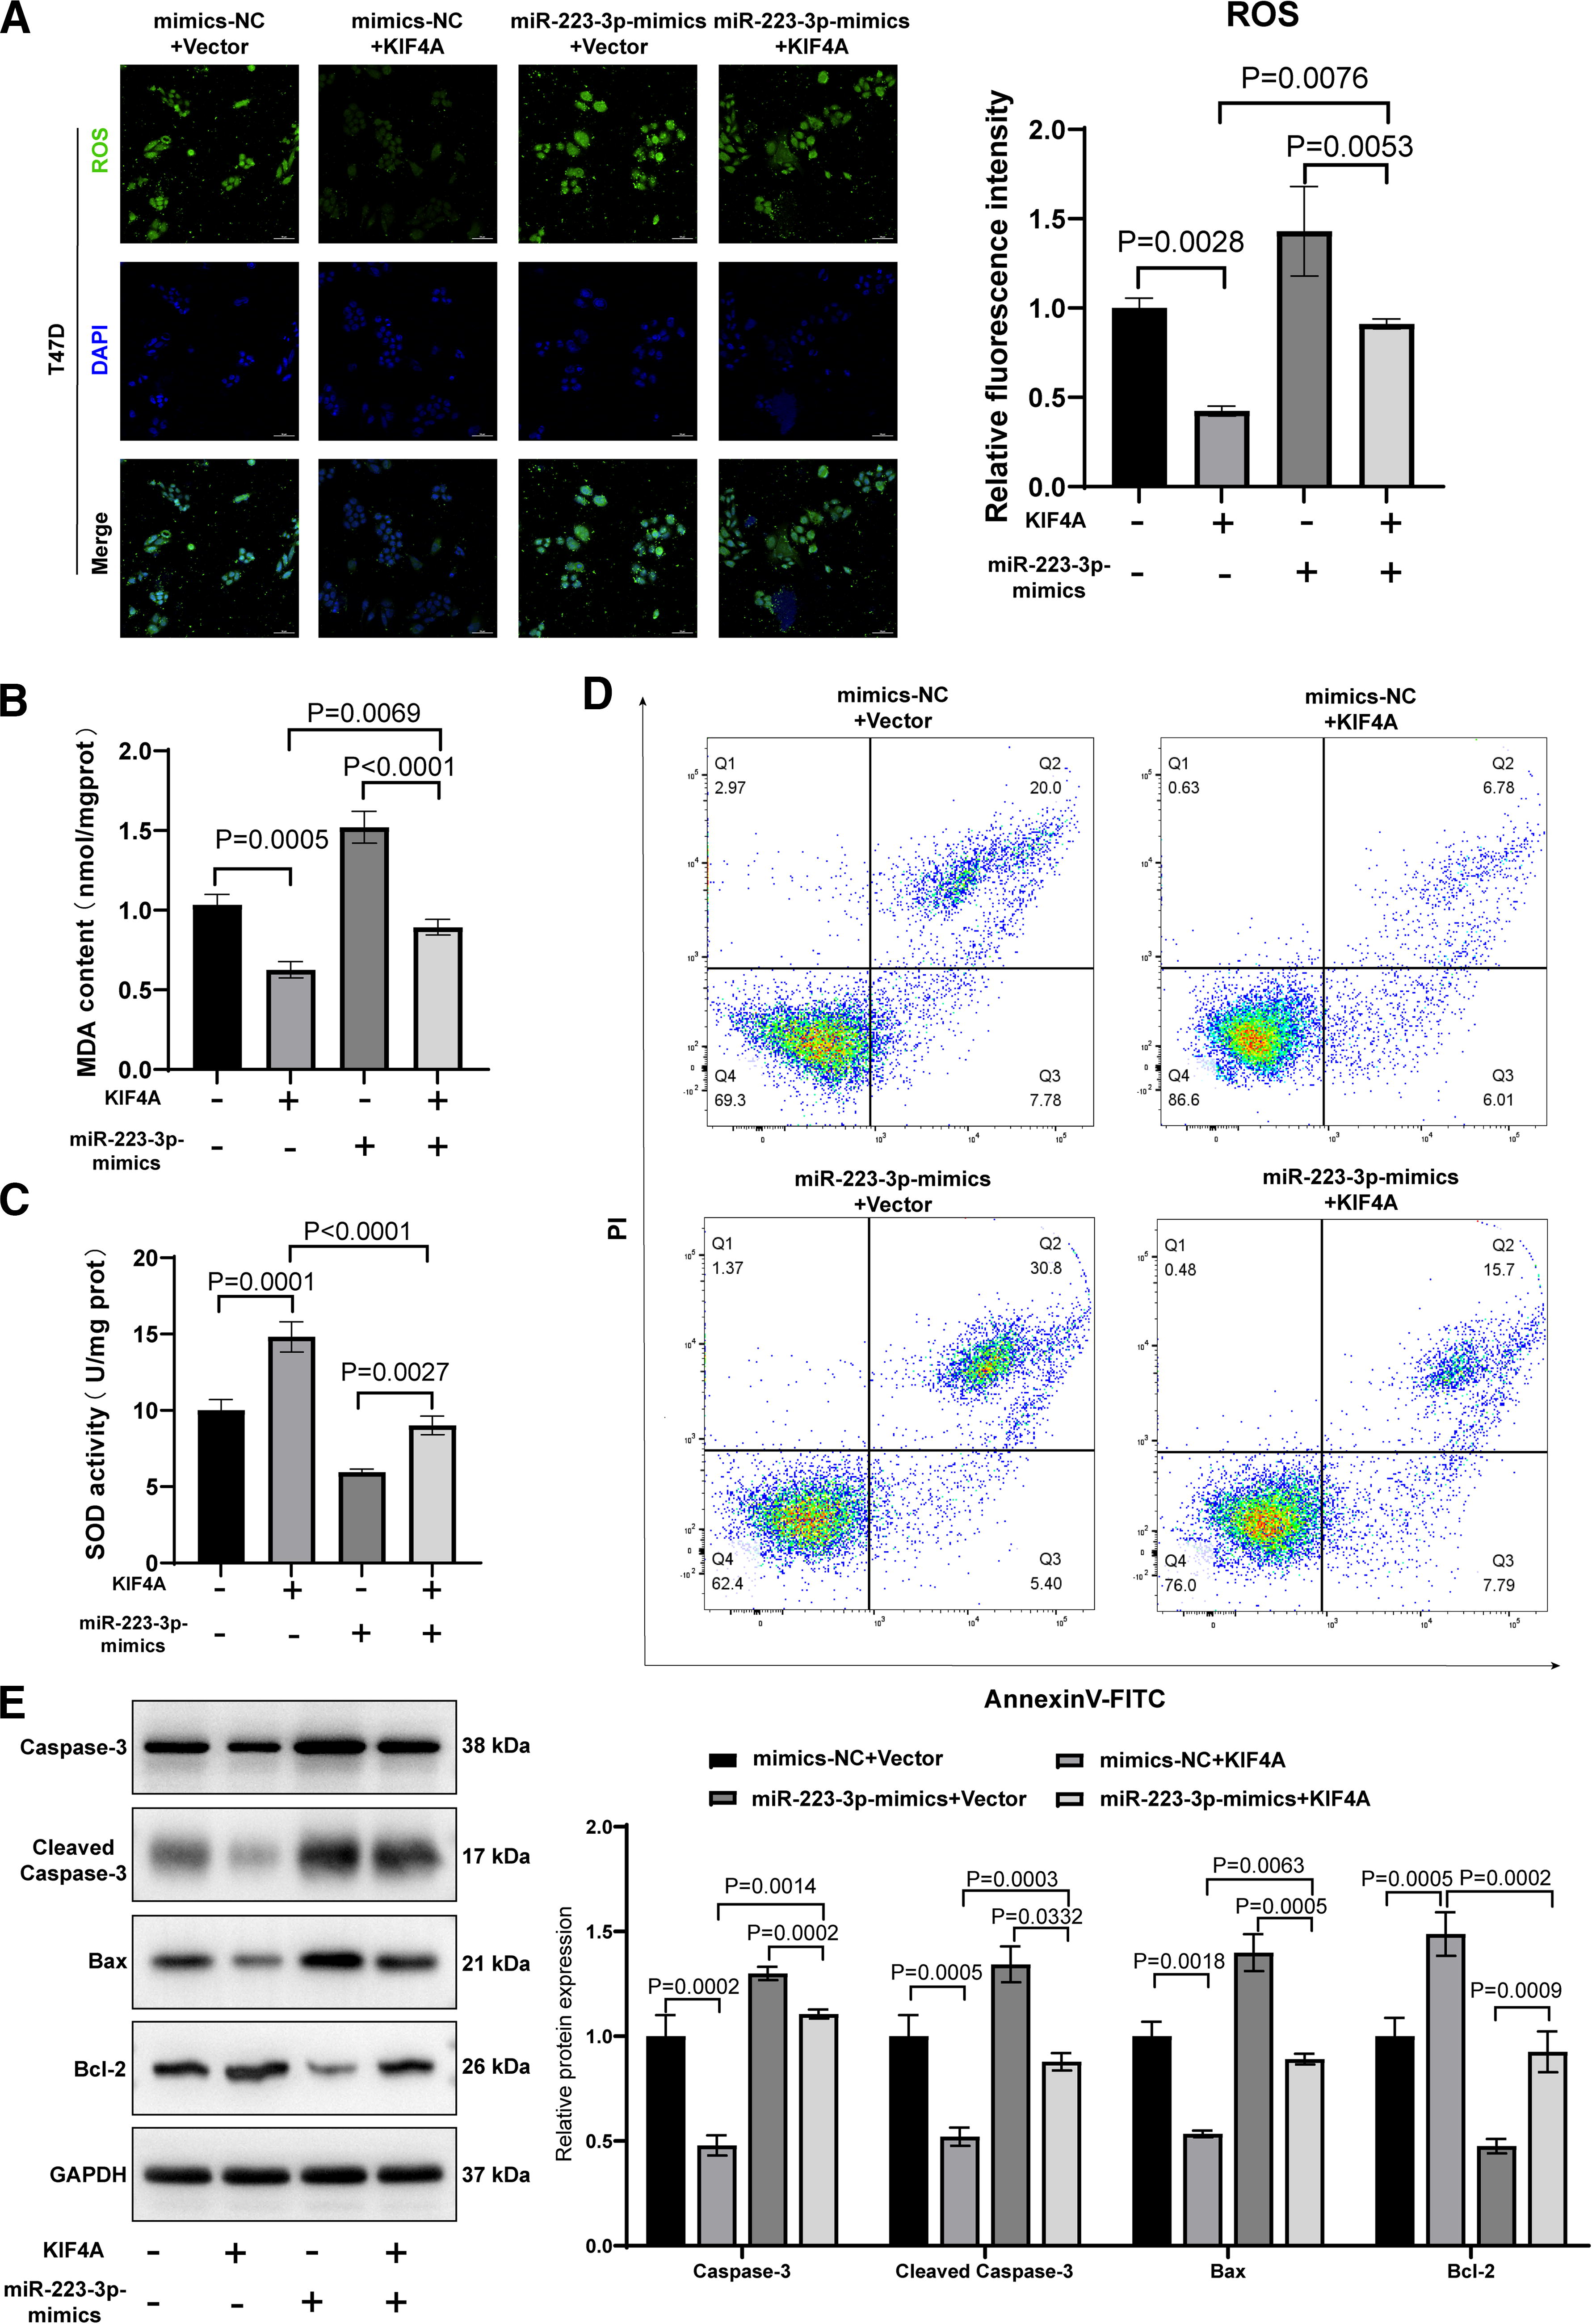
miR-223-3p promotes oxidative stress-mediated apoptosis in breast cancer cells by targeting KIF4A.
MiR-223-3p promotes apoptosis of breast cancer cells by targeting KIF4A
We explored the effects of KIF4A on oxidative stress-mediated apoptosis in breast cancer cells. The flow cytometry results showed that KIF4A overexpression significantly decreased the apoptotic rate of T47D cells, whereas miR-223-3p mimics promoted the apoptosis of T47D cells. The apoptosis rate in the miR-223-3p-mimics + KIF4A group was not significantly different from that in the control group (Fig. 6D). We detected a series of proteins associated with apoptosis by Western blotting, of which Bax and cleaved caspase-3 were expressed the lowest in the KIF4A overexpression group and the highest in the miR-223-3p mimics group. By contrast, the expression of proapoptotic protein in the treatment group of miR-223-3p-mimics+KIF4A did not differ significantly from that in the control group. The expression of the antiapoptotic protein Bcl-2 was significantly upregulated in the KIF4A overexpression group but significantly downregulated in the mimics-NC group. On the contrary, miR-223-3p mimics reversed the inhibitory effect of KIF4A on apoptosis (Fig. 6E).
Discussion
Breast cancer remains a significant global health concern. Understanding the molecular basis of its development and progression is crucial for improving diagnosis and treatment strategies. 42 In this study, KIF4A was identified as a key gene involved in oxidative stress in breast cancer cells. It is well established that KIF4A plays a procarcinogenic role in tumors, including lung cancer, glioma, 33 bladder cancer, 28 and prostate cancer. 29 However, its role in breast cancer is less well studied. KIF4A forms a network with other microtubule-associated genes, leading to the dysregulation of major cellular pathways in tumors. Only miR-379-5p inhibits breast cancer progression by suppressing the expression of KIF4A. The mechanisms of action of these miRNAs need to be further explored. The results of our TCGA−BRCA database analysis indicated that KIF4A expression was significantly upregulated in breast cancer tissues, with this upregulation being related to lower OS and recurrence survival of patients with breast cancer. Our results suggest that KIF4A is upregulated in various breast cancer cell lines, promoting the proliferation, migration, and invasion of MDA-MB-231 cells. Therefore, KIF4A has important research implications in breast cancer. This also validates the conclusion of Xue et al. that KIF4A is a prognostic biomarker for breast cancer. 43
A large number of microRNAs have been found to be dysregulated in human malignancies. MiRNAs inhibit post-transcriptional expression by binding to the 3′-UTR of their downstream target genes. 10 Using cell viability assays, we showed that miR-223-3p inhibits breast cancer cell migration and invasion by downregulating KIF4A expression. The role of miR-223-3p in breast cancer has also been previously investigated. Santana et al. showed that the high expression of miR-223-3p and miR-375-3p in breast cancer was inversely correlated with the secretion of inflammatory cytokines. 18 Relevant studies have been conducted on the mechanism of action of miR-223-3p in other tumors. miR-223-3p was found activate glycolysis in prostate cancer cells by inhibiting FOXO3a expression, and alleviated radioresistance. 44 In a tumor formation assay in nude mice, Jin et al. demonstrated that miR-223-3p in microvesicles promoted Epithelial-mesenchymal transition (EMT) progression in gastric cancer cells by targeting SORBS1. 11 The discovery that miR-223-3p targets KIF4A and regulates its expression adds a new layer to the complexity of breast cancer biology.
Oxidative stress is an imbalance between the oxidative and antioxidant systems in the body, and excessive accumulation of ROS causes damage to DNA, proteins, or membrane lipids, ultimately leading to the development of inflammation, chronic diseases, and cancer. 45 The crosstalk between ROS and miRNAs has been implicated in cancer development. Some studies have shown that ROS may lead to dysregulated miRNA expression and that dysregulated miRNAs are involved in a variety of biological functions via the regulation of the expression of downstream target genes. In contrast, miRNAs may regulate ROS activator or inhibitor genes in response to redox system stabilization. 46 Wang et al. demonstrated that ZNF-148 triggered oxidative stress-mediated pyroptosis in breast cancer cells by targeting the miR-335/SOD2/ROS signaling cascade. 47 Oxidative stress-induced Noncoding RNA Activated by DNA Damage (NORAD) enhances autophagy and induces oxaliplatin resistance in gastric cancer cells by sponging miR-5-12p. 48 Oxidative stress and miRNAs have been associated with biological functions, such as tumor cell metastasis, metabolism, and aging. 49 Our study demonstrated that miR-223-3p targets KIF4A to downregulate its expression. In breast cancer cells, KIF4A overexpression enhanced SOD activity and decreased the ROS and MDA content, thereby attenuating cellular peroxidation damage, while miR-223-3p mimics yielded the opposite results. High oxidative stress induces senescence and apoptosis. Yang et al. found that exosomal miR-551b-3p in bone marrow-derived mesenchymal stromal cells inhibits breast cancer progression by promoting breast cancer cell apoptosis and oxidative stress by inhibiting TRIM31/Akt signaling. 50 Using flow cytometry and Western blotting, we demonstrated that KIF4A significantly decreased the apoptotic rate of T47D cells and downregulated the expression of the apoptosis-related proteins Bax and cleaved caspase-3 in breast cancer cells. At the same time, the expression of the antiapoptotic protein Bcl-2 was significantly upregulated, and miR-223-3p mimics rescued the inhibitory effect of KIF4A on the apoptotic rate of breast cancer cells. These results suggest that miR-223-3p promotes oxidative stress and apoptosis in breast cancer cells by downregulating KIF4A expression.
In this study, we elucidated the targeting relationship between miR-223-3p and KIF4A and described its effects on oxidative stress-related indicators and apoptosis. Our results showed that both miR-223-3p and KIF4A were aberrantly expressed in breast cancer. miR-223-3p promotes tumor cell apoptosis by downregulating the expression of KIF4A, leading to the accumulation of ROS and the exacerbation of oxidative stress in breast cancer cells (Fig. 7). This helps improve our understanding of the complex intracellular regulatory mechanisms during breast cancer development. Detection of the expression levels of miR-223-3p and KIF4A is expected to provide new markers for the early diagnosis of breast cancer. Our research focuses on oxidative stress, repurposing drugs, and administering various vitamins such as E and D as prophylactic agents with tumor-modulatory effects with a positive impact on breast cancer and ROS. 51,52 These findings provide a new entry point for breast cancer treatment.
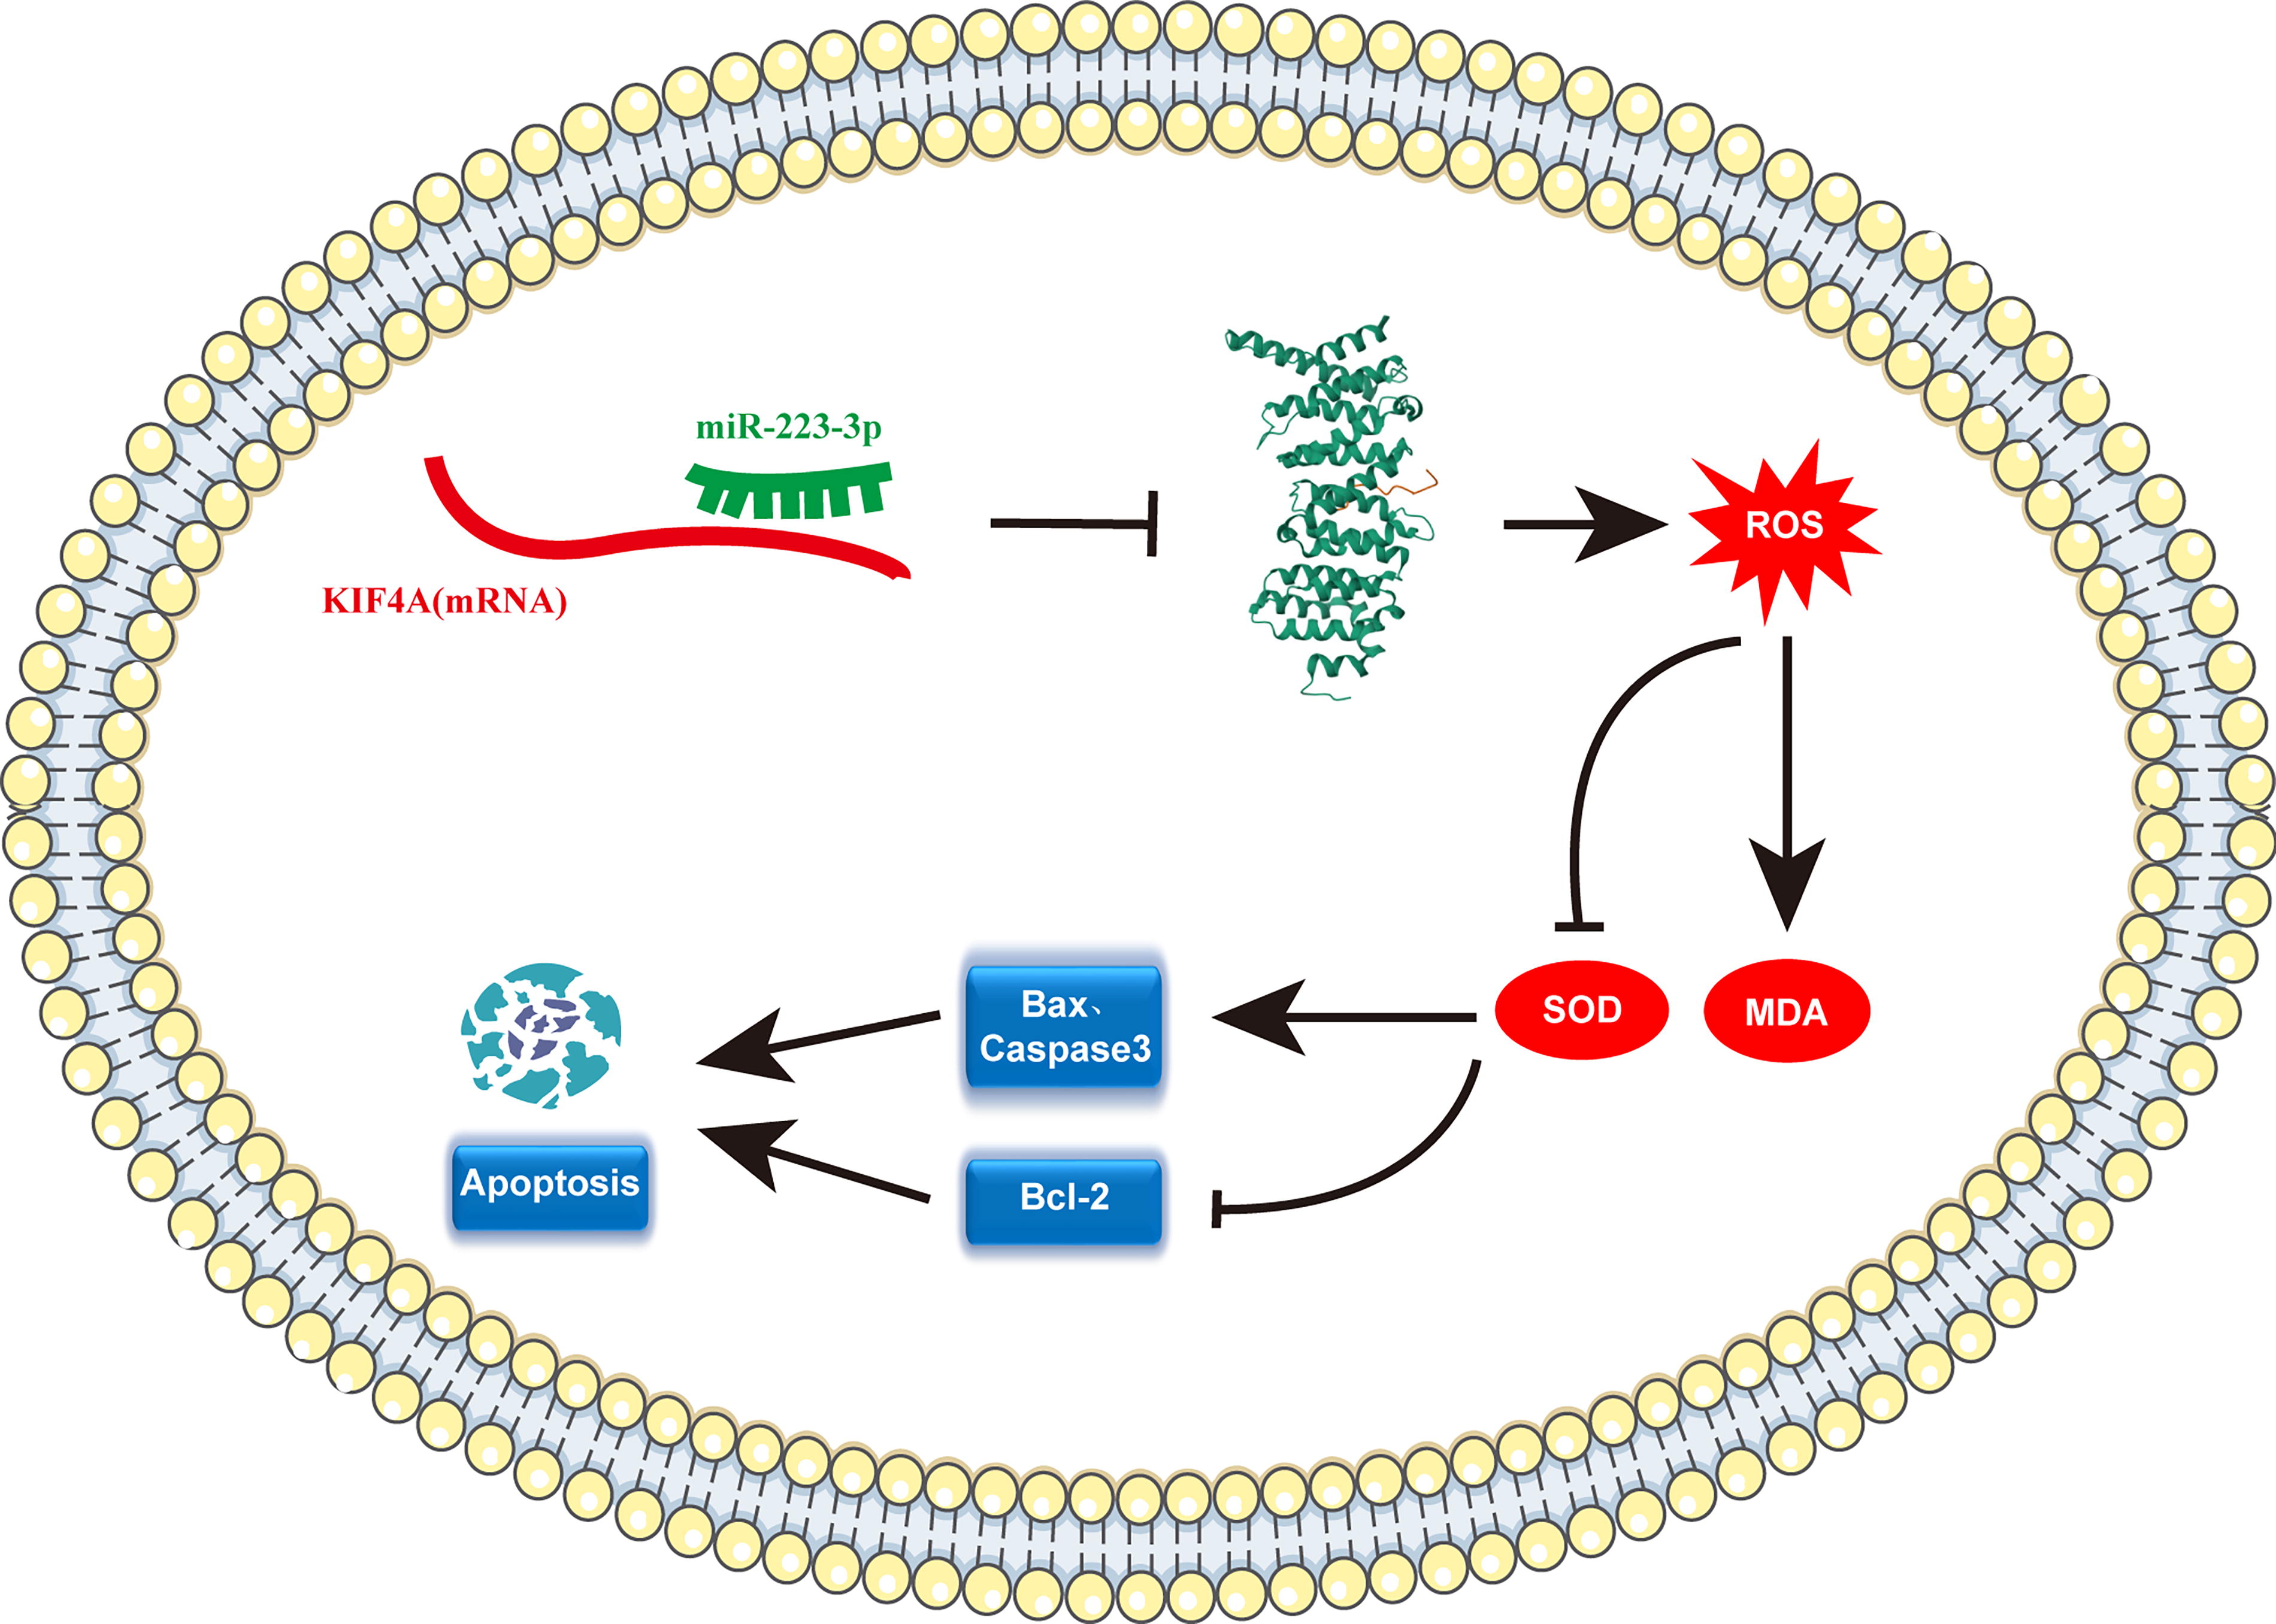
Schematic diagram of miR-223-3p promoting oxidative stress and apoptosis in breast cancer cells. MiR-223-3p binds to the 3′-UTR of KIF4A, which downregulates the expression of the KIF4A gene and protein, increases ROS and MDA accumulation, reduces SOD content, and upregulates the expression of apoptosis-related proteins Bax and cleaved caspase-3 in cells; the expression of antiapoptotic protein Bcl-2 is significantly downregulated, and breast cancer cell apoptosis is promoted.
This study had some limitations. First, the study was validated only at the cellular level and lacked the support of in vivo experiments. Second, the downstream pathways regulated by miR-223-3p and KIF4A have not been fully elucidated and need to be further explored in future studies. In the future, we will further explore the role of the miR-223-3p-KIF4A axis in vivo and establish animal models for validation. On the contrary, the interaction of this pathway with other known breast cancer-related pathways will need to be studied in-depth for the construction of a more comprehensive regulatory network.
Footnotes
Authors’ Contributions
Y.Z.: Preliminary draft writing and experimental data analysis. W.Z.: Experimental scheme design and article revision. Z.W. and Y.C.: Research resource collection. L.F. and J.H.: Experimental data analysis. F.W.: Visualization of experimental results. L.H.: Experimental data collection.
Availability of Data and Materials
The analyzed datasets generated in the present study are available from the corresponding author upon request.
Disclosure Statement
The authors declare that they have no competing interests.
Funding Information
This study was supported by the Key Research and Development Plan of Hebei Provincial Health Commission (20242052).
Supplementary Material
Supplementary Figure S1
Supplementary Figure S2
Supplementary Figure S3
Supplementary Figure S4
Supplementary Table S1
Supplementary Table S2
Supplementary Table S3
Supplementary Table S4
Supplementary Table S5
References
Supplementary Material
Please find the following supplemental material available below.
For Open Access articles published under a Creative Commons License, all supplemental material carries the same license as the article it is associated with.
For non-Open Access articles published, all supplemental material carries a non-exclusive license, and permission requests for re-use of supplemental material or any part of supplemental material shall be sent directly to the copyright owner as specified in the copyright notice associated with the article.