
Abstract
Background:
RAC2 is critical in regulating the homeostasis of hematopoietic stem cells. Nonetheless, its role in breast cancer (BC) remains unclear, necessitating further investigation.
Methods:
The expression of RAC2 in BC and healthy tissues was acquired from The Cancer Genome Atlas. Its validity was further assessed using datasets from the gene expression omnibus database. The Tumor Immune Single-cell Hub database was used to collect and analyze the single-cell RNA sequencing datasets of BC. The diagnostic relevance of RAC2 was evaluated using receiver operating characteristic curves. Further assessment was carried out via enrichment analyses; Gene Set Analysis, immune scoring, single-cell sequencing, and immunohistochemical analysis were conducted to confirm the relationship between RAC2 expression and immune infiltration.
Results:
RAC2 expression was notably heightened in BC (p < 0.001). It was observed that a better prognosis was linked to heightened expression of RAC2 (p < 0.01), with the diagnostic efficacy of the marker noted to be good (area under the curve = 0.858). We found a lower percentage of protumor immune cells and a greater proportion of antitumor immune cells in the high RAC2. Our analysis revealed alterations in gene expression and an enriched network of immune pathways influenced by RAC2. Notably, cytotoxic genes, chemokines, chemokine receptors, immunostimulators, and immunosuppressive molecules positively correlated with RAC2 expression. RAC2 expression reliably predicted how patients would respond to two different therapeutic approaches in BC.
Conclusions:
The RAC2 was found to be a key biomarker in BC in the current study, demonstrating considerable potential as a prognostic and diagnostic marker. These results highlight the RAC2 potential to improve precision medicine strategies and treatment outcomes for patients with BC.
Introduction
Breast cancer (BC) ranks the highest among malignancies affecting women, and its fatality rate displays a steady increase with each passing year. Based on gene expression profiles, BC can be categorized into four primary molecular subtypes: triple-negative BC (TNBC), luminal A and B, as well as human epidermal growth factor receptor 2 (HER2)-positive. HER2 is overexpressed in HER2-positive cancers, whereas luminal A and B subtypes contain estrogen receptor (ER) and progesterone receptor (PR). TNBC, the most aggressive subtype, lacks expression of PR, ER, and HER2 and has limited therapeutic options. BC is prevalent among females in China, affecting over 1.6 million individuals annually, resulting in 1.2 million deaths. 1,2 BC is a diverse ailment with numerous biological characteristics, distinct histological traits, varying clinical manifestations, and diverse treatment responses. 3 In recent years, our comprehension of the biological functions, molecular and cellular mechanisms, and the diagnosis and management of BC has significantly advanced. 4 Nevertheless, the management of BC continues to pose significant difficulties because the available treatment choices predominantly revolve around surgical interventions, chemotherapy, endocrine therapy, and radiotherapy.
In contrast, immunotherapy exhibits clinical effectiveness in only a small fraction of individuals diagnosed with BC. 5 Immune system cells engage in diverse life activities and notably influence cancer prognosis and treatment outcomes. 6 A major challenge is the heterogeneity of BC, characterized by several molecular subgroups that exhibit differing therapeutic responses. Contemporary diagnostic procedures predominantly depend on ER, PR, and HER2 expression and proliferation markers such as Ki-67. Moreover, resistance to treatment, especially for chemotherapy and targeted therapies such as HER2 inhibitors, persists as a significant challenge, leading to disease recurrence and an unfavorable prognosis.
Immunotherapy has surfaced as a potential strategy, especially for TNBC; however, its effectiveness is constrained by immune evasion mechanisms and the formation of immunosuppressive tumor microenvironments (TME). Accumulating data suggest that a heightened degree of immune infiltrates is associated with improved survival and treatment response, notably in the context of immunotherapy for BC. 7 –9 As a result, there is an urgent requirement for innovative biomarkers that enhance diagnostic accuracy and provide therapeutic guidance for more personalized and successful treatments. RAC2, due to its prospective function in tumor suppression and immune regulation, can address certain challenges, providing a novel avenue for prognosis and targeted immunotherapies in BC.
RAC2, or Ras-associated C3 botulinum toxin substrate 2, is a small GTPase enzyme. As part of the small G protein family, RAC2 functions as a molecular switch within cells. These low molecular weight proteins are found in the cytoplasm or inner plasma membrane and play a crucial role in regulating various cellular processes. They are primarily responsible for facilitating the conversion between guanosine triphosphate and guanosine diphosphate. The distribution of these proteins is mainly confined to the inner plasma membrane or the cytoplasm, enabling them to carry out their catalytic functions effectively. 10
This group can be further divided into five subgroups: Rab, Ran, Arf/Sar, Ras, and Rho 11 RAC proteins, G proteins of small size, belong to the Rho family and are involved in regulating various processes, encompassing cell proliferation, gene expression, cytoskeleton formation, and cell adhesion. These pathways primarily involve three distinct subgroups, which are RAC1, RAC2, and RAC3. 12 They are mainly expressed in hematopoietic cells, such as the bone marrow, lymph nodes, and spleen. 13 Several investigations have highlighted that RAC2 plays a significant role in a variety of processes, for instance, in cytoskeleton remodeling, 13 host defense responses, 14 and the expression of oncogenes. 15 Previous literature has observed heightened levels of RAC2 mRNA in most tumor tissues, and this increase was noted to correlate with both prognostic outcomes and the infiltration level of immune cells. Additionally, it has been associated with immunotherapy markers, immunomodulators, and immune-linked pathways. 16 RAC2 has also been found to influence the survival of individuals with BC notably. A machine learning study using The Cancer Genome Atlas (TCGA) database revealed a notable downregulation in the expression of RAC2 in metastatic BC compared to primary BC tumors. 17 The observed outcomes collectively underscore the predictive and potential therapeutic significance that RAC2 holds in cancers. However, an in-depth investigation of RAC2 remains to be carried out in BC.
Herein, an initial investigation was carried out to assess the expression and predictive significance of RAC2. This analysis used BC samples sourced from patients and multiple bioinformatics databases. Utilizing datasets such as TCGA, Gene Expression Omnibus (GEO), and The Human Protein Atlas (HPA), it was observed that RAC2 exhibited elevated levels in BC and displayed associations with the diagnosis and prognosis of individuals with BC. To further elucidate the relationship between RAC2 and immune response, a range of techniques were employed, including Gene Ontology (GO) and Kyoto Encyclopedia of Genes and Genomes (KEGG) analyses, single-cell sequencing, and immune scoring. These investigations highlighted the close association between RAC2 and immune infiltration, particularly in T cells. Moreover, RAC2 exhibited the potential to augment the sensitivity of clinically prescribed chemotherapeutic agents. The findings presented in this study lay the groundwork for potential advancements in the clinical management of BC.
Methodologies
Data acquisition and gene expression assessment
Data retrieved from TCGA was assessed via the Tumor Immune Estimation Resource (TIMER) database (https://cistrome.shinyapps.io/timer/) 18 to examine the levels of RAC2 expression across diverse cancer types. The Genotype-Tissue Expression and TCGA (https://portal.gdc.cancer.gov/) were accessed to acquire the expression profiles of RAC2 in patients with BC, encompassing 1101 tumor and 572 healthy samples. The acquired data are then converted to log2 Transcripts Per Million. The validation datasets (GSE21422 and GSE33447) were accessed at GEO (https://www.ncbi.nlm.nih.gov/). Furthermore, a t-test was utilized to compare RAC2 expression between healthy and tumor groups. The p-values < 0.05 were deemed to reflect statistical significance.
Moreover, the immunohistochemistry (IHC) figures concerning the expression of RAC2 in human healthy and BC tissues were acquired from the HPA (https://www.proteinatlas.org/). BC and adjacent healthy tissues were acquired from Xiangtan Central Hospital following surgery, with the approval of the hospital’s Ethics Committee (Number: 2023-05-004). The pathologists provided accurate diagnoses for the patients, ensuring that those with other malignant tumors were eliminated.
Assessment of the clinicopathological attributes and diagnostic potential
The clinical and pathological attributes and the level of RAC2 expression in individuals with BC were obtained from TCGA. The data were divided into two groups based on the median RAC2 expression: low-expression and high-expression groups. Differences in RAC2 levels across these groups were analyzed using Kruskal–Wallis or t-tests. Additionally, receiver operating characteristic (ROC) curves were employed to assess the diagnostic value of RAC2 in differentiating between healthy and tumor tissues. These curves also evaluated its distinguishing performance across various types of BC, providing a comprehensive assessment of its potential.
Examination of the prognostic significance of RAC2 on survival
The survival data of patients in the TCGA database were assessed via R “survival (v 3.2–10)”. The Kaplan–Meier (KM) Plotter platform (www.kmplot.com), which integrates clinical and gene expression data, was used to evaluate the prognostic significance of RAC2. KM survival curves were drawn for individuals exhibiting varying levels of RAC2 expression. 19
Nomogram and calibration curve
The ROC, KM, and nomogram were established using TCGA-BC data, which provided 1101 RNA-sequencing samples. The pROC package was utilized for ROC curve analysis, and visualization was done using ggplot2 in R. Furthermore, statistical analysis of the KM curves was executed via the survival package, with the survminer package utilized for visualization. For the prediction of survival rates of patients with BC across 1, 5, and 10 years, a nomogram was constructed utilizing clinical age, T stage, N stage, TNM stage, and RAC2 levels. The nomogram construction utilized the “rms” and “survival” R packages. Additionally, the impact of clinical features on the risk score was assessed through decision curve analysis. 20
Functional enrichment analysis
RNA sequencing expression (level 3) data and clinical data pertinent to individuals with BC were accessed at TCGA (https://portal.gdc.com). Subsequently, two groups were established per the expression of the RAC2 gene in the BC dataset: high (n = 551) and low (n = 550). It was observed that 693 genes exhibited upregulation, and 3 exhibited downregulation. Differentially expressed mRNAs were analyzed using R Limma, with adjusted p < 0.05 and log2 (fold change) > 1.5 or <−1.5 as the thresholds. The GO function analysis and enrichment of the KEGG pathway were executed utilizing the R “ClusterProfiler” (v: 3.18.0). Furthermore, boxplots were established using the R ggplot2 package, and heatmaps were generated via the R pheatmap package.
Immunoscore and correlation analysis
RNA sequencing expression data (level 3) and associated clinical data for BC were obtained from the TCGA. To assess the reliability of the immune score evaluation, the R package “immunedeconv” was used, which incorporates six advanced algorithms: TIMER, MCP-counter, xCell, CIBERSORT, quanTIseq, and EPIC. A two-gene correlation map was generated using the R package ggstatsplot. All of the analyses as mentioned above methods and R packages were used with R v 4.0.3, incorporating the ggplot2 and pheatmap software packages. CAMOIP database, an online platform for in-depth multi-omics analysis of immunotherapy across pan-cancer (https://www.camoip.net/), was employed to examine whether the immune score evaluation was reliable.
Single-cell analysis
The BC_UNB_10X_E-MTAB-8107 BC datasets in h5ad format were downloaded from the TISCH2 database (http://tisch.comp-genomics.org/gallery/). TISCH2 is a repository for single-cell RNA sequencing data acquired from human and mouse tumors, allowing for a comprehensive analysis of gene expression in the TME across various cancer types. If the expression of a gene was noted in more than three cells, the gene was deemed as expressed. Additionally, to be considered for inclusion in the analysis, each cell had to express a minimum of 200 genes. The FindVariableFeatures function was utilized to determine the genes with the highest variability based on raw UMI counts, which were then employed in a principal component analysis (PCA). The FindClusters function, using a resolution of 0.3, identified shared nearest neighbors by leveraging the PCA results from the top 20 principal components. Cell states were visualized in two dimensions using uniform manifold approximation and projection for dimensional reduction analysis.
Immunohistochemistry
Formalin-fixed, paraffin-embedded surgical specimens were obtained for IHC analysis. Initially, the tissue sections underwent rehydration and treatment with hydrogen peroxide. The process of heat-induced antigen retrieval was then performed by microwaving with a sodium citrate solution. Subsequently, the slides underwent overnight incubation at 4°C with the relevant antibodies acquired from Abcam (Cambridgeshire, UK) in a chamber under humid conditions. The color reaction was achieved using a DAB substrate kit, with hematoxylin utilized for the nucleus counterstaining process. The protein expression level was evaluated by assessing the staining intensity and extent at 200× magnification under a microscope. The staining extent was determined using a quantity score (0–4), representing the percentage of positive cells: 0, 0%; 1, 1%–10%; 2, 11%–50%; 3, 51%–80%; and 4, 81%–100%. Staining intensity was categorized as weak, moderate, or strong, corresponding to intensity scores ranging from 1 to 3. To derive the final IHC score, the quantity and intensity scores were multiplied.
Immunotherapy and drug sensibility
This study employed the Tumor Immune Dysfunction and Exclusion and submap algorithm to examine the variation in immunotherapy response rates across different groups. 21 Additionally, we conducted a drug sensitivity analysis utilizing the Genomics of Drug Sensitivity in Cancer (GDSC) database. 22 The prediction process was carried out via the pRRophetic package. We investigated the predictive significance of RAC2 in various therapeutic approaches for BC treatment using the Cancer Treatment Response gene signature DataBase (ctr-db). 23 Specifically, we analyzed CTR_Microarray_41 and CTR_Microarray_104. The predictive ability for assessing drug response was evaluated utilizing the area under the curve (AUC) value. NS denotes no statistical variation; *p < 0.05, **p < 0.01, ***p < 0.001.
Statistical analyses
The R (v 4.0.3) software was utilized for conducting all statistical analyses. KM survival curves were established and comparatively assessed using log-rank tests. Spearman’s correlation was employed to determine relationships among variables that did not conform to a normal distribution. p < 0.05 was deemed as a statistically significant value.
Results
RAC2 depicted heightened expression levels in BC in comparison to healthy tissues
RAC2 was initially assessed across diverse human malignant tumors using the TCGA RNA-seq data utilizing TIMER (Fig. 1A). The data revealed elevated RAC2 levels in various malignant tumor types, including cholangiocarcinoma, bladder cancer, esophageal carcinoma, kidney clear cell carcinoma, head and neck squamous cell carcinoma, stomach adenocarcinomas, and thyroid carcinoma. It was observed that the BC tumor group exhibited a heightened expression level of RAC2 in comparison to the healthy group (p < 0.001) (Fig. 1B). Additionally, the analysis of the data acquired from the GEO database revealed that patients with BC depicted heightened expression of RAC2 (Fig. 1C, D). This finding was further supported by clinicopathological information accessed from the HPA database (Fig. 1E).
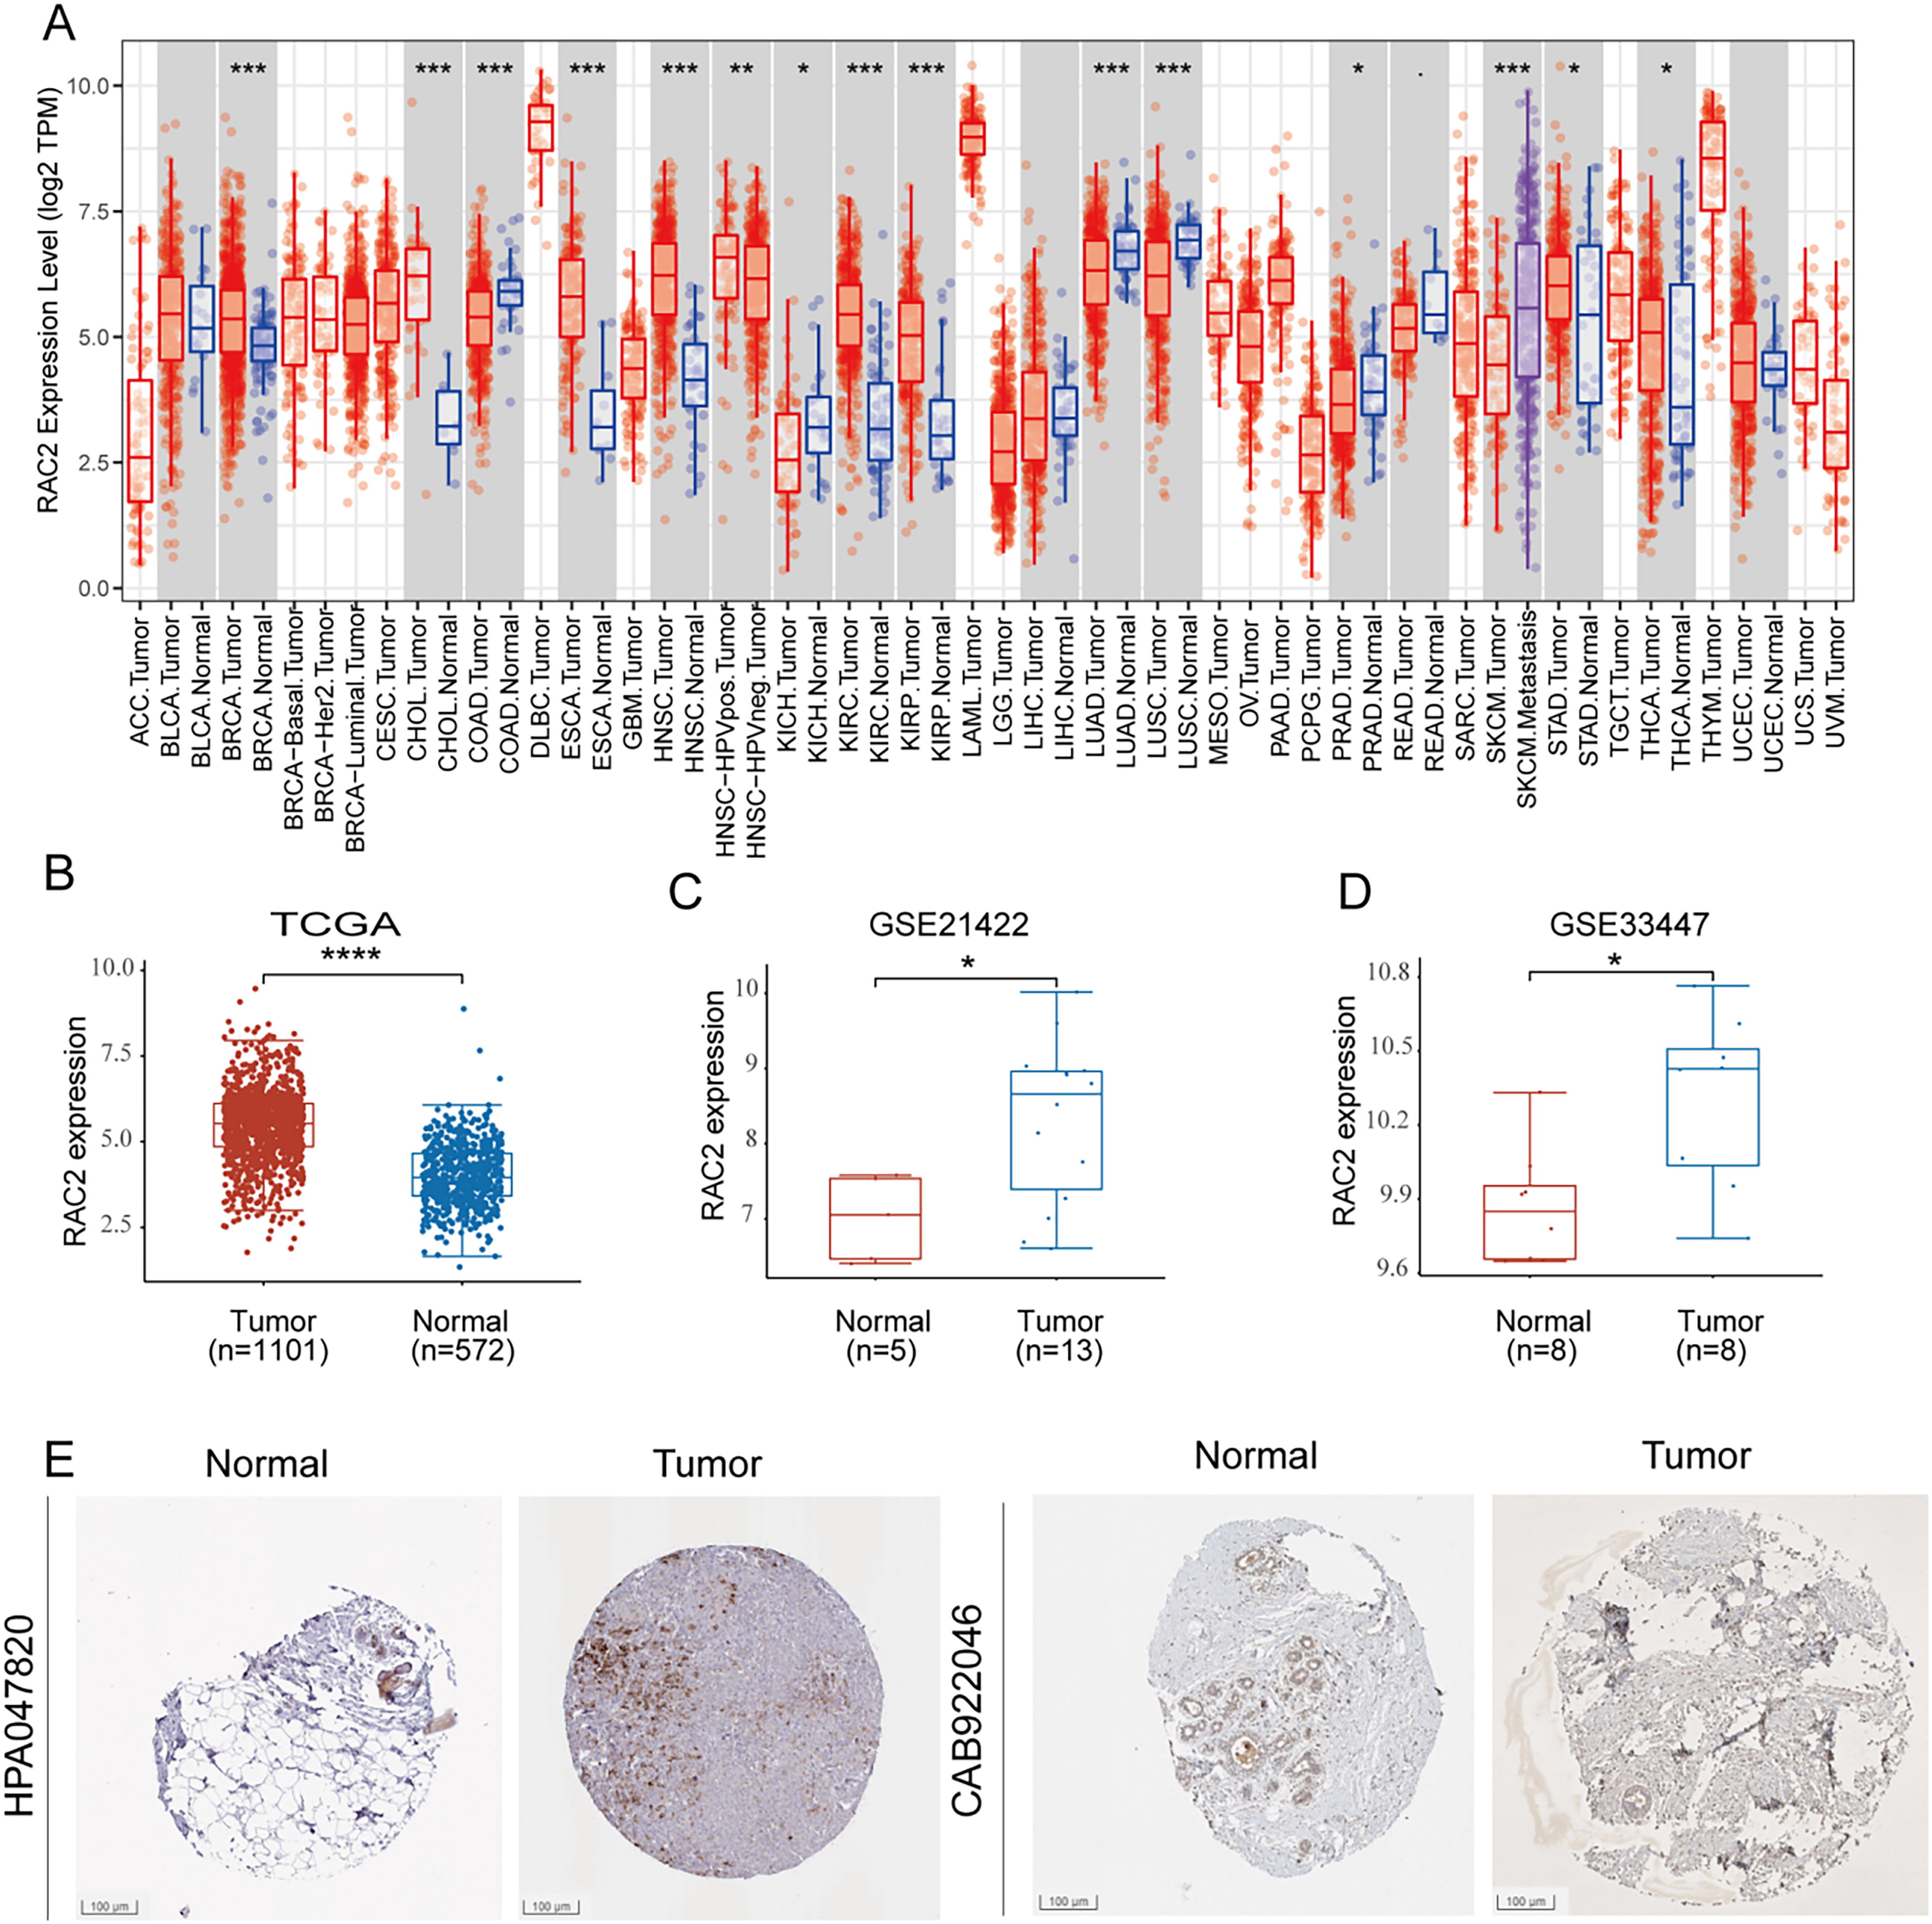
RAC2 displayed elevated expression levels in BC relative to healthy tissues.
RAC2 expression is linked to clinical attributes in BC
The expression of RAC2 was assessed in individuals with BC with distinct clinical and pathological attributes, excluding samples with indeterminate data (Fig. 2A–J). Interestingly, the resulting data showed that the younger patients (≤ 60) exhibit a higher RAC2 level compared with older patients (> 60) (p < 0.05). Additionally, it was observed that individuals with T4 stage tend to have a lower RAC2 expression. Compared with the M1 stage, M0 might have a higher RAC2 expression, which is consistent with the Pathological stage. The acquired data showed that the RAC2 expression in early BC may be elevated compared to metastatic or recurrent BC. The elevated expression of RAC was linked to the negative expression of ER (p < 0.05) and HER2 (p < 0.05).

RAC2 expression is linked to clinical attributes in breast cancer.
RAC2 could function as a biomarker for BC diagnosis
The capability of RAC2 mRNA expression level in distinguishing BC samples from healthy tissues was examined through ROC curves. AUC was observed at 0.858 (95% confidence interval [CI]: 0.840–0.876), with a sensitivity of 77.8% and a specificity of 80.2% (Fig. 3A). The association of RAC2 expression with the status of PR, ER, and HER2 was validated in the outcomes mentioned below. The diagnostic potential of RAC2 was further evaluated in groups categorized by negative and positive expressions of PR, ER, and HER2. Specifically, the analysis comparing ER-negative expression with healthy tissue yielded an AUC of 0.851 (95% CI: 0.819–0.883), with sensitivity at 73.8% and specificity at 83.7% (Fig. 3B). Similarly, when comparing ER-positive expression and healthy tissue groups, the AUC was recorded at 0.860 (95% CI: 0.840–0.879), with a sensitivity of 78.3% and a specificity of 80.2% (Fig. 3C). For PR-negative expression and healthy tissue groups, the AUC of RAC2 was 0.834 (95% CI: 0.805–0.863) with a sensitivity of 73.5% and a specificity of 81.9% (Fig. 3D). The AUC was observed at 0.870 (95% CI: 0.850–0.889) with a sensitivity of 79.7% and a specificity of 80.2% in the comparative assessment of PR-positive expression and healthy tissue groups (Fig. 3E). In the comparison between HER-2 negative expression and healthy tissue groups, the AUC of RAC2 was 0.865 (95% CI: 0.845–0.884) with a sensitivity of 76.2% and a specificity of 83.5% (Fig. 3F). Finally, in the comparison between HER-2-positive expression and healthy tissue groups, the AUC of RAC2 was 0.824 (95% CI: 0.789–0.860) with a sensitivity of 69.7% and a specificity of 80.2% (Fig. 3G).

RAC2 could serve as a biological marker for BC diagnosis. ROC curve analysis of RAC2 expression in
Elevated expression of RAC2 predicts favorable prognostic outcomes in BC
To assess the predictive significance of RAC2, KM survival curves were generated utilizing data from the KM Plotter platform and TCGA database. Individuals were categorized into low- and high-expression groups based on the median RAC2 expression levels. Survival analyses included progression-free survival (PFS), disease-specific survival (DSS), overall survival (OS), and distant metastasis-free survival (DMFS). Remarkably, the findings uniformly demonstrated that patients with BC with elevated RAC2 expression exhibited a notable protective effect (Fig. 4A). Univariate and multivariate analyses highlighted that our model is an independent and favorable predictive factor for patients with BC (Fig. 4B, C, univariate: hazard ratio [HR] = 0.779, p < 0.001; multivariate: HR = 0.853, p < 0.05). To improve clinical utility, a nomogram was developed that integrates the risk score with relevant clinical features (Fig. 4D). Calibration curves exhibited a strong correlation between the predicted survival based on the nomogram and the actual survival (Fig. 4E). Furthermore, our model exhibited good predictive accuracy for patient prognosis (Fig. 4F, 1-year AUC = 0.610, 3-year AUC = 0.617, 5-year AUC = 0.584). These findings underscore the independence of RAC2 expression as a predictor for OS in individuals with BC. Together, these results emphasize the favorable prognostic significance of RAC2 in BC.

Elevated expression of RAC2 predicts favorable prognostic outcomes in breast cancer.
Differentially expressed genes and enriched biological processes of RAC2
Considering the correlation between RAC2 and antitumor immunity, our goal was to identify the differentially expressed genes and enriched biological pathways that are influenced by RAC2 in the tumor immune microenvironment. In investigating RAC2 expression in TCGA utilizing the R “LIMMA,” 696 genes were identified. Among these genes, 693 exhibited upregulation, and three exhibited downregulation (|logFC| > 1.5, adjusted p < 0.05) (Fig. 5A, B). GO and KEGG analyses highlighted that RAC2 is primarily associated with several key biological processes, including interactions between cytokines and their receptors, cell adhesion mechanisms, chemokine signaling pathways, leukocyte adhesion, regulation of cell–cell adhesion, T cell activation, and the differentiation of Th17 cells (Fig. 5C, D). Furthermore, Gene Set Analysis (GSEA) revealed that biological pathways exhibiting enrichment in RAC2-high tumor samples included the interferon-γ response (Normalized Enrichment Scores [NES] = 2.24, p < 0.001), the interferon-α response (NES = 2.05, p < 0.001), known for their contribution to antitumor immunity, and the PD-1 signaling pathway (NES = 2.23, p < 0.001) (Fig. 5E). These findings collectively indicate that RAC2 is involved in regulating immune responses in BC.
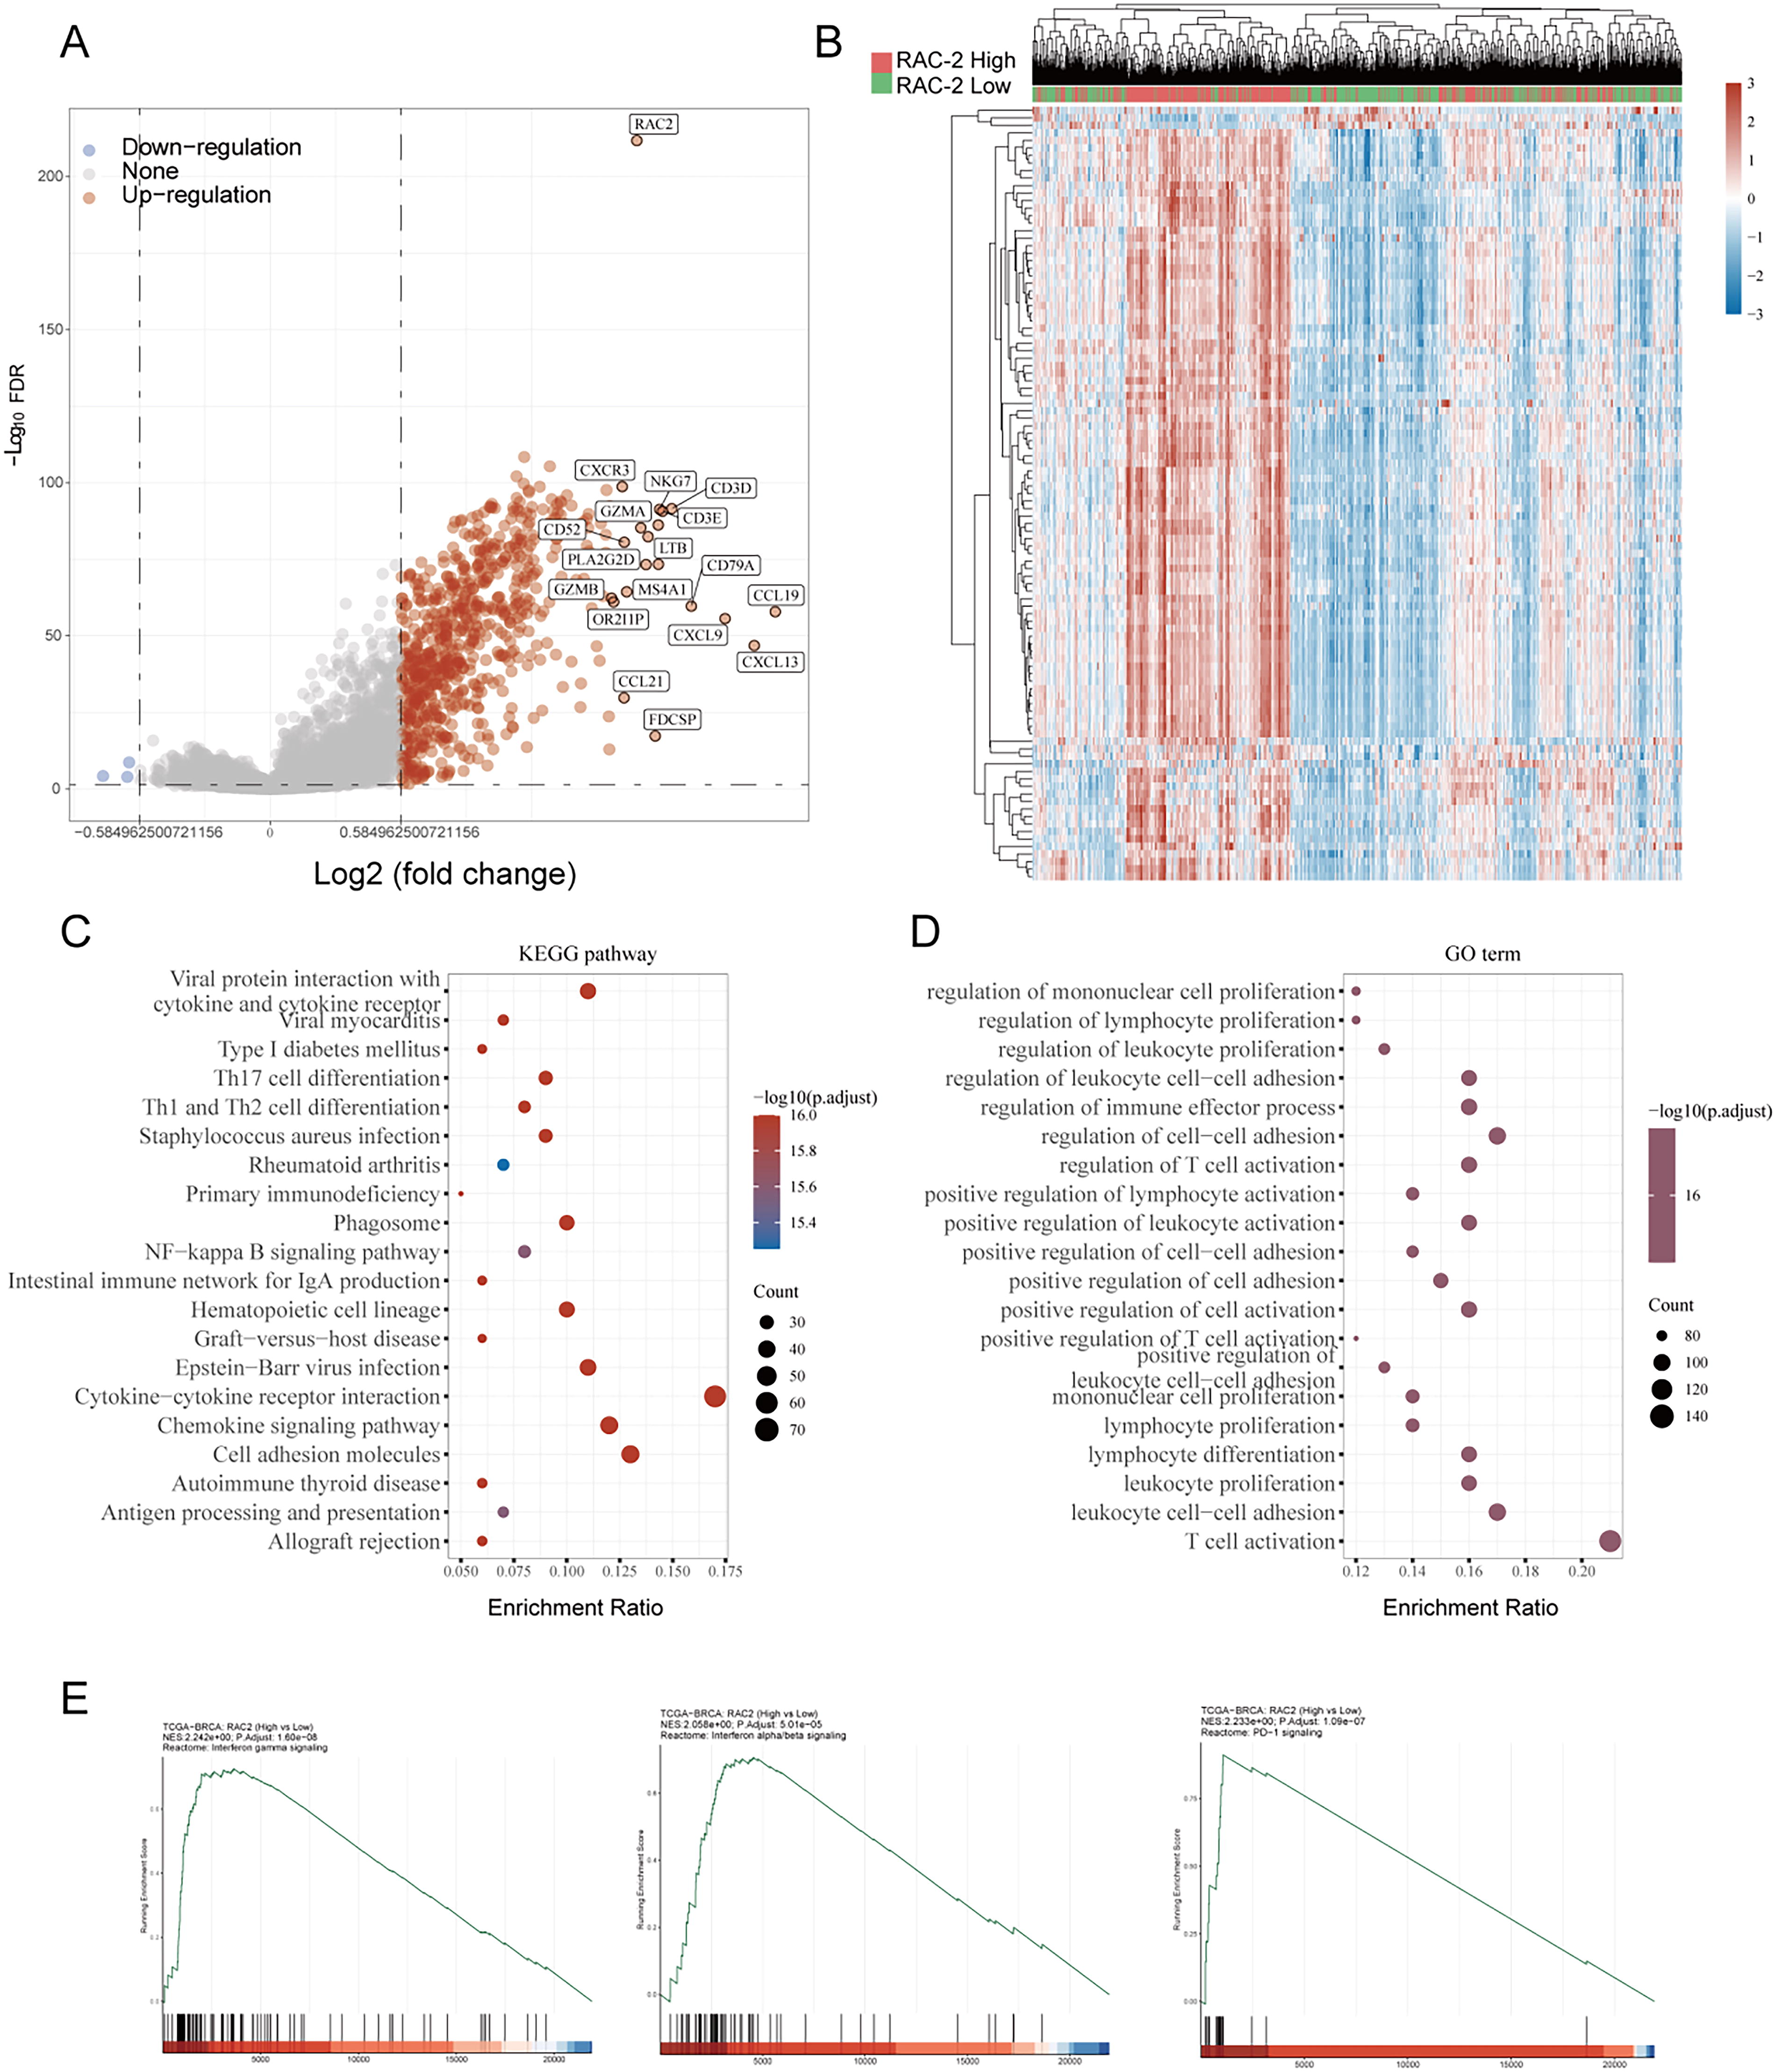
KEGG and GO analysis of RAC2 between the high RAC2 subtype and low RAC2 subtype.
The link between RAC2 and the tumor immune microenvironment
The death of cancer cells regulated by the immune system entails activating lymphocytes and releasing cytokines and chemokines. Enhancing T cell recruitment can optimize strategies for tumor immunotherapy. The link between RAC2 expression and immune cells and related cytokines was investigated. To explore the relationship between RAC2 expression and immune cells and associated cytokines, RNA sequencing data (level 3) and clinical data from patients with BC were obtained from the TCGA dataset. Spearman correlation analysis and immune scoring were conducted using the immunedeconv package. The outcomes revealed the involvement of RAC2 in the immune response of BC, including T cells, B cells, macrophages, and myeloid dendritic cells. The high-RAC2 group exhibited higher immune scores (p < 0.0001), microenvironment scores (p < 0.0001), and stromal scores (p < 0.001) in comparison to the low-TAC2 group (Fig. 6A, B). According to the TIMER algorithm, RAC2 expression exhibited a positive link to the infiltration levels of T cells (CD4+/8+), B cells, macrophages, myeloid dendritic cells, and neutrophils (Fig. 6C). The link of TAC2 with cytotoxic genes, chemokines, chemokine receptors, immunostimulators, and immunoinhibitors was further evaluated using the TCGA database. Cytotoxic genes encompassing IFNG, GZMB, PRF1, GZMM, GZMA, and GZMK exhibited a positive correlation with RAC2 mRNA expression (all p-values are < 0.00; Spearman’s q = 0.57, 0.62, 0.71, 0.71, 0.71, and 0.72) (Fig. 6D). Notably, RAC2 expression was significantly associated with chemokines, including CCL13, CCL2, CCL4, CXCL11, XCL1, XCL2, CXCL13, CCL17, and CCL22 (all p-values are < 0.001; Spearman’s q = 0.47, 0.44, 0.6, 0.47, 0.59, 0.66, 0.52, 0.51, and 0.72) (Fig. 6E). Meanwhile, results displayed that various chemokine receptors, including CXCR5, CCR2, CXCR3, CXCR6, XCR1, CCR4, CCR7, CXCR4, and CCR8, presented the greatest correlations with RAC2 expression (all p-values are < 0.001; Spearman’s q = 0.56, 0.65, 0.75, 0.66, 0.63, 0.63, 0.71, 0.39, and 0.44) (Fig. 6F). Figure 6G highlights the strong link between RAC2 and immune inhibitors including TNFSF18, TNFRSF4, CD86, TNFRSF17, CD27, CD40LG, CD28, TNFSF14, ICOS, TNFRSF9, TMIGD2, CD40, and TNFRSF8 (all p-values are < 0.001; Spearman’s q = 0.34, 0.52, 0.59, 0.54, 0.72, 0.71, 0.66, 0.65, 0.64, 0.64, 0.65, 0.66, and 0.64). Furthermore, several immunosuppressive molecules encompassing HAVCRR2, PD-L1, PDCD1LG2, LAG3, PDCD1, CTLA4, and TIGIT exhibited positive correlation with RAC2 mRNA expression (all p-values are < 0.001; Spearman’s q = 0.53, 0.51, 0.54, 0.53, 0.71, 0.63, and 0.7), as depicted in Figure 6H. These findings indicate that RAC2 is an immunoregulatory factor in BC. Importantly, HAVCRR2, PD-L1, PDCD1LG2, LAG3, PDCD1, CTLA4, and TIGIT exhibited higher expression levels in patients with high RAC2 expression (Fig. 6I). These outcomes highlight that individuals with elevated RAC2 expression may exhibit enhanced sensitivity to immunotherapy. These results highlight the link between RAC2 expression, immunotherapeutic response, and immune cell activity in individuals with BC.

Correlation analysis between immune function and RAC2.
Association of RAC2 with immune-related scores in BC
The relationship between immune infiltrating cells and RAC2 expression is depicted in Figure 7A. RAC2 expression displayed a positive correlation with the Shannon and richness of T cell receptor and B cell receptor. Additionally, RAC2 positively correlated with lymphocyte infiltration signature score, stromal fraction, tumor-infiltrating lymphocyte fraction, and Th1 cells. Moreover, higher RAC2 expression was linked to an enhanced response to Interferon (IFN)-γ and Transforming Growth Factor Beta (TGF-β). On the contrary, malignant features, including aneuploidy score, proliferation, and homologous recombination defects, showed a negative correlation with RAC2 expression.
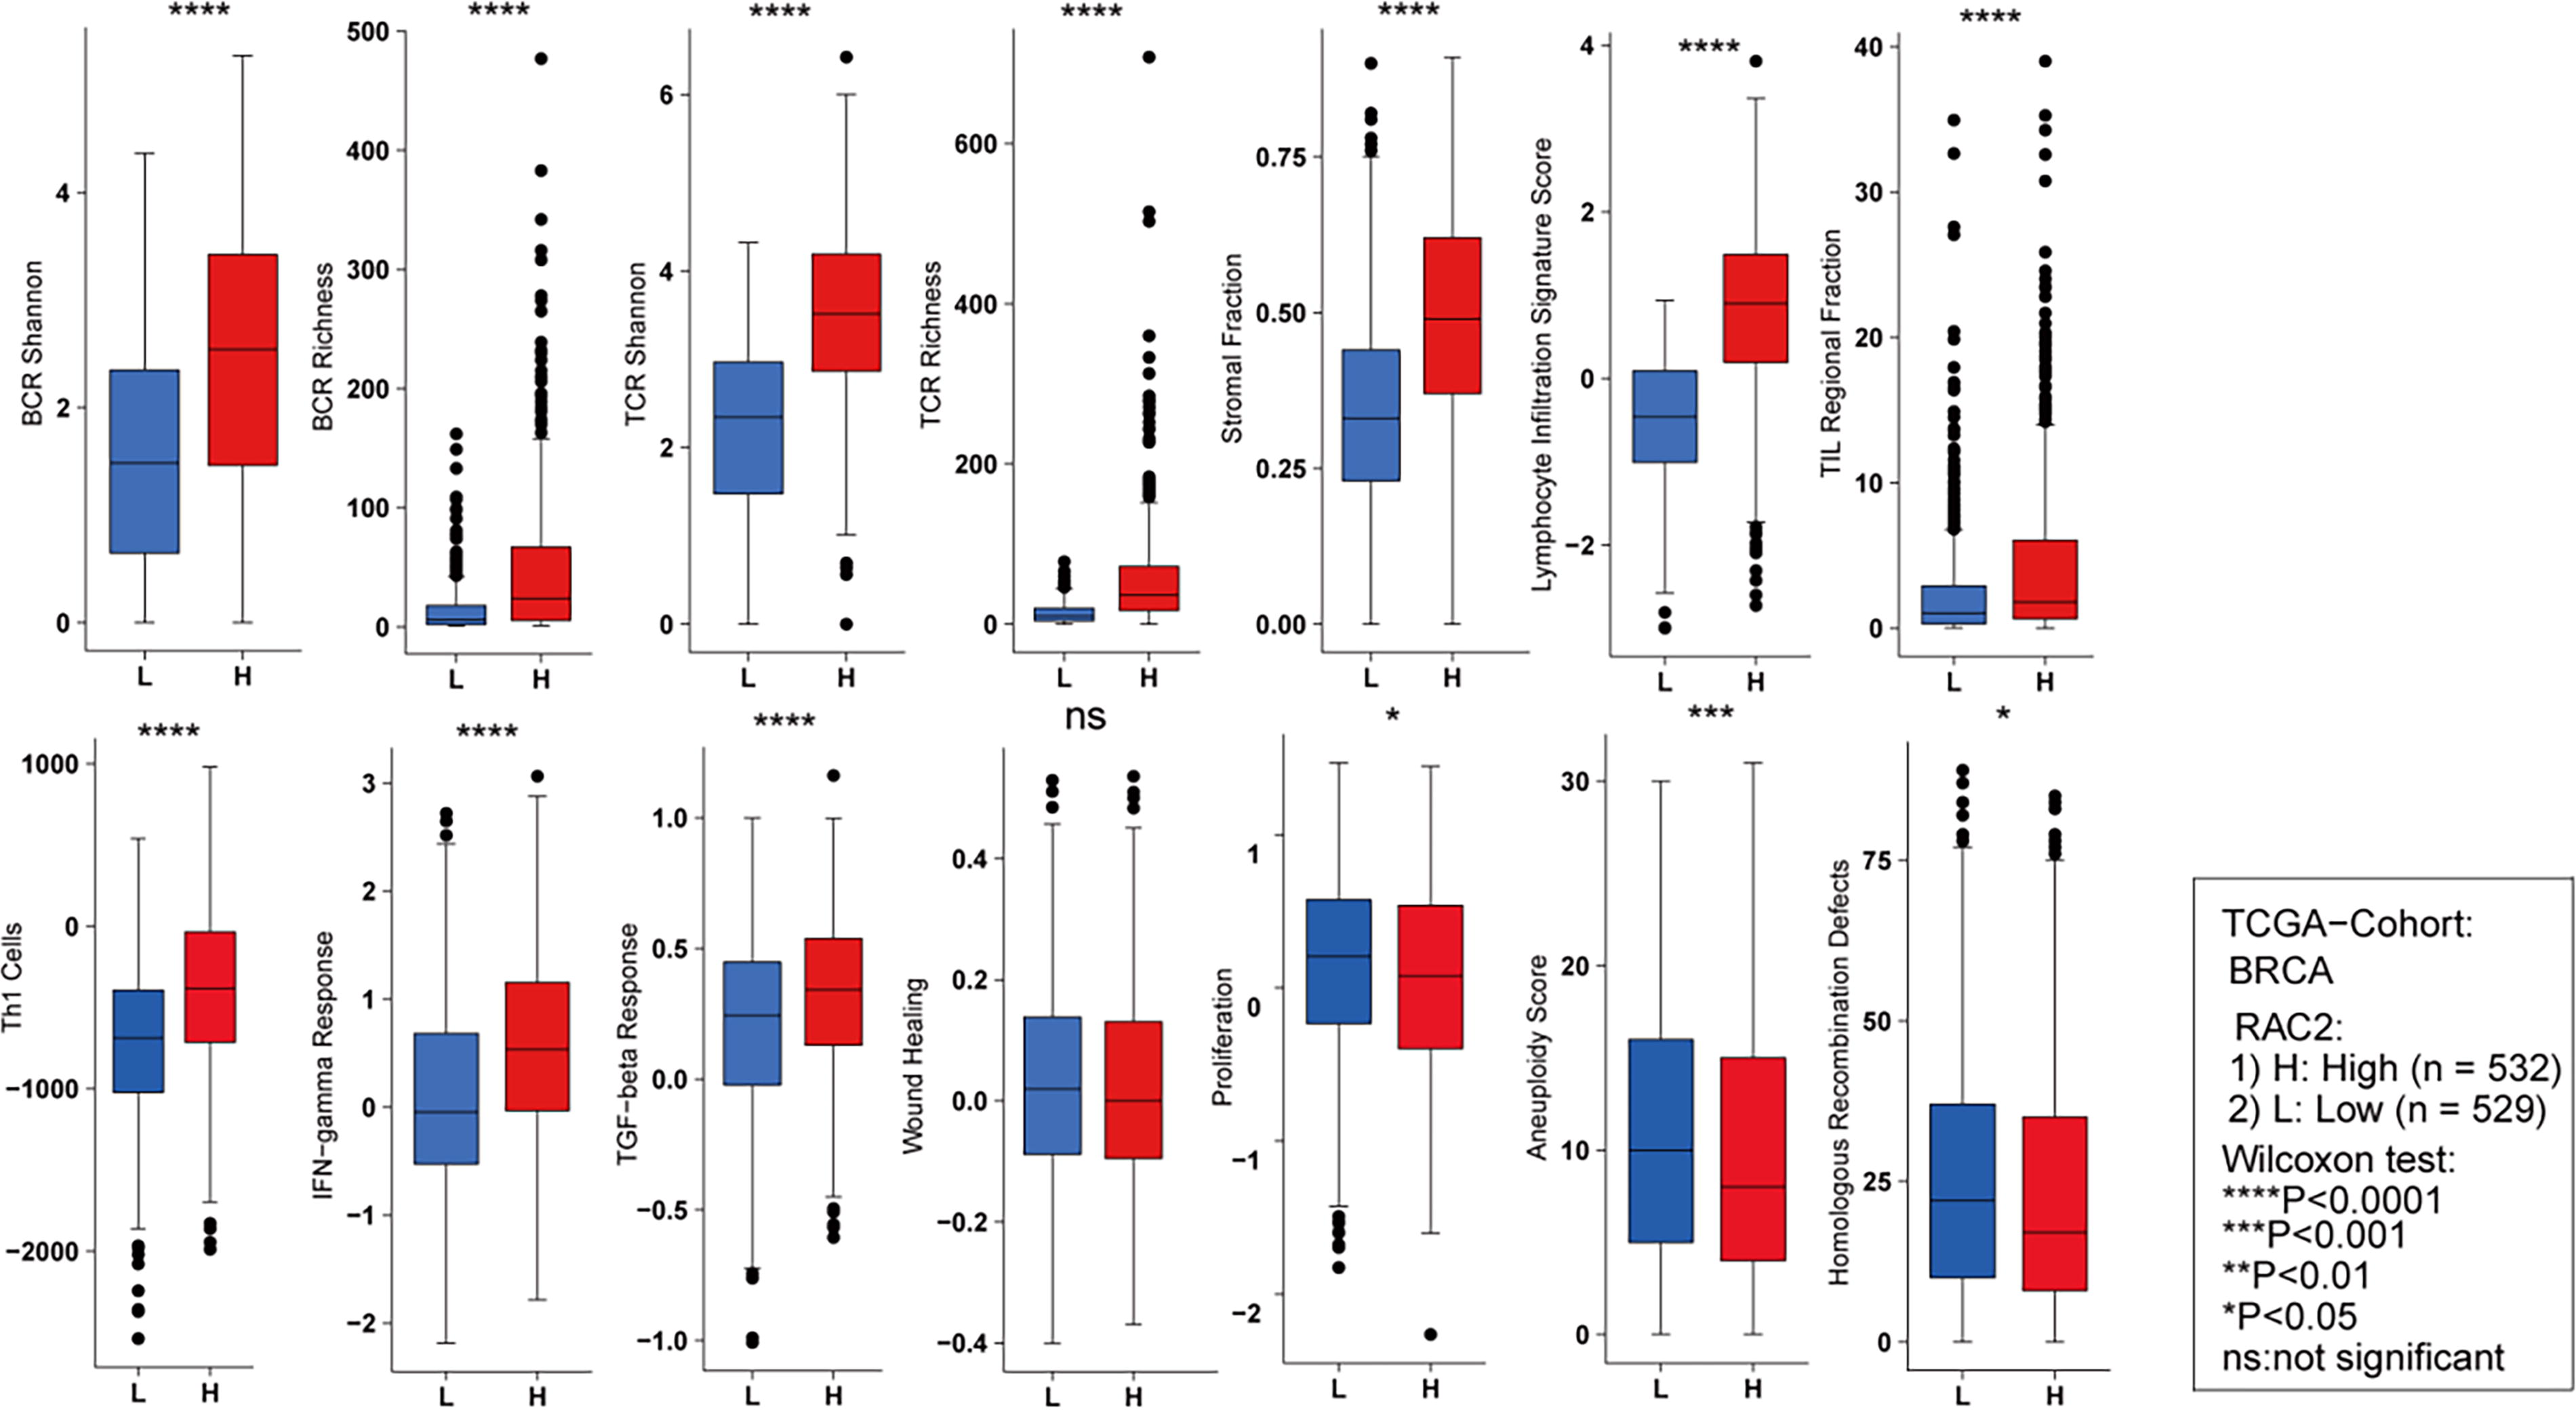
Comparison of BCR richness, BCR Shannon, TCR Shannon, TCR richness, TIL regional fraction, stromal fraction, lymphocyte infiltration signature score, Th1 cells, TGF-β response, IFN-γ response, aneuploidy score, wound healing, proliferation, and homologous recombination defects between groups exhibiting high and low RAC2 expression. ***p < 0.001, **p < 0.01, *p < 0.05, NS denotes no statistical difference. BCR, B cell receptor; TCR, T cell receptor; TIL, tumor-infiltrating lymphocyte.
Association of RAC2 with T cell infiltration
A single-cell sequencing technique with high accuracy and sensitivity was employed to address the limitations of prior extensive data. Analysis of the BC_UNB_10X_E-MTAB-8107 dataset revealed the presence of 11 distinct cell types (Fig. 8A), and their distribution in patients is depicted in Figure 8B. Notably, CD8+ T cells and CD8+ Tex cells comprise nearly 50% of the cell distribution in most patients. Importantly, each cell type was verified to express its well-known marker genes with high specificity (Fig. 8C). To further investigate RAC2 expression patterns across distinct cell types in the BC_UNB_10X_E-MTAB-8107 dataset, elevated RAC2 expression levels were observed in various immune cell types, encompassing Tprolif, CD8+ T cells, CD8+ Tex cells, B cells, plasma cells, monocytes/macrophages, and mast cells (Fig. 8D, E). Additionally, a concurrently high expression of IFNG, a key player in tumor immunity and favorable prognosis, was observed in Tprolif cells and CD8+ Tex cells (Fig. 8D, E). A notable positive link between RAC2 and IFNG expression levels was identified (Fig. 8G). Level 3 RNA sequencing expression profiles from 19 BC samples were utilized to validate our findings. Notably, patients with high expression of RAC2 displayed elevated levels of CD8a (a marker for CD8+ T cells) compared with patients with low expression of RAC2 (Fig. 8F). Furthermore, our GSEA analyses based on the BC_UNB_10X_E-MTAB-8107 dataset demonstrated the enrichment of interferon-γ response primarily in CD8+ Tex cells and monocytes/macrophages (Fig. 8H, I), which is consistent with our earlier findings (Fig. 5E). Collectively, our outcomes highlight a potential link between RAC2 expression and immune system regulation, particularly involving T cells. Notably, a link was observed between RAC2 expression and the depletion and activation of CD8+ T cells.

The link between RAC2 and T cell infiltration.
RAC2 expression is linked to clinical sensitivity to anticancer drugs
Individuals with cancer frequently encounter drug resistance, leading to relapse and decreased survival rates. 24 This study explores the involvement of RAC2 expression in contributing to drug resistance, specifically in BC. This research successfully identified a notable link between RAC2 expression and the development of drug resistance in BC. Elevated RAC2 levels were correlated significantly with decreased IC50 values for several clinical anticancer drugs, encompassing 5-fluorouracil, dasatinib, gemcitabine, methotrexate, sunitinib, cisplatin, paclitaxel, camptothecin, and tamoxifen (Fig. 9A). No notable variations in the IC50 values of docetaxel and lapatinib were observed between the groups with high and low RAC2 expression. In the chemotherapy-treated patient cohort of the Cancer Treatment Response gene signature database, higher expression levels of RAC2 were observed in both the TFEC (cyclophosphamide + epirubicin + fluorouracil + paclitaxel) treatment response group (Fig. 8B, p = 0.01) and the TFEC (cyclophosphamide+ epirubicin + fluorouracil + paclitaxel) + trastuzumab treatment response group (Fig. 8C, p = 0.018). Additionally, RAC2 demonstrated robust predictive capability for response to TFEC treatment (Fig. 8D) and TFEC + trastuzumab treatment (Fig. 8E) with respective AUC values of 0.722 and 0.794. Therefore, the observed correlation between RAC2 expression levels, increased drug sensitivity in cancer cells, and longer survival in patients with cancer suggests its potential as a biomarker for guiding personalized therapeutic decisions in clinical settings.
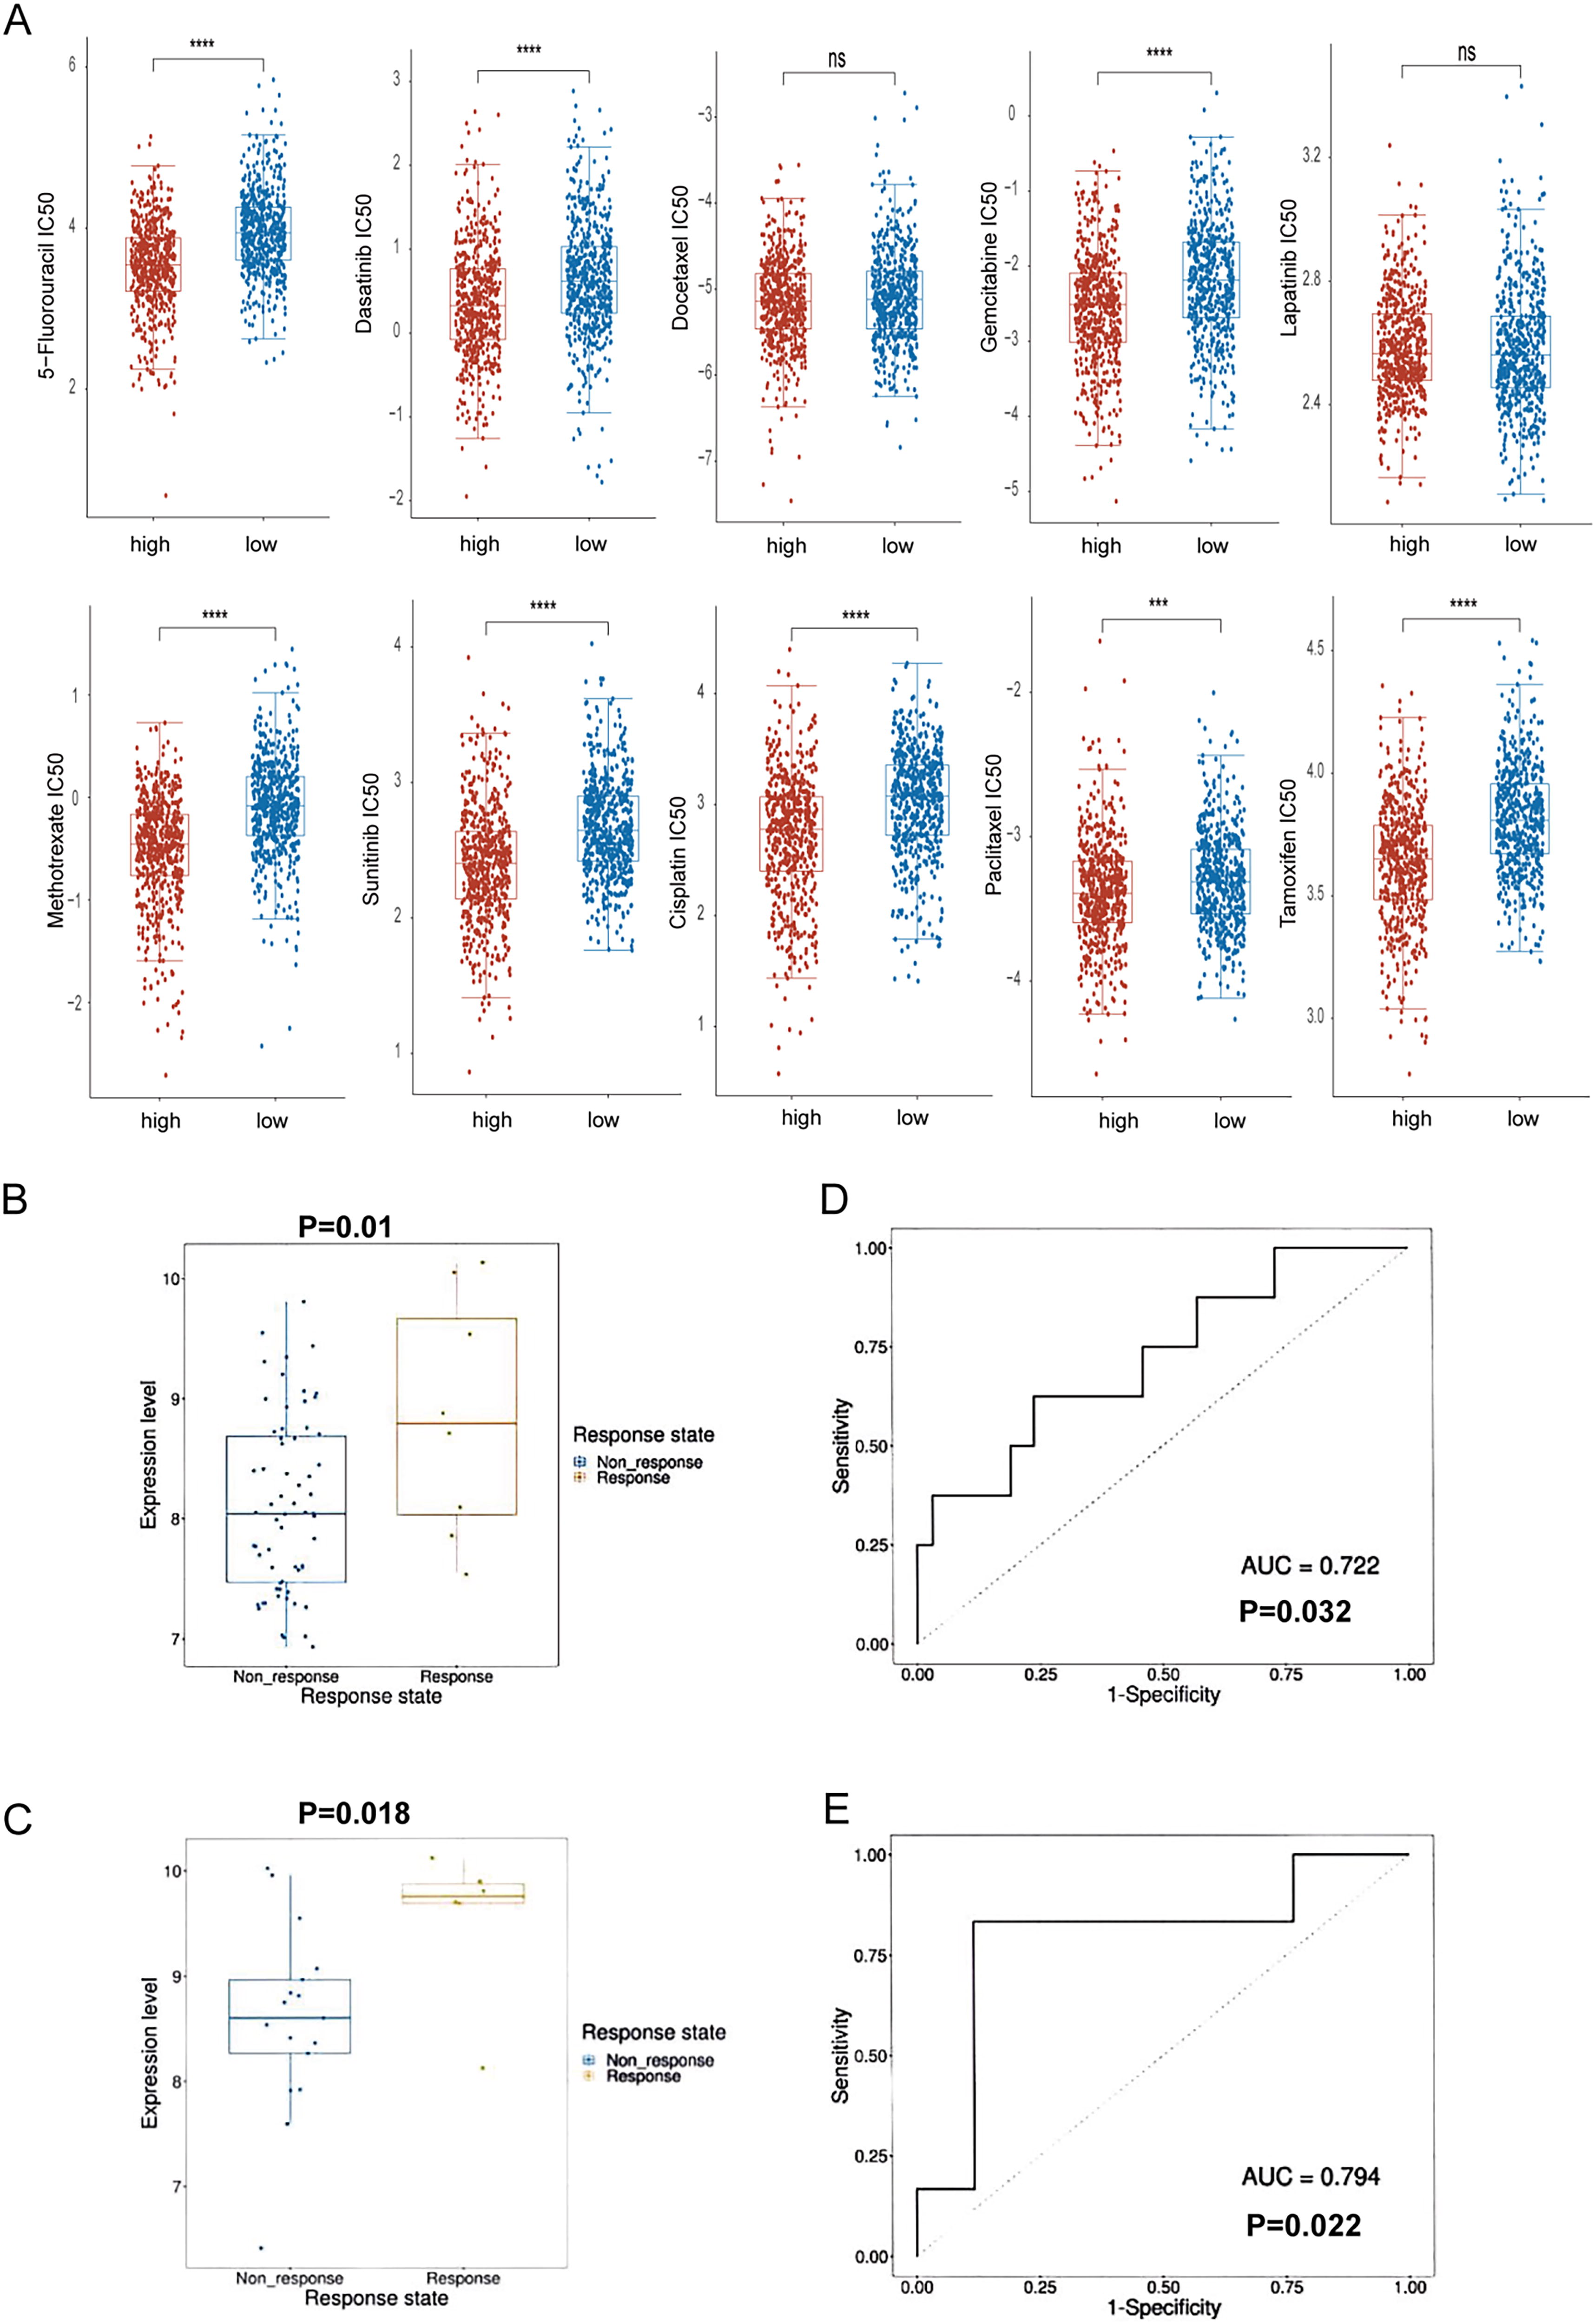
RAC2 expression is linked to clinical sensitivity to anticancer drugs.
Discussion
BC is the most prevalent form of cancer among females. The incidence of BC among young patients has increased over the past decade. 25 Various biomarkers have been identified that contribute to BC progression and are linked to patient prognosis. 26 BC is clinically classified into four molecular subtypes: luminal A, luminal B, HER2-positive, and TNBC. This classification is based on the expression of PR, ER, HER2, and KI-67. However, it does not fully support personalized precision medicine approaches for BC treatment. 27 Exploring other targets and biological markers and refining molecular subtyping is essential to enhance therapeutic efficacy and minimize adverse side effects in BC therapy.
Research has increasingly focused on examining the influence of RAC2 in cancer. Several studies have highlighted its significant role in inhibiting tumor growth and metastasis. Previous research has highlighted that reduced expression of RAC2 can diminish the proliferative, migratory, and invasive capabilities of renal clear cell carcinoma cells in vitro, suggesting its potential as a prognostic biomarker. 28 Another study indicated that RAC2, alongside RAC1 and RAC3, contributes to the progression of glioblastoma. 29 Furthermore, low expression of RAC2 has been linked to brain metastasis in BC. 17 However, the functional role of RAC2 in tumor pathogenesis and whether it contributes to tumor promotion or suppression are still not well understood. This research explores the influence of RAC2 in BC through a comprehensive analysis of data from TCGA, single-cell sequencing, and the GEO database. The underlying characteristics and gene expression of RAC2 in BC were examined, along with survival prognosis analysis, enrichment analysis, immune infiltration analysis, and clinical drug sensitivity analysis of RAC2. These findings aim to provide a systematic understanding of the involvement of RAC2 in BC.
The present study reported that RAC2 can potentially be utilized as a new target for immunotherapy in BC. The clinical significance of RAC2 in BC was explored using datasets obtained from TCGA. The level of RAC2 expression was notably elevated in BC tissues than in healthy controls, aligning with recent research that utilized IHC to detect RAC2 protein expression specifically in BC tissues. 16 Increased RAC2 expression was linked to the negative status of HER2 and ER. Considering that early detection is crucial for the outcomes of cancer therapies, we assessed the efficacy of RAC2 as a biomarker. Our ROC analysis indicated that RAC2 is a reliable biomarker for diagnosing individuals with BC. Furthermore, RAC2 demonstrated favorable prognostic value in BC. Moreover, high RAC2 expression was closely associated with longer OS, PFS, DMFS, and DSS rates of patients with BC, aligning with prior investigations. Moreover, RAC2 has been related to the modulation of ROS production, which contributes to immune cell activation and affects the immunosuppressive elements of the TME. Dysregulation of the RAC2-mediated output of ROS may cause immunosuppression and tumor growth. However, in the presence of elevated RAC2 expression, enhanced infiltration of immune cells such as NK and T cells may offset this immunosuppressive action, shifting the balance in favor of an immune-responsive TME. 16,30 In our study, RAC2 expression was notably lower in advanced BC relative to early BC, with a corresponding worse prognosis, suggesting that RAC2 may act as a protective factor for BC. Additionally, previous research reported that RAC2 was expressed at reduced levels in stages III and IV (high-risk group) in BC tissues. 30 These outcomes may suggest that high RAC2 expression in tumors is correlated with better outcomes, further supporting the predictive value of RAC2 in BC. To summarize, RAC2 plays a complex function in regulating the immunological landscape of the TME, as evidenced by its effects on immune cell activation, migration, cytotoxicity, and interactions with immune checkpoints. RAC2 is a prospective target to improve immunotherapeutic methods in BC since it might influence immune checkpoint pathways and promote immune cell infiltration and antitumor immunity.
Tumor immune infiltration is critically involved in influencing the response to various treatment regimes, such as chemotherapy, radiotherapy, and immunotherapy, as well as impacting the OS outcomes of individuals diagnosed with cancer. 31,32 In this study, GO/KEGG analysis revealed that RAC2 primarily influences cytokine–cytokine receptor interactions and T cell activation. Additionally, RAC2 expression was closely associated with the infiltration of various immune cell types. The beneficial impacts of T cells, encompassing CD8+ T cells, 32,33 and CD4+ T cells 8 in BC, have been documented. Furthermore, the antitumor effects of B cells 9 and NK cells 34 in BC have been proven. From the perspective of immune invasion, RAC2 was systematically linked to immune characteristics in the TME, 35 encompassing immunomodulators, immune checkpoint inhibitors (ICIs), and tumor-infiltrating immune cells. The findings indicated that elevated RAC2 expression in the TME exhibited a notable positive link to ICIs, immunomodulators, and immune cell infiltration.
Moreover, RAC2 showed a positive correlation with several established immune checkpoint molecules, indicating a strong association between RAC2 expression and these checkpoints. This suggests that RAC2 could be a promising candidate for a new immune checkpoint. T cells, which form the cornerstone of the antitumor response of the body, are also recognized as crucial components in immunotherapy. In our BC samples, an accumulation of CD8+ T cells, which secrete IFN-γ, was observed in samples with high RAC2 expression. Our analysis further revealed that RAC2 levels are positively linked to the expression of genes in the HALLMARK_INTERFERON_GAMMA_RESPONSE in BC tissues. These data demonstrate that increased RAC2 expression is associated with better prognostic outcomes in BC, potentially through enhancing antitumor immunity and stimulating T cell proliferation and activation. Gaining a more comprehensive understanding of RAC2 and its role in modulating immune infiltration could be instrumental in improving the therapeutic efficacy of ICIs in treating BC.
Immune-checkpoint PD-1 pathway inhibitors have significantly changed the therapeutic approach to various malignancies, including TNBC. 36,37 Therefore, chemoimmunotherapy has demonstrated promising results in clinical cancer treatment. However, the development of immunosuppressive niches can lead to drug resistance and significantly reduce treatment efficacy. 38 An analysis was conducted utilizing the GDSC database to evaluate the link between RAC2 expression and the IC50 values of clinical drugs. The results indicate that individuals with elevated RAC2 expression may demonstrate heightened susceptibility to drugs such as 5-fluorouracil, dasatinib, gemcitabine, methotrexate, sunitinib, cisplatin, paclitaxel, camptothecin, and tamoxifen. These findings suggest that RAC2 is promising in clinical therapy, implementing precision medicine, and addressing drug resistance challenges.
The practical significance of RAC2 in suppressing the progression of BC and its diagnostic and prognostic relevance among individuals with BC has been verified. Interestingly, a positive relationship exists between the CD8+ T cell infiltration and RAC2 expression. Moreover, RAC2 is crucial in decreasing the IC50 values of clinical medications. Therefore, RAC2 is a viable target for therapeutic intervention in patients with BC and may serve as a diagnostic and prognostic marker. Further experimental investigations are required to validate and corroborate these outcomes. Developing targeted therapies or immune modulators that enhance RAC2 activity could be one potential strategy to boost immune cell infiltration and activation within the TME, considering the RAC2 role in modulating immune cell functions and its association with enhanced antitumor immunity. A potentially effective strategy may involve the development of RAC2-specific antibodies or small molecules that directly regulate its activity, affecting the TME and improving patient outcomes. Moreover, exploring the synergy between RAC2-targeted therapeutics and ICIs may augment the efficacy of immunotherapy, considering RAC2’s excellent correlation with several immune checkpoint molecules.
The main limitations of the current study include its dependence on publicly accessible datasets, including TCGA, GEO, and single-cell sequencing data, which may result in selection bias and restrict the generalizability of the results across varied populations. Second, the present research lacks experimental validation, which implies that bioinformatics analysis rather than in vitro or in vivo tests are employed to identify the relationships between RAC2 expression, immune cell infiltration, and clinical outcomes. Finally, the observational design of this study makes it more challenging to determine a causal association between immune modulation or the advancement of BC and RAC2 expression. Further experimental research is required to corroborate these results, investigate molecular insights, and evaluate the therapeutic potential of RAC2.
Conclusions
This research highlights the promise RAC2 may hold as a diagnostic and prognostic indicator in individuals with BC. Additionally, it may contribute to tumor immunotherapy by influencing the biological functions of several immune cells and mitigating drug resistance. Furthermore, RAC2 could serve as an innovative molecular biomarker for BC treatment, thereby facilitating the advancement of new immunotherapeutic approaches with substantial clinical implications for the future.
Footnotes
Acknowledgments
This work was supported by the Hunan Natural Science Foundation of China (2022JJ40457).
Authors’ Contributions
J.W. and X.Y. organized the article writing and critically modified the manuscript. Y.X. drafted the manuscript and was responsible for data acquisition. Y.X. and X.Y. participated in the data analysis. Y.C., Y.D., and Y.H. performed surgical operations, treated, and followed up with patients. J.W. and S.C. performed IHC. All authors read and approved the manuscript and agreed to be accountable for all aspects of the research in ensuring that the accuracy or integrity of any part of the work is appropriately investigated and resolved.
Data Availability
The data underlying this study are freely available from the TCGA dataset (https://portal.gdc.cancer.gov/projects/TCGA-KIRC), the TISCH2 dataset (http://tisch.comp-genomics.org/gallery/), and the GEO dataset (![]() ). The authors did not have special access privileges.
). The authors did not have special access privileges.
Ethics Approval and Consent to Participate
The study was approved by the Ethics Committee at Xiangtan Central Hospital. The Medical Ethics Committee of Xiangtan Central Hospital approved the study procedures (ID: 2023-05-004). The study was performed in compliance with the Declaration of Helsinki. All patients received written informed consent before the study. All methods were carried out following relevant guidelines and regulations. The study was carried out in compliance with the ARRIVE guidelines.
Disclosure Statement
The authors declare that they have no competing interests.
Funding Information
This work was supported by the Natural Science Foundation of Human Province (Grant No. 2022JJ40457).