
Abstract
Lymph node metastasis (LNM) plays a critical role in the prognosis of head and neck squamous cell carcinoma (HNSCC). To enhance prognostic predictions and investigate the molecular interplay between LNM and HNSCC, we developed an LNM-associated gene signature. Data was sourced from The Cancer Genome Atlas (TCGA), encompassing RNA-sequencing and clinical profiles. We stratified patients based on LNM status and identified differentially expressed genes (DEGs) between lymph node-negative (N0) and lymph node-positive (N1-3) groups. A prognostic model was then constructed while employing Least absolute shrinkage and selection operator (LASSO) and multivariate Cox regression analyses. Patients were randomly allocated into training (70%) and internal validation (30%) cohorts, with an additional external dataset used for validation. The predictive model’s performance was assessed through receiver operating characteristic curves and survival analyses. We identified 79 LNM-related prognostic DEGs that formed the basis of our LNM-related risk score (LNMRS). This score stratified patients into low- and high-risk categories, with those having lower LNMRS exhibiting improved survival outcomes, increased immune cell infiltration, and enhanced responses to immunotherapy (PD-1/CTLA4 inhibitors) and chemotherapy. In contrast, patients with high LNMRS showed poorer prognosis and reduced immune responsiveness. Our LNM-related model provides insights into the molecular mechanisms linking LNM and HNSCC and offers a promising tool for personalized treatment strategies. This approach underscores the potential of integrating LNM status with gene expression profiles to refine prognosis and optimize therapeutic interventions in HNSCC.
Introduction
Head and neck squamous cell carcinoma (HNSCC) is the most prevalent malignant form of head and neck cancer, affecting over 90% of patients with the disease. 1,2 Patients with HNSCC have been reported to demonstrate a poor prognosis, with a 5-year survival rate considerably below 50%. 3 Importantly, extranodal extension, perineural invasion, or lymphovascular invasion appear as the crucial factors that may shorten the survival time and lead to a worse prognosis, as well as metastases and aggressive pathological features. 4 The therapeutic effect for early-stage patients with HNSCC is satisfactory, while for advanced-stage patients with distant metastasis, the therapeutic effect is not satisfactory. 5 For decades, comprehensive modalities, including surgical excision, radiotherapy, chemotherapy, targeted therapy, and immunotherapy, were considered the main approaches for patients with HNSCC. 6 Hence, it is essential to construct new and reliable biomarkers to precisely predict the survival status of patients with HNSCC and offer supportive guidelines for effective treatment.
Based on the previous studies, the size and number of metastatic lymph nodes have been determined as essential indicators that influence the survival of patients with HNSCC. For those with lymph node metastasis (LNM), the survival time can be significantly reduced, leading to poor prognosis and curative effects for patients with HNSCC. 7 However, the only parameter currently available to guide treatment choice is the TNM stage, 8 an ideal assessing system for detailed risk evaluation necessary for patients with HNSCC. Reportedly, genes play an essential role in the biological process of tumors. Studies have shown that TAGLN and CFL1 are involved in the mechanism of LNM in the advanced laryngeal squamous cell carcinoma region. 9 However, studies are lacking in revealing further correlations between genes and LNM in HNSCC.
Similarly, the complex microenvironment affects the occurrence and development of malignant tumors. The structure of immune cells in the tumor immune microenvironment (TIME) affects tumor progression and the effectiveness of anticancer therapy. 10,11 Immune-related treatments for HNSCC have improved dramatically for patients with HNSCC. 12,13 For patients with LNM, an individual immunotherapy plan may provide effective results and improve the prognosis. However, due to the complexity of TIME, few patients are eligible for benefits. Given these factors, developing an accurate predictive model for determining TIME in patients with HNSCC is crucial.
This research focused on developing a prognostic model for patients with HNSCC via LNM-associated genes and examining the potential importance of these genes in HNSCC via bioinformatics analysis. Through this model, the association between the model gene expression and prognosis of HNSCC was further analyzed and the potential prognostic value of model genes was discussed, providing compelling evidence for possible therapeutic biomarkers of HNSCC.
Methods and Materials
Obtaining the data of the HNSCC cohort
The RNA-seq matrix, which included 504 HNSCC and 44 normal samples in the cohort, was downloaded from the Cancer Genome Atlas (TCGA) database. Additionally, related clinicopathological information was obtained to explore the correlation between overall survival (OS) time, tumor stage, and other characteristics. Patients were subsequently randomly divided into designated test sets at a ratio of 7:3 for further model establishment. In addition, another HNSCC cohort (GSE41613) was selected as an external set extracted by screening the GEO database.
Development of clinical subtypes according to LNM status
Patients in the TCGA-HNSC cohort were classified into two distinct clinical disease subtypes (lymph node-negative [N0] and lymph node-positive [N1-3] groups) corresponding to their LNM status. Following that, a Kaplan–Meier (K-M) comparison with log-rank test of survival was performed to examine the disparities in progression-free survival (PFS) and OS within the two LNM clusters. Also, differentially expressed genes (DEGs) that distinguished the two LNM clusters were identified by comparing the logarithmic value (log2) of gene expression based on Wilcoxon test via the “limma” R package. p-values were adjusted using Benjamini–Hochberg approach and those with a false discovery rate (FDR) threshold less than 0.05 were considered as DEGs while |log2FC| >0. Gene Ontology (GO) and Kyoto Encyclopedia of Genes and Genomes (KEGG) signaling pathway observations were conducted on the basis of these DEGs to investigate the functional distinctions in LNM-DEGs within the two clusters.
Establishment of a predictive signature based on prognostic LNM-DEGs
Referring to the outcomes of univariate Cox (uni-Cox) regression analysis about these LNM-related DEGs, the prognostic LMN-DEGs were selected when the p-value was less than 0.01. Subsequently, LASSO regression analysis was executed to select the potential model genes for the LNM model and 10-fold cross-validation (p < 0.05) was applied to avoid the potential bias. The LASSO regression was run for 1000 cycles to exclude LMN-DEGs that may be highly correlated with others. Subsequently, multivariate Cox (multi-Cox) regression analysis was applied via the “survival”, “survminer” and “glmnet” R packages for further selection of eligible LMN-DEGs as well as calculation of the coefficient of model genes. Accordingly, each patient in the training and test cohorts was examined by the LNM-related risk model with the respective formula: LNM-related risk score (LNMRS) = ∑ coefi × expi. Patients were subsequently regrouped into low-LNMRS and high-LNMRS groups considering the median value of LNMRSs.
Similarly, patients from GSE41613 were also assessed by the above risk signature as an external test dataset. The receiver operating characteristic (ROC) curves for 1, 3, and 5 years’ survival status and the value of areas under the curves (AUCs) were utilized to assess the predictive effects using the “survival,” “survminer,” and “timeROC” R packages, as well as compare with other clinicopathological features. Furthermore, to precisely evaluate the prognosis, a nomogram was investigated and established based on the LNMRS and prognostic clinical characteristics which were examined by both uni- and multi-Cox analysis.
Correlation examination between LMNRRS and clinical features
The distinction of LMNRRS in different clinical characteristics was analyzed and compared by the Wilcoxon test, as shown in the bar plots. In addition, a K-M survival analysis was conducted on different clinical subsets to facilitate a more comprehensive comparison of the OS disparities within the two risk groups.
Correlation analysis between LNMRS, tumor burden mutation, and TIME
The mutation frequency of the model genes and the leading 20 mutated genes between the two LNMRS groups was investigated using the “pretool” R package. The comutated association was explored among these model genes, and the correlation between LNMRS and tumor burden mutation (TMB) was analyzed using the Spearman correlation test. When combined with LNMRS and TMB, the disparities in OS across the low and high-risk cohorts were compared via K-M survival analysis.
Similarly, to further explore the tumor infiltration landscape, the CIBERSORT platform was employed to calculate the various types of immune cell infiltration in each HNSCC sample and compare them using the Wilcoxon and Spearman tests. Additionally, we displayed the single sample gene set enrichment analysis method to observe the activated immune function in the two LMNRRS groups. Furthermore, the “estimate” R package was employed to assess the TIME scores of each sample.
Assessment of immunotherapy and chemotherapy
In order to evaluate the predictive capabilities of the risk model regarding the therapeutic effect of immune checkpoint inhibitor (ICI) therapy, the Wilcoxon test was applied to contrast the transcription of ICI-related genes in the low and high-LNMRS groups. Similarly, the possibility of immune escape and differences were predicted and compared using tumor immune dysfunction and exclusion (TIDE) scores based on the TIDE database. Moreover, to further assess the effectiveness of PD-1 and CTLA-4 inhibitor therapy, the immunophenoscore (IPS) of each patient with HNSCC was investigated using the The Cancer Immunome Atlas (TCIA) database.
Subsequently, the drug sensitivity of four chemotherapy agents (cisplatin, docetaxel, gemcitabine, paclitaxel) was assessed with the value of half-maximum inhibitory concentration (IC50) using the “pRRophetic” R package. The difference of IC50 values between cohorts was compared with Wilcoxon signed-rank test. Moreover, the Spearman correlation test was also employed to examine the relationship between LMNRRS and the IC50 value for each patient with HNSCC among patients with TCGA-HNSC.
Results
Development of clinical subtypes via LNM
According to the status of LNM, patients with TCGA-HNSCC were divided into two clinical disease subtypes: the N0 and the N1-3 groups. K-M survival comparison was then displayed to compare the OS between group N0 and group N1-3, indicating that the N0 group had better OS than the N1-3 group (log-rank p ≤ 0.0001) (Fig. 1A). In general, the PFS of the N0 group was also significantly better and longer as compared with those of metastatic patients (log-rank p = 0.004) (Fig. 1B). The DEGs between the two LNM clusters were visualized by heatmap with the criteria of FDR ≤0.05 (Fig. 1C). The volcano map was obtained by detecting the expression of DEGs (Fig. 1D). Moreover, GO and KEGG enrichment analyses revealed functional differences in which these LNM-DEGs correlated more with epidermal development and spliceosomes (Fig. 1E, F).

Survival analysis and correlative function analysis of LNM.
Evaluation of the risk model using LNM-DEG
Based on the results of the uni-Cox analysis about DEGs, the potential model genes of the LNM-related model were selected, and a total of 79 prognostic LNM-DEGs were selected (p less than ≤0.01). Patients in cohorts were assessed while employing the formula: LNM-related risk score (LNMRS) = MASP1 * −0.170057354386052 + SLC23A1 * −0.256327363399303 + ASGR1 * 0.405596475040701 + SLC7A1 * 0.32721694094731 + SCNN1D * −0.161420909227457 + SPINK6 * −0.0699824457244082 + SIAE * 0.210143067299494 + MPZ * 0.185915750688893 + PITPNM3 * −0.252368560674951 + LGALS9 * −0.398171375659671 + RTCB * 0.327359279725552 + SRP14 * 0.455174877820554 + PRSS12 * −0.134887336102099 (Fig. 1G, H). According to the LNMRS of each patient, the patients were redivided into the low and high-LNMRS groups, respectively. Sankey diagram, which reflected most patients in the N0 group were from the low-risk group with a higher survival rate, was established to reveal the relationship between LNM clusters and LNMRS groups (Fig. 1I). The survival analysis of the high-low-risk group showed that the OS and PFS of the low-LNMRS group were longer than those of the high-LNMRS group (Fig. 2A–E). However, patients in the N1-3 group were mainly in the high-risk group, with a high mortality rate. ROC curves of 1-, 3-, and 5-year risk scores were drawn to predict prognosis, and the AUC values of ROC in the entire TCGA-HNSC cohort were 0.659, 0.758, and 0.728, respectively. These values indicated this model can distinguish patients with different prognosis, as well as satisfactory accuracy. While comparing other linear prediction models from previous studies, our model also exhibited great predictive effects. In addition, the AUCs in GSE41613 were 0.623, 0.606, and 0.621, respectively (Fig. 2F). According to uni- and multi-Cox regression analysis (Fig. 3A, B), LNMRS, age, and LNM status were considered survival-related indicators of patients with HNSCC, which can independently predict the prognosis and increase the potential risks. Therefore, a nomogram was performed premised on the three independently predictive indicators (Fig. 3C). Furthermore, the calibration diagram determined the nomogram’s high reliability and predictive ability (Fig. 3D). Boxplots illustrate the distribution of LNMRSs following different clinicopathological traits; the dots indicate substantial variations by grade, T status, N status, and clinical stage (Fig. 3E). Additionally, the subgroup survival analysis revealed that patients exhibiting a low LNMRS had a more favorable prognosis relative to those with a high LNMRS (Fig. 3F).
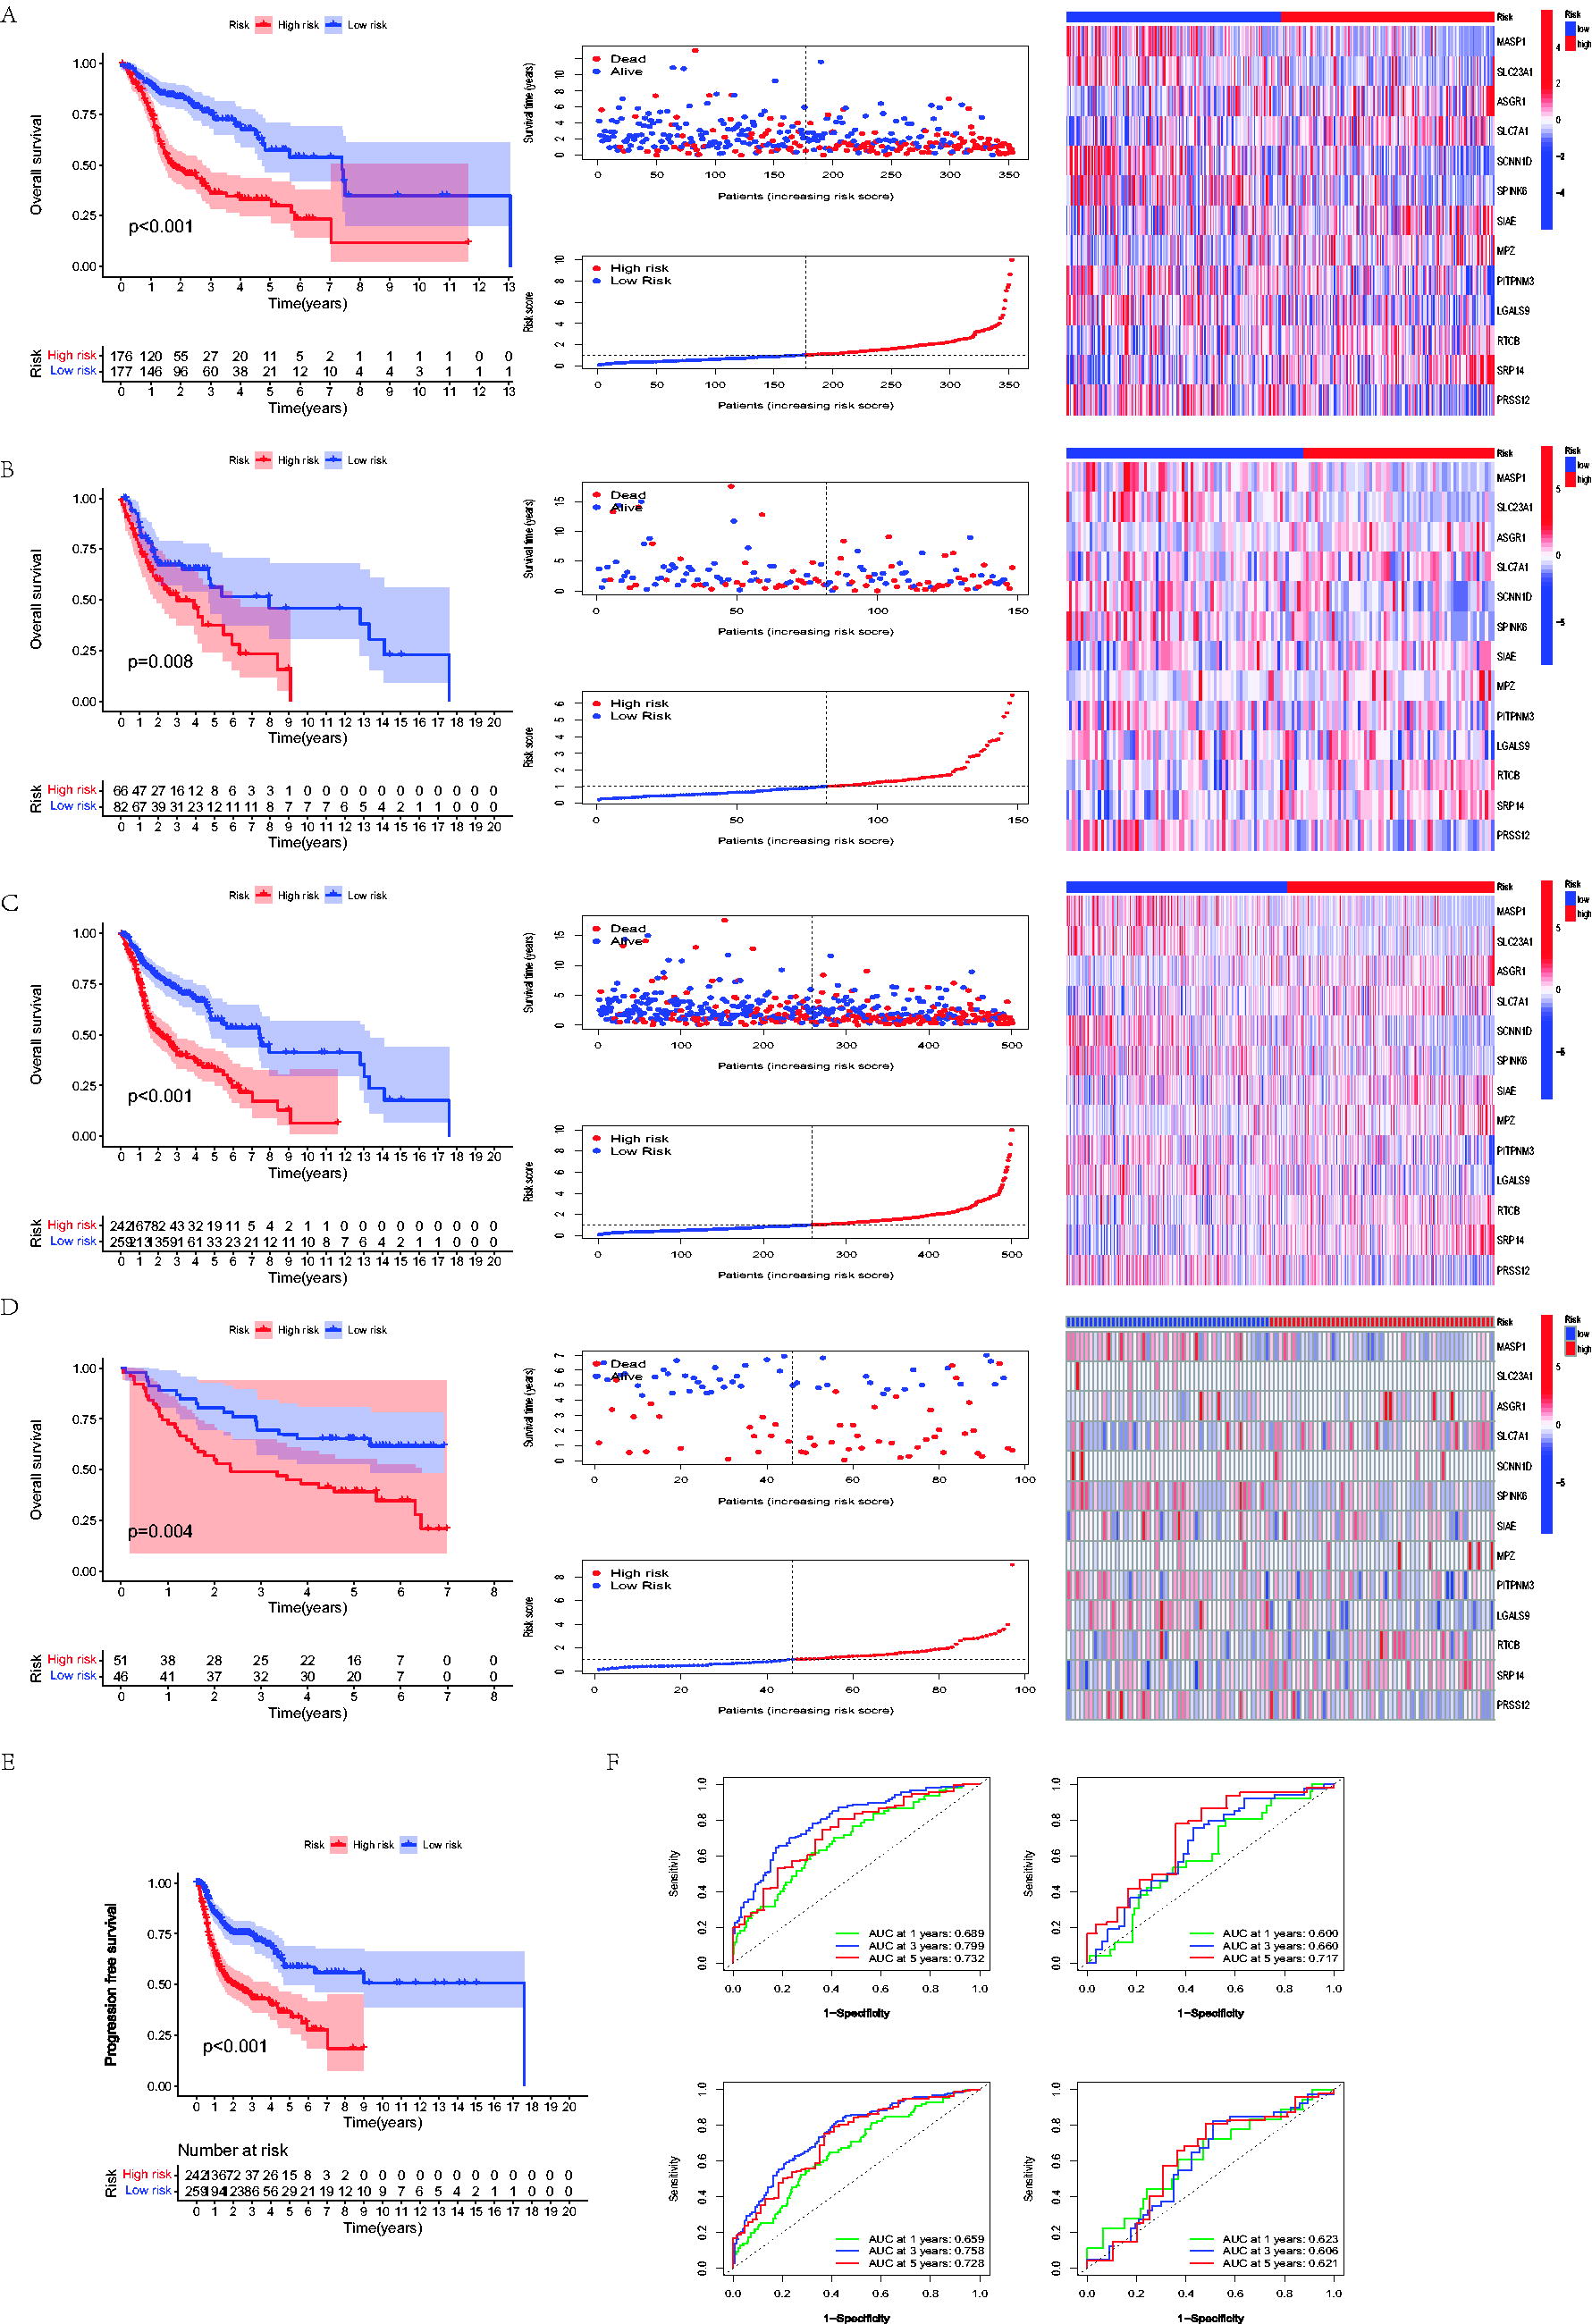
Assessment of the LNM-DEGs-based risk model. The OS, risk score, survival rate, and model gene patterns among patients with HNSCC in the TCGA train set
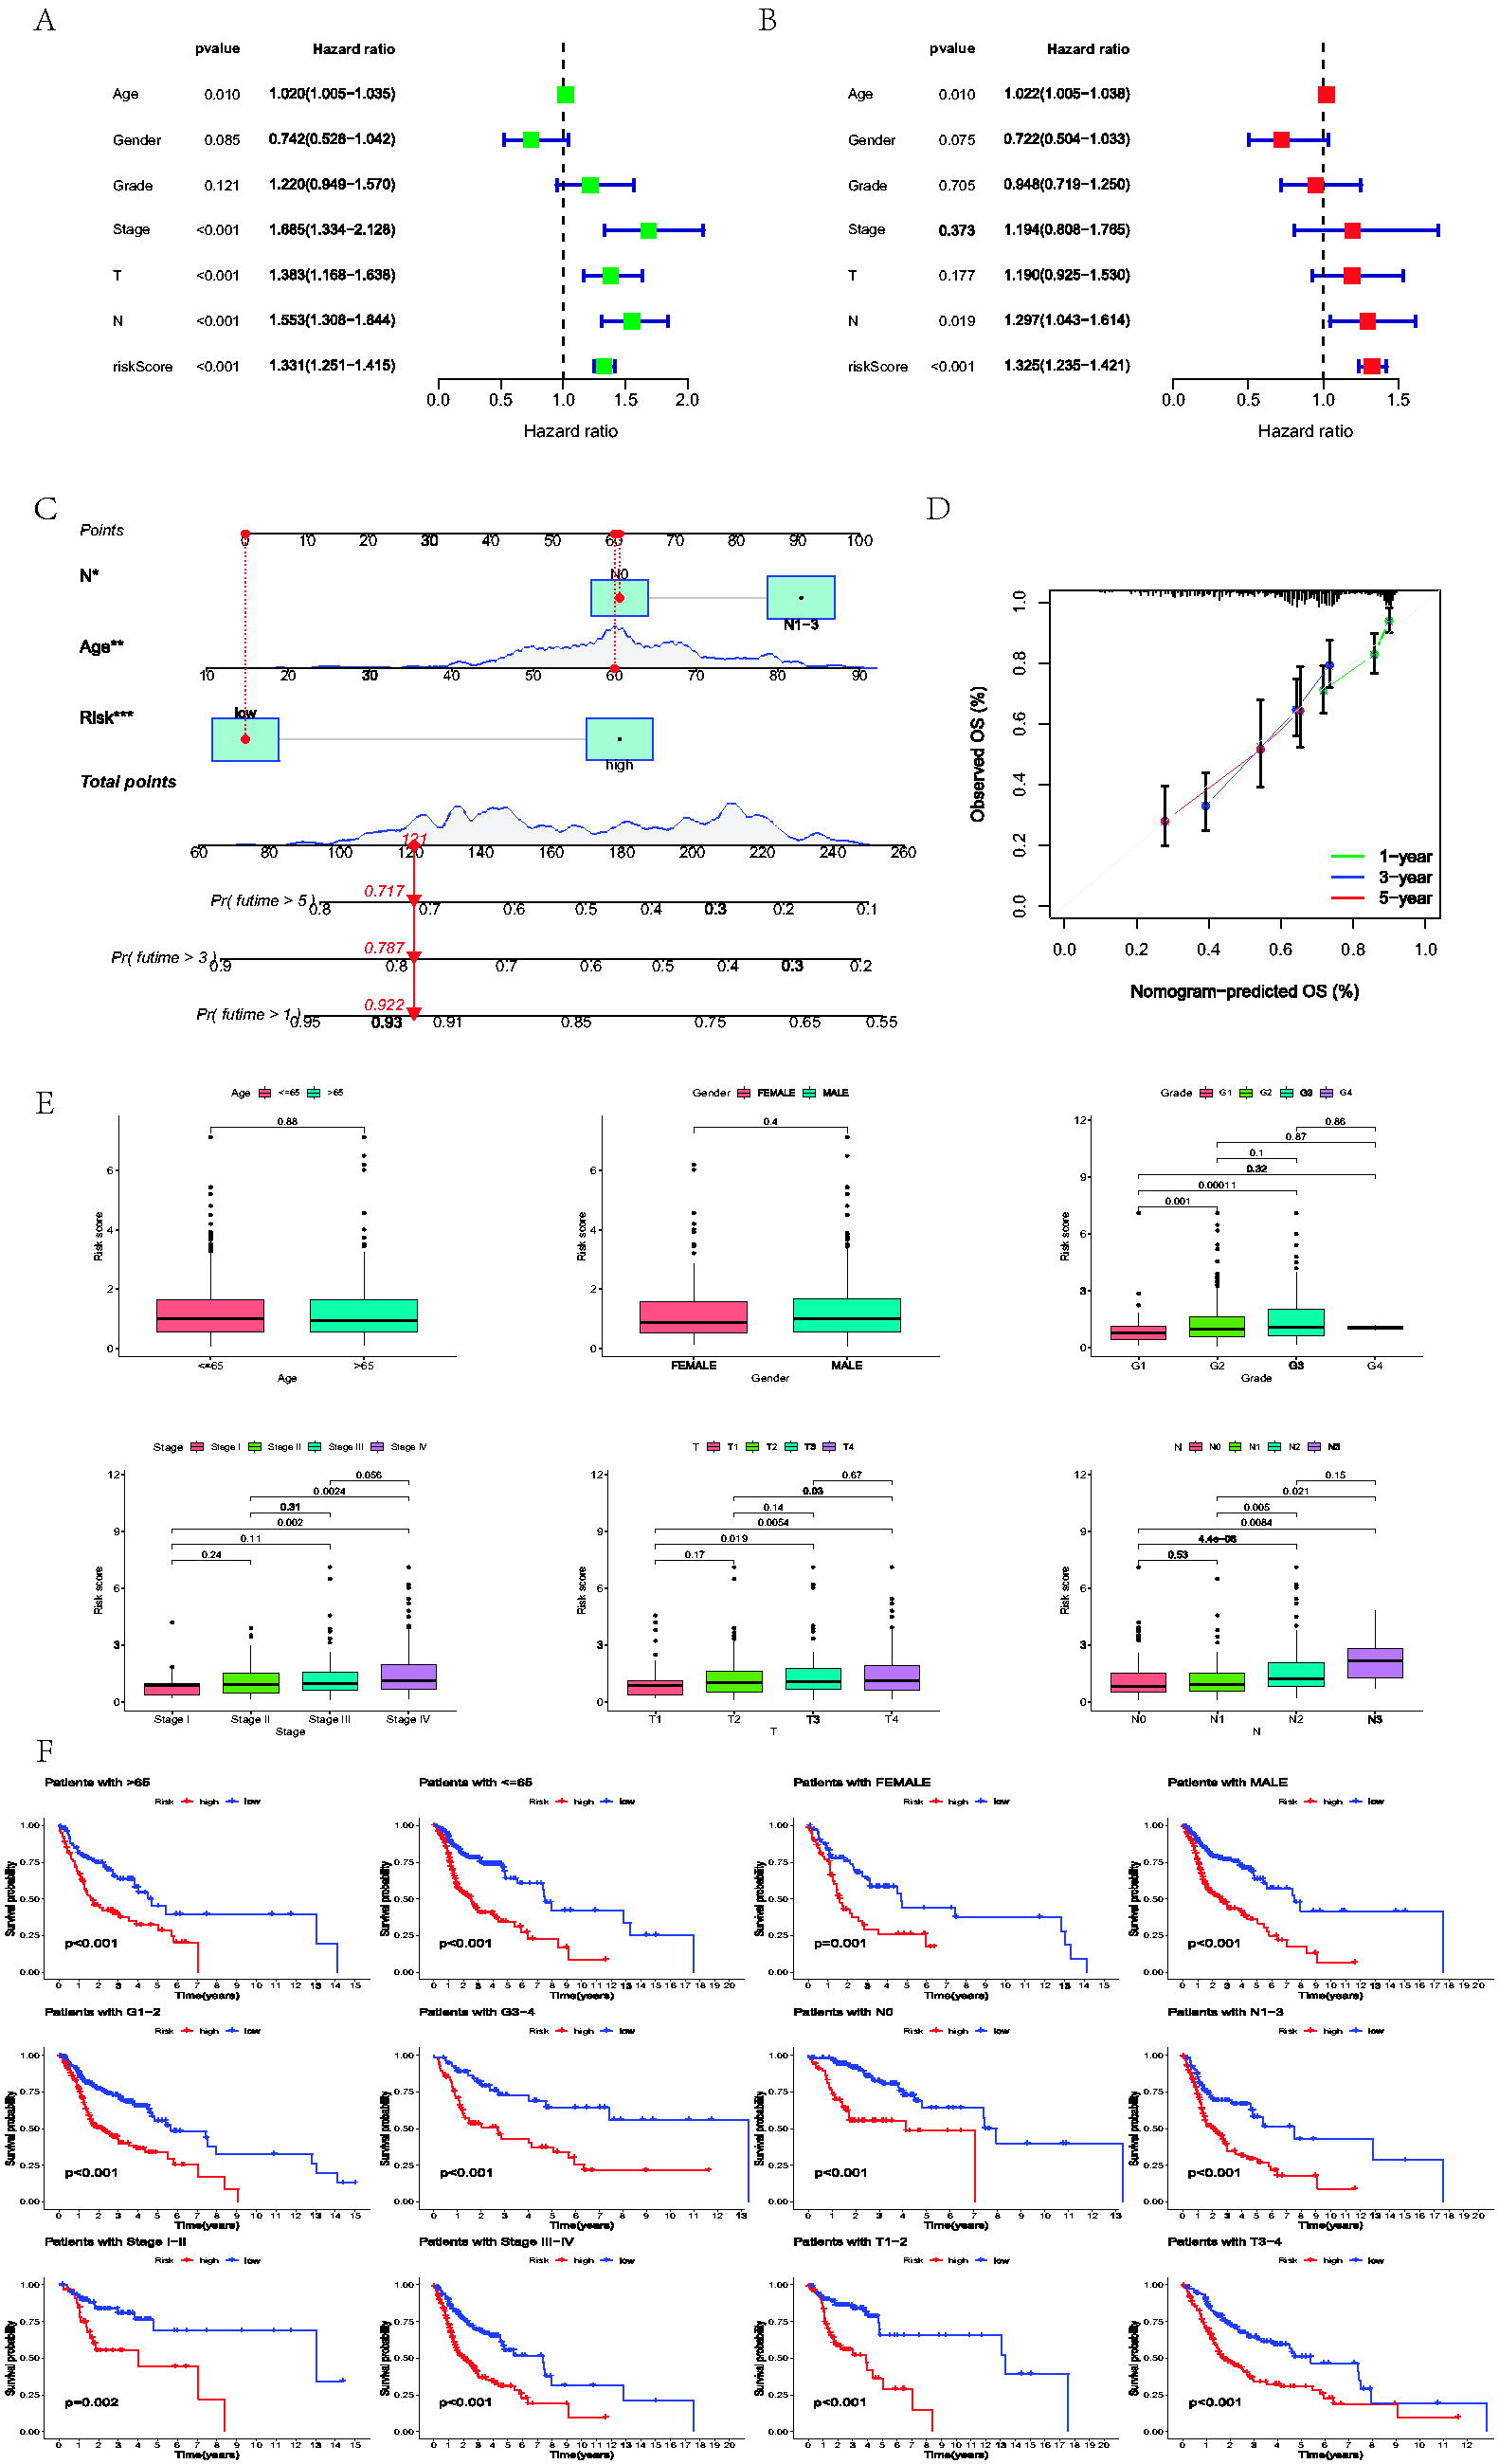
Nomogram and clinical correlation.
Correlation analysis between LNMRS, tumor burden mutation, and TIME
To investigate the mutated frequency of the model genes, somatic mutation data of the TCGA-HNSC cohort was compared and shown in waterfall plots, indicating a low mutation frequency in the TCGA-HNSC cohort (total of 5.49%) (Fig. 4A). A low mutation frequency may suggest that the etiology of HNSCC is influenced mainly by epigenetic modifications, copy number variations, or chromosomal instability rather than by many point mutations. Moreover, the reduced mutation rates may be associated with unique tumor microenvironments and immunological landscapes, affecting the efficacy of medicines, including immune checkpoint inhibitors. This stability may suggest a more homogeneous tumor activity, wherein LNM is more closely associated with the expression and regulation of particular genes rather than a varied mutational profile. Understanding these dynamics is essential for formulating targeted therapeutics and predicting models that consider the distinct biological behavior of HNSCC. The mutated correlation analysis of model genes showed a positive association between PITPNM3 and SIAE, SLC7A1, and MPZ (Fig. 4B). Waterfall plots revealed the mutated frequencies of the topmost 20 mutated genes in different LNMRS groups without significant differences (Fig. 4C–E). According to further survival analysis, when combining OS and TMB, patients with higher LNMRS and higher TMB appeared to have the worst prognosis (Fig. 4F). Moreover, Gene Set Variation Analysis (GSVA) represented that the high-LNMRS group exhibited more enriched pathways (Fig. 4G).
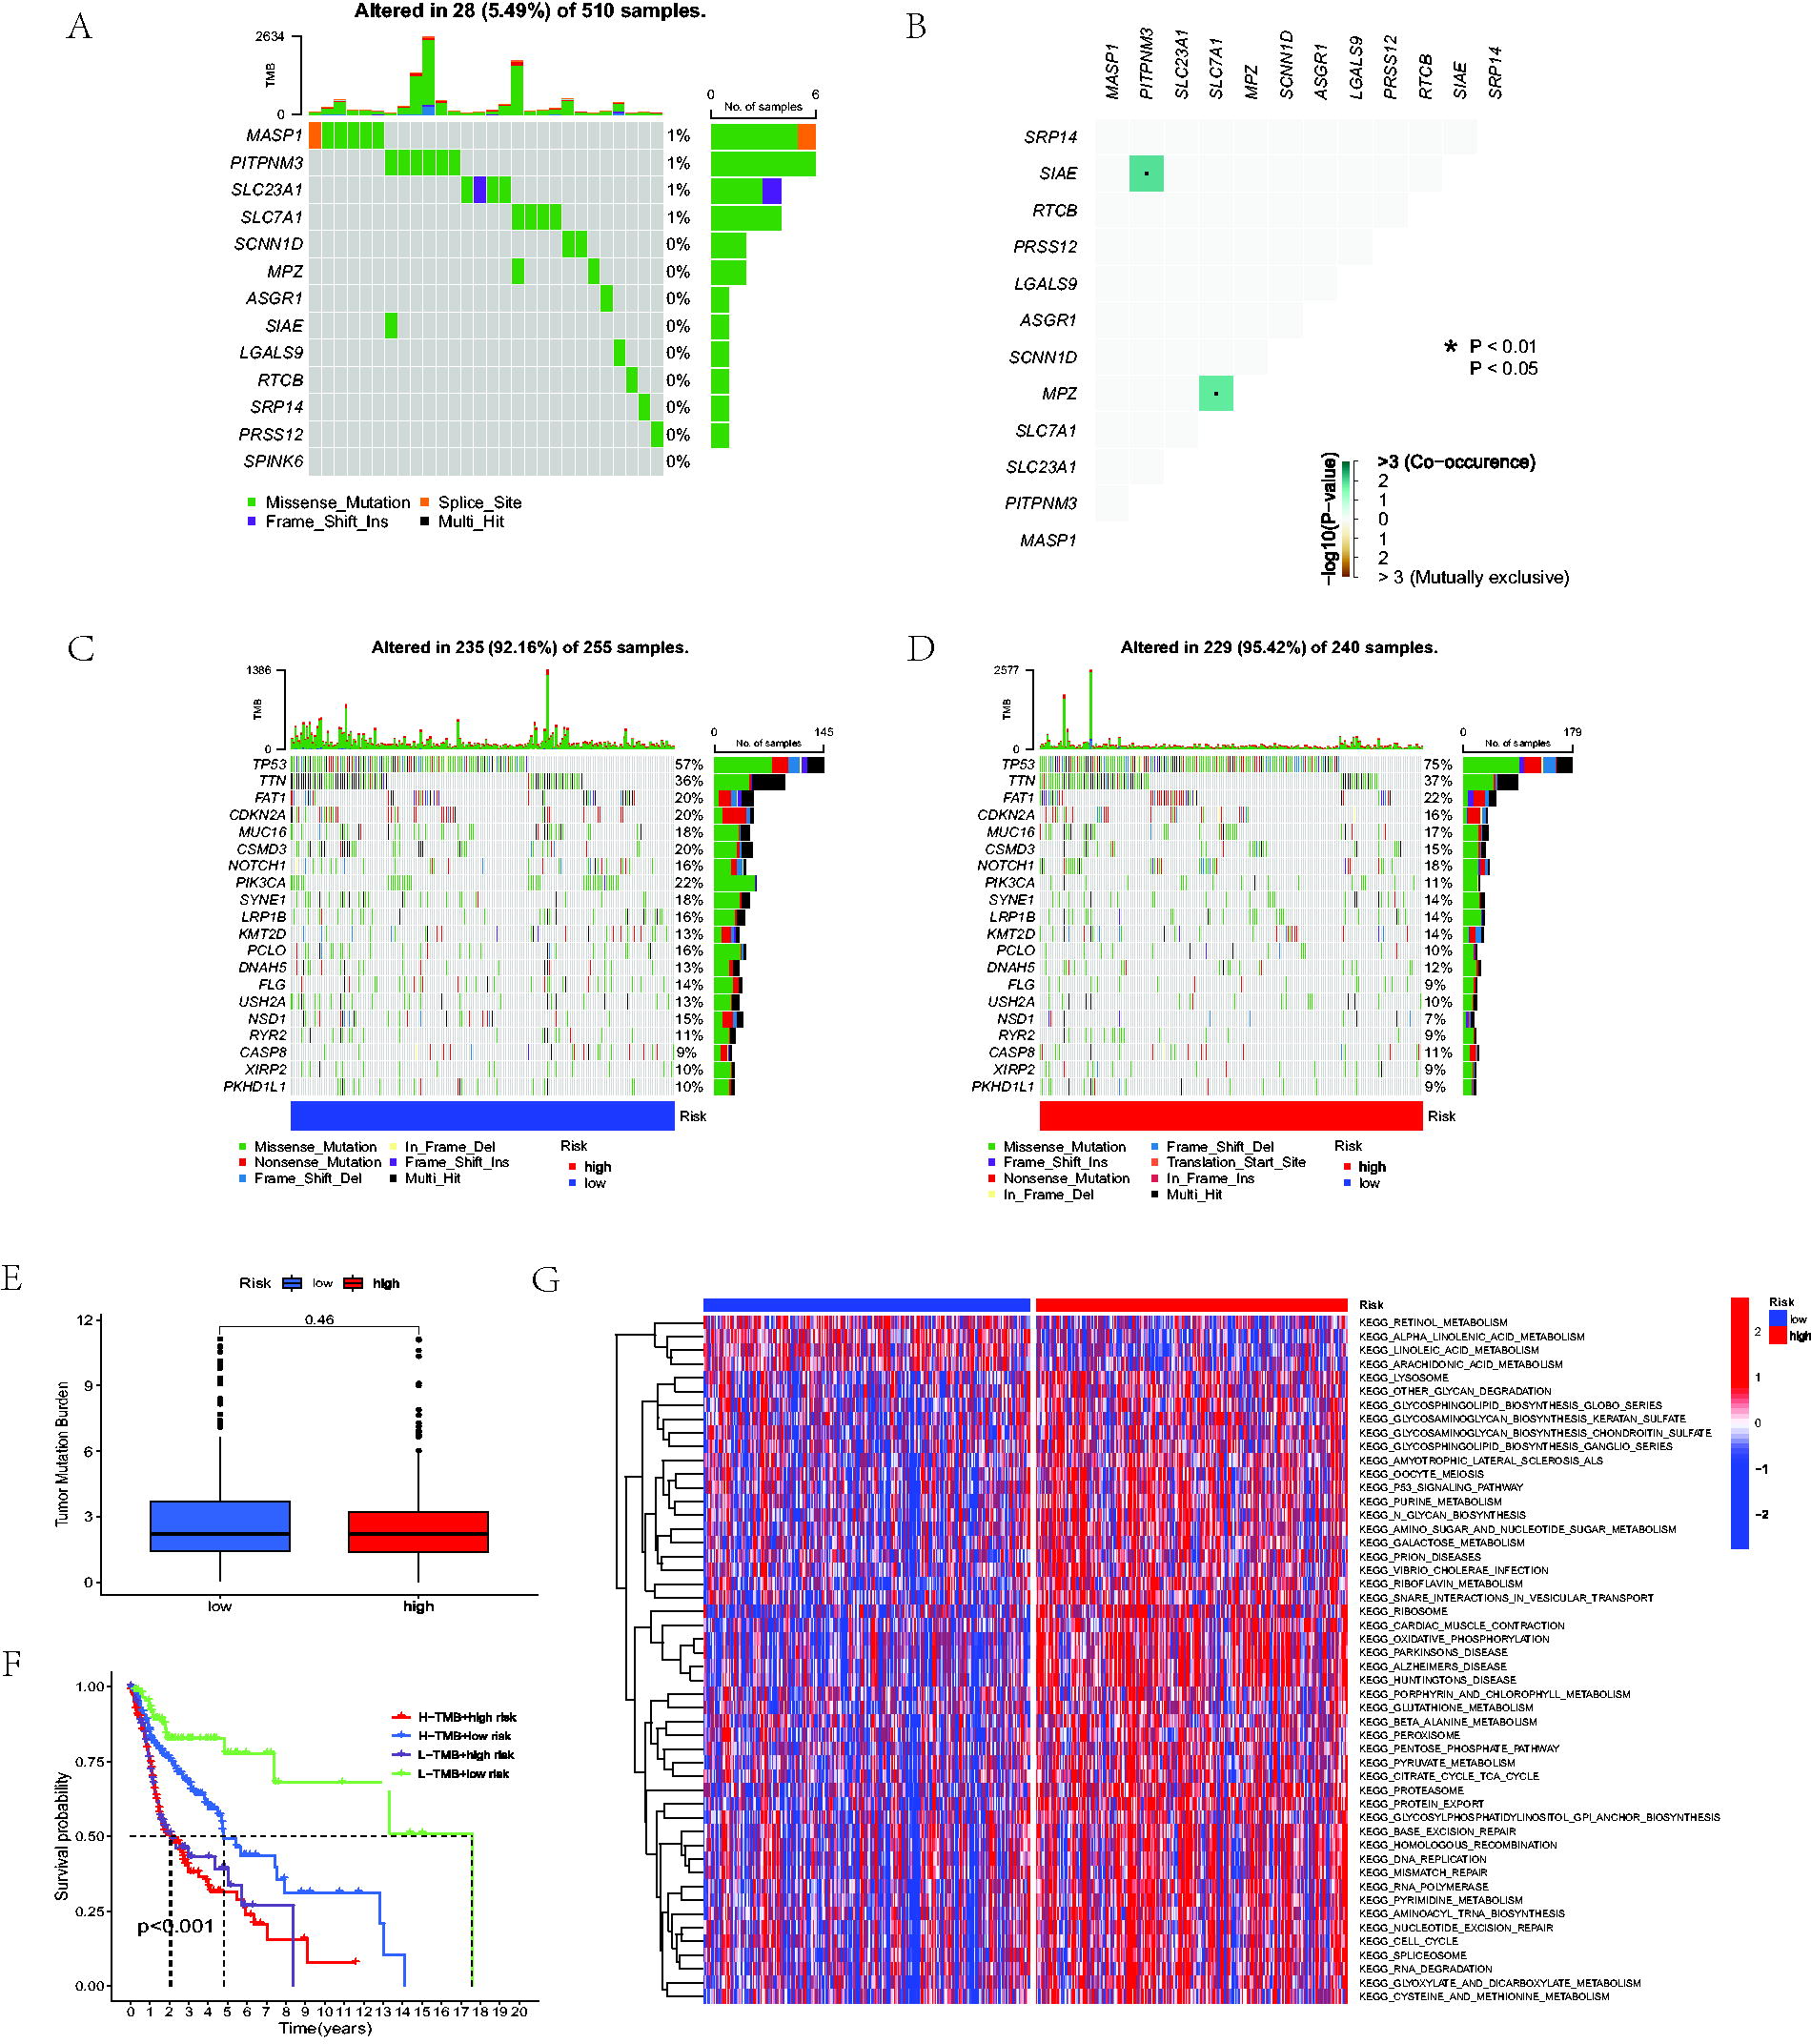
Correlation between LNMRS, TMB, and GSVA analysis.
Subsequently, we evaluated the immune cells’ infiltration level via the CIBERSORT algorithm. A differential expression of 22 distinct types of immune cells was observed within the high and low-risk groups. A violin plot revealed that plasma cells, naive B cells, Tregs, CD8 T cells, follicular helper T cells, neutrophils, and resting mast cells were highly elevated in the low-LNMRS group; nevertheless, M0 macrophages and M2 macrophages were increased in the high-LNMRS group (Fig. 5A). Moreover, we found that some related immune functions were more enriched in the low-LNMRS group, including CCR, checkpoint, inflammation-enhancing, T-cell costimulation, and type II IFN response (Fig. 5B). TIME scores, while the ESTIMATE algorithm for each sample of HNSCC, were also utilized to assess the tumor microenvironment. As indicated by four assessing scores, the low-LNMRS group behaved with elevated immune and ESTIMATE scores but lower tumor purity than the high-LNMRS group (Fig. 5C).
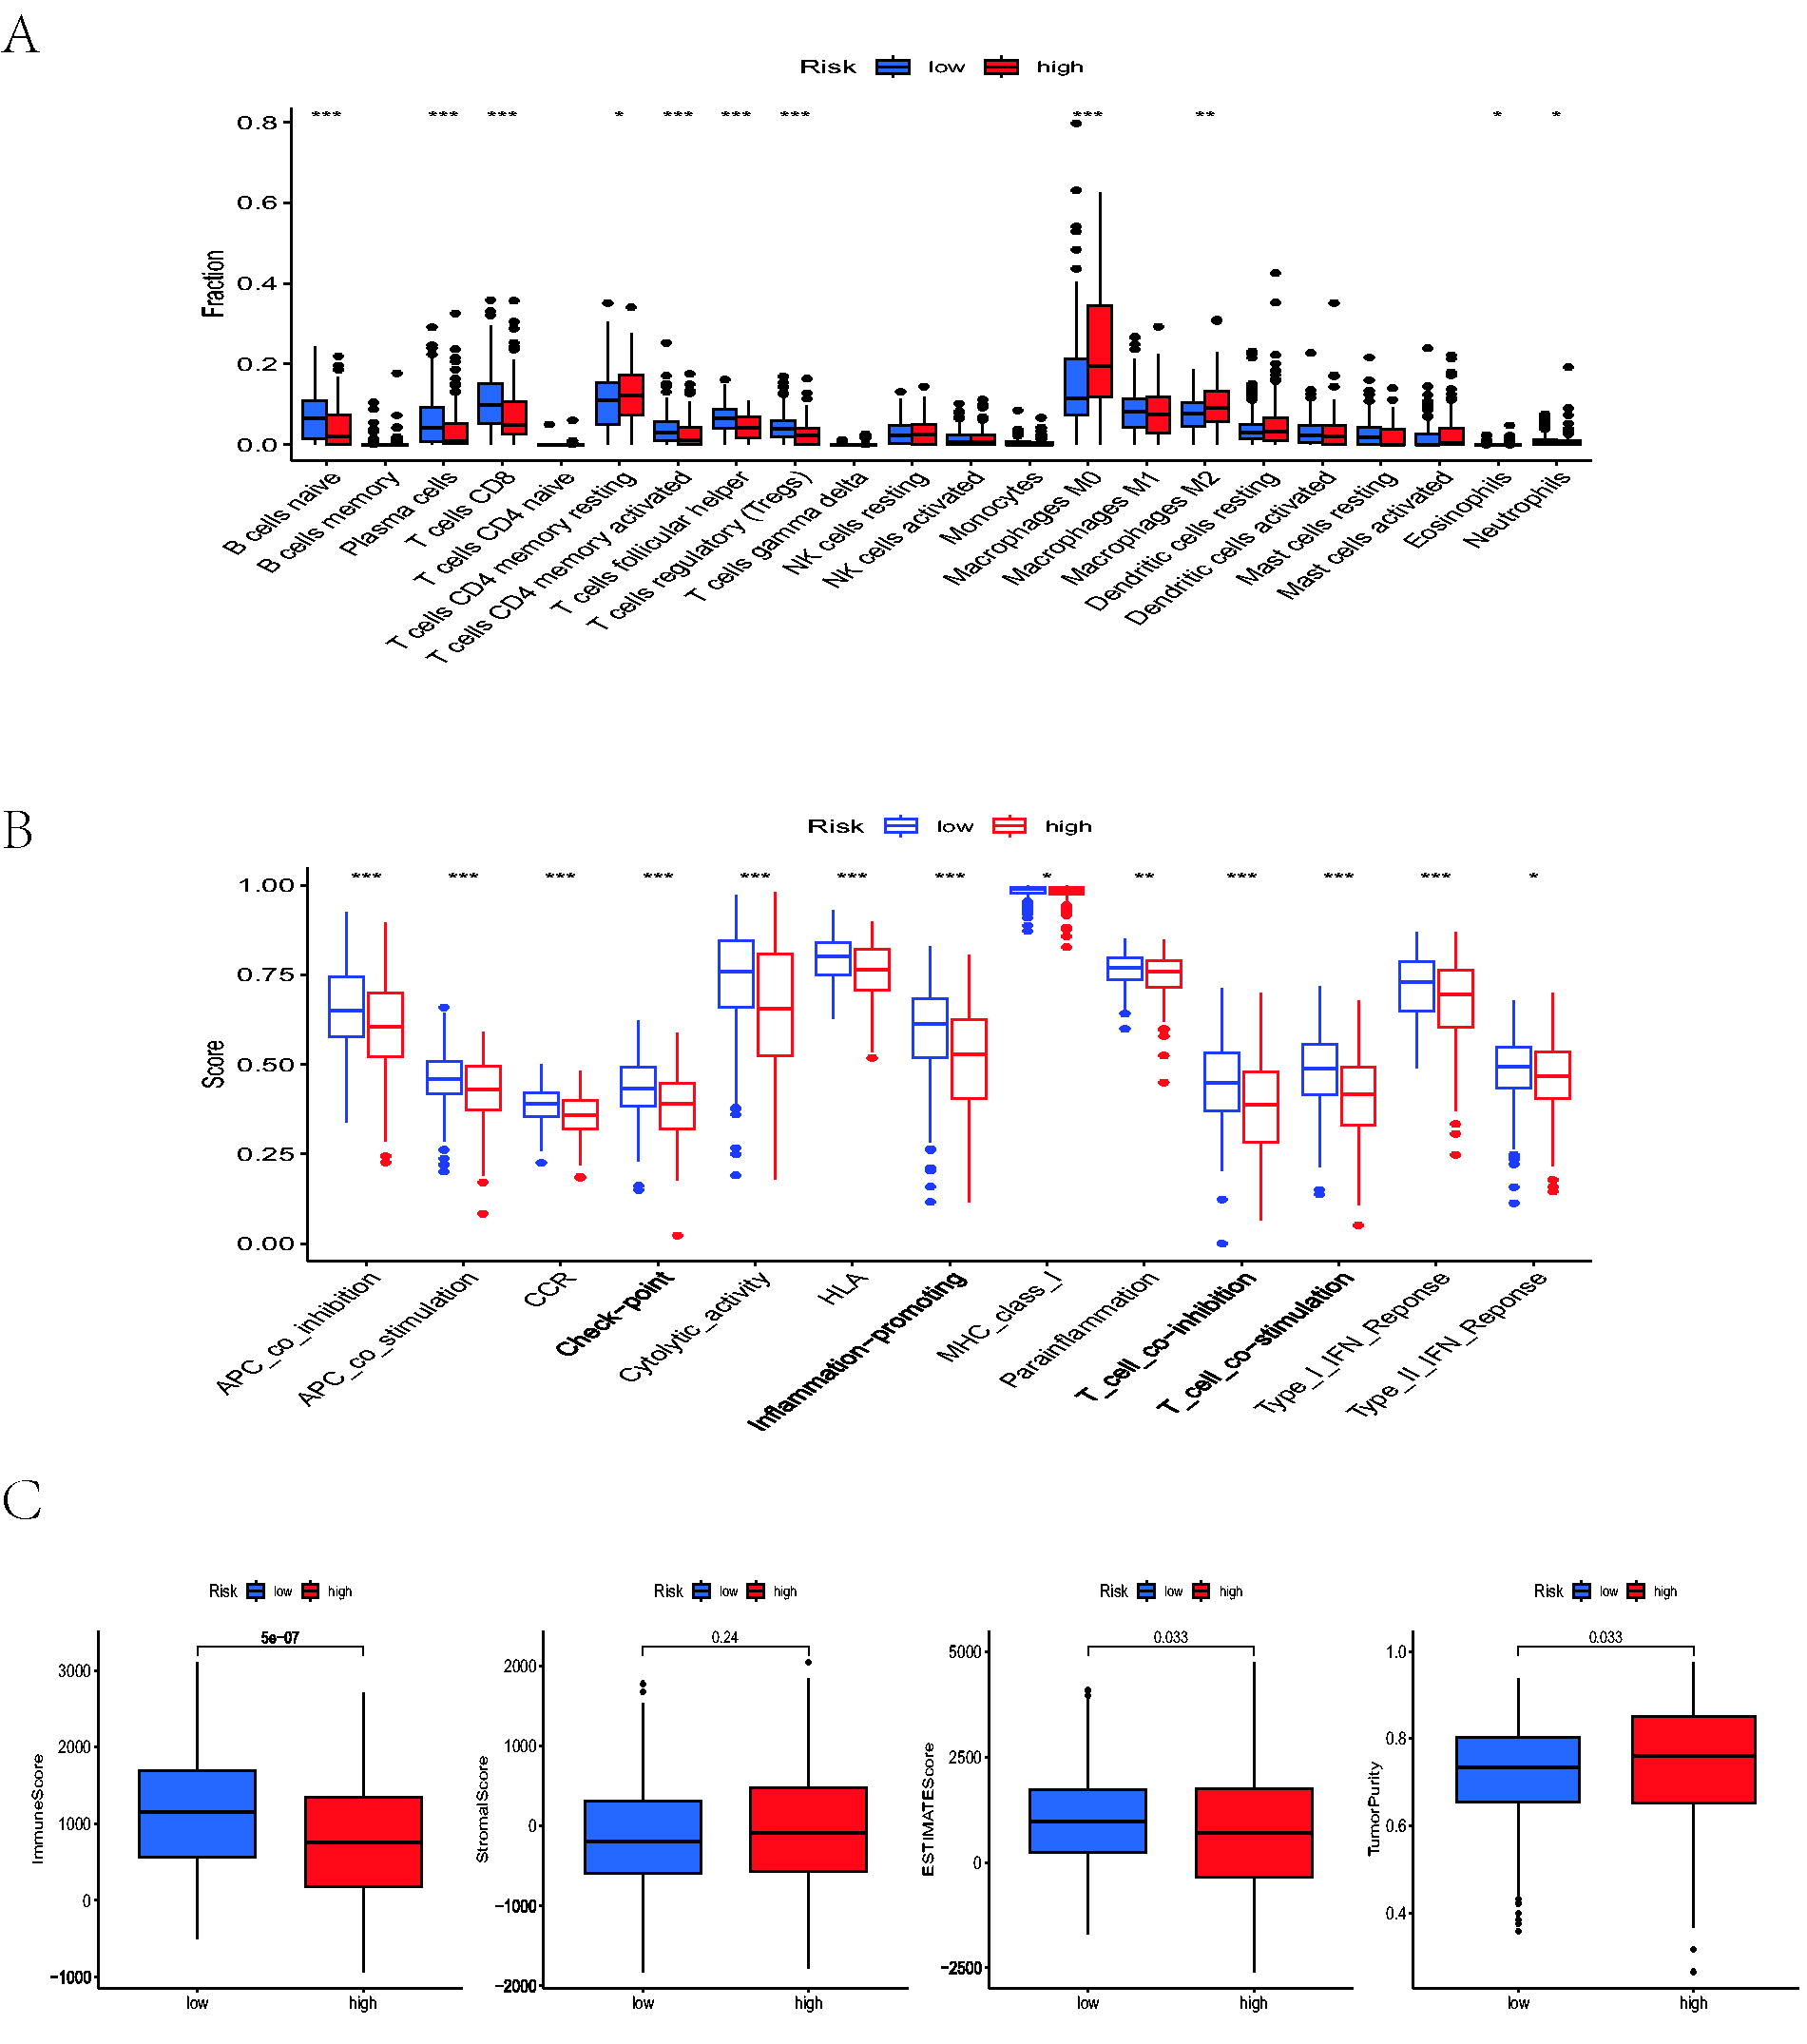
Correlation analysis between LNMRS and TIME.
Assessment of immunotherapy
Recently, as ICI therapy has become increasingly important in managing HNSCC at clinics, we compared the differential levels of ICI-related genes between the two LNMRS groups (Fig. 6A). According to these results, patients with high-LNMRS appeared to have markedly elevated expression of CD276, TNFSF9, and CD44 compared with low-risk patients; however, the low-LNMRS group exhibited more ICI-related genes expressed at higher levels than the high-LNMRS group (e.g., CD274, CTLA4, and PDCD1). Similarly, while assessing the ability of immune escape, patients in the low-LNMRS group had lower TIDE and exclusion scores but higher dysfunction scores than those with high LNMRS, indicating that the high-LNMRS group may more likely experience immune escape (Fig. 6B). The same findings were verified by comparing IPS from the TCIA database, which suggested that patients with low LNMRS scores had better immunotherapeutic responses (Fig. 6C).
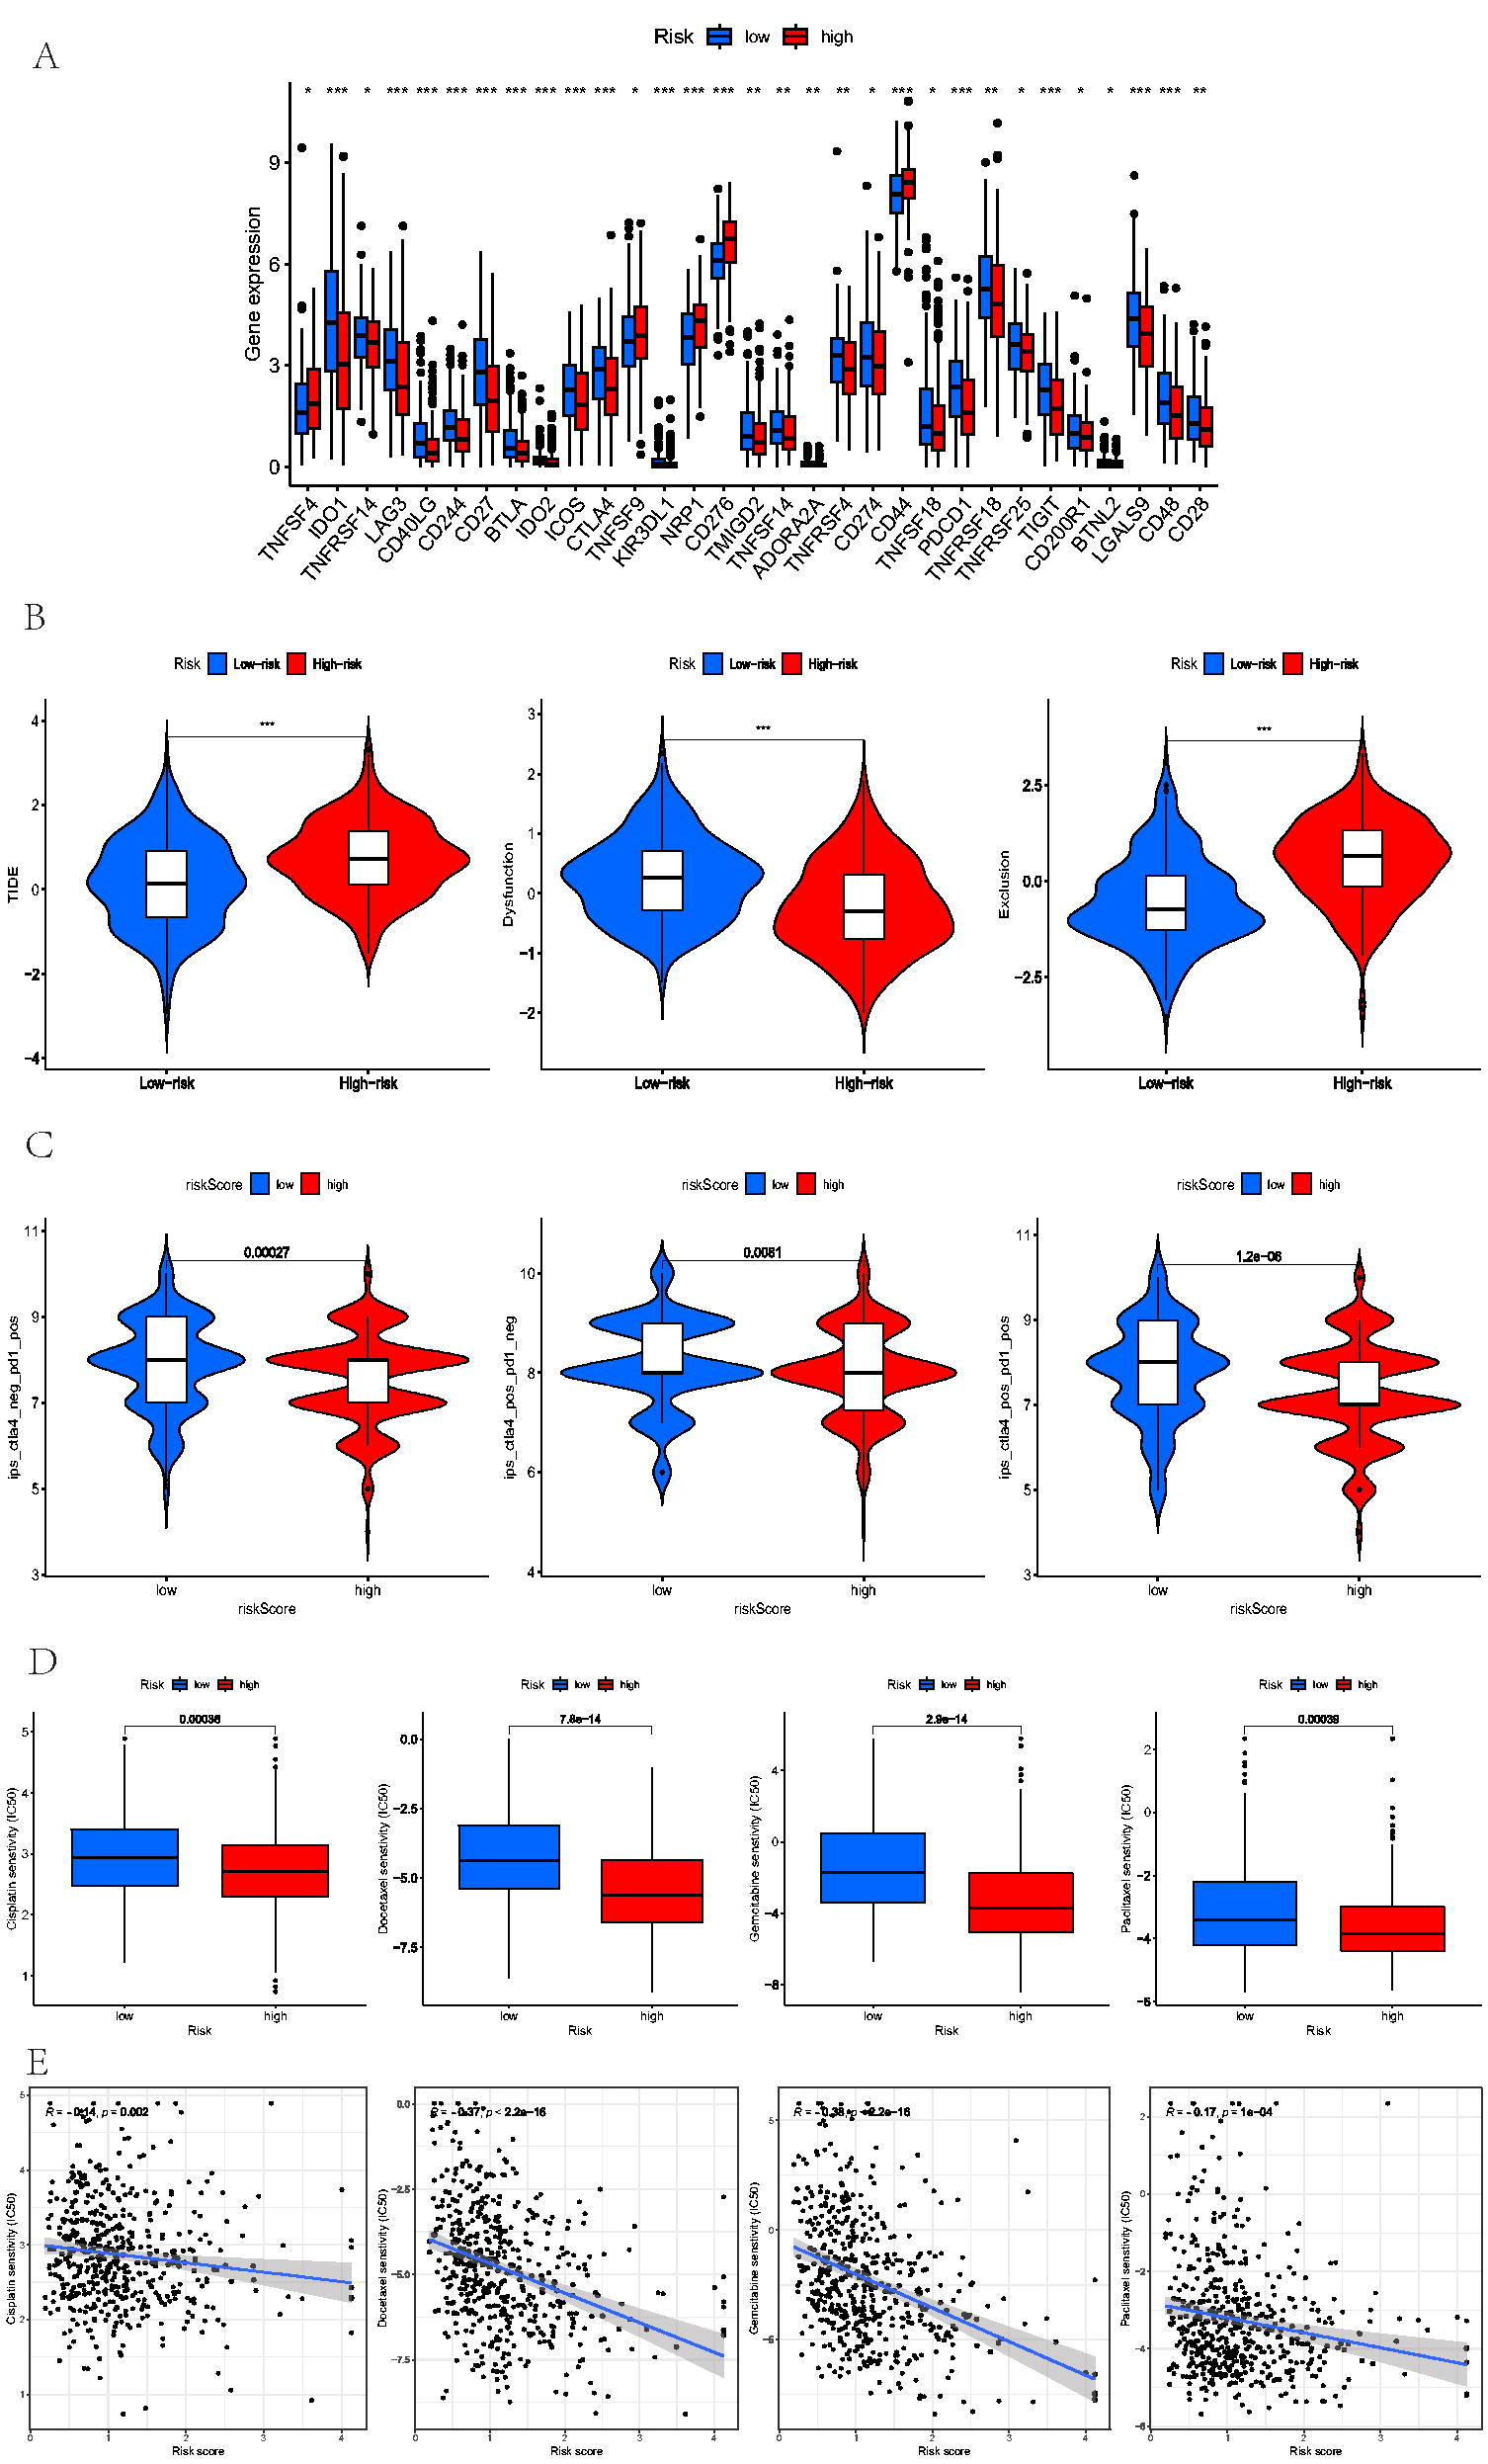
Assessment of Immunotherapy and chemotherapy.
Relationship between LNMRS and susceptibility to chemotherapeutic agents
Premised on the “pRRophetic” R packages, the values of IC50 for 4 chemotherapeutic agents (docetaxel, gemcitabine, cisplatin, and paclitaxel) were detected and compared between the low- and high-LNMRS groups. The results suggested that these patients with low-LNMRS exhibited higher IC50 values for the above chemotherapeutic drugs, and the negative correlation between the LNMRS and IC50 values also indicated that the patients with high-LNMRS were more sensitive to chemotherapy (Fig. 6D).
Discussion
HNSCC is reported as a type of tumor with high incidence and poor prognosis. Owing to the complex oncogenic mechanism and heterogeneity of HNSCC, there is still a lack of efficient and accurate methods to assess the prognosis of patients with HNSCC. 14,15 As determined by the American Joint Committee on Cancer, the staging system of the TNM stage is recognized as the most essential and common prognostic indicator to predict the postoperative outcome of HNSCC. Studies have shown that LNM and insensitivity to chemoradiotherapy have a great influence on the mortality of HNSCC. 16,17 However, the limitations of the TNM stage in assessing patient outcomes are emerging. For example, different clinical outcomes in patients with the same TNM stage and treatment regimen do not predict the treatment effect of patients. 18 Therefore, it is still necessary to explore and build new prediction models further for assessing the individual patient’s prognosis accurately and implementing personalized treatment.
The lymphatic system of the head and neck is highly complex and its lymphatic drainage has extensive traffic and anastomosis. 19 The head and neck lymph nodes account for approximately 1/3 to 1/2 of the lymph nodes in the whole body and are an essential part of the body’s defense system. 20 HNSCC is prone to metastasis of cervical lymph nodes, and occult cervical LNM quickly occurs in early-stage patients. 21 The existence or absence of regional lymph node metastases is an independent factor in assessing prognosis and is a crucial indicator of poor prognosis. Given these, TCGA-HNSC cohort patients were classified into N0 and N1-3 groups based on the LNM status. The prognosis of the two groups was analyzed, and it was concluded that the OS and PFS of the N1-3 group were remarkably worse than those of the N0 group, indicating that the degree of LNM affected the HNSCC prognosis. The findings of GO and KEGG analysis exhibited the LNM-DEGs-related biological progress and signaling pathways. According to these DEGs between the N0 and N1-3 groups, we may predict the LNM status more correctly while combing the radiological examination. Based on the predictive model, patients were distributed into low and high-LNMRS groups, and the OS and PFS in the low-LNMRS group were better than those in the high-LNMRS group. In addition, the Sankey map also reflected that the patients without LNM mainly were in the low-LNMRS group, behaving with better prognosis, and the higher AUC values also determined the satisfactory predictive effects and reliability of the LNMRS system.
Furthermore, the LNMRS was considerably linked to clinical stage, T status, N status, and grade, indicating that the LNMRS was more valuable and reliable in stratifying patients with HNSCC clinicopathological status. The nomogram provided further survival prediction for 1-, 3- and 5-year prognoses, and the calibration indicated high predictive ability. Based on the above results, this prognostic signature was determined to be highly strong and reliable for identifying the prognosis of patients with HNSCC.
Among these model genes, MASP1 was reportedly strongly linked with prognosis and a protective factor for HNSCC. 22 The gene of PCMT1, which encodes repair enzyme proteins, can be considered a potential biomarker for tumors. 23 A study has shown that six-gene models, consisting of SPINK6, can predict OS in patients with HNSCC and improve therapeutic decision-making. 24 Similarly, ASGR1 is related to SARS-CoV-2 and is a potential new marker for treating and identifying multiple human cancers. 25 In HNSCC, ASGR1 may affect tumor-immune interactions by modifying the tumor microenvironment and regulating immune cell infiltration. The incorporation of ASGR1 in our LNM-associated gene profile suggests its potential involvement in LNM, requiring exploration as a biomarker for prognosis and therapeutic targeting in HNSCC. SLC7A1 is determined to be overexpressed in ovarian cancer and is involved in energy metabolism. It affects tumor progression and is associated with immune infiltrating cells. 26 SIAE has been studied in prognostic models of oral cancer. 27 Moreover, PITPNM3 acts on CCL18 in tumor-associated macrophages to promote breast cancer metastasis. 28
Defined as having crucial roles in tumor progression and TIME, TMB was considered necessary in assessing and predicting the prognosis and immunotherapeutic response. 29,30 Although multiple studies have determined that a higher TMB is positively associated with antigens recognized by T cells, which may provide a better therapeutic response to ICIs, there is still a lack of studies focused on the interaction of TMB and HNSCC. 31 In this research, we analyzed the mutation frequency of model genes and the top 20 mutated genes of two LNMRS groups. Using K-M survival analysis, we found that patients with HNSCC with a lower mutated frequency and lower LNMRS behaved longer OS and had better survival status than those with higher scores.
TIME is essential in cancer biology, 32 forming a complex tumor ecosystem and supporting tumor growth and metastasis. 33 Recently, many studies have determined that TIME also plays an essential role in immunotherapy. 34 Comprised of the stromal cellular elements and immune cells, TIME significantly influences tumorigenesis by exerting tumor-inhibiting or promoting activities. 35 According to our study, we analyzed the differential expression of 22 distinct cell types between high and low-LNMRS groups. A violin plot displayed that naive B cells, CD8+ T cells, plasma cells, regulatory T cells, and follicular helper T cells behaved much more infiltration in the low-LNMRS group; nevertheless, M0 macrophages and M2 macrophages were identified to be elevated in the high-LNMRS group. Extensive evidence suggests that high levels of T-cell infiltration are significantly associated with the prognosis of human malignancies and that these results indicated the relationship between LNM and cancer immunotherapeutic response. 36 Studies have found that patients with HNSCC with high infiltration of CD8+ T lymphocytes have a relatively good prognosis. 37 Our study found significant T-cell enrichment in the low-LNMRS group, which may also indicate that the low-risk group has a better immunotherapeutic response.
Moreover, we observed significant differences in the expression levels of critical ICI-related genes, such as CTLA-4 and CD274, between the low-LNMRS and high-LNMRS cohorts. Downregulating expression levels of CD274 and PDCD1 were observed in the high-LNMRS group, suggesting a possible immunosuppressive environment that could impede effective antitumor immune responses. These results highlight the clinical significance of this LNMRS classification in guiding treatment decisions and predicting responses to immunotherapy in HNSCC, as elevated PD-1 and PD-L1 levels are frequently linked to immunotherapy resistance. It also suggested that patients with low-LNMRS may benefit from increased therapeutic efficacy from ICIs.
Moreover, tumor-associated macrophages are the critical component of the HNSCC tumor microenvironment because they regulate the immune response to cancer. An increased density of the TIME, predominantly M2 macrophages, was associated with poorer clinicopathological markers in HNSCC, and reports suggest that increased infiltrating M0 macrophages are associated with poorer tumor prognosis. 38 Our results are consistent with previous studies, reflecting macrophages’ proinflammatory and protumor effects in HNSCC. Several key genes in the LNM-associated signature identified in this study have well-established roles in tumor progression and immune modulation. For example, MASP1 has been reported to influence the immune system by activating the lectin complement pathway, which is involved in immune surveillance and metastasis suppression in various cancers, including HNSCC. This role could link MASP1 to LNM by modulating the tumor microenvironment and influencing immune cell recruitment. PCMT1, encoding repair enzyme proteins, has been associated with cellular stress responses crucial in maintaining tumor cell survival during metastasis. The inclusion of MASP1 in our model raises the possibility that it influences tumor immunity and LNM. Because of its role in immune modulation, MASP1 may be a target for upcoming therapeutic approaches to improve antitumor immunity in patients with HNSCC.
Regarding immune modulation, the observed enrichment of T-cell populations in the low-LNMRS group underscores the importance of immune surveillance in preventing LNM. However, the higher levels of M0 and M2 macrophages in the high-LNMRS group suggest a tumor-promoting environment, as these macrophages are typically associated with immune suppression and poor prognosis in HNSCC. The differential expression of immune cell types in these groups further highlights the influence of the gene signature on immune modulation. There are many coinhibitory and costimulatory molecules of immune cells, including PD-1, PD-L1, CTLA4, and LAG3. 39 As a common immunosuppressive agent, PD-1 ICIs have been mainly used in the research and management of various solid tumors. Another coinhibitory signaling molecule, CTLA4, by binding to its specific ligand B7, can reduce T-cell reactivity and participate in the negative regulation of the immune response. 40 In this article, PD-1 and CTLA4 inhibitors were analyzed in the LNMRS groups, and it was recommended that the low-LNMRS group had a better immune response than the high-LNMRS group. It is suggested that patients with low LNMRS may show a better response and prognosis when receiving ICI treatment. In general, patients with HNSCC are treated with a combination of surgery, radiotherapy, chemotherapy, immunotherapy, and other methods. This study selected four commonly used chemotherapy drugs: docetaxel, cisplatin, gemcitabine, and paclitaxel. Through the analysis of the sensitivity of these four drugs in the low-risk group, it was found that the sensitivity of these four drugs to the low-risk group was higher. Therefore, the model constructed in this study can serve as a potential predictor of chemotherapy sensitivity and may lead to a more precise and effective chemotherapy. The gene signature can initially classify patients with HNSCC according to their risk of lymph node metastases to guide treatment options. Increased monitoring and adjuvant treatments, such as immunotherapy, may be suggested for individuals with elevated LNMRS to prevent tumors. Furthermore, the results of the immune profiling indicate that patients with lower LNMRS might benefit more from immune checkpoint inhibitors (ICIs), including PD-1 or CTLA4 inhibitors because these patients exhibit higher levels of T-cell infiltration, which generally corresponds to better immunotherapy responses.
However, some limitations also appeared in our analysis. Patients used to establish and test the signature only contained cases downloaded from the TCGA and GEO cohorts, considered retrospective studies. Prospective trials containing clinical data and RNA-seq information are required to verify and support our results.
Conclusions
In summary, we constructed a new LNM-associated signature to detect and assess the prognosis and clinical therapeutic effects of HNSCC. This LNM-associated gene signature could be a valuable tool for personalized treatment strategies in clinical practice. It may guide decisions on chemotherapy sensitivity and the potential benefit from immunotherapies based on immune profiling results, thus aiding in refining therapeutic approaches for patients with HNSCC. This model revealed the further relationship between LNM and HNSCC at the gene level and can provide a new perspective for treatment.
Footnotes
Data Availability Statement
All results were based on a public database and mentioned in the article.
Ethical Approval Statement
All results of this article were based on online databases, and there is no requirement for ethical approval.
Authors’ Contributions
All authors have participated equally in this work. Z.W. helped with the article write-up, Z.W. and L.C. contributed by evaluating results, and Q.H. and J.Z. helped in article formatting. Moreover, Y.R., J.H., and Y.S. created the final draft of the article.
Disclosure Statement
There is no conflict of interest.
Funding Information
This study was supported by Zhejiang Provincial Medical and Health Science Research Foundation (2020RC107 and 2021KY1039).