
Abstract
Introduction:
Prostate-specific membrane antigen (PSMA) is a target for diagnostic positron emission tomography (PET)-tracers and radiopharmaceutical therapy (RPT), for example, [177Lu]Lu-PSMA-617, in prostate cancer. This autoradiography study investigates [177Lu]Lu-PSMA-617 intratumoral distribution over time, compared with PSMA expression, proliferation (Ki67), and [68Ga]Ga-PSMA-11, [18F]F-PSMA-1007, [18F]-fluorodeoxyglucose, and [18F]-fluorocholine distribution. Mice with LNCaP, 22Rv1, or PC-3 PIP xenografts got [177Lu]Lu-PSMA-617 i.v. Sacrificed 1 h p.i. if coinjected with diagnostic tracers, otherwise at 20 min, 1–2, 12, 24, 48, 72 h, or 2–3 weeks p.i. Cryosectioned tumors imaged by autoradiography, adjacent sections Ki67 or PSMA stained.
Results:
Heterogeneous distribution of [177Lu]Lu-PSMA-617 was seen 20 min p.i., with visible overlap between tumor cells, Ki67, PSMA, and radioactivity at 1–2 h p.i. Strongest Ki67-correlation at 48 h, which became negative at 72 h and beyond with some Ki67+/PSMA+ low radioactivity areas. Uptake in necrotic tissue was only observed at 2–3 weeks p.i. PSMA-targeted tracers distributed identically to [177Lu]Lu-PSMA-617 whereas other tracers only had some overlap.
Conclusion:
Regrowth of the tumor post-[177Lu]Lu-PSMA-617 administration creates Ki67+/PSMA+ areas that have no radioactivity uptake and need additional therapy fractions. The identical intratumoral distribution of [177Lu]Lu-PSMA-617 and PSMA-targeted PET-tracers indicate that these will reveal the areas inside the tumor targeted by RPT at least at 1 h p.i.
Introduction
Metastatic prostate cancer (PCa) poses a significant clinical challenge. In the STAMPEDE trial, the median failure-free survival for patients with metastatic androgen-sensitive PCa treated with androgen deprivation therapy (ADT) alone was 11.2 months. 1 PCa that develops resistance to ADT has even fewer options for therapy. 2 Radiopharmaceutical therapy (RPT) with prostate-specific membrane antigen (PSMA)-targeting agents have had success in this patient group. Ligands targeting PSMA, almost all based on glutamine urea-lysine dimers, offer better tissue clearance and potentially better penetration of solid tumors than antibody-based PSMA targeting. 3 PSMA is mostly restricted to benign and malignant prostatic tissue, but with expression in other tissues, mainly the kidney and salivary glands. 4 Expression has been correlated with PCa grade. 5 Lutetium-177-labeled PSMA-617 ([177Lu]Lu-PSMA-617, Pluvicto™) is the first RPT ligand Food and Drug Administration (FDA)- and European Medicines Agency-approved for PSMA positive metastatic PCa. 6,7
PSMA targeting can also be used for medical imaging; for lesion detection, staging, and treatment planning. Despite success in other cancers, and possible role in advanced/recurrent PCa, [18F]-fluorodeoxyglucose ([18F]FDG) performs poorly in early stages of PCa due to low glucose metabolism. 8 –10 Carbon-11 labeled choline or fluorine-18 labeled fluorocholine ([18F]FCH) positron emission tomography (PET) can detect distant metastases with usefulness in detection of osseous disease, outperforming bone scan but less successful in the detection of lymph node metastases. 11 Serum prostate-specific antigen (PSA) levels and choline uptake are positively correlated. 12 A benefit of PSMA PET is the possibility of pairing it with PSMA RPT for PSMA expression validation and follow-up. Gallium-68 PSMA-11 ([68Ga]Ga-PSMA-11) PET has been FDA-approved for [177Lu]Lu-PSMA-617 patient selection and has high sensitivity and specificity compared with conventional imaging. 13,14 Another PSMA-specific PET agent, fluorine-18 PSMA-1007 ([18F]F-PSMA-1007), possibly has better lesion detection following biochemical recurrence than [68Ga]Ga-PSMA-11 in patients with lower PSA levels. 15 The hepatobiliary, not urinary, excretion of [18F]F-PSMA-1007 could increase the detection rate in the urinary tract area, 16 and positron range and yield of fluorine-18 are beneficial for image quality, however, high nonspecific bone uptake has been reported. 17
Tumor-killing in RPT is dependent on the absorbed dose and its distribution, which is a function of radioactivity distribution inside a tumor. A tool for imaging the distribution of radioactivity is autoradiography, which can provide µm-level activity distributions from ex vivo tumor samples. 18,19 The RPT agent distribution in relation to tumor biology can change as the therapy progresses, 20 and is dependent on properties of the agent, and the expression and distribution of the target. In the publication record there are no longitudinal investigations of the changes in intratumoral distribution of [177Lu]Lu-PSMA-617. Any investigation is either a minor part of a larger study 21 and/or with PSMA-617 labeled with other radionuclides. 22,23
The aim of this study was to investigate how [177Lu]Lu-PSMA-617 distributes inside tumors in xenograft models of PCa using autoradiography, over time, in relation to PSMA expression, proliferation (Ki67), and in comparison with the distribution of diagnostic tracers. To find generalizable patterns, the investigation was performed using tumor cell lines with different levels of PSMA expression.
Materials and Methods
Radiolabeling
Radiolabeling was conducted as described by Kratochwil et al. 24 Circa 430 MBq of noncarrier added 177Lu (ITM GmbH, Garching, Germany), 30–40 MBq/µL, was mixed with 100 µL sterile 0.4 M sodium acetate solution, pH 5.5, and 1.25 µL 20% w/w ascorbic acid solution; thereafter, 1 µL of a 10 mM solution of PSMA-617 (ABX, Radeberg, Germany or MedChemExpress, Monmouth Junction, NJ, USA) was added. The solution was heated to and maintained at 95°C on a shaker for 15 min. Samples, 1 µL, were taken for instant thin-layer chromatography (iTLC) at 0 and 15 min. Sodium citrate solution 0.2 M (mobile phase) was allowed to migrate up the iTLC strip. The strips were then analyzed on a phosphor imager system (Cyclone Plus Phosphor Imager, PerkinElmer, Inc., Waltham, MA, USA) together with a free 177Lu-only control. Removing the sample from the shaker and cooling it to room temperature (RT) terminated the reaction. A sterile 0.9% sodium chloride solution was added, and the radiotracer diluted (1:3 or 1:7), a sample for iTLC taken, and pH tested, before injections in mice. Radiochemical purity was always >99% and no further purification was done (see example, Supplementary Fig. S1), the specific activity was 43 ± 3 MBq/nmol (n = 4).
Cell culture
LNCaP and 22Rv1 were purchased from American Type Culture Collection (Manassas, VA, USA). PC-3 PIP cells were provided by Professor Anna Orlova (Uppsala University, Uppsala, Sweden). Compared with LNCaP, 22Rv1 has significantly lower PSMA expression 25 and PC-3 PIP slightly higher. 26 Cells were cultured in RPMI-1640 medium (Thermo Scientific, Waltham, MA, USA) supplemented with 10% fetal bovine serum (Thermo Scientific) with 100 U/mL penicillin and 100 μg/mL streptomycin (Thermo Scientific). The cells were maintained at 37°C, 5% carbon dioxide, in a humidified incubator, and were detached with trypsin-EDTA solution (Thermo Scientific) and regularly tested for Mycoplasma (Mycoplasmacheck, Eurofins Genomics, Ebersberg, Germany).
Animal studies
All experiments were conducted according to directions by the regional ethical committee for animal trials in Malmö/Lund (Dnr: 04350–2020), and in compliance with the ARRIVE guidelines. BALB/c nude male (Janvier Labs, Le Genest-Saint-Isle, France) 7–8 weeks old were inoculated subcutaneously on their right flank with 200 µL of a 1:1 RPMI-1640 and Matrigel (BD Biosciences, San Jose, CA, USA) solution containing 4–6 million LNCaP (n = 24), 22Rv1 (n = 9), or PC-3 PIP cells (n = 14). Animals per tumor cell type, time of sacrifice, and coinjected tracers are detailed in Table 1. Animals sacrificed 1–2 h p.i. were given 5–12 MBq [177Lu]Lu-PSMA-617, partly not to excessive count rate while still obtaining enough signal when imaging mice coinjected with diagnostic tracers ([18F]FDG or [18F]FCH at 10–80 MBq per animal or 10–23 MBq [18F]F-PSMA-1007 or 1–10 MBq [68Ga]Ga-PSMA-11; Lund University Hospital, Lund, Sweden). The 22Rv2 tumors got 8–9 MBq [177Lu]Lu-PSMA-617, if coinjected, or 20–52 MBq, if sacrificed 2 h p.i. Animals sacrificed 12–72 h p.i. were given 12–22 MBq [177Lu]Lu-PSMA-617. Some LNCaP animals (n = 3) received 80 MBq of [177Lu]Lu-PSMA-617 and were sacrificed 2–3 weeks p.i. to study longer therapy effect on [177Lu]Lu-PSMA-617 distribution. After sacrifice the tumor was excised and embedded in Tissue-Tek® O.C.T.™ compound (Sakura Finetek; Alphen aan den Rijn, The Netherlands), frozen on dry ice, and cryosectioned at 10 µm. Some tumor size measurements were made, see Supplementary Data S1.
Number of Animals per Treatment
[18F]FDG, [18F]-fluorodeoxyglucose; [18F]FCH, [18F]-fluorocholine; PSMA, prostate-specific membrane antigen.
Autoradiography
Autoradiography employed a double-sided silicon strip detector (Biomolex Imager 700, Biomolex, Oslo, Norway) with 50 µm intrinsic spatial resolution. 27 For coinjections, counts from each radionuclide in the autoradiography images were separated using difference in half-lives. One microscope slide at a time was imaged, duration set depending on samples, activity level, and half-life. For example, several slides containing a short-lived radionuclide could each be imaged for as little as 120 min. For 177Lu-only samples, duration could be up to 44 h. Instrument data contained coordinates, energy, and timestamp for each detected event. Events were sorted into different time periods and the ratio between these used to determine the radionuclide mix in each pixel. Software was developed in IDL 8.5 (NV5 Geospatial Solutions Inc, Broomfield, CO, USA) to reconstruct images and correct for dead or miscalibrated detector strips. Once imaged, the slide was taken for hematoxylin and eosin staining. 28 This study does not present any absolute activity data, as the radioactivity per pixel will depend on injected activity and our focus here is the relative distribution as it can be translated into models to calculate, for example, tumor control probability for different activities.
Immunohistochemistry
Autoradiography and immunohistochemistry sections were cryosectioned directly adjacent. Cryosections were dried for 15 min in 37°C and then fixed with 4% PFA. Endogen peroxidase activity was quenched for 5–10 min (REAL Peroxidase-Blocking Solution, Agilent Technologies, Santa Clara, CA, USA). Sections were incubated in a humidity chamber with rabbit anti-Ki-67 mAb (Clone SP6, Thermo Fischer Scientific) or anti-PSMA (Abcam ab133579) 29 for 1 h at RT. Incubation with horseradish peroxidase conjugated goat antirabbit F(ab)2 (111-036-045, Jackson ImmunoResearch Laboratories, Inc., West Grove, PA, USA) was performed at RT for 30 min. The stain was developed by adding 3,3′-diaminobenzidine (Agilent Technologies) for 10 min. After counterstaining with hematoxylin, dehydration, and mounting with Pertex (Histolab, Gothenburg, Sweden), sections were imaged using an Axio Scan Z1 imager (Carl Zeiss AG, Oberkochen, Germany).
Correlation analysis
In all PC-3 PIP tumors the mean of the relative uptake (counts in pixel as the fraction of the maximum counts found in an in-section pixel) was quantified in regions-of-interest (ROIs), 0.18–3.02 mm2, using ImageJ. 30 Identical ROIs in each corresponding Ki-67-stained slide were drawn using ZEN 3.5 blue edition (Carl Zeiss AG) and exported to ImageJ. Intensity of staining per nuclear area was determined using the Immunoratio plugin with default settings. 31 Statistical analysis (Pearson’s correlation and nonparametric Spearman’s correlation) of the correlation between the two was performed for each time point postinjection using IBM SPSS Statistics version 27 (IBM, Armonk, NY, USA). LNCaP tumors were similarly investigated, see Supplementary Data S1.
Results
Distribution in relation to tumor histology
Qualitative evaluation of uptake at 20 min p.i. in LNCaP xenografts revealed an uneven distribution with activity mainly located on the edges of the tumors and in thin rivulets inside (Fig. 1). At 1, 1.5, and 2 h all xenograft types presented with a more even distribution as [177Lu]Lu-PSMA-617 seem to have infiltrated into the tumor (Fig. 1, Supplementary Fig S2A, B). Later, in PC-3 PIP, at 24, 48, and 72 h p.i. and in LNCaP at 25 h p.i. homogenous distributions can be seen in tumor-cell containing areas. This presents as high uptake in areas with high tumor cell density and vice versa (Fig. 1, Supplementary Fig S2D), and no uptake in necrotic or connective tissue. There are, however, small tumor-cell containing areas, mostly on the edges, with very low uptake. At 2–3 weeks p.i. the LNCaP xenograft sections appear to be affected by therapy and areas where activity has located are now more necrotic or granulate, some even hemochromatic (Fig. 1, Supplementary Fig S2E). Throughout the section there are isolated islets containing non-necrotic tumor cells with very low or no uptake.

Autoradiography and histology. Autoradiography of [177Lu]Lu-PSMA-617 uptake (left), and H&E staining of histology in the same section (right). Labeled rectangles represent areas magnified in Supplementary Figure 2E–H. All autoradiography images are individually scaled from zero (white) to max uptake (black) in that image. Black lines represent 1 mm. 177Lu, Lutetium-177; PSMA, prostate-specific membrane antigen.
Distribution in relation to Ki67 and PSMA
Comparing adjacent stainings for proliferation (Ki67), in LNCaP and 22Rv1 tumors at 1–24 h p.i. with imaged [177Lu]Lu-PSMA-617 activity show that denser Ki67 expression areas correspond to higher uptake (Fig. 2, Supplementary Fig. S3). However, there are still some small areas, within the tumor and not along the nodule edges, or in isolated tumor-tissue islet where the uptake is lower despite proliferative cells. Later, at 72 h p.i. in PC-3 PIP, high-uptake areas are more likely to have less Ki67 staining (Fig. 2), an effect even more pronounced in LNCaP at later time points (2–3 weeks, Supplementary Fig. S3). This indicates, at least in PC-3 PIP, that it takes about 72 h from injection for the therapeutic effect to lower Ki67 expression.
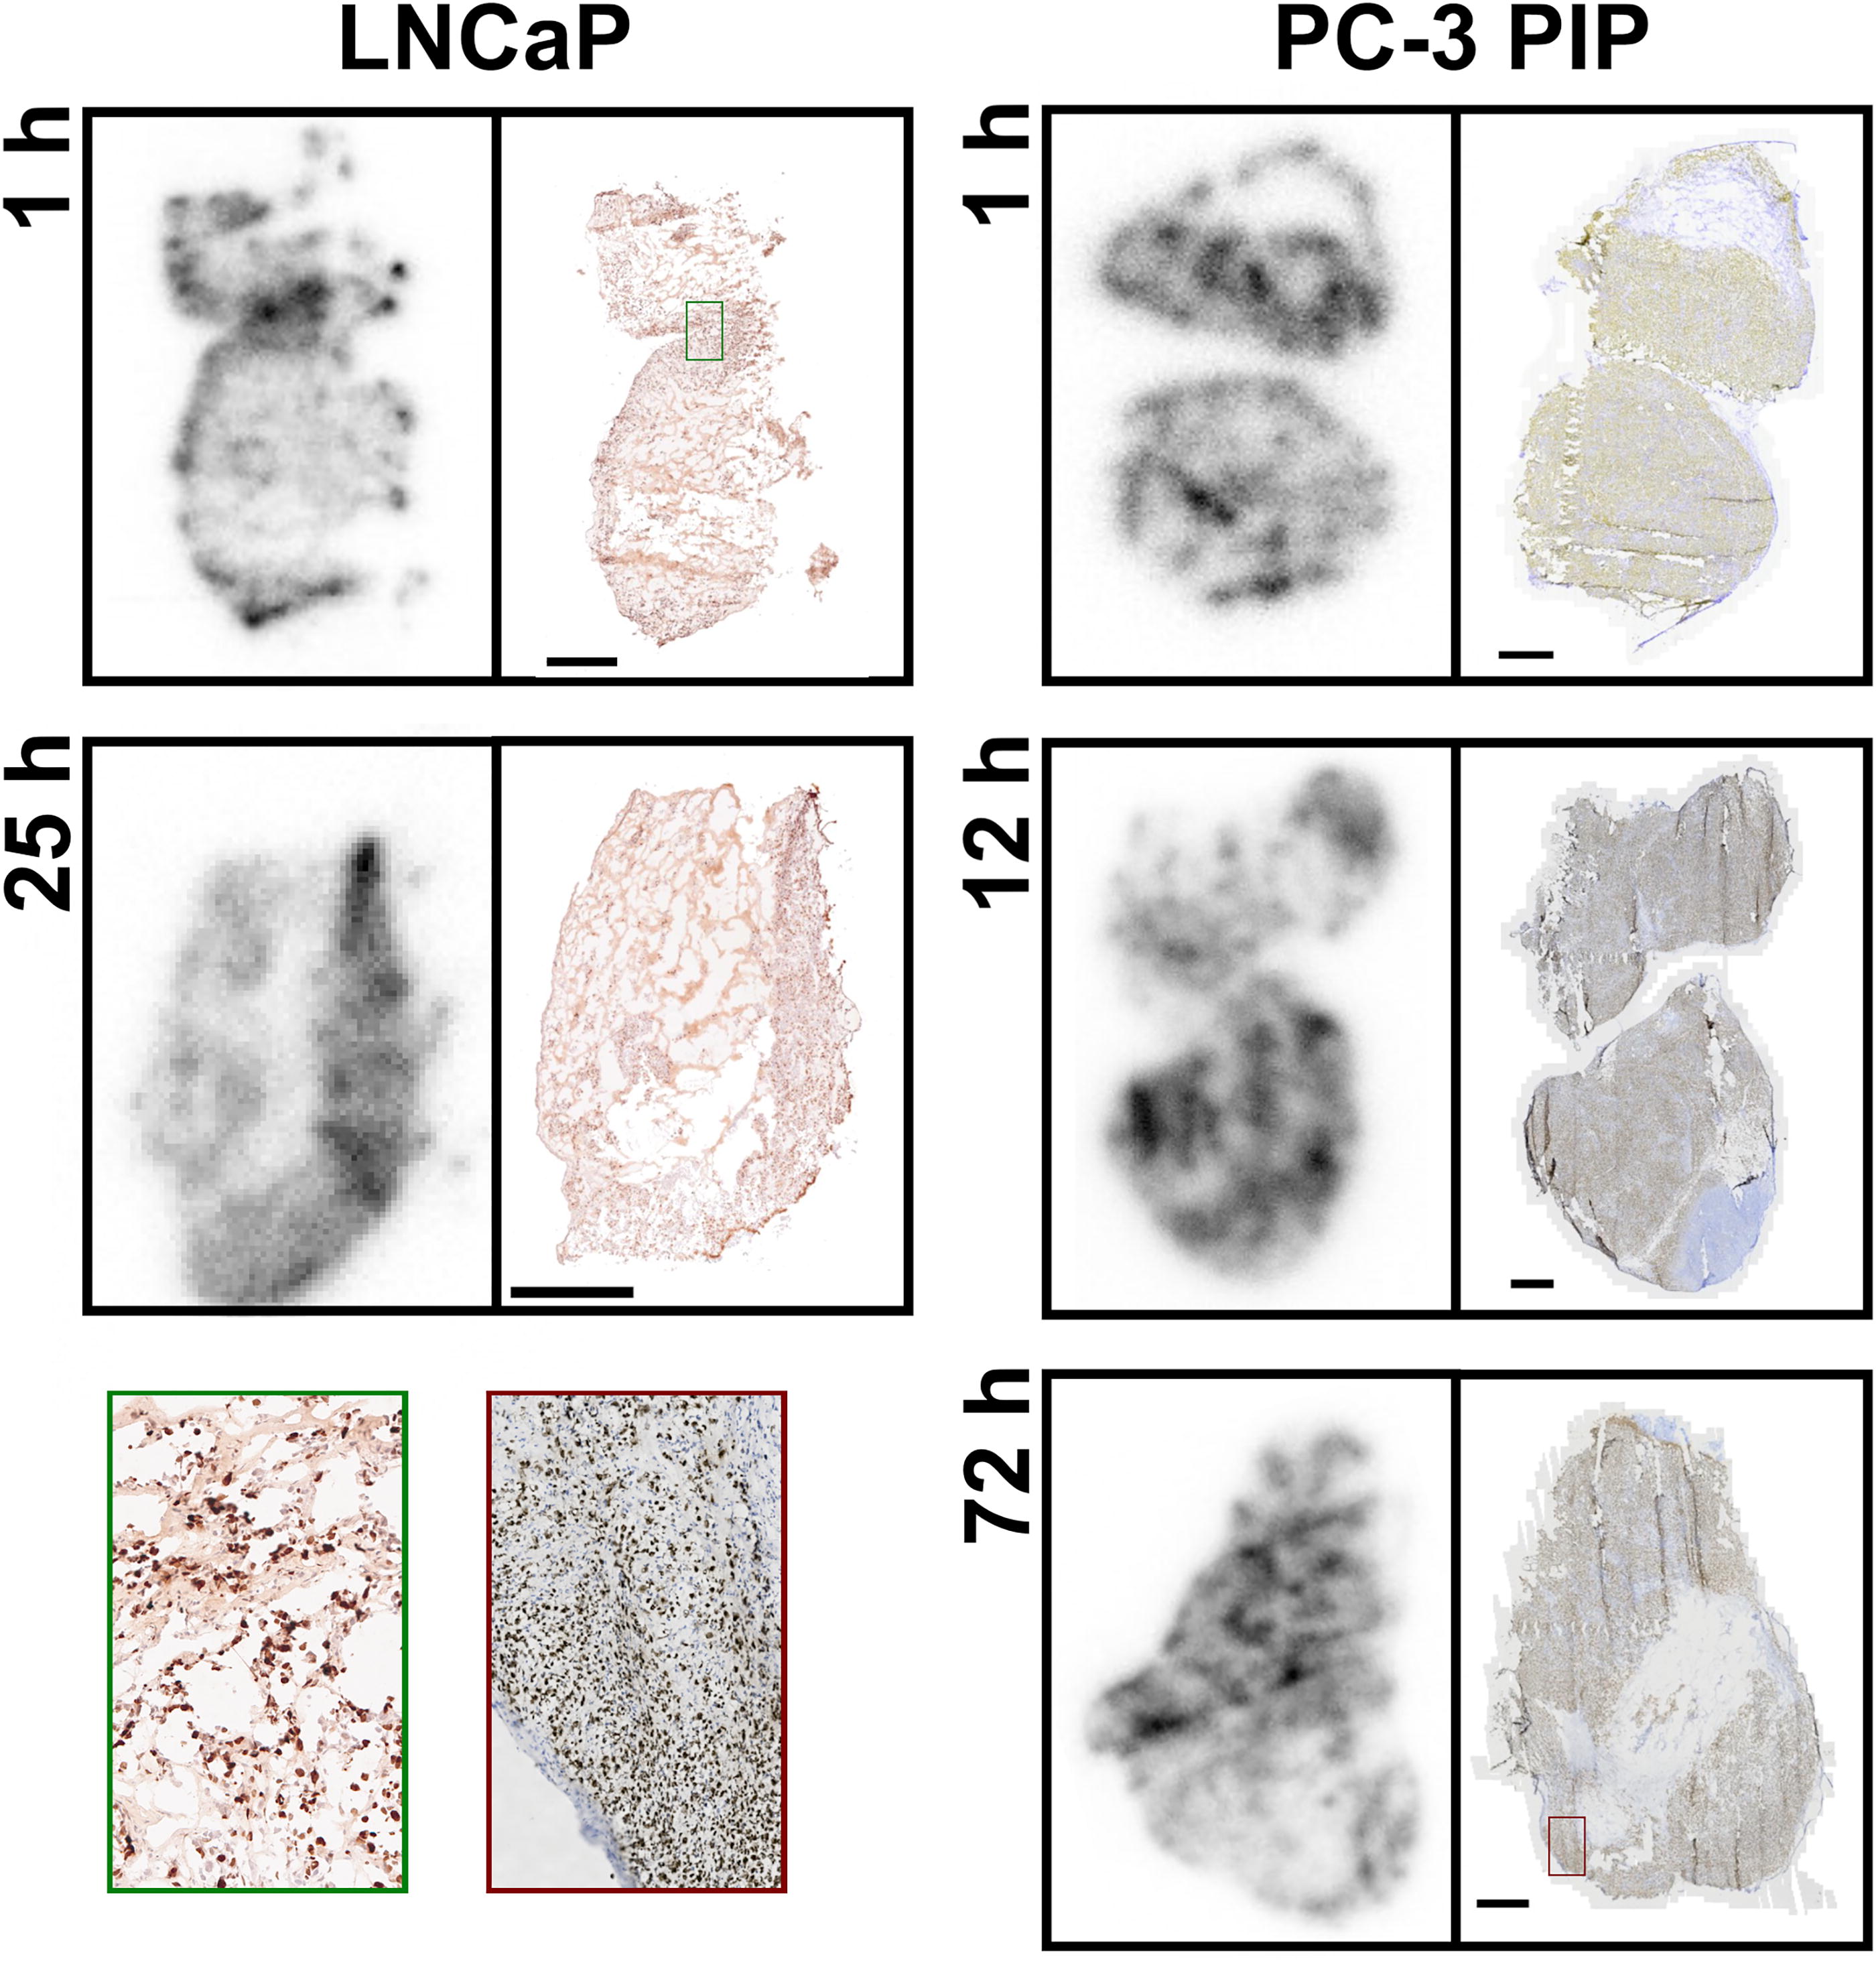
Autoradiography and Ki67. Autoradiography of [177Lu]Lu-PSMA-617 uptake (left), and IHC of the proliferative marker Ki67 in an adjacent section (right). Note 1 h p.i. with a magnified high uptake, high Ki67, area marked in green, and 72 h p.i. with a magnified low uptake, high Ki67, area marked in red. All autoradiography images are individually scaled from zero (white) to max uptake (black) in that image. Black horizontal lines represent 1 mm.
The qualitative observations are further supported by quantitative ROI analysis in PC-3 PIP tumors. These yielded statistically significant Pearson’s correlations between [177Lu]Lu-PSMA-617 relative mean uptake and Ki67 staining intensity at 1, 12, and 48 h p.i. (Table 2). The positive correlation was most pronounced at 48 h, but there was also a negative correlation, although not statistically significant, at 72 h.
Correlation Between Relative [177Lu]Lu-PSMA-617 Uptake and Fraction of Cells with Ki67 Staining in PC-3 PIP Tumor Sections
Correlation is significant at the 0.05 level (two-tailed).
ROIs, regions-of-interest.
There is a high and even expression of PSMA in the PC-3 PIP xenografts. PSMA expression and uptake in PC-3 PIP has good overlap at 1 h p.i. (Fig. 3). This relationship is the same at 12 and 24 h. However, there are now small PSMA-positive areas corresponding to low [177Lu]Lu-PSMA-617, primarily at the borders, similar to Ki67 and histology results. At 48 and 72 h p.i. increasingly areas with lower uptake have dense PSMA staining (Fig. 3).
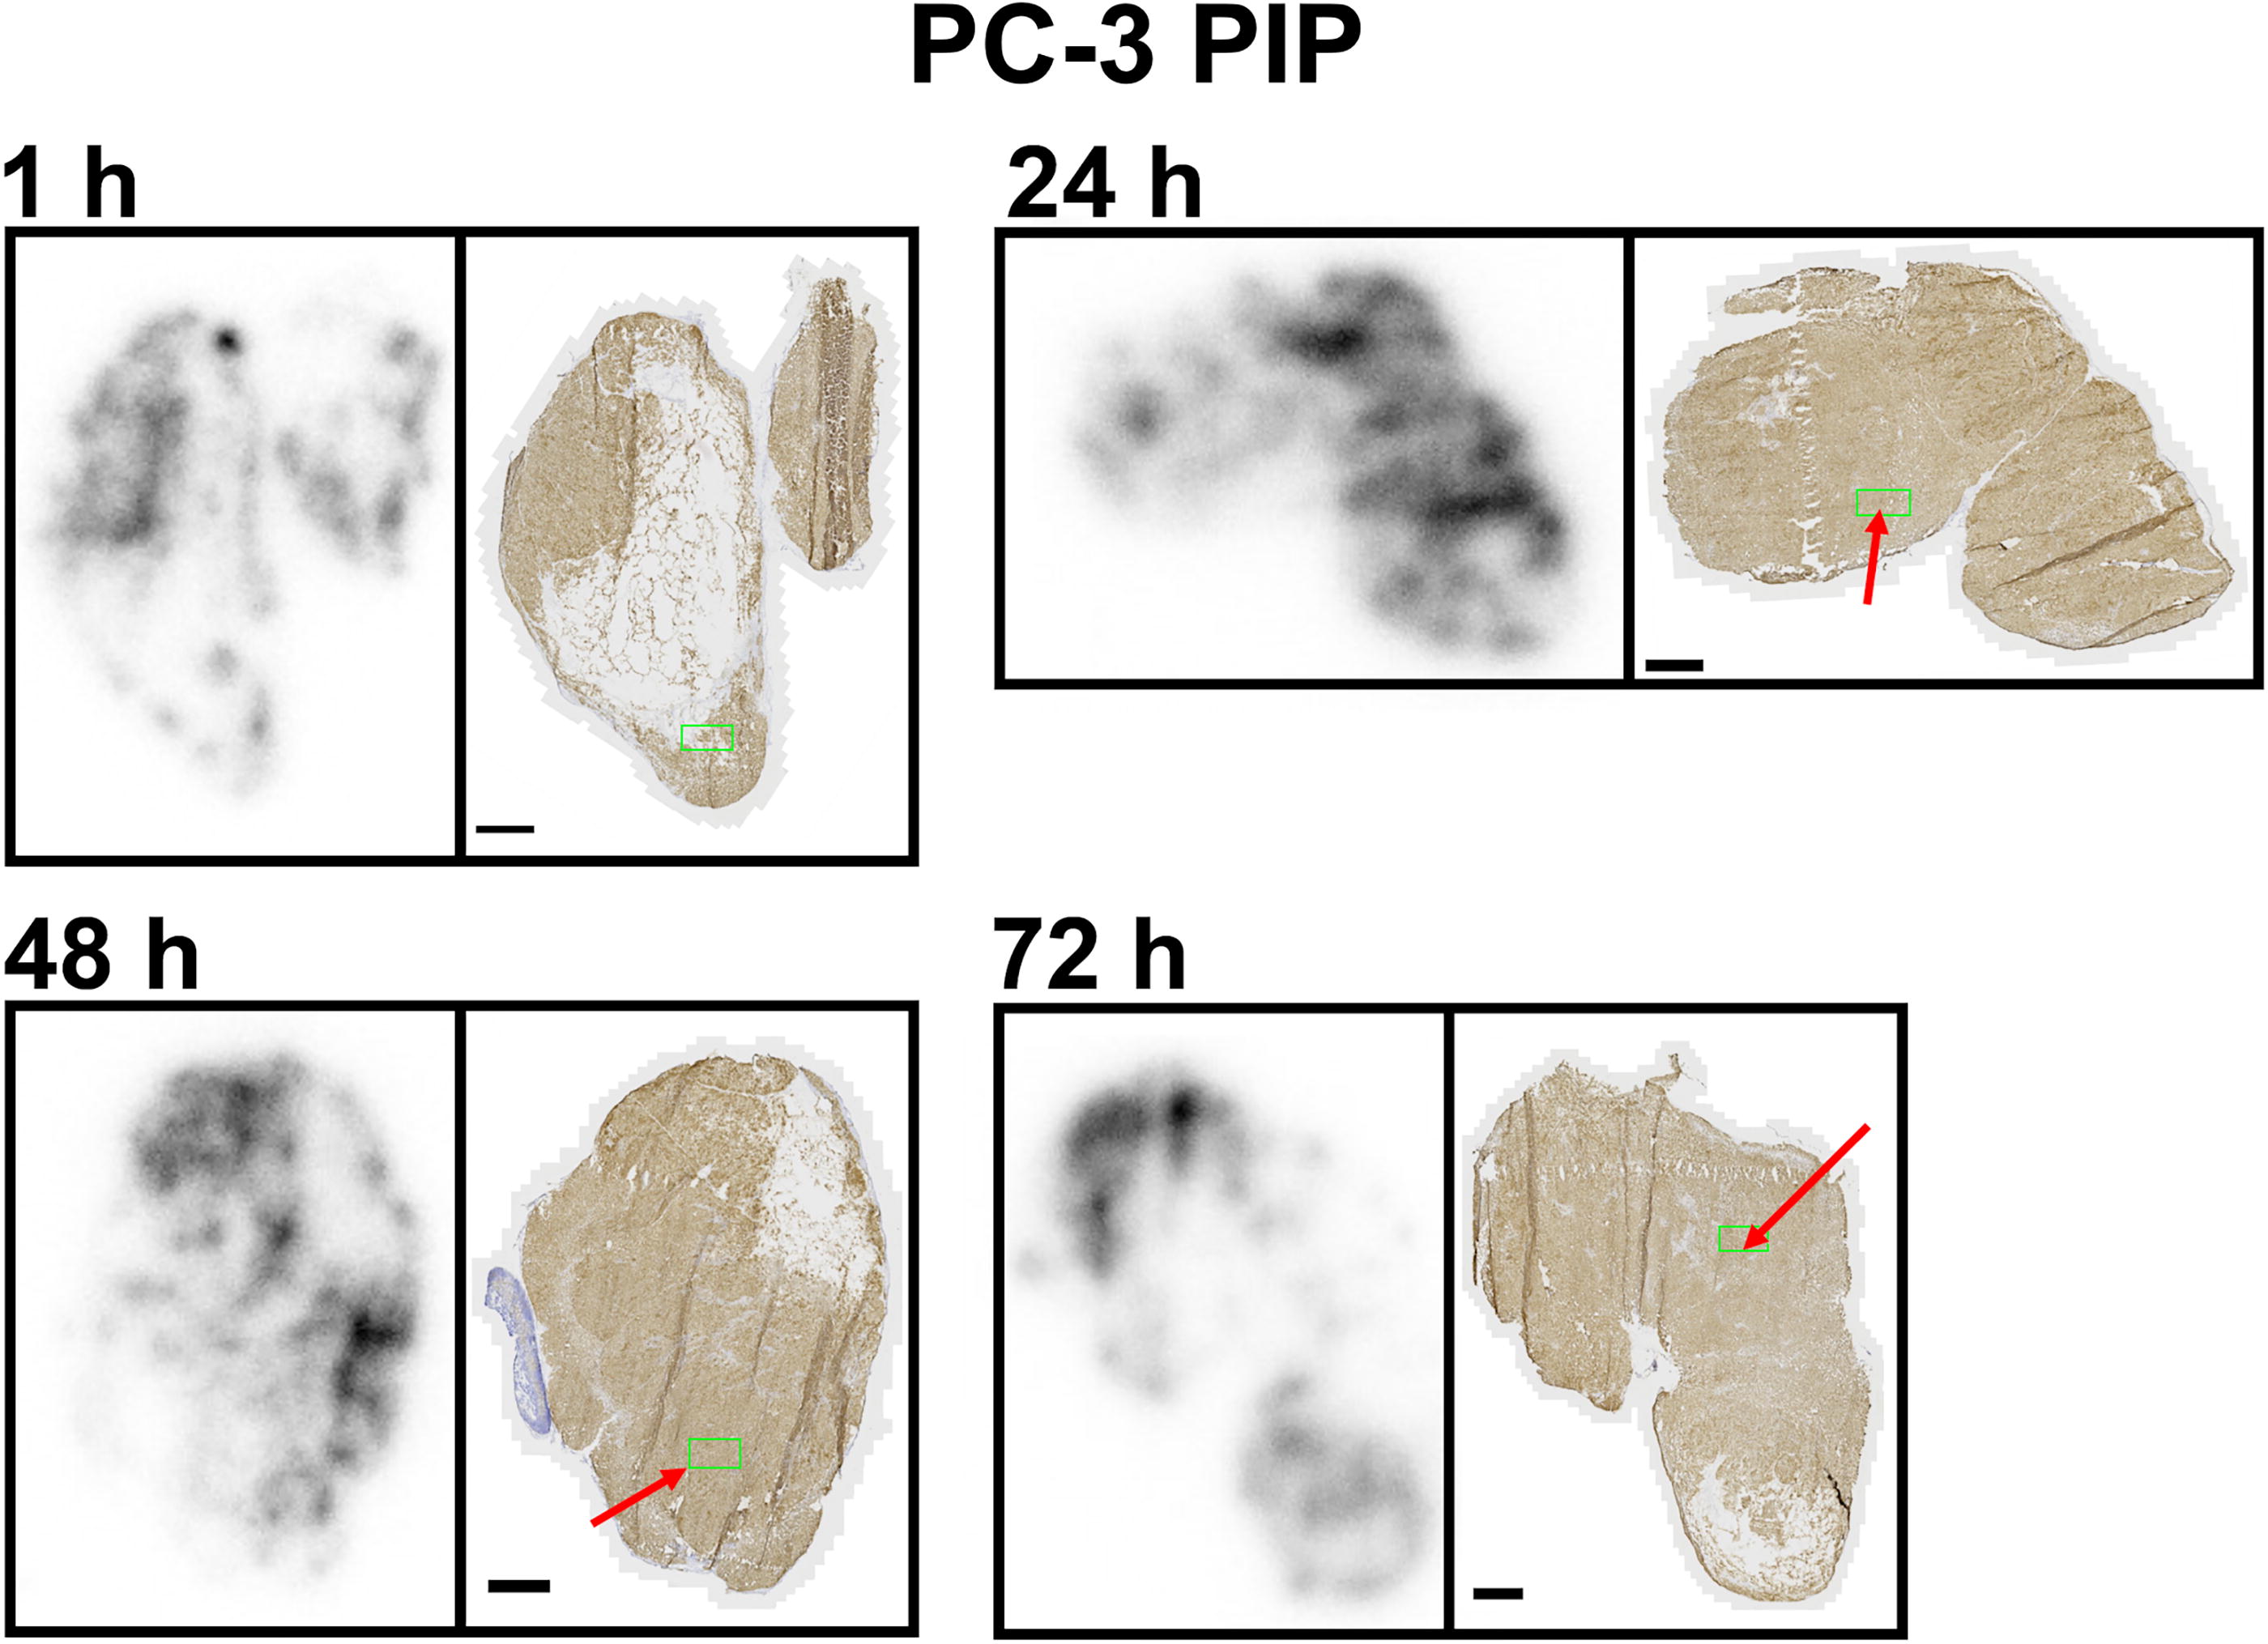
Autoradiography and PSMA. Autoradiography of [177Lu]Lu-PSMA-617 uptake (left), and IHC of the target antigen PSMA in an adjacent section (right), in PC-3 PIP xenografts. Red arrows indicate areas of PSMA expression but low [177Lu]Lu-PSMA-617 uptake. Green regions have PSMA staining quantified in Supplementary Materials. All autoradiography images are individually scaled from zero (white) to max uptake (black). Black horizontal lines represent 1 mm.
Distribution in relation to diagnostic tracers
Coinjections of [177Lu]Lu-PSMA-617 with either [18F]FDG or [18F]FCH showed that both diagnostic tracers have uptake in tumor tissue. Neither are taken up in necrotic areas and both seem to penetrate better into dense tumor tissue than PSMA-targeted agents. While [177Lu]Lu-PSMA-617 seems to track quite well with Ki67-expressing tumor cells, both [18F]FDG and [18F]FCH accumulate in areas with connective or other types of tissue and lack of tumor cells (Fig. 4). Comparing [177Lu]Lu-PSMA-617 and PSMA-targeted diagnostic tracers ([68Ga]Ga-PSMA-11 and [18F]F-PSMA-1007) we see an almost identical intratumoral distribution (Fig. 4, Supplementary Fig. S4).
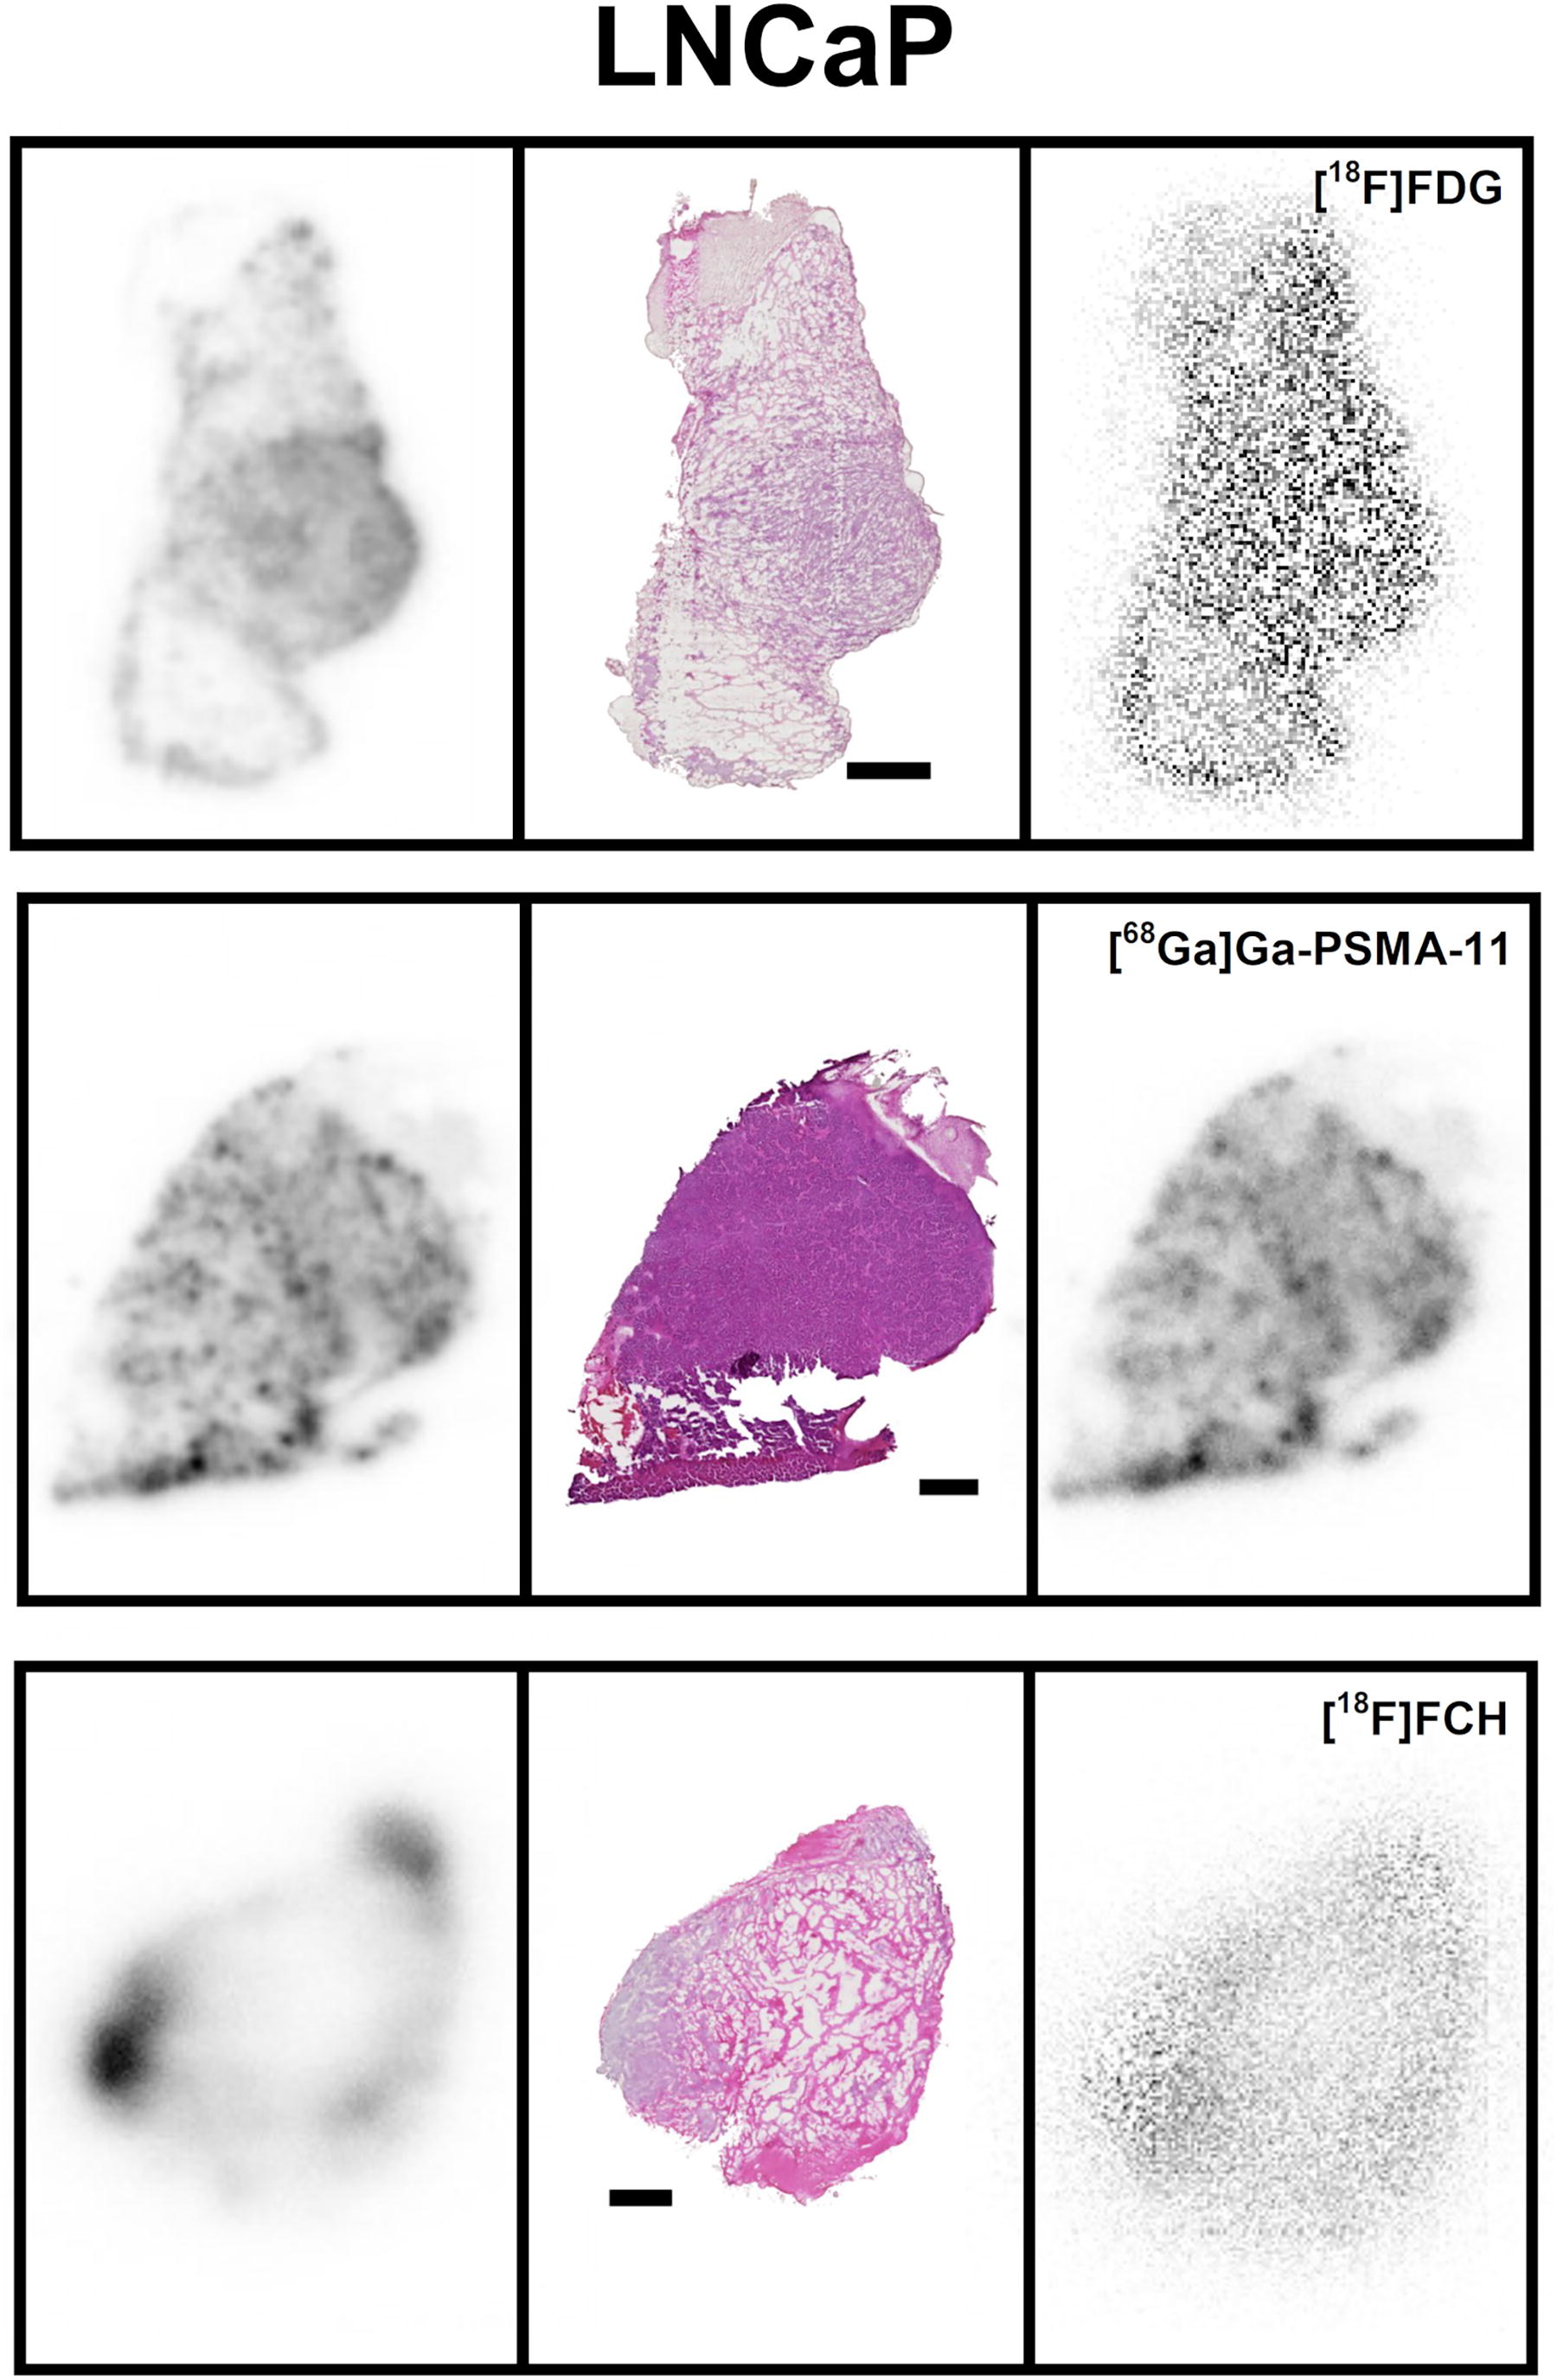
Autoradiography, histology, and diagnostic tracers. Autoradiography of [177Lu]Lu-PSMA-617 uptake (left), H&E staining of histology (middle), and autoradiography of a diagnostic tracer (right), all three images per row are of the same section. LNCaP xenografts 1 h p.i. All autoradiography images are individually scaled from zero (white) to max uptake (black) in that image. Black horizontal lines represent 1 mm.
Discussion
In this study we present the trends seen in intratumoral distribution over time for [177Lu]Lu-PSMA-617 and its colocalization with Ki67, PSMA expression, and diagnostic tracers [68Ga]Ga-PSMA-11, [18F]F-PSMA-1007, [18F]FDG, and [18F]FCH at 1 h. This was investigated in tumors with low (22Rv1), high (LNCaP), and artificially high (PC-3 PIP) PSMA expression. 25,26 Previous studies have focused on single time points and/or on PSMA-617 labeled with other radionuclides. 22,23 We found that the initial distribution of [177Lu]Lu-PSMA-617 is on the scale of hours and thereafter a slower process, affected by the therapeutic response and regrowth of the tumor, sets in. In PC-3 PIP, statistically significant positive correlations between Ki67 expression and [177Lu]Lu-PSMA-617 distribution at earlier time points, clearly trends negative from 72 h p.i. and onwards. Although not statistically significant, it indicates a window of therapeutic effect approximately before 72 h p.i. if we can generalize these PC3-PIP results. At 72 h there are, however, already small areas containing viable cells and low [177Lu]Lu-PSMA-617 uptake, and heavily treated LNCaP tumors contain pockets of regrowth at 2 or 3 weeks p.i. A negative correlation is also found between Ki67 expression and [177Lu]Lu-PSMA-617 at 2–3 weeks for LNCaP xenografts. These results, showing areas of regrowth, is in line with our recent research on externally irradiated LNCaP xenografts, which pointed toward reinitiation of proliferation prior to relapse being visible in tumor volume measurements. 32 We find it implausible that apparent regrowth should be initially nontargeted areas that have later started expressing PSMA due to paracrine signaling from other cells. Such induced expression have only been shown in umbilical vein endothelial cells, 33 and results in our previous studies show that, for example, for PC-3 PIP cells, we have PSMA expression across the whole tumor absent any therapy. 34
Wang et al. 35 has performed autoradiography on samples from patients after radioguided surgery of primary PCa 18 h p.i. of [99mTc]Tc-PSMA-I&S. They found a heterogeneous distribution of PSMA expression and radioligand uptake. Although PC-3 PIP is a model with high PSMA expression, and, for example, the distribution could differ in orthotopic xenografts with higher perfusion, 36 our data reveal a similar correlation between PSMA expression and radioligand as seen by Wang et al. 35 In Supplementary Figure S5 the connection between uptake, histology, and PSMA and Ki67 expression at early and late time points in PC-3 PIP tumors is displayed. When staining for PSMA, we see areas expressing the target antigen but with low uptake already at 24 h p.i., and increasingly so with time. This PSMA expression indicates that PSMA-targeted diagnostic tracers could be used to reveal parts of the tumor that would require repeated RPT to be treated. We show that the intratumoral distribution of PSMA-targeted diagnostic tracers match well with that of [177Lu]Lu-PSMA-617, whereas [18F]FDG and [18F]FCH are located in both tumor, connective, or other nontumor tissue. It is known that the more disease-specific PSMA-targeted tracers outperform [18F]FDG and [18F]FCH in PCa imaging. 37 Our results indicate that this is true also on the small scale. The observed slightly better penetration of [18F]FDG and [18F]FCH into densely packed areas of tumor cells compared with PSMA-targeted agents could be due to smaller molecular size. RPT is given in several fractions 38 as the injected activity is limited by acute hematotoxicity. Imaging agents such as [68Ga]Ga-PSMA-11 and [18F]F-PSMA-1007 could therefore potentially help optimize the timing of these fractions. A limitation is that we have used preclinical xenografts, not patient material, and observations of tumor regrowth in mice cannot be directly translated into clinical recommendations. 39 The benefit of this approach, however, is that we have been able to study intratumoral distribution of 177Lu]Lu-PSMA-617 at several different time points in the range of hours, days, and weeks after administration.
We injected activities of [177Lu]Lu-PSMA-617 to hit count rates at the time of imaging within the limitations of the autoradiography system. It is, however, well known that the mole amount of tracer injected will affect the uptake and saturation of the tumor. Our general observations still appear consistent over the ranges of amount of injected tracer, and still hold when, for example, examining only the PC-3 PIP data with a smaller activity range. Another limitation of this study is that the PSMA IHC method was only available to us for the PC-3 PIP xenografts, which have an engineered expression of PSMA. 40 However, expression is not much higher than for LNCaP and the results are in line with other published studies 26,35 When coinjecting [177Lu]Lu-PSMA-617 and PSMA-targeted diagnostic tracers, they could affect each other’s uptake and distribution. Still, we saw no changes in the general pattern of [177Lu]Lu-PSMA-617 uptake in those cases.
For RPT, the absorbed dose must be characterized on the scale of the path length of the radionuclide emission, mm for β− and µm for α-emitters. 41 Calculation of the true absorbed dose requires knowledge of the intratumoral distribution of radioactivity, which in vivo gamma cameras and SPECT systems do not provide. 42 Autoradiography of preclinical models is a method to bridge this gap in knowledge to characterize the intratumoral distribution of a radioligand and use this information to help explain the biological effects of absorbed dose in patient tumors. 43,44 The sizes and location of the tumor, the injected activity per mass, and general biology will differ between human patients and animal models, which is why the useful knowledge here is of the more general character, for example, relative intratumoral distribution, rather than precise activity uptake, etc. These relative intratumoral distributions can then be used in models of the disease to, for example, calculate tumor control probability for different injected activites. 45
Conclusions
Our data show the temporal changes in [177Lu]Lu-PSMA-617 intratumoral localization in PCa xenografts over time up to 3 weeks postadministration. These data indicate a timeframe for the uptake, therapeutic, and regrowth phases of [177Lu]Lu-PSMA-617, all with different distribution patterns. We also show that PSMA-targeted diagnostic tracers, [68Ga]Ga-PSMA-11 and [18F]F-PSMA-1007, distribute identically intratumorally to [177Lu]Lu-PSMA-617, whereas both [18F]FDG and [18F]FCH have a less similar distribution.
Footnotes
Acknowledgments
The authors thank Bo Holmqvist and ImaGene-iT AB for immunolabeling of PSMA. The authors also thank the Lund University BioImaging Center for providing space and experimental resources. The authors thank Sven-Erik Strand for valuable advice.
Ethics Approval
All experiments were conducted in accordance with relevant guidelines and regulations. The approval for the study was given by the Malmö/Lund Animal Experimentation Ethics Committee at the Lund District Court (Dnr: 04350–2020 with the addition Dnr 5.8.18–07300/2021). The study was carried out in compliance with the ARRIVE guidelines.
Authors’ Contributions
J.S., M.A., W.Z., A.K., and J.C.: Methodology, investigation, resources, and writing—original draft. A.O. and O.V.T.: Methodology, investigation, resources, writing—original draft, conceptualization, software, validation, writing—review and editing, visualization, supervision, project administration, and funding acquisition.
Disclosure Statement
The authors have no relevant financial or nonfinancial interests to disclose.
Funding Information
This study was performed with support from The Prostate Cancer Association and Mrs. Berta Kamprad’s Foundation.
Supplementary Material
Supplementary Data S1
Supplementary Figure S1
Supplementary Figure S2
Supplementary Figure S3
Supplementary Figure S4
Supplementary Figure S5
Supplementary Figure S6
References
Supplementary Material
Please find the following supplemental material available below.
For Open Access articles published under a Creative Commons License, all supplemental material carries the same license as the article it is associated with.
For non-Open Access articles published, all supplemental material carries a non-exclusive license, and permission requests for re-use of supplemental material or any part of supplemental material shall be sent directly to the copyright owner as specified in the copyright notice associated with the article.