




Abstract
Purpose:
To evaluate the use of yttrium-90 (90Y) dosimetry in predicting treatment outcomes when used following transarterial radioembolization with SIR-Spheres® (Resin 90Y) in patients with hepatic tumors.
Materials and Methods:
This single institution retrospective analysis included 100 patients with hepatocellular carcinoma, colorectal carcinoma or other liver metastases who underwent transarterial radioembolization with resin 90Y and had imaging follow-up within one year of treatment. Mean tumor dose and mean dose to nontumor was calculated using voxel-based dosimetry software. Descriptive statistics were reported and methods of analyses included simple and multivariable linear regression, contingency table analyses, Kaplan−Meier estimation, and Cox proportional hazards models.
Results:
Of 100 patients included, 65 demonstrated tumor shrinkage following transarterial radioembolization. Of these, 20 (30.8%) had hepatocellular carcinoma, 22 (33.8%) had colorectal carcinoma, and 23 (35.4%) had other types of metastases. There was an association between tumor shrinkage and mean tumor dose (p = 0.0285) and mean dose to nontumor (p = 0.0028) in hepatocellular carcinoma patients, but not colorectal carcinoma, or the other subgroup. For all 100 patients, time to death and mean tumor dose was associated only in the other subgroup (p = 0.0260), but not in the hepatocellular or colorectal carcinoma groups. Time to death and mean dose to nontumor was associated in hepatocellular carcinoma patients (p = 0.0421), but not the colorectal carcinoma or other subgroup.
Conclusions:
Voxel-based dosimetry assessment is a tool that may be utilized to assist in predicting treatment outcomes in responders to transarterial radioembolization.
Introduction
Transarterial radioembolization (TARE) is a treatment for unresectable liver tumors from primary hepatocellular carcinoma (HCC) and hepatic metastases. Treatment goals include slowing the progression of tumor growth, increasing survival, downsizing tumors, and providing symptomatic relief. 1 Surgical resection is possible in less than 20% with hepatic tumors, making advancements in TARE therapy paramount. 2
Liver tissue is sensitive to the harmful effects of ionizing radiation, resulting in suboptimal outcomes with external beam radiation. 3 TARE can deliver radiation to the cancer site with limited exposure to healthy liver parenchyma. Pretreatment dose prescription assessment for 90Y TARE is most accurately calculated using a personalized partition model, which utilizes technetium (Tc)−99m labeled macroaggregated albumin (MAA) as a surrogate for 90Y. 4 This has demonstrated greater clinical utility compared to the body surface area method in its correlation with tumor-to-normal liver ratios (TNRs) and percent of tumor involvement. 5 MAA mapping aids in calculating the 90Y dose to reach therapeutic levels. 3 MAA is not a perfect surrogate for 90Y, meaning alternative methods to assess the dose delivered to the tumor and surrounding parenchyma in the immediate post-treatment period is warranted.
There is not an agreed method by which absorbed 90Y is calculated following TARE. Instead, treatment outcomes are measured by imaging weeks to months following treatment and compared to baseline imaging according to guidelines for evaluation of tumor response such as mRECIST or RECIST 1.1. 6 –9 Although this evaluation is useful in long-term management, it delays the opportunity for immediate rectification of delivered radiation. Voxel-based dosimetry assessment software attempts to address this issue by utilizing post-treatment Bremsstrahlung emission computerized tomography (BECT) to calculate the dose of 90Y absorbed by the tumor and liver parenchyma. Dosimetry assessment offers the potential for the physician to repeat TARE if the therapeutic dose was not achieved.
This study aimed to evaluate the use of dosimetry software in predicting treatment outcomes when used in the post-treatment 3D dosimetry assessment following 90Y TARE in patients receiving resin 90Y with primary HCC or hepatic metastases. 10 The primary outcome was whether an association exists between the dosimetry assessment and tumor response. Secondary outcomes included whether an association exists between software dosimetry assessments and patient survival and damage to healthy liver parenchyma.
Materials and Methods
Study design and patient population
Institutional Review Board (IRB) approval was obtained and this study was conducted in compliance with institutional and national research ethics standards. This single center retrospective cohort study included patients who were 18 years or older, diagnosed with HCC or liver metastases, underwent TARE with resin 90Y SIR-Spheres® between June 2015 and May 2019, and had pretreatment and at least one post-treatment CT or MRI imaging available. Patients were excluded from the study if they: received transarterial chemoembolization (TACE) or microwave ablation (MWA) for the lesion of interest before TARE, had missing treatment data or imaging records, underwent split-dose treatment (i.e., 90Y delivered in multiple infusions), or had complex lesions that could not be measured using RECIST 1.1 or mRECIST guidelines.
Clinical data collection
Patient demographics, clinical characteristics, and treatment history were collected and managed using Research Electronic Data Capture. 11 The data collected included age, gender, ethnicity, race, BMI, date of diagnosis, primary pathology, presence of chronic liver disease, prior local or systemic treatment, and Eastern Cooperative Oncology Group (ECOG) status. 12 Laboratory values were collected along with dialysis and encephalopathy status from the closest time point prior to treatment and the closest time point at one-year post-treatment. The treatment information included date of treatment, lobe treated, percent lung shunting, prescribed activity (GBq), received activity (GBq), activity delivered (GBq and %), and residual activity in delivery apparatus (GBq). Patient outcomes included post-treatment hepatic resection, TACE, MWA, date of last contact, and date of death.
Response assessment
Imaging assessments were completed using Picture Archiving and Communications System (PACS). 13 If a patient had multiple hepatic lesions, the largest was identified as the target. If the target lesion had received prior MWA or TACE, the next largest lesion was selected. The involved liver segment(s) was recorded, and TARE treatment(s) were identified for subsequent longitudinal analysis by dosimetry software where patients had multiple treatments on the target lesion. For each baseline and follow-up image, these variables were recorded: date of scan, imaging modality, percentage of liver replaced by tumor, presence of bilobar disease, presence of vascular invasion, presence of extrahepatic involvement, severity of ascites, and three dimensions for volumetric calculations.
Tumor shrinkage was evaluated according to mRECIST criteria (for HCC) or RECIST 1.1 (for nonHCC), 7,9 which defines shrinkage as at least a 30% decrease in the sum of diameters of viable (enhancing) target lesions, taking the baseline sum of diameters as the reference. Complete shrinkage was defined as the disappearance of any intratumoral arterial enhancement in all target lesions.
Dosimetric analysis
Radiation dosimetry assessment was conducted using Varian Velocity 4.0 RapidSphere™ software. Baseline CT or MRI imaging and immediate post-treatment 90Y Bremsstrahlung SPECT-CT (BECT) were imported into the software. Liver and tumor margins were defined on the baseline images using the software’s contouring function, which filled liver and tumor volumes based on defined margins. Baseline liver margins were utilized to register the baseline images with the BECT images, and tumor margins and volume were transferred from the baseline to the BECT images. The rationale for performing imaging registration and tumor propagation was related to the poor resolution of BECT images, which prevents direct visualization of the tumor. The liver margins on the BECT images were subsequently defined and the volumes filled utilizing the contouring function. The propagated tumor volume and defined liver volume on the BECT images were used to run the dosimetry assessment. Received activity and percent lung shunting were defined as input entities for software calculations. The software’s dosimetry assessment outputs included a heat map denoting radiation dose distribution within the liver volume, a dose volume histogram comparing lesion and liver, and the minimum, mean, and maximum radiation dose absorbed by the lesion and liver (Fig. 1).

Dosimetry assessment output data.
Statistical analysis
Descriptive statistics were reported using means and standard deviation for continuous variables and frequency counts for categorical variables. Simple and multiple linear regression models were used to study the relationship between outcomes and predictors. In case of multiple linear regression, models with interaction effects and higher order quadratic terms were tried and the results from the most parsimonious models were reported. The Kaplan−Meier estimation method was used to generate survival curves for modeling time to death using a logrank test. A semiparametric Cox proportional hazards model was used to study the effect of mean dose to tumor and time to death. Regression diagnostic checks included assessing the normality of residuals for simple and multiple linear regression, and separately, the plot of Schoenfeld residuals (for continuous covariates) and log−log survival plots (for categorical covariates) for testing the proportional hazards assumption in the Cox model. TNR were calculated using Young et al.’s formula: treated lesion mean absorbed tumor dose divided by mean dose to nontumor tissue. 14 Model for end stage liver disease (MELD) scores were calculated using the Organ Procurement and Transplantation Network (OPTN) policy. 15 A Pearson’s correlation coefficient was used to assess the correlation between MELD scores versus mean dose to nontumor (MNTD). In addition, exploratory methods of analyses included the use of contingency tables, one way analysis of variance, and Kruskal−Wallis test. All analyses were done using the SAS 9.4 software and statistical significance was assessed at the 5% level of significance.
Results
Patient, treatment, and imaging characteristics are summarized in Tables 1 − 3. There was no evidence that after adjusting for age and gender, the association between shrinkage percent and mean tumor dose (MTD) changed by tumor type (p = 0.4106). Additionally, the distribution of tumor shrinkage for all 100 subjects did not differ by tumor type (p = 0.9867) nor when adjusted to include only the 65 that showed shrinkage (p = 0.3439).
Demographics and Medical History at Baseline (n = 100)
Chronic liver disease percentages do not sum to 100% as some patients had concomitant conditions.
BMI, body mass index; ECOG, Eastern Cooperative Oncology Group; MELD, model for end stage liver disease.
90Y TARE Treatment Information
Liver segment percentages do not sum to 100% as some patients had multiple segments involved.
SD, standard deviation; TARE, transarterial radioembolization; 90Y, yttrium-90.
Baseline and Follow-Up Imaging Assessments
CR, complete response; PR, partial response; PD, progressive disease; SD, stable disease; SD, standard deviation.
Table 4 outlines tumor response by dosimetry assessments for each cancer subtype. There was no statistically significant difference in MTD means across the three disease subgroups (p = 0.4445). There was also no statistically significant difference in all patients or in any disease subgroup.
Tumor Response and Dosimetry Assessments
One image assessment is missing.
One extreme outlier was removed.
CR, complete response; CRC, colorectal carcinoma; HCC, hepatocellular carcinoma; MNTD, mean dose to nontumor; MTD, mean tumor dose; PR, partial response; PD, progressive disease; SD, stable disease; SD, standard deviation; TNR, tumor-to-normal liver ratios.
There was no statistically significant difference in MNTD across the three disease subgroups (p = 0.8966). The only subgroup to show a statistically significant difference was in the 28 patients with HCC, where MNTD for the complete response (CR)/partial response (PR) group (mean 34.3, standard deviation [SD] 13.2) was different than MNTD for the stable disease (SD)/progressive disease (PD) group (mean 24.9, SD = 9.9) (p = 0.0405). There was no statistically significant difference in TNR across the three disease subgroups (p = 0.2093). There was also no statistically significant difference in TNR overall nor in any subgroup.
Of the 100 patients included, 65 showed tumor shrinkage following treatment with a mean tumor volume reduction of 48.5% (SD = 29.2). There was an association between shrinkage and MTD in the 65 responders (p = 0.0346). After adjusting for age, gender, and tumor type, the association between shrinkage and MTD was still statistically significant (p = 0.0479).
Table 5 outlines tumor shrinkage by dosimetry assessments for each cancer subtype. When looking at patients with shrinkage, there was an association between MTD and shrinkage (p = 0.0360). When looking at subgroups, 20 patients with HCC showed an association between MTD and shrinkage (p = 0.0285). For every 50 unit increase in mean dose absorbed by tumor, tumor volume reduced 20.2%. There was no association in colorectal carcinoma (CRC) or the other subgroup (Fig. 2).
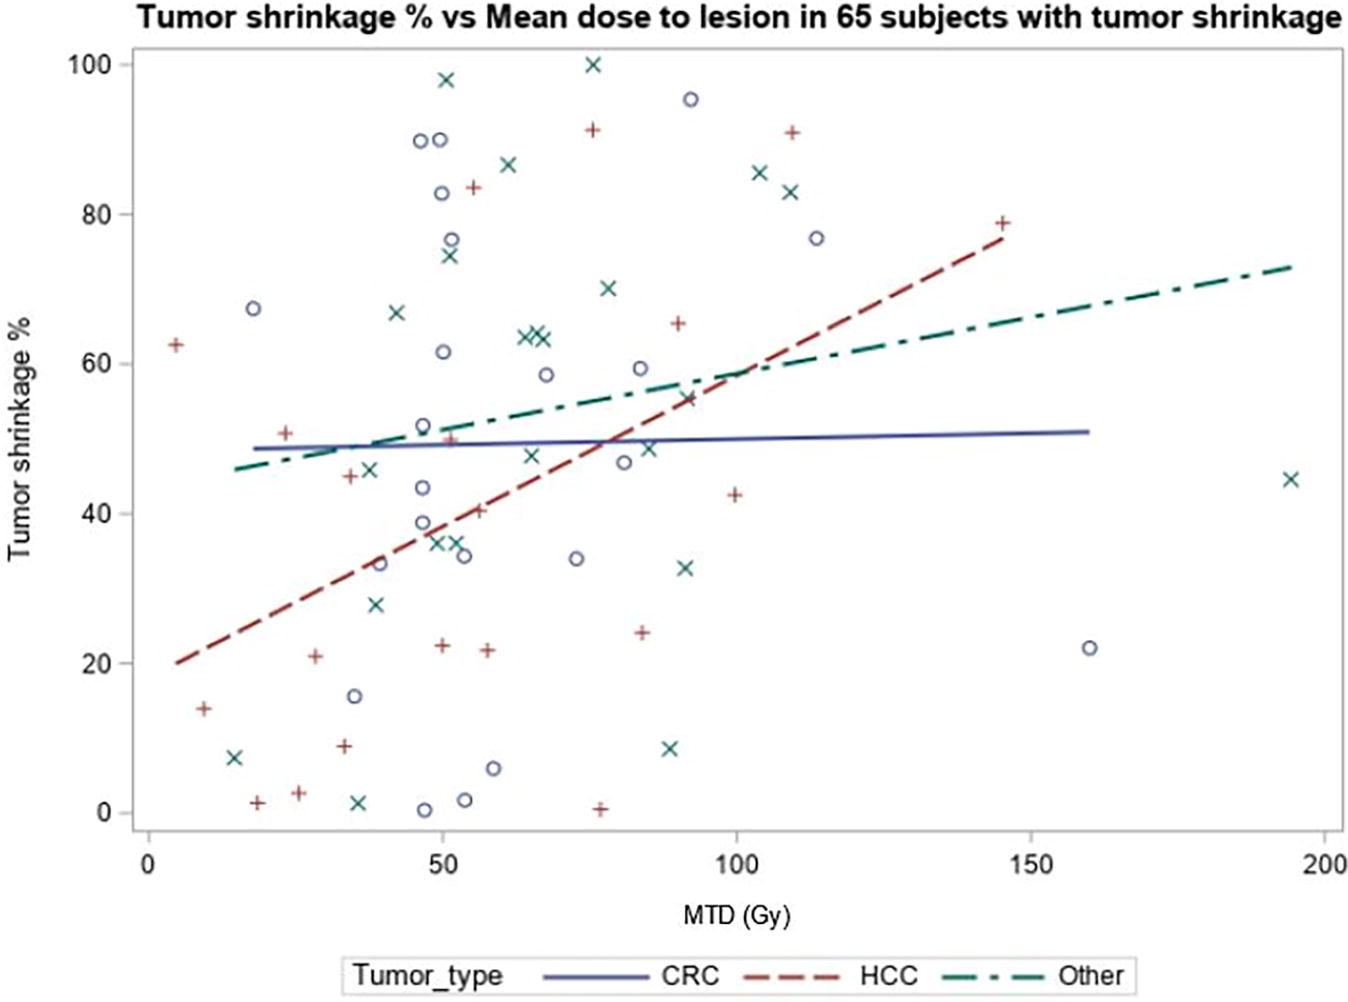
Scatterplot showing association between tumor shrinkage and MTD in CRC, HCC, and other type of cancers. There was no association between CRC and other types of cancer, but there was a statistically significant association between tumor shrinkage and MTD in HCC patients (p = 0.0285). CRC, colorectal carcinoma; HCC, hepatocellular carcinoma; MTD, mean tumor dose.
Tumor Shrinkage and Dosimetry Assessments by Cancer Subtype
CRC, colorectal carcinoma; HCC, hepatocellular carcinoma; MNTD, mean dose to nontumor; MTD, mean tumor dose; SD, standard deviation; TNR, tumor-to-normal liver ratio.
After adjusting for age, gender, and tumor type, the association between shrinkage and MNTD was statistically significant (p = 0.0014). After adjusting for age and gender, for every 10 unit increase in MNTD, expected tumor shrinkage increased by 11.0%. No other multivariate analyses among age, gender, and tumor type were statistically significant. Additionally, MTD and MNTD were moderately correlated with a correlation coefficient of 0.42 (p < 0.0001).
There was an association between MNTD and shrinkage when looking at all shrinkage patients (p = 0.0009). For the 20 patients with HCC who experienced tumor shrinkage, there was also an association between MNTD and shrinkage (p = 0.0028). For every 10 unit increase in mean dose absorbed by the nontumor, tumor shrinkage increased 18.1%. There was no association in CRC or the other subgroup (Fig. 3). There was no association between TNR and shrinkage for all patients nor for any subgroup.

Scatterplot showing association between tumor shrinkage and MNTD in CRC, HCC, and other type of cancers. There was no association between CRC and other types of cancer, but there was a statistically significant association between tumor shrinkage and MNTD in HCC patients (p = 0.0028). CRC, colorectal carcinoma; HCC, hepatocellular carcinoma; MNTD, mean dose to nontumor.
Post-treatment laboratory values were strongly associated with historical laboratory values. After adjusting for historical laboratory values, there was no association between any post-treatment laboratory values and MNTD. The same was true for Child-Pugh scores (rho = −0.225, p = 0.0717). MELD scores, however, were negatively correlated with MNTD (r = −0.277, p = 0.0254) (Fig. 4).

Scatter plot showing correlation between MNTD and MELD scores. MNTD, mean dose to nontumor; MELD, model for end stage liver disease.
Seventy-six patients died during the study period. Survival analysis from time of diagnosis to death showed a median time to death of 747 d (2.05 years). There was no association between time to death and tumor type for all 100 (p = 0.3111) (Fig. 5), nor for the 65 alone that showed shrinkage (0.1742) (Fig. 6).

Kaplan−Meier plot by tumor type for all 100 subjects. There was no association between time to death and tumor type.
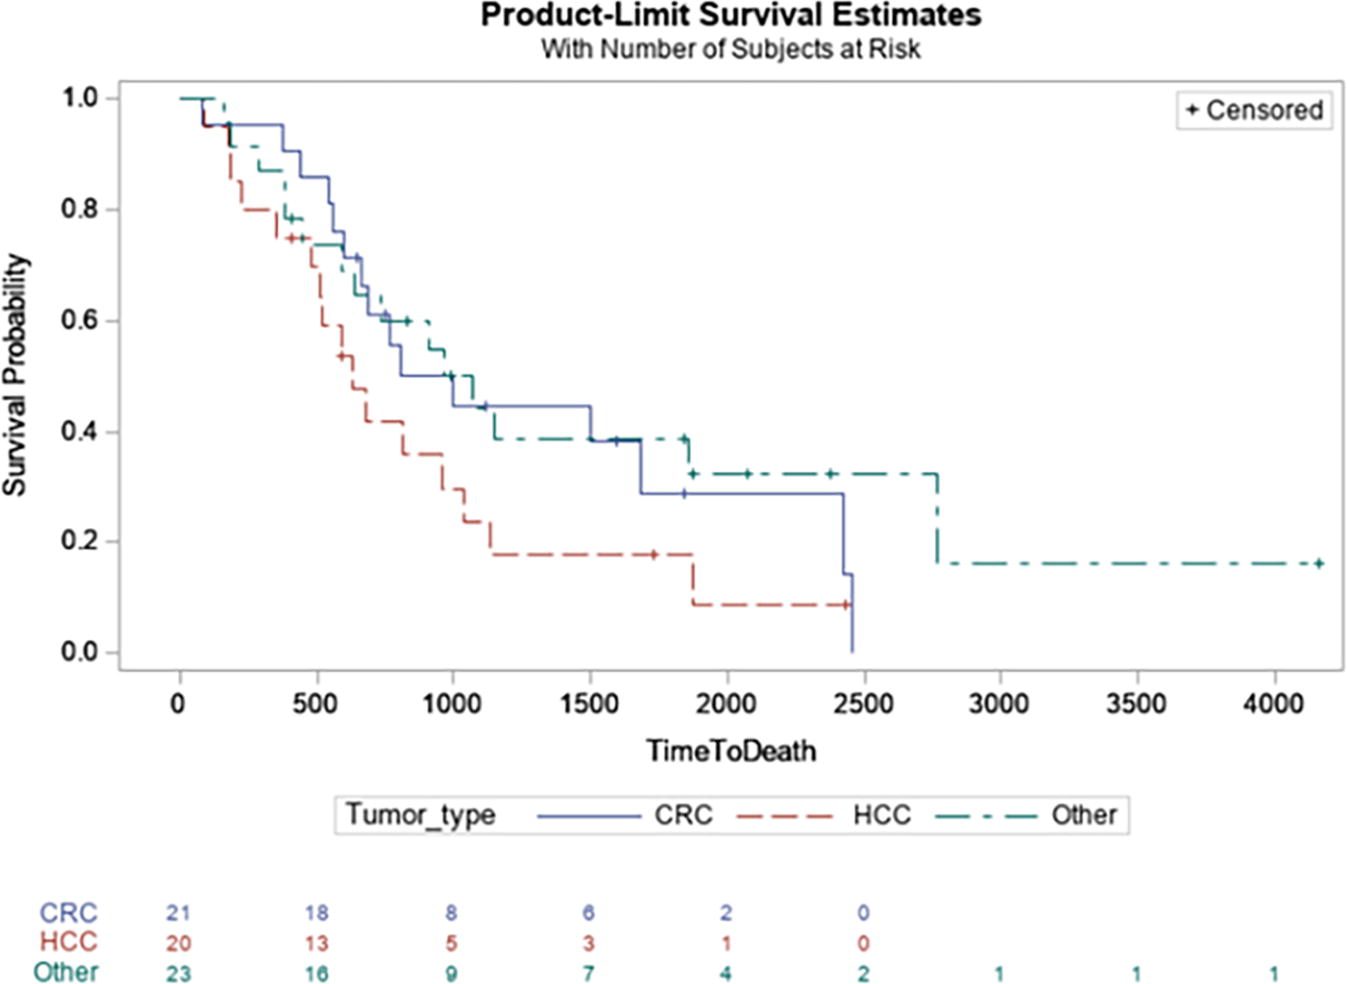
Kaplan−Meier plot by tumor type for 65 subjects that showed tumor shrinkage. There was no association between time to death and tumor type.
There was no association between time to death and MTD in HCC patients (p = 0.1351), nor CRC patients (p = 0.2512). There was an association however, between time to death and MTD in the other subgroup (p = 0.0260). For every 50 unit increase in radiation dose absorbed by the tumor, instantaneous risk of death decreased by 53.0%. There was an association between time to death and MNTD in HCC patients (p = 0.0421). For every 10 unit increase in radiation dose absorbed by the nontumor, death decreased by 37.6%. There was no association between time to death and MNTD in CRC patients (p = 0.9915), nor other patients (p = 0.2954). There was no association between time to death and TNR in HCC (p = 0.6949), CRC (p = 0.1671) nor TNR patients (p = 0.1064).
Discussion
This study found tumor response and MTD were not associated in any disease subgroup. The same was true for TNR. The only associated outcome with tumor response was MNTD in the HCC group. This study also found an association in responders with HCC between MTD and shrinkage and MNTD and shrinkage. Toxicity showed an association only between MELD and MNTD. Lastly, time to death and MTD were associated in the other cancer subtypes and time to death and MNTD were associated in HCC patients.
Potrebko et al. commented on this software’s potential efficacy by describing three cases: one of complete tumor response, one of partial tumor response, and one of extrahepatic toxicity. 16 However, this limited case series lacked sufficient data for formal statistical analysis and did not comment on patients whose tumor grew following 90Y TARE treatment.
While results of this analysis were not consistent among all patient subpopulations, the findings favor the continued investigation of this software. The association between shrinkage and MTD and MNTD in HCC responders correlates with previous studies that show HCC tumors are sensitive to 90Y TARE treatment. 17 –20 The lack of association in the CRC and other subgroup may be attributed to differences in tumor biology, software adherence, or dosing parameters. Additionally, variances in associations between survival and MTD, MNTD, and TNR may be due to different survival outcomes among cancer subtypes. Future studies should focus on cancer-specific subtypes to establish associations between response, survival, and dosimetric software outputs.
The lack of association between TNR and tumor response in the cancer subtypes is not easily explained. Given that the TNR calculation included both MTD and MNTD, one would expect associations within the HCC group to hold. Different TNR calculation methods might have shown consistent associations, which warrants further exploration. 14
In this study, BECT was utilized due to its availability and established use in clinical practice. However, it is known to have limitations in image resolution and dosimetric precision. 21 This could, at least partly, explain why dose-response relationships were observed in HCC but not in colorectal or other cancer subtypes. In contrast, 90Y PET has been shown to provide higher spatial resolution and more accurate voxel-based dosimetry, leading to stronger correlations in dose response studies across various tumor types. 22
MNTD did not correlate with damage to healthy hepatic parenchyma, as evidenced by the lack of association with post-treatment laboratory values and Child-Pugh scores. However, an association was observed when analyzing MELD scores. Both Child-Pugh and MELD use bilirubin and INR, but differ on other factors they consider, which may explain these findings. 90Y may have a greater impact on the variables that are part of MELD calculations. If future studies continue to validate voxel-based dosimetry software, these finding may be reassuring for the preservation of liver function and suggest that more aggressive TARE therapy could optimize treatment efficacy.
This study has several limitations. First, the predominance of white race and non-Hispanic/Latinx ethnicity may reflect disparities in access to TARE. Future research should aim to identify and address these barriers. Second, this study also lacked an adequate sample size for expansive subpopulation analyses. Of particular interest would have been analyzing dosimetry assessments between individual cancer subtypes instead of grouping them into one category. Third, the study was limited by focusing on the largest measurable lesion per patient for dosimetric analysis, which may not fully capture the dose response relationship in patients with multiple significant lesions. Conducting lesion-level analyses in future studies could provide a more comprehensive assessment of dosimetry and improve the understanding of treatment outcomes. Additionally, this study did not examine survival among groups based on overall patient-level doses. Fourth, the use of BECT for dosimetric analysis, while practical, has inherent limitations compared to 90Y-PET imaging, which may impact dose precision and study outcomes. Finally, to increase internal validity, patients who received split-dose infusions were excluded. These patients may have had more complex or disseminated liver disease, which could affect study results. Future studies could include this patient population if all liver lesions are analyzed, rather than focusing on a single lesion of interest.
Conclusions
This study demonstrated the utility of the voxel-based dosimetry assessments in predicting treatment outcomes, particularly regarding survival and tumor shrinkage in the immediate post-treatment period. The potential impact of this software in clinical practice may increase if predictive factors to identify responder and nonresponder subpopulations are discovered.
Footnotes
Acknowledgments
The authors would like to thank the following individuals for their technical support with Picture Archiving and Communication Systems (PACS) and Velocity 4.0 RapidSphereTM software: Miranda Leiker, James Lee Ingalls III, Harley Creek, a Radiology IT Clinical Analyst, and Tony Chilcoat, a System Administrator II. The authors also thank radiation safety program coordinator, Stefanie Smith, and the Radiation Safety Office at the University of Kansas Medical Center for assistance in obtaining radiation treatment data. The authors would like to thank the following for their help in collecting additional data for calculating Child-Pugh and MELD scores: Peyton Ackerman.
Authors’ Contributions
Z.C., C.W., and M.P.: Study concepts and design. C.W.: Literature research. C.W., W.W., J.M., I.K., G.W., and A.D.: Data collection. M.P.: Statistical analysis. C.W., S.S., M.P., C.W., A.R., and Z.C.: Article preparation and editing.
Data Availability Statement
All data generated or analyzed during this study are included in the article. Further inquiries can be directed to the corresponding author.
Disclosure Statement
The authors of this presentation have research support from a
This study did not require IRB approval as it involved only a retrospective review of deidentified patient data, with no direct patient contact or intervention, and met criteria for exemption under applicable ethical guidelines for human subjects research.
Funding Information
This study was funded by Sirtex Medical Limited grant R19-032-AMER. The funder provided guidance on the design of the study, but no other direct input in the collection, analysis, interpretation, or writing-up of the data.