
Abstract
Objective:
This study explored the role of monocarboxylate transporter 1 (MCT1) in nasopharyngeal carcinoma (NPC) metastasis and its regulation via DNA methyltransferase 3B (DNMT3B)-mediated methylation, to identify therapeutic targets for NPC.
Methods:
MCT1/DNMT3B expression was analyzed in NPC (n = 30) and normal tissues (n = 30) using quantitative polymerase chain reaction (qPCR) and immunohistochemistry. DNMT3B overexpression plasmids were transfected into NPC cells to assess MCT1 expression and promoter methylation via bisulfite sequencing PCR. Luciferase and chromatin immunoprecipitation (ChIP) assays identified DNMT3B-MCT1 promoter interactions. Migration/invasion assays and Western blot evaluated functional impacts of MCT1 silencing on metastasis-related pathways. Bioinformatic validation utilized GEO datasets.
Results:
MCT1 mRNA/protein levels were significantly elevated in NPC versus normal tissues (***p < 0.001), whereas DNMT3B was downregulated. DNMT3B overexpression reduced MCT1 expression (*p < 0.05) and increased MCT1 promoter methylation (**p < 0.01). Luciferase assays revealed that DNMT3B suppressed wild-type MCT1 promoter activity, dependent on an 80 bp CpG island (**p < 0.01). ChIP confirmed DNMT3B enrichment at hypermethylated MCT1 promoter regions (**p < 0.01). MCT1 silencing inhibited NPC cell migration/invasion (*p < 0.05) and downregulated p-AKT, p-mTOR, and p-NFκB (*p < 0.05). High MCT1 correlated with Epstein–Barr virus (EBV)-associated EBNA1BP2 (**p < 0.01), but not PD-L1 markers. DNMT3B inversely correlated with MCT1 (*p < 0.05) and was upregulated in advanced-stage NPC (Stage III + IV vs. I + II, ***p < 0.001), indicating stage-specific epigenetic dysregulation.
Conclusion:
MCT1 promotes NPC metastasis via NF-κB and PI3K/AKT/mTOR pathways, regulated by DNMT3B-driven promoter methylation. The MCT1-DNMT3B axis, linked to EBV-associated metabolic reprogramming, represents a prognostic biomarker and therapeutic target for advanced NPC.
Introduction
Nasopharyngeal carcinoma (NPC), a prevalent malignancy in the head and neck region, accounts for over 70% of new cases in East and Southeast Asia. While over 70% of cases occur in East and Southeast Asia, particularly in southern China (age-standardized incidence rate [ASR] of 3.0–30.0 per 100,000), intermediate incidence rates are observed in North Africa (ASR: 1.5–2.0) and the Arctic regions (e.g., Alaska Native populations, ASR: ∼7.4), whereas rates in Europe and the United States remain low (ASR: <0.5). 1 This disparity is attributed to a complex interplay of genetic susceptibility (e.g., HLA polymorphisms), environmental factors (e.g., salted fish consumption rich in nitrosamines), and Epstein–Barr virus (EBV) exposure. 2 For instance, endemic regions like Guangdong, China, exhibit EBV seropositivity in >95% of NPC cases compared with <50% in low-risk areas such as Europe. 3 This highly aggressive cancer sees recurrence and distant metastasis in approximately 10%−20% of patients post-initial treatment. 4 Understanding the molecular mechanisms underpinning NPC invasion and metastasis is critical for developing strategies to curb tumor progression and enhance patient prognosis.
Monocarboxylate transporters (MCTs), encoded by the SLC16 gene family, comprise 14 members that mediate proton-coupled transport of monocarboxylate anions such as pyruvate, l-lactate, ketone bodies, acetoacetate, and butyrate. 5 MCT1, particularly, is ubiquitously expressed in tissues, exhibiting a high affinity for l-lactate, thereby maintaining lactate levels within tumors and contributing to their biological functions. 6 Previous studies have linked MCT1 to the activation of the transcription factor NF-κB, promoting tumor cell metastasis. 7 However, the precise role and mechanisms of MCT1 in NPC invasion and metastasis remain largely unexplored.
DNA methylation is a crucial factor in NPC development and progression. For instance, hypermethylation of the tumor necrosis factor-α-induced protein 8-like protein 3 (TIPE3) promoter results in its downregulation in NPC tissues, and restoring TIPE3 expression inhibits NPC cell proliferation, migration, and invasion both in vitro and in vivo. 8 Building on previous epigenetic research, microarray data from the Oncomine™ database show significantly higher MCT1 mRNA levels in NPC tissues compared with adjacent noncancerous tissues. In addition, analysis of the MCT1 gene promoter region reveals a high density of CG sites, indicating potential aberrant hypomethylation in tumors.
This study investigates the effects of DNA methyltransferase 3B (DNMT3B) overexpression on MCT1 methylation levels in NPC cells and elucidates the regulatory mechanisms involved. Furthermore, it seeks to clarify the impact of MCT1 gene methylation on its expression and explore how MCT1 influences NPC cell migration and invasion.
Materials and Methods
Tissue sample collection
Thirty pairs of NPC tissues and adjacent normal nasopharyngeal tissues were obtained from patients undergoing surgery at the First Affiliated Hospital of Westlake University School of Medicine. All samples were histologically confirmed and immediately stored at −80°C. The Ethics Committee of the hospital approved this study, and written informed consent was obtained from all patients.
Cell culture
Human NPC cell lines, CNE1 (CVCL_6888) and C666-1 (CVCL-7949), were cultured in RPMI-1640 medium supplemented with 10% fetal bovine serum (FBS), 100 U/mL penicillin, and 100 μg/mL streptomycin. The cells were maintained in a humidified incubator at 37°C with 5% CO2 and used in the logarithmic growth phase for all experiments. The above cell lines were purchased from Wuhan Shangen Biotechnology Co.
Plasmid and siRNA transfection
For transient transfection, the plasmids of siRNAs targeting MCT1 and control siRNAs were designed by Hippo Bio, which were then transfected into two human NPC cell lines. The siRNA fragment with the best silencing of MCT1 effect on MCT1 (sequence: 1# GCAGGGAAAGAUAAGUCUAAATT; 2# UUUAGACUUAUCUUUUCCCUGCTT) was selected for subsequent experiments. Once the cells reached 70%–80% confluence, they were transfected with the plasmids using Lipofectamine 2000 (Invitrogen, 11668–019). Following incubation, Opti-MEM medium (Gibco, 31985–070) was added to the transfection complex. Western blot analysis was used to assess the transfection efficiency. The MCT1 siRNA sequence is detailed in Table 1.
Monocarboxylate Transporter 1 siRNA Sequences
siR, siRNA; siR-NC, nontargeting control siRNA; MCT1, monocarboxylate transporter 1.
Real-time quantitative polymerase chain reaction
Total RNA extraction was performed using TRIzol reagent (Thermo Fisher Scientific) following the manufacturer’s instructions. Complementary DNA (cDNA) was synthesized utilizing a Reverse Transcription Kit (Takara Bio). Quantitative PCR (qPCR) was conducted with SYBR Green Master Mix (Applied Biosystems) on a real-time PCR system (Bio-Rad). Relative expression levels were calculated using the 2−ΔΔCT method, normalized to β-actin. The cDNA reaction system and primer sequences are detailed in Tables 2 and 3.
Complementary DNA Reaction System
Reaction program: 95°C, 3 min, denaturation; 95°C, 12 s; 60°C, 40 s, 40 cycles.
qPCR, quantitative polymerase chain reaction; cDNA, complementary DNA.
Primer Sequence
MCT1, monocarboxylate transporter 1.
Immunohistochemistry
Tissue sections (4 μm) underwent deparaffinization, rehydration, and antigen retrieval. Endogenous peroxidase activity was inhibited with 3% hydrogen peroxide. Primary antibodies against MCT1, DNMT1, DNMT3B, and ten-eleven translocation methylcytosine dioxygenase 1 (TET1) were applied to the slides and incubated overnight at 4°C, followed by secondary antibodies conjugated with horseradish peroxidase. A diaminobenzidine substrate kit was used for visualization, and slides were counterstained with hematoxylin. Finally, microscopic examination was conducted using a microscope, and images were captured for subsequent analysis.
Western blot analysis
Protein extraction and quantification were conducted using a BCA Protein Assay Kit (Pierce). Proteins were separated by SDS-PAGE and transferred to PVDF membranes. After blocking with 5% nonfat milk, membranes were incubated with primary antibodies overnight at 4°C, followed by appropriate secondary antibodies. Detection of protein bands was carried out using an ECL substrate kit and visualized with a chemiluminescence imaging system.
Plasmid construction and transfection
The full-length DNMT3B cDNA was cloned into a pcDNA3.1 vector. NPC cells were transfected with either the DNMT3B overexpression plasmid or an empty vector using Lipofectamine 2000 (Invitrogen, 11668–019) according to the manufacturer’s instructions.
Bisulfite sequencing PCR
Genomic DNA was treated with bisulfite using an EpiTect Bisulfite Kit (Qiagen). The bisulfite reaction system was composed of the following components. The following reagents were utilized: 1 μL of DNA, 85 μL of bisulfite solution, and 35 μL of DNA protection buffer. The total volume of the solution was 140 μL. The reaction was incubated at room temperature (15°C–25°C) for 15 min to stabilize DNA-bisulfite interactions. Bisulfite conversion was performed using a thermal cycler under the following conditions: initial denaturation at 95°C for 5 min, followed by 10 cycles of 95°C for 5 min and 60°C for 10 min, with a final hold at 20°C. Purification of bisulfite-converted DNA was carried out using the MinElute DNA spin columns. Bisulfite sequencing PCR (BSP) was performed with specific primers for the MCT1 promoter CpG island. PCR products were subcloned into a pGEM-T Easy vector (Promega), and at least 10 individual clones were sequenced to determine the methylation status. BSP primer design refers to the Table 4.
Bisulfite Sequencing PCR Primer
PCR, polymerase chain reaction.
Luciferase reporter assay
CNE and C666-1 cell densities were adjusted to 3 × 10⁴ cells/well by selecting cells in the logarithmic growth phase and optimal conditions. DNMT3B expression plasmid and negative control, diluted 100-fold, along with 1.2 μg Renilla, were transfected into the cells for 24 h. The 5× lysis buffer was diluted to 1×, and 100 μL was added to each well. Cells were scraped, collected into a centrifuge tube, and centrifuged at 14,000 rpm for 20 min. Twenty microliters of the cell lysate was added to a 96-well plate, followed by 50 μL LAR II, and luminescence was detected and recorded. The 96-well plate was remeasured, and the relative fluorescence intensity was calculated and compared with the control.
Chromatin Immunoprecipitation assay
Cells were fixed in 1% formaldehyde at 37°C for 10 min, washed twice with Wash Buffer, and lysed with lysis buffer. The cells were scraped, transferred to a 1.5 mL Eppendorf tube, and incubated on ice for 10 min. DNA was sheared to 200–1000 base pairs using a sonicator. The lysate was centrifuged at 14,000 rpm for 10 min at 4°C, and the supernatant was collected and diluted with dilution buffer. A 40 μL aliquot of control group supernatant served as the input control. Both control and experimental groups were incubated with DNMT3B antibody overnight at 4°C. Protein A/G (40 μL) was added and incubated for 1 h at 4°C to collect the antibody-protein-DNA complex. Each group was washed with 800 μL of Beads Wash Buffer, mixed, rotated at 4°C for 3 min, and placed on a magnetic rack to adsorb the beads. The supernatant was discarded, and Elution Buffer was added, mixed, and rotated at room temperature for 30 min. Beads were adsorbed again, and the supernatant was collected. Each group received 20 μL of 5M NaCl and was incubated at 65°C for 4 h to reverse cross-linking. Finally, 32 μL of Core Mix was added and incubated at 45°C for 1 h, and the DNA was purified using a DNA Purification Kit according to the manufacturer’s protocol.
Transwell assay for cell migration and invasion
The Matrigel mixture preparation began with thawing the Matrigel at 4°C until it reached a liquid state and then diluting it at a 1:40 ratio with serum-free culture medium (2.5 μL of undiluted Matrigel per well). Next, 100 μL of the Matrigel mixture was evenly distributed onto the upper chamber of the Transwell insert and allowed to solidify at 37°C for 30 min. Once solidified, the inserts were removed from the incubator, and the supernatant was carefully aspirated and discarded. CNE and C666-1 cells were harvested during the logarithmic growth phase, counted, and resuspended in serum-free RPMI-1640 medium, adjusting the cell density to 2 × 10⁴ cells per 100 μL. Then, 500 μL of culture medium containing 10% FBS was added to the lower chamber of the Transwell, and 100 μL of the cell suspension was placed onto the Matrigel-coated upper chamber. The assembly was incubated at 37°C in a cell culture incubator for 24 h. Postincubation, the inserts were carefully removed, and nonmigrated cells were gently wiped off with a cotton swab. The inserts were washed thrice with phosphate-buffered saline (PBS) to remove residual cells or debris. Migrated cells were fixed with 500 μL of methanol for 20 min, followed by three additional PBS washes. Cells on the membrane’s underside were stained with 500 μL of 0.1% crystal violet solution for 40 min. After staining, the solution was removed, and the inserts were washed thrice with PBS. Inserts were then air-dried, and stained cells were visualized under a microscope at 100× magnification. Three to five random fields of view per insert were photographed. Cell counting was performed using ImageJ software (v1.53t) with the Cell Counter plugin to ensure objective quantification. The number of purple-stained cells within these fields was counted and statistically analyzed to assess cell migration and invasion.
Cell scratch assay
Before cell seeding, reference marks were made on the surface of a 6-well plate using a ruler. Cells in the logarithmic growth phase were harvested and resuspended in culture medium supplemented with 10% FBS to a final concentration of 5 × 10⁵ cells/mL. The cell suspension was then seeded into the 6-well plate and incubated at 37°C in a 5% CO2 incubator overnight.
The following day, a scratch wound assay was performed. A perpendicular scratch was made across the reference mark using a 10 μL pipette tip. The plate was rinsed thrice with PBS to remove any dislodged cells. Subsequently, cells were treated with varying concentrations of Drug A, prepared in a serum-free medium, and continued to be cultured.
The wound healing process was monitored at 0, 24, and 48 h post-scratching. At each time point, 3–4 fields of view per well were captured using a microscope at 40× magnification. The distance of the scratch wound was measured, and the cell migration rate was calculated for each group using the following formula:
Cell Migration Rate (%) = (Initial Scratch Distance − Scratch Distance at Time PointInitial Scratch Distance) × 100%; Cell Migration Rate (%) = (Initial Scratch DistanceInitial Scratch Distance − Scratch Distance at Time Point) × 100%
This assay quantitatively measures cell migration by evaluating the ability of cells to move into the wounded area over a defined period. The results can be utilized to assess the effects of treatments, such as Drug A, on cell migratory behavior.
Statistical analysis
Statistical analyses were performed using GraphPad Prism software (v9.0). Data are expressed as mean ± standard deviation from a minimum of three independent experiments. Differences between two groups were evaluated using a two-tailed Student’s t-test. For comparisons involving three or more groups, one-way analysis of variance followed by Dunnett’s multiple comparisons test was applied, with Bonferroni correction to adjust the family-wise error rate and maintain the overall significance level at α = 0.05.
Clinical characteristics analysis of MCT1 and DNMT3B in NPC based on public databases
Expression analysis of MCT1 and existing NPC biomarkers
The GSE68799 dataset, comprising 42 NPC tumor tissues and 4 normal controls, was retrieved from the GEO database. Gene aliases were identified using GeneCards (https://www.genecards.org/) as follows: MCT1 (SLC16A1), LMP1 (PDLIM7), PD-L1 (CD274), and EBNA1 (EBNA1BP2). The TPM expression data of GSE68799 were log2 standardized, NPC samples were screened according to the sample information, and the gene IDs were converted into symbols by referring to the Human Gene Annotation Table. NPC samples were stratified into high- and low-MCT1 expression groups based on median expression. Differential expression of EBNA1BP2, PDLIM7, CD274, and DNMT3B between groups was visualized using violin plots (R package ggpubr), and statistical significance was assessed via Wilcoxon rank-sum test.
Stage-specific expression analysis of DNMT3B in NPC
The GSE102349 dataset (GPL11154 platform, Illumina HiSeq 2000), containing RNA-seq data from 113 NPC tumor tissues, was downloaded from GEO. Furthermore, clinical metadata, encompassing tumor stage, age, and gender, were extracted to ensure the homogeneity of the cohort.
Probe-level data were converted to a gene expression matrix using Perl, and expression values were log2(FPKM + 1)-transformed and normalized via the normalizeBetweenArrays function in R v4.1.3. After excluding samples with unspecified stages, 73 samples were categorized into two groups as follows: Stage I + II (n = 7) and Stage III + IV (n = 66). Differential expression of DNMT3B mRNA between groups was analyzed using the Wilcoxon rank-sum test and visualized as boxplots (R package ggplot2).
Results
Expression of MCT1, DNMT1, DNMT3B, and TET1 in NPC tissues
To investigate the alteration of MCT1 expression in NPC, 30 clinical specimens each of NPC and normal nasopharyngeal tissues were collected. qPCR assessed the mRNA levels of MCT1 in both tissue types. The results indicated a significantly higher MCT1 mRNA expression in NPC tissues compared with normal tissues (***p < 0.001) (Fig. 1A). Further immunohistochemical analysis evaluated the protein expression levels of MCT1, DNMT1, DNMT3B, and TET1 in NPC. MCT1 protein expression was significantly elevated in NPC tissues relative to normal tissues. In addition, TET1 showed a slight increase in NPC tissues, whereas DNMT3B exhibited a significant reduction compared with normal tissues. DNMT1 displayed a marginally higher expression in normal nasopharyngeal tissues than in NPC tissues (Fig. 1B). These findings suggest that the upregulation of MCT1 in NPC may result from abnormal hypomethylation in its promoter region. Consequently, DNMT3B was selected for further investigation based on these experimental results.
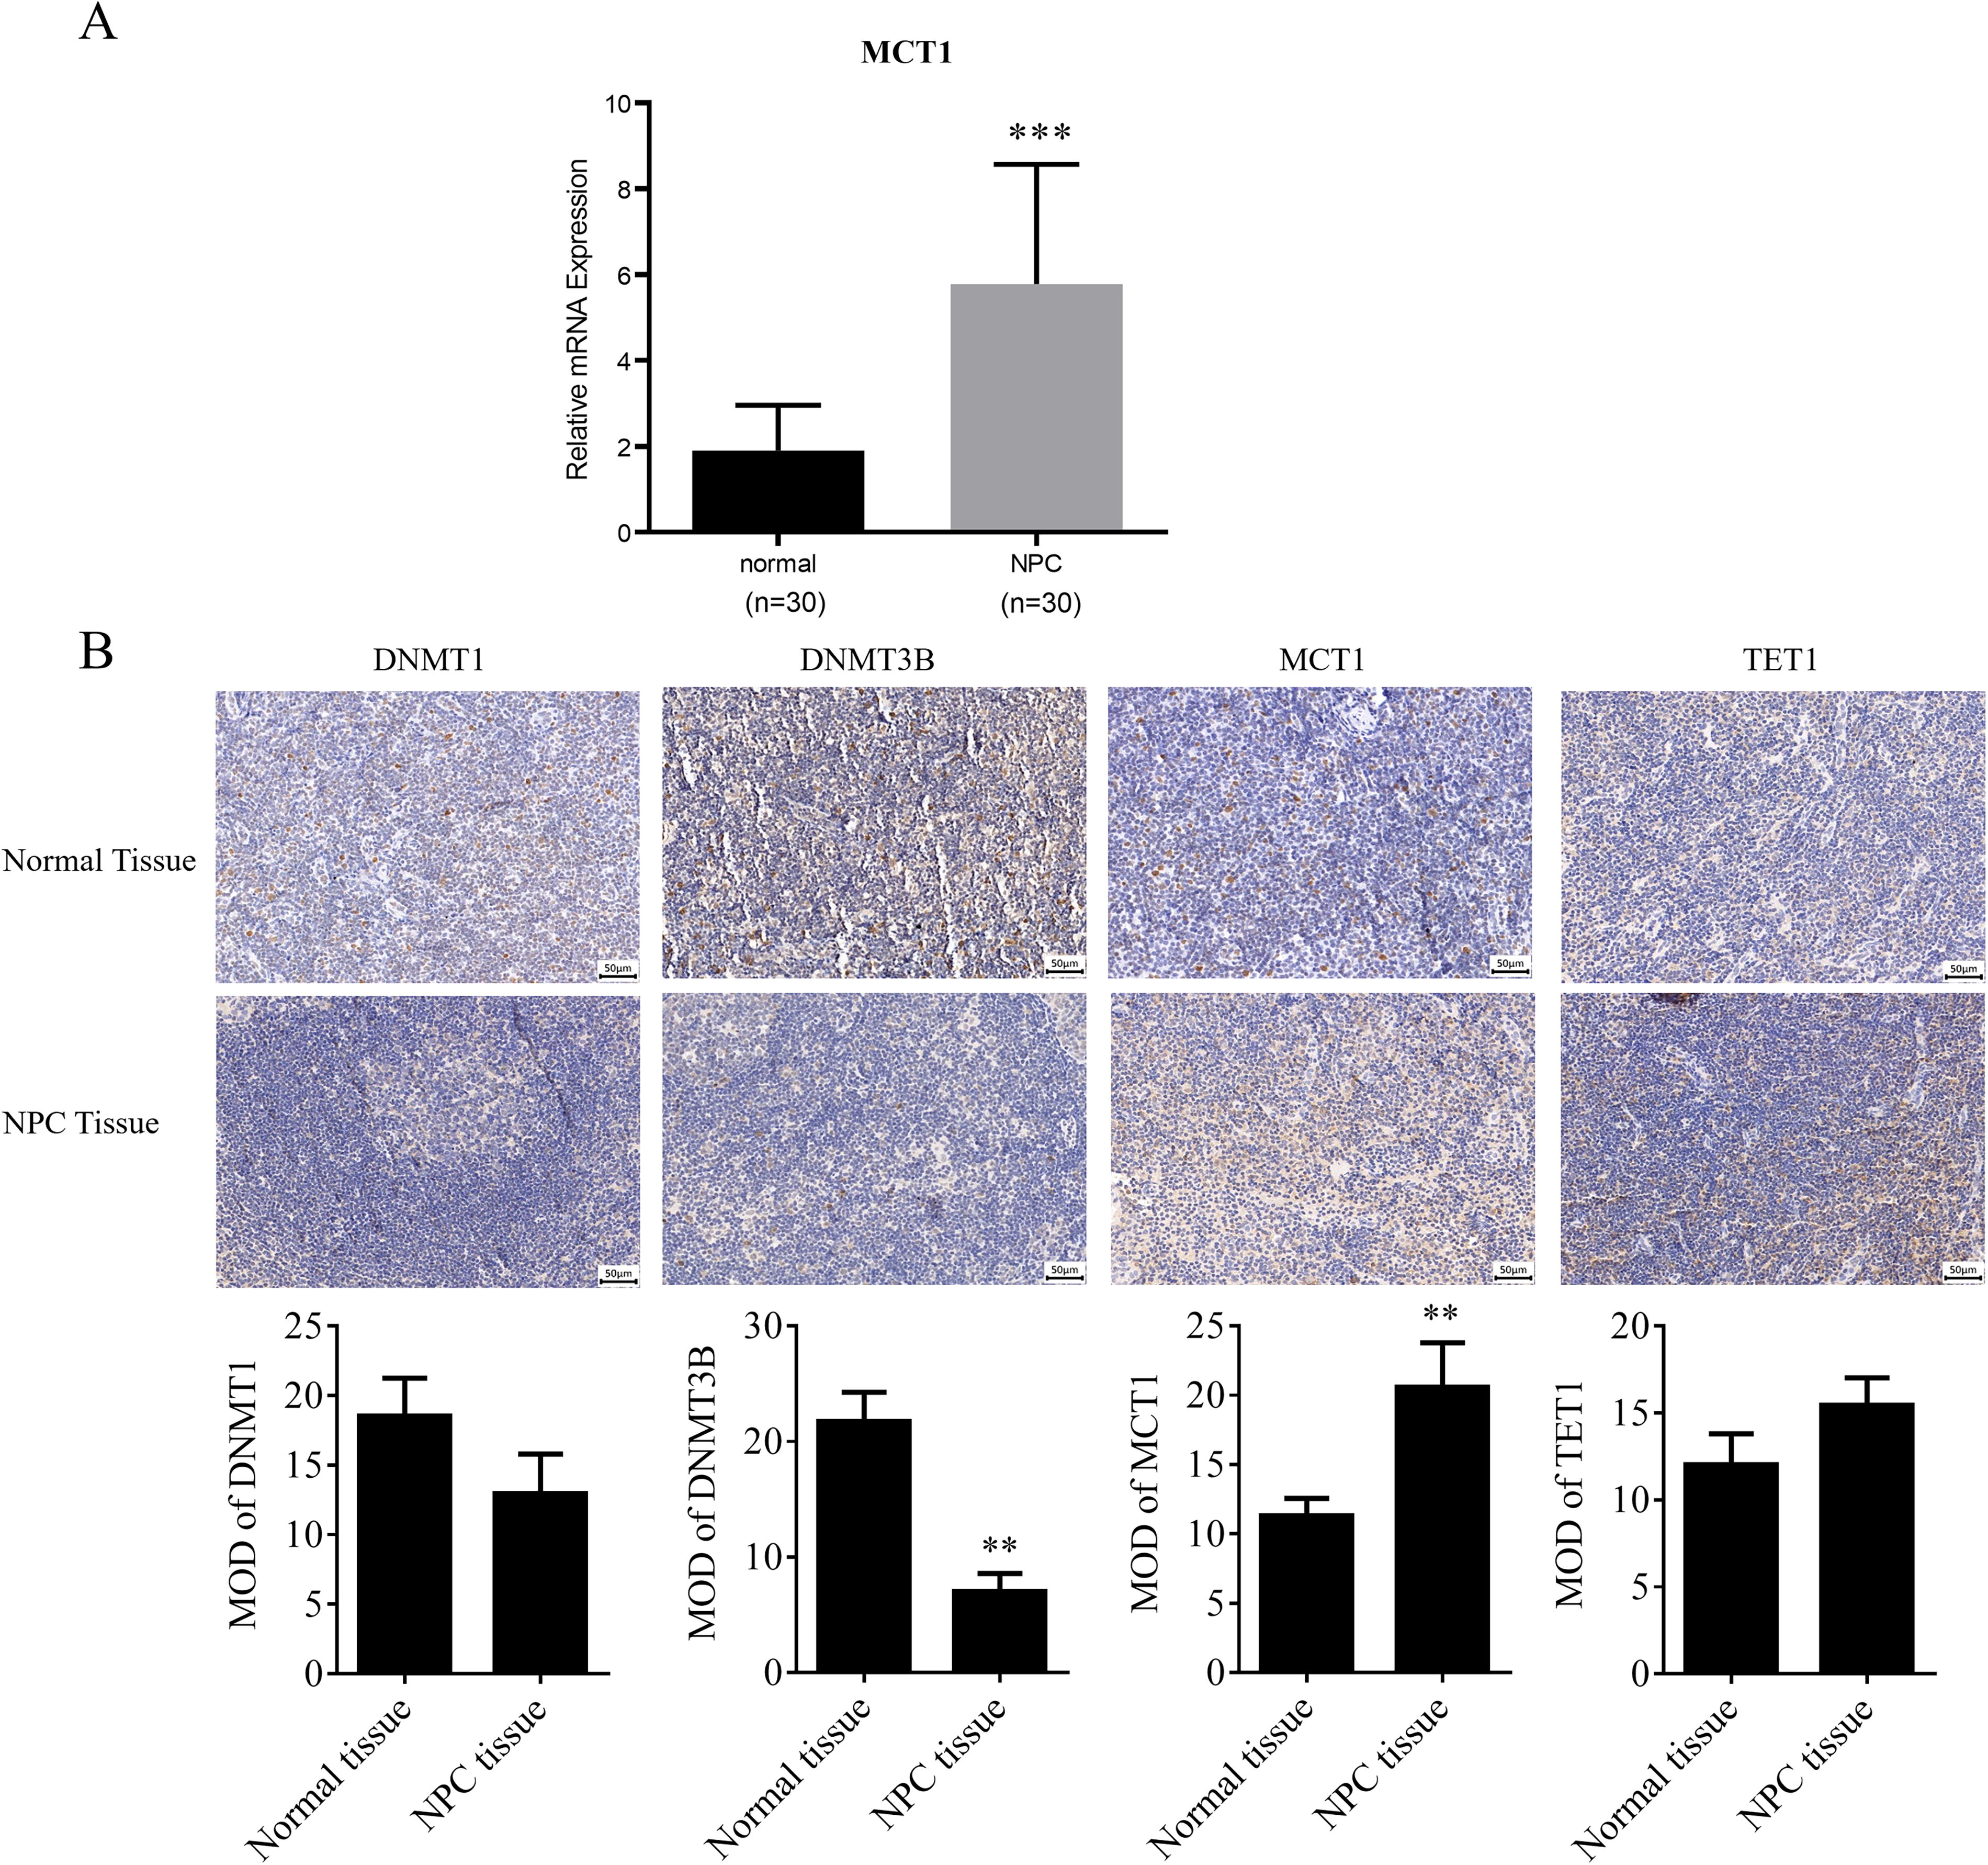
Expression of MCT1 in nasopharyngeal carcinoma and normal nasopharyngeal tissues.
Impact of DNMT3B overexpression on MCT1 expression in NPC cells
Following the transfection of human NPC CNE and C666-1 cells with either a DNMT3B overexpression plasmid or a control empty plasmid, the effects of DNMT3B overexpression on MCT1 expression levels were evaluated using Western blot and qPCR. Western blot analysis confirmed that the DNMT3B overexpression plasmid significantly upregulated DNMT3B levels in CNE and C666-1 cells (**p < 0.01) (Fig. 2A). Conversely, the protein levels of MCT1 in the DNMT3B overexpression group were significantly lower than those in the control group (*p < 0.05) (Fig. 2B). qPCR analysis further revealed that MCT1 mRNA expression in the DNMT3B overexpression group was significantly reduced compared with the control group (*p < 0.05) (Fig. 2C). These results suggest that DNMT3B overexpression can suppress both MCT1 mRNA and protein expression levels.
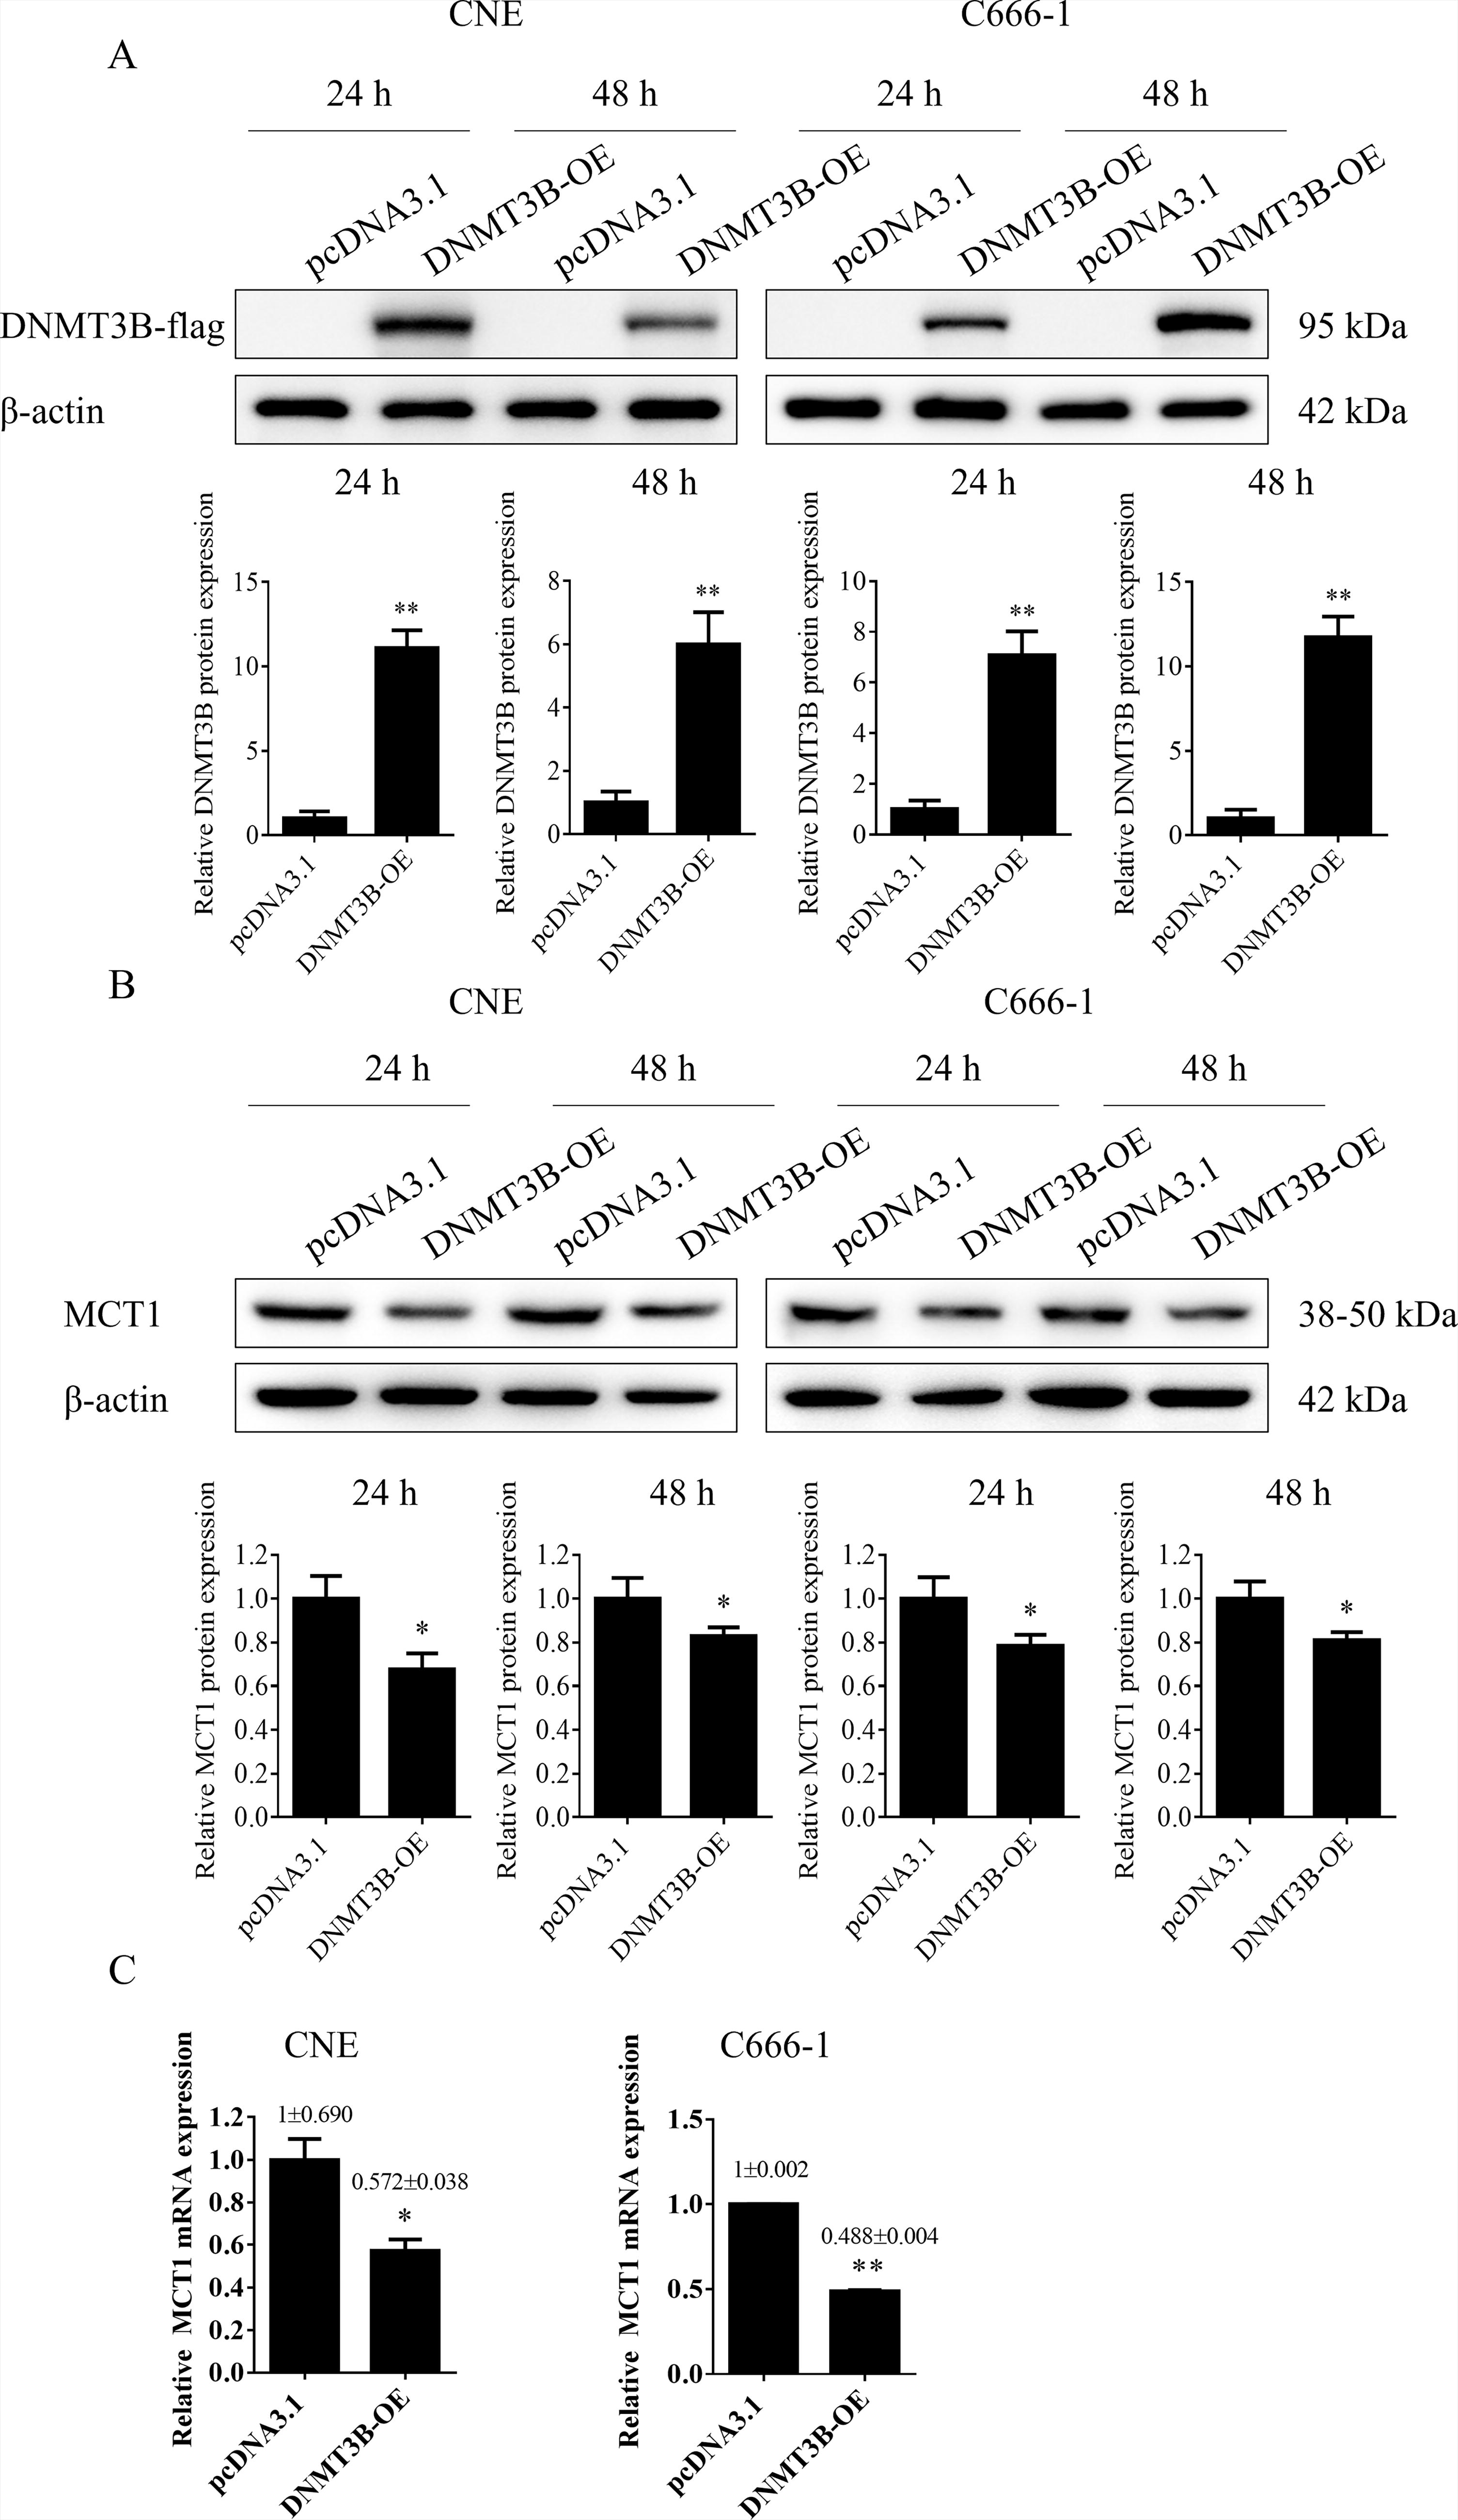
Impact of DNMT3B overexpression on MCT1 expression in nasopharyngeal carcinoma cells.
Impact of DNMT3B on the methylation level of MCT1 in NPC cells
Following the transfection of NPC cells with a DNMT3B overexpression plasmid, BSP was used to evaluate the methylation levels of the MCT1 promoter CpG island. The results showed a significant increase in MCT1 promoter methylation in the DNMT3B overexpression group compared with the control group (**p < 0.01) (Fig. 3A).
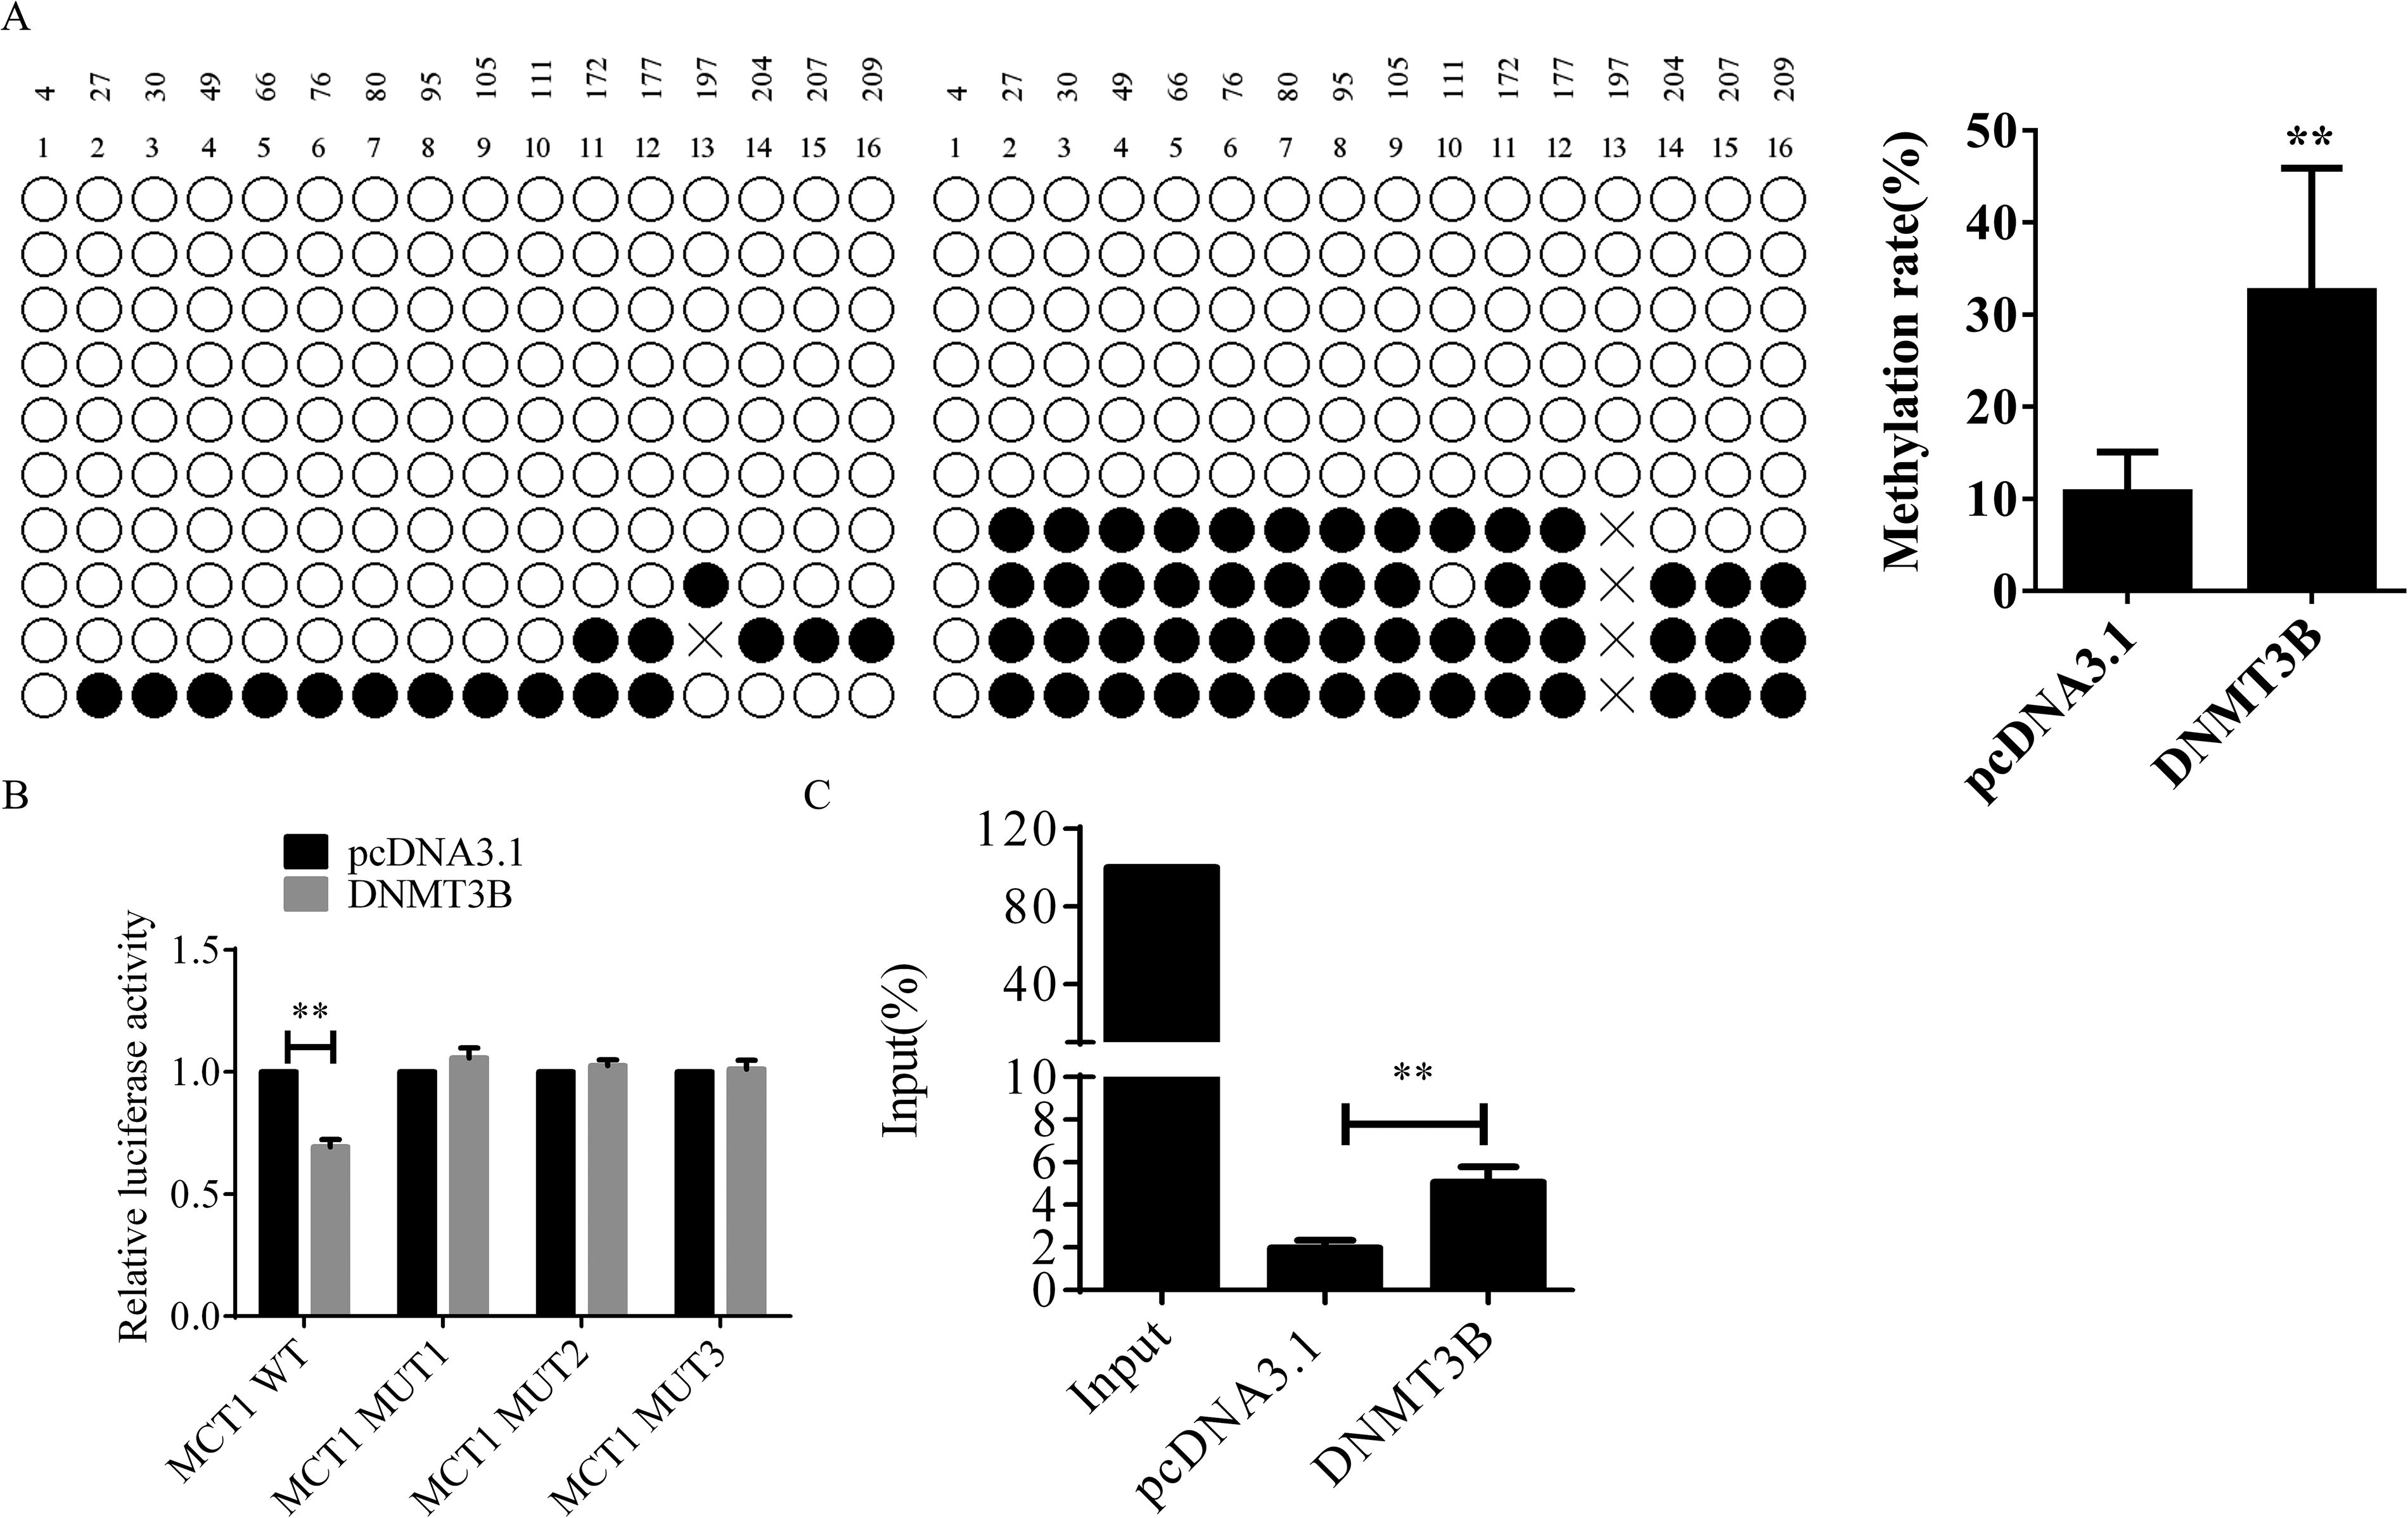
Impact of DNMT3B overexpression on MCT1 methylation levels in nasopharyngeal carcinoma cells.
To further explore the regulatory effect of DNMT3B on MCT1 expression, mutations were introduced into the MCT1 CpG island by sequentially deleting 0 bp, 80 bp, 160 bp, and 243 bp, followed by the construction of corresponding wild-type (WT) and mutant (MUT) luciferase reporter gene plasmids (MCT1 WT, MCT1 MUT1, MCT1 MUT2, MCT1 MUT3). Luciferase assay results indicated that DNMT3B overexpression suppressed the transcriptional activity of the WT MCT1 promoter (**p < 0.01) but had no effect on the MUT types. The inhibitory effect of DNMT3B on MCT1 disappeared after deleting 80 bp from the MCT1 promoter CpG island (Fig. 3B).
Chromatin immunoprecipitation (ChIP) assay results demonstrated higher enrichment of hypermethylated DNA fragments on the MCT1 promoter CpG island in the DNMT3B overexpression group compared with the control group (*p < 0.05) (Fig. 3C). These results confirm that DNMT3B overexpression reduces MCT1 expression by promoting methylation of the MCT1 promoter CpG island.
Screening results for the effective silencing fragments of MCT1 siRNA in NPC cells
Three specific siRNAs targeting MCT1, along with a nontargeting control siRNA (siR-NC), were designed and transfected into two human NPC cell lines, CNE and C666-1, for 24 h. The silencing efficiency was evaluated using Western blot and qPCR. In CNE cells, no significant difference in MCT1 expression levels was observed between the siR-MCT1-3 group and the siR-NC group, indicating no statistical significance. Conversely, MCT1 expression was significantly reduced in the siR-MCT1-1 and siR-MCT1-2 groups (**p < 0.01), with the siR-MCT1-1 group exhibiting a more pronounced effect. In C666-1 cells, MCT1 expression significantly decreased in both the siR-MCT1-1 and siR-MCT1-2 groups (*p < 0.05), with a more substantial reduction in the siR-MCT1-1 group (**p < 0.01) (Fig. 4a, b). Overall, siR-MCT1-1 was identified as the most effective siRNA fragment for silencing MCT1.
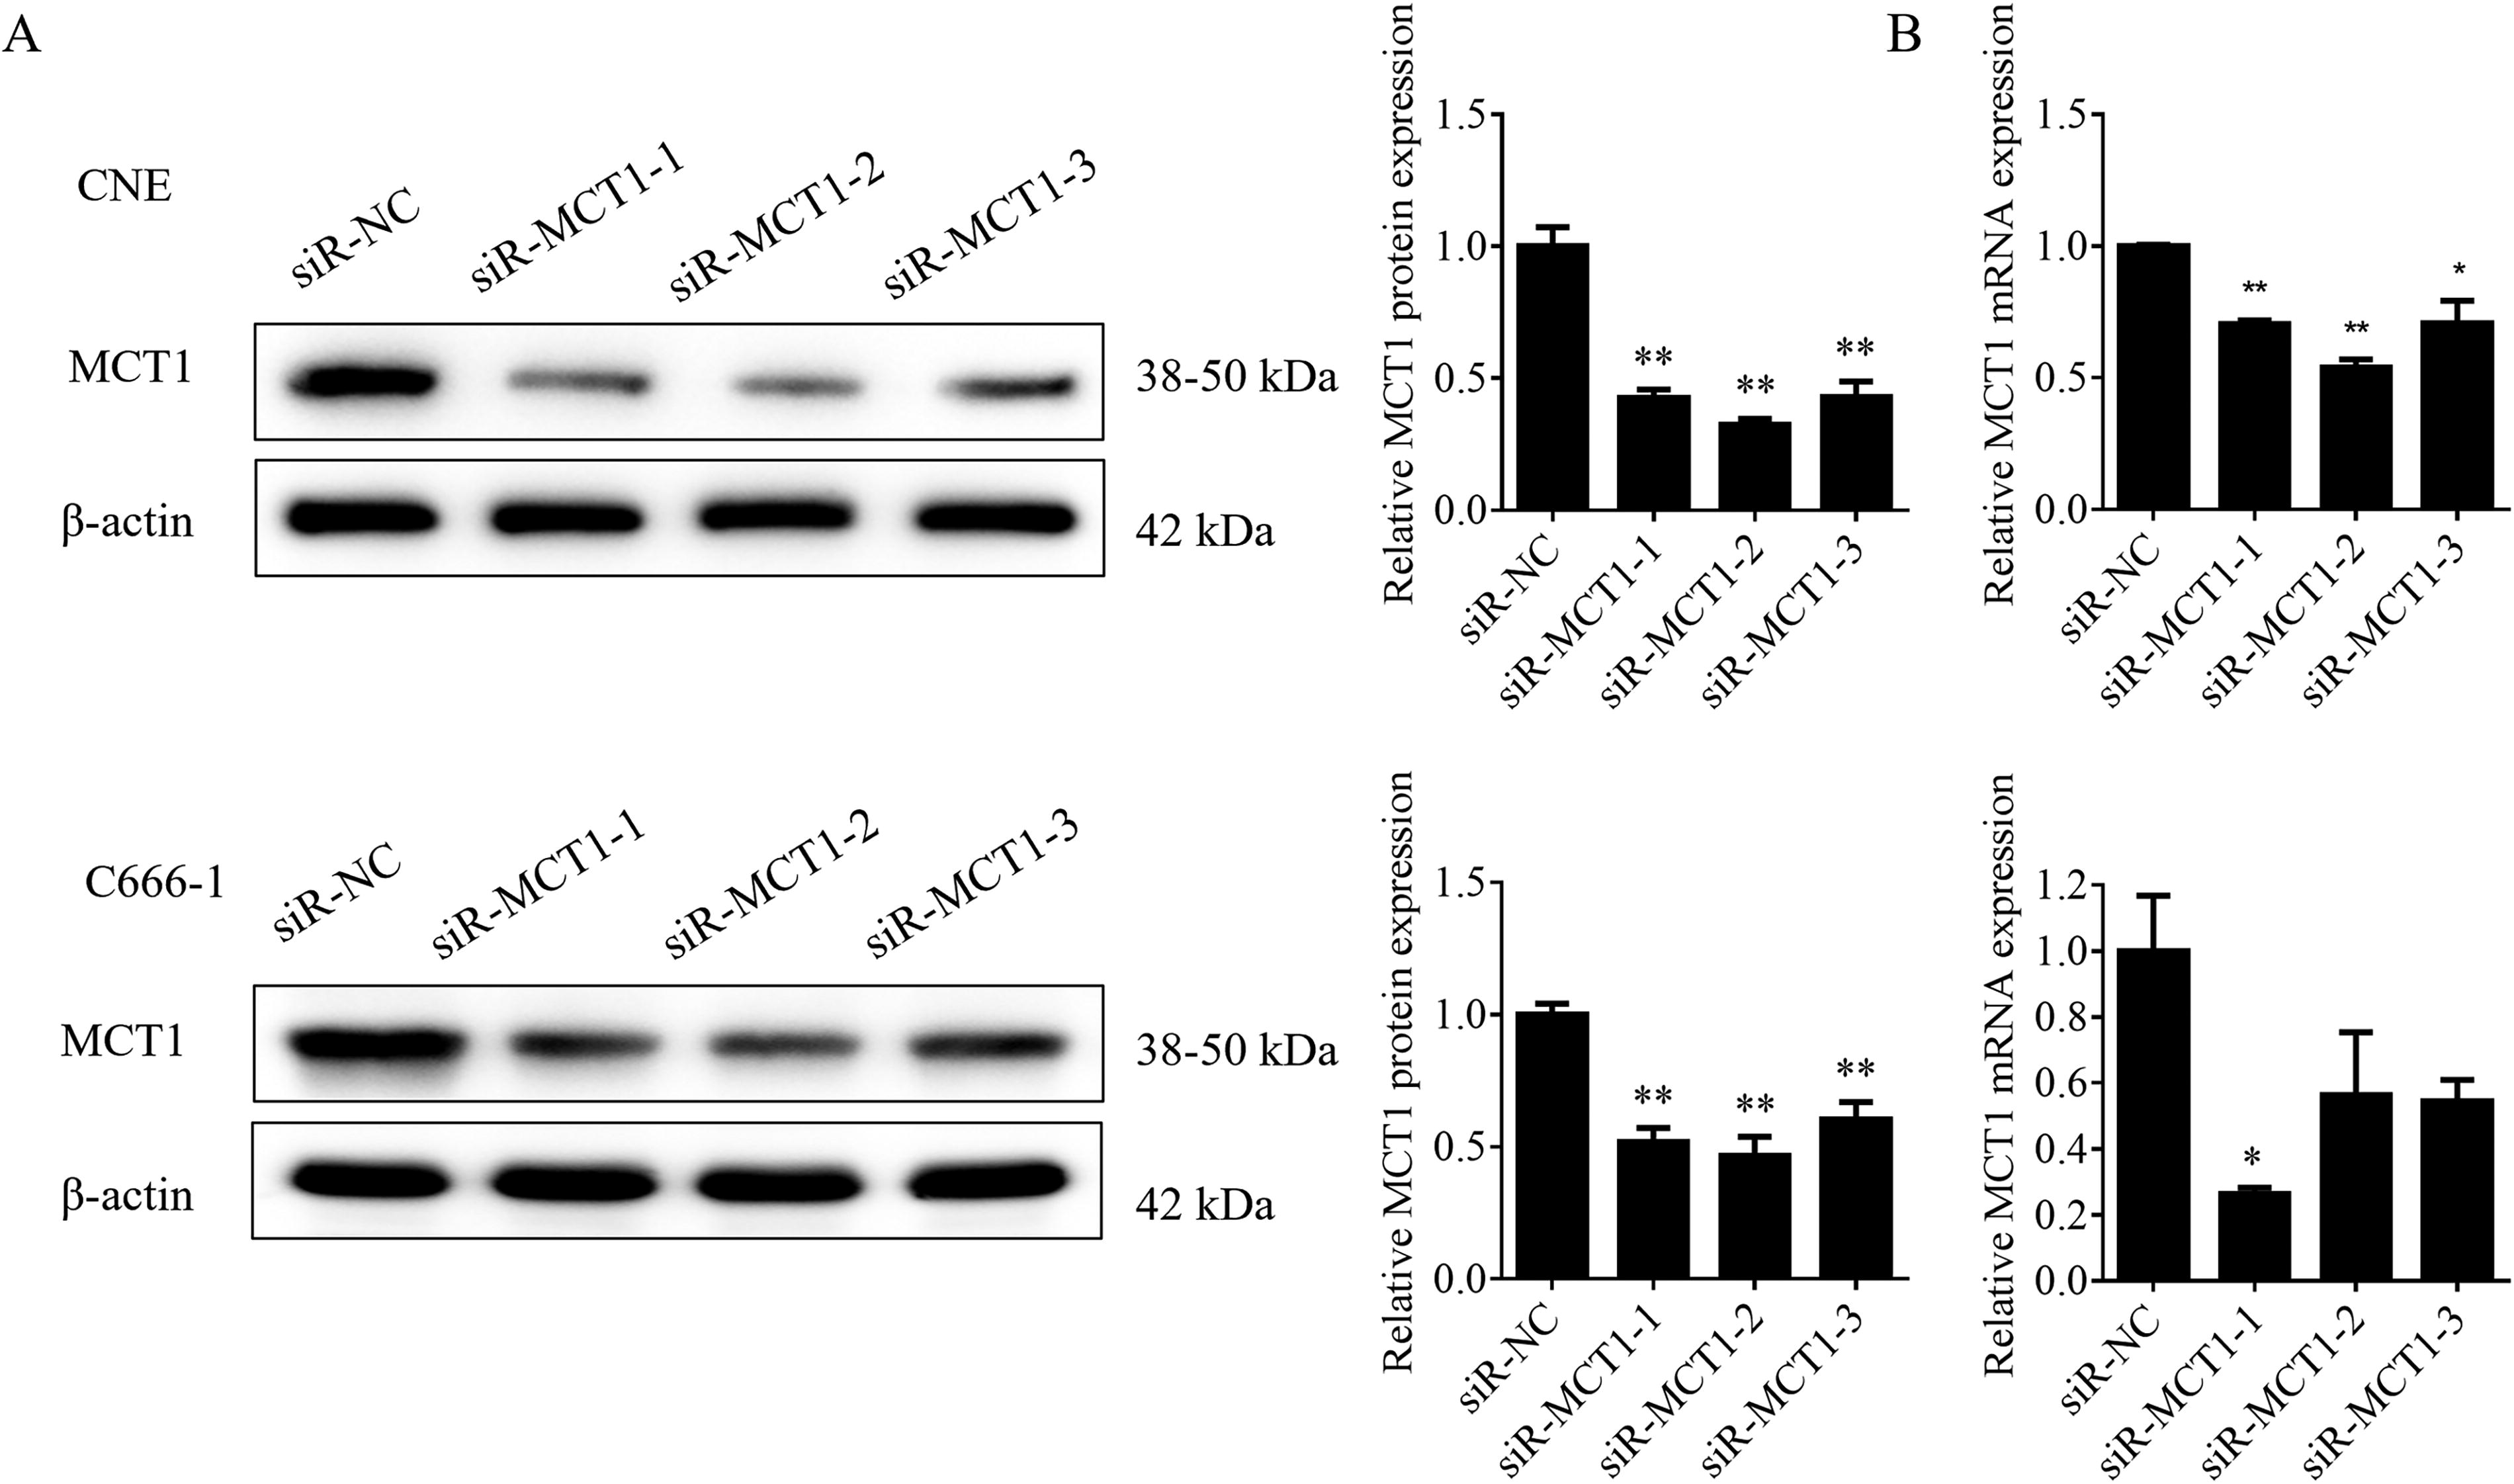
Validation of the silencing effect of siR-MCT1 using Western blot analysis and qPCR.
Impact of MCT1 on the migration and invasion capabilities of NPC cells
siR-MCT1-1 and a control were transfected into two human NPC cell lines, CNE and C666-1. The Transwell assay was used to evaluate the cells’ migratory and invasive capabilities. The results showed that the siR-MCT1-1-treated group exhibited a significant reduction in the migration and invasion abilities of NPC cells compared with the control group (*p < 0.05) (Fig. 5A). A wound-healing assay was also performed to assess the cells’ migratory capacity. In CNE cells, the wound closure rate at 24, 48, and 96 h post-transfection with siR-MCT1-1 was lower compared with the control group, with the most pronounced difference observed at 48 h (**p < 0.01). In C666-1 cells, the wound closure rate at 24, 48, and 96 h post-transfection with siR-MCT1-1 was similarly decreased compared with the control group, with the most significant difference at 96 h (*p < 0.05) (Fig. 5B). These results suggest that downregulation of MCT1 inhibits the migration and invasion of NPC cells.
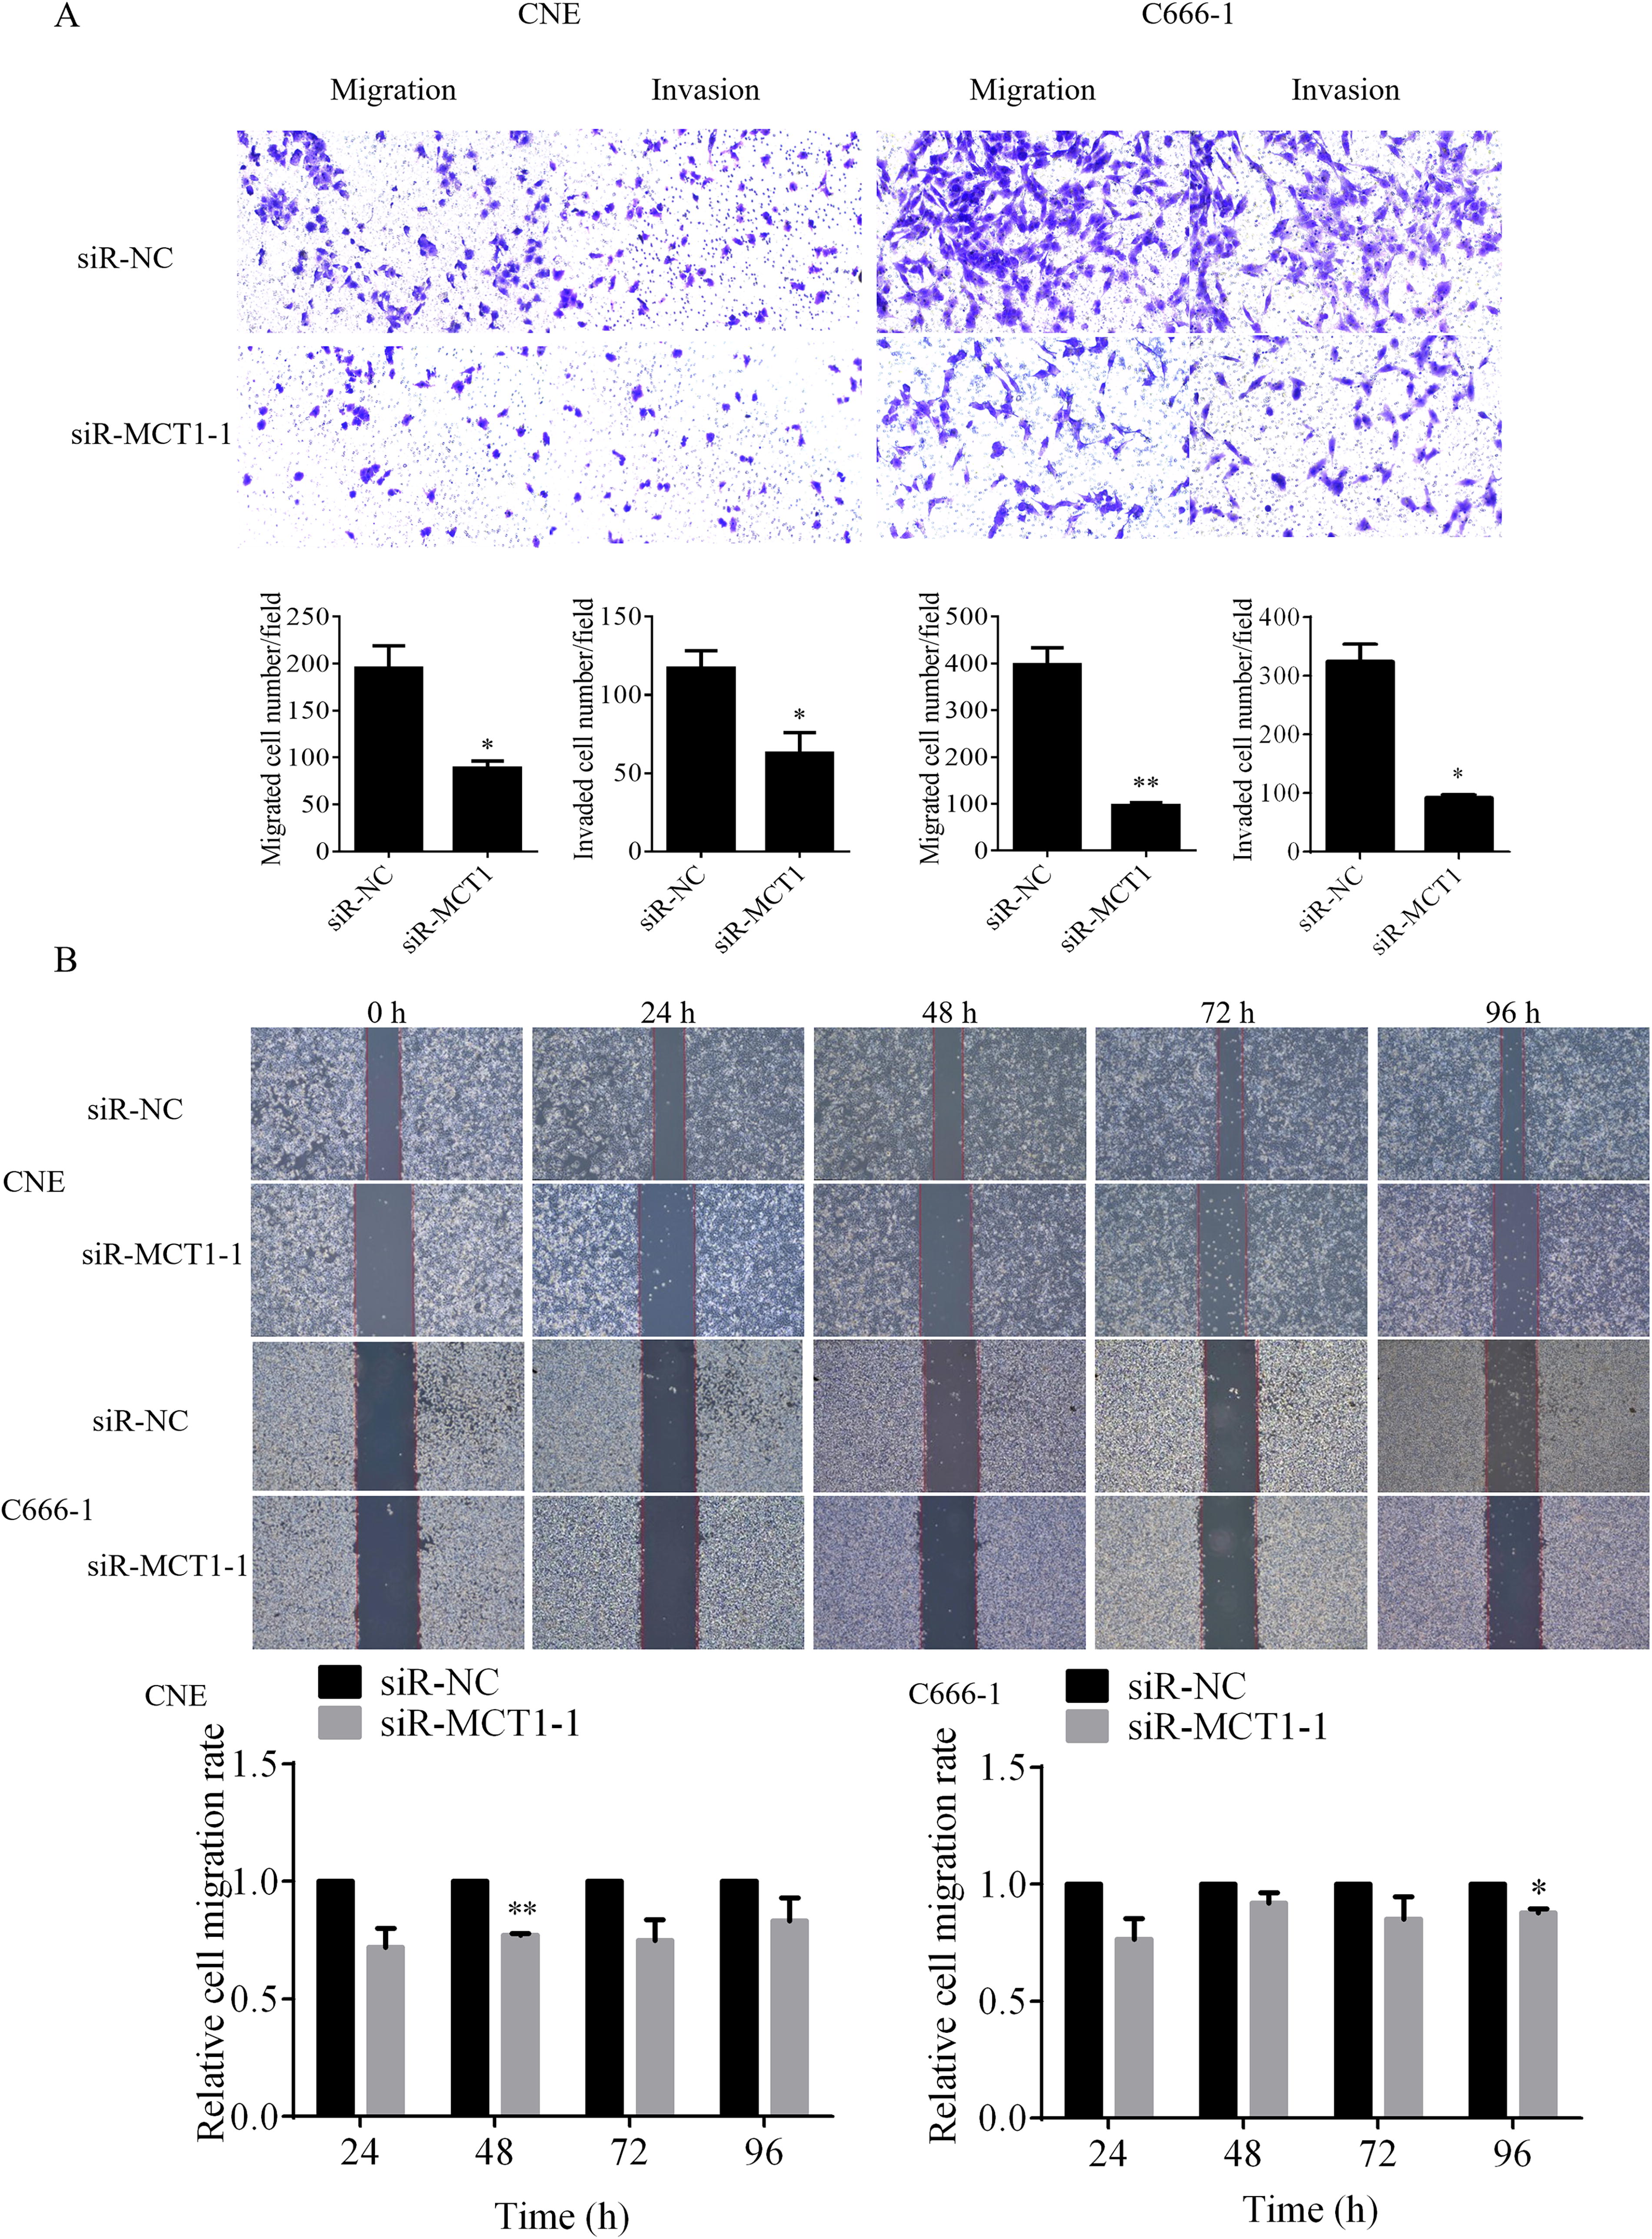
Investigation of the impact of MCT1 on the migratory and invasive capabilities of nasopharyngeal carcinoma cells using Transwell and wound-healing assays.
Regulation of the NF-κB and PI3K/AKT/mTOR signaling pathways in NPC cells by MCT1
To investigate the role of MCT1 in regulating oncogenic signaling pathways, CNE and C666-1 human NPC cell lines were transfected with siR-MCT1-1 or a control siRNA. Western blot analysis was conducted to detect the levels of AKT, NF-κB, mTOR, and their phosphorylated proteins. In CNE cells, the siR-MCT1-1 group showed a significant downregulation of mTOR and p-mTOR proteins (**p < 0.01), as well as a significant reduction in AKT and p-AKT levels compared with the control group (*p < 0.05). Although p-NF-κB levels were significantly decreased (*p < 0.05), the difference in NF-κB expression between the groups was not statistically significant (Fig. 6A). In C666-1 cells, both NF-κB and p-NF-κB were significantly decreased in the siR-MCT1-1 group (*p < 0.05). While p-mTOR and p-AKT showed a clear reduction compared with the control group (**p < 0.01), there was no significant difference in the expression of mTOR and AKT proteins between the groups (Fig. 6B). This evidence suggests that MCT1 can promote the progression of NPC by activating the NF-κB and PI3K/AKT/mTOR signaling pathways.

Western blot analysis of AKT, NF-κB, mTOR proteins, and their phosphorylated protein levels.
Integrated bioinformatics analysis of MCT1 and NPC biomarkers
Bioinformatics analysis comparing MCT1 expression with established NPC biomarkers (EBV DNA, LMP1, and PD-L1) revealed distinct molecular associations (Fig. 7). Stratification of NPC tissues into MCT1/SLC16A1-high and MCT1/SLC16A1-low groups demonstrated that the MCT1-high cohort exhibited significantly elevated expression of EBNA1BP2 (**p < 0.01), an EBV-associated gene, suggesting a potential link between MCT1 and viral oncogenesis. In contrast, no significant differences were observed in PDLIM7 (p > 0.05) or CD274 (PD-L1; p > 0.05), indicating minimal direct influence of MCT1 on PD-L1-mediated immune evasion pathways. Notably, DNMT3B expression was significantly reduced in the MCT1-high group (*p < 0.05), further validating the inverse regulatory relationship between MCT1 and DNMT3B identified in the study. These findings underscore the role of MCT1 in EBV-related metabolic reprogramming and epigenetic dysregulation, while highlighting its limited interaction with PD-L1-driven immune modulation. This supports MCT1 as a promising therapeutic target for EBV-associated NPC, warranting further investigation into combinatorial strategies targeting metabolic and epigenetic pathways.

MCT1 high and low expression group gene expression violin map. MCT1, monocarboxylate transporter 1.
Stage-specific expression of DNMT3B in NPC
The boxplot depicts DNMT3B expression levels in NPC tissues stratified by clinical stage (Stage I+II vs. Stage III+IV) (Fig. 8). Analysis of the GSE102349 dataset, comprising tumor tissues from 113 NPC patients, demonstrated significantly elevated DNMT3B expression in Stage III+IV tumors compared with Stage I+II tumors (***p < 0.001). This finding indicates that DNMT3B upregulation is linked to advanced tumor stages, suggesting that its downregulation in early-stage NPC may be a consequence of tumorigenesis, while its increased expression in late-stage tumors may reflect adaptive or compensatory mechanisms within the tumor microenvironment. This stage-specific expression pattern underscores the dual role of DNMT3B in NPC progression and emphasizes the need for further studies to elucidate its temporal regulatory dynamics during carcinogenesis.
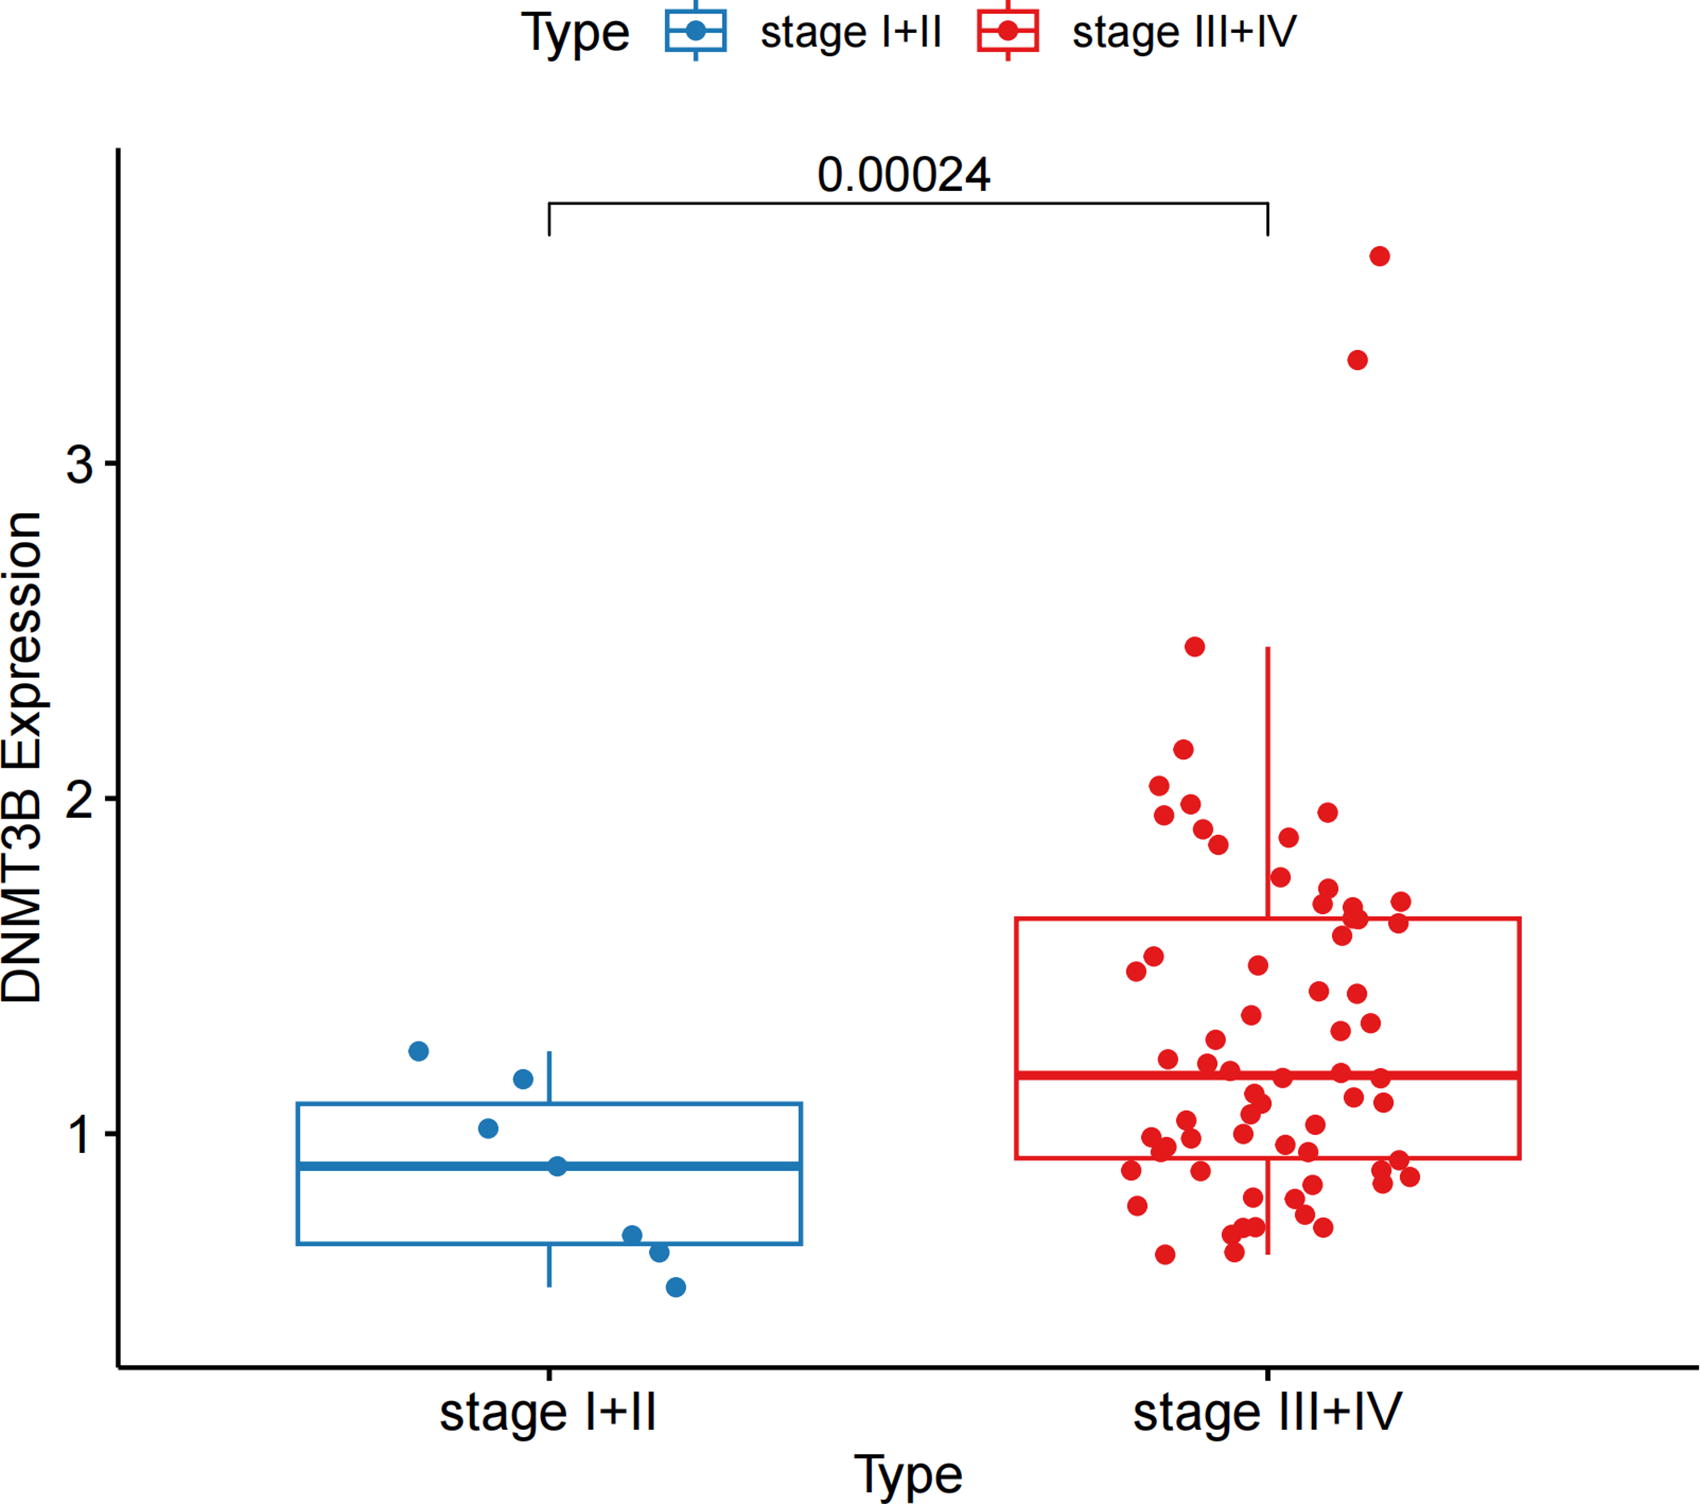
Boxplot of DNMT3B expression levels in NPC tissues stratified by clinical stage. Blue boxes represent Stage I+II, whereas red boxes represent Stage III+IV. The horizontal line within each box indicates the median value, the box itself encompasses the interquartile range (IQR) representing the middle 50% of the data distribution, and the vertical lines (whiskers) extend to the 2.5th and 97.5th percentiles, indicating the range of 95% of the data points. DNMT3B, DNA methyltransferase 3B; NPC, nasopharyngeal carcinoma.
Discussion
NPC is one of the most prevalent malignant tumors in the head and neck region. Despite advancements in radiotherapy and combined chemoradiotherapy techniques that have somewhat improved NPC prognosis, the disease remains highly aggressive, with a tendency for early metastasis and recurrence. 9 It is important to note that the early symptoms of NPC are often nonspecific, leading to late-stage diagnosis and poor long-term outcomes for patients.
The study found that MCT1 is highly expressed in both NPC tissues and cells, whereas its expression is downregulated in normal nasopharyngeal tissues. In NPC cell lines, DNMT3B can specifically bind to hypermethylated DNA fragments on the MCT1 promoter CpG island, with the binding site located 80 bp upstream of the MCT1 promoter CpG island. Overexpression of DNMT3B increases the methylation level of MCT1 and downregulates its expression, indicating that MCT1 is upregulated in NPC due to hypomethylation in its promoter region. This upregulation can be reversed by promoting methylation in this region. Treatment of NPC cell lines with MCT1 siRNA resulted in the downregulation of both MCT1 mRNA and protein expression. Low MCT1 expression was found to inhibit the migration and invasion capabilities of NPC cells. These findings demonstrate that MCT1 plays a significant role in the development of NPC and is associated with DNA methylation. Further investigation into the mechanisms by which MCT1 affects NPC cell migration and invasion revealed that low MCT1 expression inhibits these processes by suppressing the NF-κB and PI3K/AKT/mTOR signaling pathways.
To advance the diagnosis and treatment of NPC while reducing its incidence and mortality, this study builds on previous research to analyze MCT1 expression in NPC and normal nasopharyngeal tissues. The findings confirm that MCT1 is significantly overexpressed in NPC tissues compared with normal tissues. Immunohistochemical analysis revealed a correlation between the DNMT3B and MCT1 expression. Transfection of NPC cell lines with a DNMT3B overexpression plasmid, followed by the assessment of MCT1 mRNA and protein levels, indicated that DNMT3B overexpression reduces MCT1 expression in NPC cells. ChIP experiments further verified that DNMT3B specifically binds to hypermethylated DNA fragments on the MCT1 promoter CpG island. These results suggest that MCT1 overexpression in NPC is due to abnormal hypomethylation of the promoter CpG island, reversible by DNMT3B. Moreover, MCT1 siRNA treatment of NPC cell lines, demonstrated by cell scratch and Transwell assays, inhibited migration and invasion of NPC cells and significantly reduced levels of AKT, NF-κB, mTOR, and their phosphorylated proteins, indicating that reduced MCT1 expression exerts antitumor effects by inhibiting the NF-κB and PI3K/AKT/mTOR signaling pathways.
In this study, NPC cell lines treated with MCT1 siRNA showed downregulation of MCT1 mRNA and protein, which was linked to decreased migration and invasion capabilities of NPC cells. Zhang et al. observed that MCT1 downregulation significantly reduces p-AKT and p-PI3K levels in NPC cell lines without affecting AKT and PI3K levels. 8 Conversely, MCT1 overexpression increased p-AKT and p-PI3K levels. Treatment with the PI3K inhibitor LY294002 inhibited NPC cell invasion and metastasis, and the combined application of MCT1 siRNA and LY294002 further enhanced this effect. Therefore, MCT1 downregulation may suppress NPC cell invasion and metastasis by inhibiting the PI3K/AKT signaling pathway. The findings confirm that MCT1 knockdown reduces NPC cell migration and invasion, likely by inhibiting the NF-κB and PI3K/AKT/mTOR signaling pathways.
The regulatory role of MCT1 in cancer metabolism and progression extends beyond NPC, with notable parallels and distinctions observed in other malignancies. In breast cancer, MCT1 overexpression facilitates lactate export, sustaining glycolytic metabolism and acidifying the tumor microenvironment to promote invasion and chemoresistance. 10 Similarly, colorectal cancer studies highlight MCT1 as a poor prognostic marker linked to PI3K/AKT/mTOR pathway activation, mirroring the findings in NPC. 11,12 However, unlike NPC, where MCT1 promoter hypomethylation drives its upregulation, breast and colorectal cancers often exhibit MCT1 dysregulation via hypoxia-inducible factor 1α (HIF-1α)-mediated transcriptional activation or post-translational modifications. 13 This underscores tissue-specific epigenetic mechanisms in MCT1 regulation. Metabolic reprogramming, a hallmark of cancer, is central to the oncogenic role of MCT1. In glioblastoma, MCT1-mediated lactate shuttling supports metabolic symbiosis between glycolytic and oxidative tumor cells, fostering aggression. 10,14 In NPC, the data suggest that MCT1-driven lactate transport may similarly sustain glycolytic flux, enabling NF-κB and PI3K/AKT/mTOR activation to enhance migration and invasion. Notably, while MCT1 inhibition disrupts glycolysis-linked pathways across cancers, NPC uniquely exhibits DNMT3B-dependent methylation as a reversible regulatory layer—a finding absent in breast or colorectal models. This positions DNMT3B as a novel epigenetic modifier in NPC metabolism, offering a distinct therapeutic avenue. These comparisons emphasize that the role of MCT1 in metabolic adaptation is conserved, yet its regulatory mechanisms vary across malignancies. Targeting MCT1 in NPC may thus require combinatorial strategies addressing both methylation and metabolic pathways, informed by tissue-specific contexts.
The interplay between MCT1-mediated lactate transport and oncogenic signaling pathways is increasingly recognized as a critical driver of tumor progression. Recent studies reveal that lactate, exported via MCT1, not only acidifies the tumor microenvironment but also acts as a signaling molecule to activate NF-κB and PI3K/AKT/mTOR cascades through distinct molecular mechanisms. For instance, lactate stabilizes HIF-1α by inhibiting prolyl hydroxylase activity, thereby amplifying NF-κB transcriptional activity and upregulating pro-metastatic genes such as MMP9 and VEGF. 15 In NPC, the data demonstrate that MCT1 silencing reduces phosphorylation of NF-κB (p65) and AKT (Ser473), suggesting that lactate may serve as a paracrine signal to sustain these pathways. Notably, a study identified IL-6 as a key mediator linking MCT1 to NF-κB activation in colorectal malignant tumors as follows: lactate-induced IL-6 secretion activates STAT3, which synergizes with NF-κB to promote EMT and invasion. 16 These findings align with the observation that MCT1 knockdown disrupts mTOR signaling, highlighting a multilayered regulatory network where lactate coordinates metabolic and transcriptional reprogramming. The work extends this paradigm to NPC by demonstrating DNMT3B-mediated epigenetic control of MCT1, thereby linking DNA methylation to lactate-driven pathway activation—a mechanism underexplored in prior studies.
The reversibility of promoter methylation in cancer remains a topic of active debate. While DNMT inhibitors such as 5-aza-2′-deoxycytidine have demonstrated the capacity to reverse methylation-mediated gene silencing in hematological malignancies and colorectal cancer, 17,18 the plasticity of methylation patterns in solid tumors like NPC is less understood. For instance, studies in lung adenocarcinoma report stable hypermethylation of tumor suppressor genes despite DNMT3B knockdown, suggesting tissue-specific epigenetic rigidity. 19 Conversely, the data reveal that DNMT3B overexpression robustly increases MCT1 promoter methylation and suppresses its expression in NPC cells, indicating that MCT1 hypomethylation in NPC is reversible through targeted epigenetic modulation. This aligns with findings in glioblastoma, where DNMT3B-driven methylation dynamically regulates metabolic genes like LDHA. 20 However, conflicting evidence exists as follows: a recent study in oral squamous cell carcinoma observed no significant changes in MCT1 methylation following DNMT3B manipulation, underscoring context-dependent regulatory mechanisms. The work resolves this controversy in NPC by demonstrating that DNMT3B directly binds to and methylates the MCT1 promoter, thereby establishing its reversible nature in this malignancy. These findings highlight the need for further investigations into tissue-specific epigenetic dynamics and their therapeutic implications.
The aberrant activation of the NF-κB and PI3K/AKT/mTOR signaling pathways significantly contributes to the progression of various solid tumors, including NPC. Their involvement in NPC development and progression is well-established. 21 NF-κB pathway activation is closely linked to persistent EBV infection, nasopharyngeal epithelial cell immortalization, immunosuppressive environment formation, tumor stem cell generation, and metabolic reprogramming. 22 In this study, downregulation of MCT1 in NPC cell lines resulted in significant reductions in NF-κB and p-NF-κB levels, suggesting that MCT1 promotes oncogenesis by activating the NF-κB pathway. Fibroblast growth factor 2, an upstream molecule in the PI3K/AKT pathway, plays a critical role in the accumulation of tumor-infiltrating myeloid-derived suppressor cells, metabolic reprogramming of NPC cells, and cancer cell metastasis. 23 mTOR, a serine/threonine kinase and key regulator of cellular metabolism, is regulated upstream by the PI3K/AKT pathway. 24,25 PKB, mTOR, and PI3K are significantly upregulated in NPC tissues, with significantly higher positive rates than in normal tissues. COX regression analysis identifies PI3K, PKB, and mTOR expression as major prognostic risk factors for NPC. 26,27 The experiments also confirmed that silencing MCT1 in cancer cells significantly downregulated mTOR and p-mTOR protein levels, along with AKT and p-AKT levels, compared with controls. Thus, the overexpression of MCT1 in NPC appears to promote cancer cell migration and invasion by activating the PI3K/AKT/mTOR pathway. Targeting the NF-κB and PI3K/AKT/mTOR pathways may offer a promising therapeutic strategy for NPC.
Conclusions
In conclusion, the study demonstrates that MCT1 is highly expressed in NPC tissues and cells, closely associated with hypomethylation of its promoter region. Elevated DNMT3B levels can enhance the methylation of the MCT1 promoter, thereby downregulating MCT1 expression and identifying specific DNMT3B binding sites on the MCT1 promoter CpG island. In addition, silencing MCT1 inhibited the migration and invasion of NPC cells by downregulating NF-κB and PI3K/AKT/mTOR signaling pathways. These findings suggest that MCT1 may have the potential to serve as a biomarker for NPC invasion and metastasis and a candidate therapeutic target. However, this study has limitations, including the modest clinical sample size (n = 30), the absence of DNMT3B knockdown experiments, and a lack of in vivo validation. Future work should prioritize larger-scale clinical cohorts, functional studies using DNMT3B loss-of-function models, and preclinical animal experiments to elucidate the mechanistic and therapeutic relevance of the MCT1-DNMT3B axis. In addition, combinatorial strategies targeting MCT1 alongside existing therapies should be explored to evaluate synergistic efficacy.
Footnotes
Authors’ Contributions
T.W. wrote the manuscript and conducted the experiment. Z.Z. conducted the literature review, and Z.R. reviewed the manuscript, and W.Z. was responsible for the sorting out of the experimental data. Z.J. provided the main idea of this study.
Author Disclosure Statement
The authors declare that they have no competing interests.
Funding Information
No funding was received for this article.