
Abstract
Abstract
The epigenetic reprogramming of the donor cell nucleus is an important factor in the development of embryos and production of normal offspring derived by somatic cell nuclear transfer (NT-SC). During early development, a dramatic reduction in methylation levels occurs in mouse. In early embryos, this process makes it possible to erase gamete-specific methylation patterns and induce de novo methylation at defined developmental time-points. To clarify changes in DNA methylation in bovine NT-SC embryos, we examined satellite I sequences in bovine embryos derived in vivo (Vivo) and by NT-SC at the blastocyst (BC) and elongated (EL) stages. Because the EL stage embryo consists of the embryo disc (ED) and trophectoderm (TE), the methylation status of each part was analyzed with respect to the progress of differentiation. DNA methylation levels in Vivo embryos were increased during the elongation stage. In contrast, DNA methylation levels in NT-SC embryos remained unchanged in the ED and significantly decreased in the TE. Real-time PCR analysis showed that Dnmt-1 expression in BC embryos derived by NT-SC was significantly lower than that in Vivo embryos; thus, differences in the DNA methylation status may reflect transcript levels of Dnmt-1. Our results suggest that the aberrant methylation level of bovine NT-SC embryos in the satellite I region is corrected as a result of demethylation and retention of methylation as the embryo develops and differentiates.
Introduction
The characteristics of gene transcription in NT-SC embryos can be attributed to abnormalities in the control system for gene expression such as DNA methylation (Kang et al., 2001, 2002, 2005) and acetylation of histones (Enright et al., 2005). Recently, it was clearly demonstrated in mice that epigenetic modifications are closely related to the rate of success of cloning (Kishigami et al., 2006; Rybouchkin et al., 2006). Kang et al. (2001, 2002) reported that various genomic repeated sequences including the satellite I were barely demethylated in BC stage NT-SC bovine embryos. The methylation patterns observed in NT-SC embryos closely resembled those in donor cells, but were quite different from those in normal embryos produced in vivo or in vitro. These findings in NT-SC embryos at the BC stage led us to expect dysregulation of epigenetic modifications, such as DNA methylation, in the resulting transcription of developmentally crucial genes at this stage.
The fertilized embryo first undergoes a wave of demethylation during preimplantation development; the BC embryo is thus relatively undermethylated. After the BC stage, the embryo undergoes a wave of de novo methylation that establishes a new embryonic methylation pattern (Howlett and Reik, 1991; Kafri et al., 1992; Monk et al., 1987). Although the establishment of the DNA methylation pattern in NT-SC embryos is not clear, it is possible that changes in the DNA methylation status in NT-SC embryos between the BC and EL stages is in part responsible for the normalization of gene transcription. The objectives of this study were to evaluate changes in the DNA methylation status of NT-SC embryos that had developed to the EL stage and to clarify changes in DNA methylation levels from the BC to the EL stage. Furthermore, to clarify the mechanism whereby DNA methylation is regulated in bovine embryos, we determined the frequencies and relative abundances of gene transcripts of DNA methyltransferase (Dnmt) in bovine NT-SC and Vivo embryos using the sensitive real-time polymerase chain reaction (PCR) method.
Materials and Methods
All experiments used animals were approved by the Animal Ethics Committee, Hokkaido Animal Research Center in Shintoku, Japan.
Nuclear transfer and embryo culture
Bovine fibroblast cells for NT-SC were collected from skin tissue biopsied from a calf ear. The tissue was minced, washed, and then plated in Dulbecco's Modified Eagle's Medium (DMEM; high glucose; Invitrogen, Carlsbad, CA) supplemented with 10% fetal calf serum (FCS; Roche Diagnostics, Tokyo, Japan) and cultured until fibroblast cells outgrowth appeared. Primary cells were cultured in DMEM with 10% FCS for up to four passages. Prior to NT-SC, fibroblast cells at 50–70% confluence were further cultured for 4–5 days in serum-depleted medium (DMEM with 0.5% FCS). In vitro maturation of oocytes, NT-SC, and embryo culture were essentially performed as described previously (Sawai et al., 2005). Briefly, cumulus–oocyte complexes obtained from bovine ovaries were matured in IVMD-101 medium (Research Institute for the Functional Peptides, Yamagata, Japan) (Abe et al., 1999) at 39°C in 5% CO2 in air for 22 h. After in vitro maturation, oocytes were enucleated by removing the first polar body and the metaphase II plate in a small amount of surrounding cytoplasm. A single bovine fibroblast cell was inserted into the perivitelline space of the enucleated oocyte. Recipient oocyte–cell complexes were pulsed with two direct current electric pulses of 20 V/150 μm for 50 μsec with a 1-sec interval, and then treated with 10 μg/mL of cycloheximide (Sigma-Aldrich, St. Louis, MO) for 5 h. Following NT-SC, embryos were cultured in modified TALP (mTALP) medium (Bavister et al., 1983) with 0.1% BSA (Sigma) at 39°C in 5% CO2, 5% O2, and 90% N2. On day 2 (NT-SC = day 1), embryos were transferred to mTALP supplemented with 3% new born calf serum (Invitrogen) and subsequently cultured at 39°C in 5% CO2, 5% O2, and 90% N2 until day 8.
Embryo transfer, production of in vivo embryos, and recovery of elongated embryos
Transfer of NT-SC embryos and their recovery from recipient cows were performed essentially as described previously (Sawai et al., 2007). Briefly, recipient cows for embryo transfer were estrus-synchronized by administration of a CIDR device (EAZI-Breed; InterAg, Hamilton, New Zealand) for 7–14 days and an injection of PGF2α (cloprostenol 0.5 mg, Resipron-C; Teikoku Hormone, Tokyo, Japan) 1 day before removal of the device. A total of 25 NT-SC embryos at the BC stage were nonsurgically transferred to five recipients (five embryos per recipient) 6–7 days after estrus. On day 16 (NT-SC = day 1), EL embryos were recovered nonsurgically by uterine flushing using a Foley catheter (20 French gauge).
Vivo embryos were obtained from donor cows that had been treated for superovulation and artificial insemination (AI) using methods described previously (Sawai et al., 2007). Briefly, a total of 20 IU of FSH (Antorin; Denka Pharmaceutical, Kanagawa, Japan) was given to the donors twice daily in decreasing doses over 3 days. To induce luteolysis, PGF2α was injected on the third day of superovulation. Donors were bred by AI at 12–24 h after the onset of estrus. On day 8 and day 16 (AI = day 1), BC and EL embryos were nonsurgically recovered from 3 (day 8) or 4 (day 16) donor cows by uterine flushing using a Foley catheter (20 French gauge).
Recovered EL embryos were transferred to PBS containing 1% polyvinyl pyrrolidone (PVP; Sigma). Recovered embryos in which we could identify both the trophoblast (TE) and the embryo disc (ED) were used for analysis. Using a surgical knife under a stereomicroscope, EL embryos were then divided into two parts: a TE and a ED region. The TE region was divided into several pieces, approximately 3–5 mm in width. Pieces of TE and ED from single EL embryos were washed three times in 1% PVP–PBS.
Bisulfite treatment, PCR, and digestion with restriction enzyme
BC embryos were treated with 0.5% protease (Sigma) in 1% PVP–PBS for 5 min then washed three times in 1% PVP–PBS. Using a microsurgical blade (Feather, Osaka, Japan) under an inverted microscope, some BC embryos were divided into two parts: intact inner cell mass (ICM) with surrounding TE cells, and a TE portion. ICM and TE samples obtained from five different BC embryos were pooled to form single samples. Other BC embryos were not divided into ICM and TE parts, and single embryos were used for DNA isolation. BC (ICM, TE, or intact) and EL (ED or TE pieces) embryos were transferred to 60 μL lysis buffer (GenomicPrep Cells and Tissue DNA Isolation Kit; Amersham Biosciences, Piscataway, NJ), and stored at room temperature. Genomic DNA was isolated using a GenomicPrep Cells and Tissue DNA Isolation Kit (involving RNase A treatment and removal of cytoplasmic and nuclear proteins) according to the manufacturer's instructions. Genomic DNA obtained from single BC and EL stage embryos were diluted in 10 and 20 μL of Tris-EDTA buffer, respectively, and stored at −30°C. Bisulfite modification of genomic DNA and purification of modified DNA were performed using a CpGenome DNA Modification Kit (Millipore, Billerica, MA) according to the manufacturer's instructions. Briefly, 10 μL genomic DNA dilution was dissolved to obtain a final volume of 100 μL with DEPC-treated water, and then denatured with 0.2 M NaOH. Bisulfite modification was initiated by adding 550 μL of freshly made 3 M sodium bisulfite (pH 5.0). The reaction mixture was incubated at 50°C for 16 h. Desulfonation was performed with 20 mM NaOH. Following precipitation, the DNA was resuspended in 10 μL of DEPC-treated water.
To amplify part of the satellite I region (Table 1), we used the following programs: preincubation for the activation of TITANIUM Taq DNA polymerase (BD Biosciences, Palo Alto, CA) at 95°C for 1 min, followed by 40 cycles of denaturation at 95°C for 30 sec, annealing of primers at 50°C for 30 sec, and elongation at 68°C for 1 min. Ten microliters of the amplified PCR products was digested with 5 U of the restriction enzyme AciI (New England Biolabs, Tokyo, Japan) overnight at 37°C, and resolved on 12% polyacrylamide gel. Band intensity was calculated using an image analyzer and software (RFLPscan; ver. 3.12, CSP Inc., Billerica, MA).
Primer orientations: F, forward; R, reverse.
Determination of relative abundances of gene transcripts in bovine embryos
The basic protocol used to determine the relative abundance of the gene transcripts was described previously (Sawai et al., 2005, 2007). BC embryos were treated with 0.5% protease in 1% PVP–PBS for 5 min, and then washed three times in 1% PVP–PBS. Single BC embryos were added to 5 μL lysis buffer [0.8% Igepal (ICN Biomedical Inc., Aurora, OH), 5 mM DTT (Invitrogen), and 1 U/μL of RNAsin (Promega, Madison, WI)], snap-frozen in liquid nitrogen, and stored at −80°C. Total RNA was isolated from TE and ED using an RNeasy Mini Kit (Qiagen, Tokyo, Japan) according to the manufacturer's instructions, and stored at −80°C.
RNA samples were heated to 80°C for 5 min, transferred directly to ice, and treated with 1 U/μL of DNase I (Invitrogen) for 15 min at room temperature. For inactivation of the DNase I, 1 μL of 25 mM EDTA was added to the samples and heated for 10 min at 65°C. The following were added to the tube; 5 × RT buffer, 0.1 M DTT, oligo(dT)15 primer (0.5 μg/μL; Promega), 10 mM dNTP mix (Invitrogen), and RNasin, and the tube was heated at 65°C for 5 min. After denaturation, samples were kept at 37°C for 10 min, 100 U of reverse transcriptase (SuperScript H- RT; Invitrogen) was added, and the mixture was then incubated at 37°C for 60 min and denatured at 99°C for 5 min. The reaction mixture was diluted to obtain a final volume of 20 μL with DEPC-treated water.
PCRs were conducted in a LightCycler (Roche) and products were detected with SYBR Green, which is included in the QuantiTect SYBR Green PCR master mix (Qiagen). For each quantification, 2 μL of the RT product was used. The amplification programs were as follows: preincubation to activate HotStarTaq DNA polymerase (Qiagen) at 95°C for 15 min, followed by 50 cycles of denaturation at 94°C for 15 sec, annealing of primers at different temperatures (Table 1) for 30 sec, and elongation at 72°C for 30 sec. After the end of the last cycle, a melting curve was generated by starting fluorescence acquisition at 65°C and taking measurements every 0.2°C until 95°C was reached. A standard curve was generated by amplifying serial dilutions of a known quantity of amplicons. Amplicons consisted of purified PCR products that were electrophoresed, and a specific band for each of the genes studied was extracted from the gel using a QIAquick gel extraction kit (Qiagen). The purified PCR products were quantified by measuring absorbance at 260 nm and diluted. Serial 10-fold dilutions for creating a standard curve were amplified in every real-time PCR run. The standards and cDNA samples were then coamplified in the same reaction prepared from a master mix. Fluorescence was acquired at each cycle to determine the threshold cycle (Ct) or the cycle during the log-linear phase of the reaction at which fluorescence rises above the background for each sample. Final quantification was done using the LightCycler quantification software and results were reported as relative expression after normalization of the amount of transcript to that of glyceraldehyde-3-phosphate dehydrogenase (Gapdh) in the same samples.
Statistical analysis
Methylation status was indicated as the percentage digestion (methylated DNA) of PCR products amplified from the satellite I sequence. Differences in the mean percentages of digestion were analyzed by the Bartlett test, and then compared by the Tukey-Kramer method. Data on mRNA expression levels were analyzed using the Kruskal-Wallis test followed by multiple pairwise comparisons using the Scheffé method. A p-value <0.05 denoted a statistically significant difference.
Results
DNA methylation level in the satellite I region of bovine embryos derived from NT-SC and Vivo
To examine the methylation status of preimplantation stage embryos, genomic DNA was isolated from BC and EL stage embryos (Fig. 1) and treated with bisulfate. Bisulfite treatment causes conversion of unmethylated cytosines to uridine, thereby allowing discrimination between unmethylated and methylated cytosine residues through sequencing or restriction enzyme analysis. For the analysis of the satellite I sequences, a 211-bp segment of the satellite I genomic region that has a highly conserved 12-CpG site (Kang et al., 2001) was amplified by PCR from bisulfate-treated genomic DNA, and the resulting PCR products have two target sequences (CpG-4 and CpG-7) for the AciI restriction enzyme, which recognizes only unconverted 5′-CCGC-3′ (5′-GCGG-3′). Complete digestion yielded 35-, 86-, and 90-bp fragments, and three bands were confirmed by electrophoresis after AciI digestion (Fig. 2).

Representative photographs of bovine BC (

Representative gels showing digestion patterns with AciI. Differences in demethylation levels can be seen between individual BC embryos derived from Vivo or by NT-SC. Numbers show percentage digestion calculated from the summed band intensity of digested fragments (arrowhead). Arrows indicate nondigested fragments.
As shown in Figure 3, the satellite I region in both parts of the TE and the ICM of BC stage embryos were more heavily methylated in NT-SC (61.3 and 63.5%, respectively) than in Vivo embryos (29.7 and 25.7%, respectively). There was no difference in the methylation level of the satellite I sequence between the ICM and TE in either group of embryos. The shift in the methylation level in embryos between the BC stage (day 8) and the EL stage (day 16) is shown in Figure 4. Both ED and TE obtained from Vivo embryos indicated higher (p < 0.01) methylation levels than at the BC stage, and the value for the ED (46.4%) was higher (p < 0.01) than that for the TE (32.0%). In contrast, the methylation level of TE in NT-SC embryos at the EL stage was significantly reduced. The value (37.0%) was lower (p < 0.01) than those for the ED (53.6%) and for BC embryos (51.9%). The methylation level in the ED of NT-SC embryos did not change between the BC and EL stages.
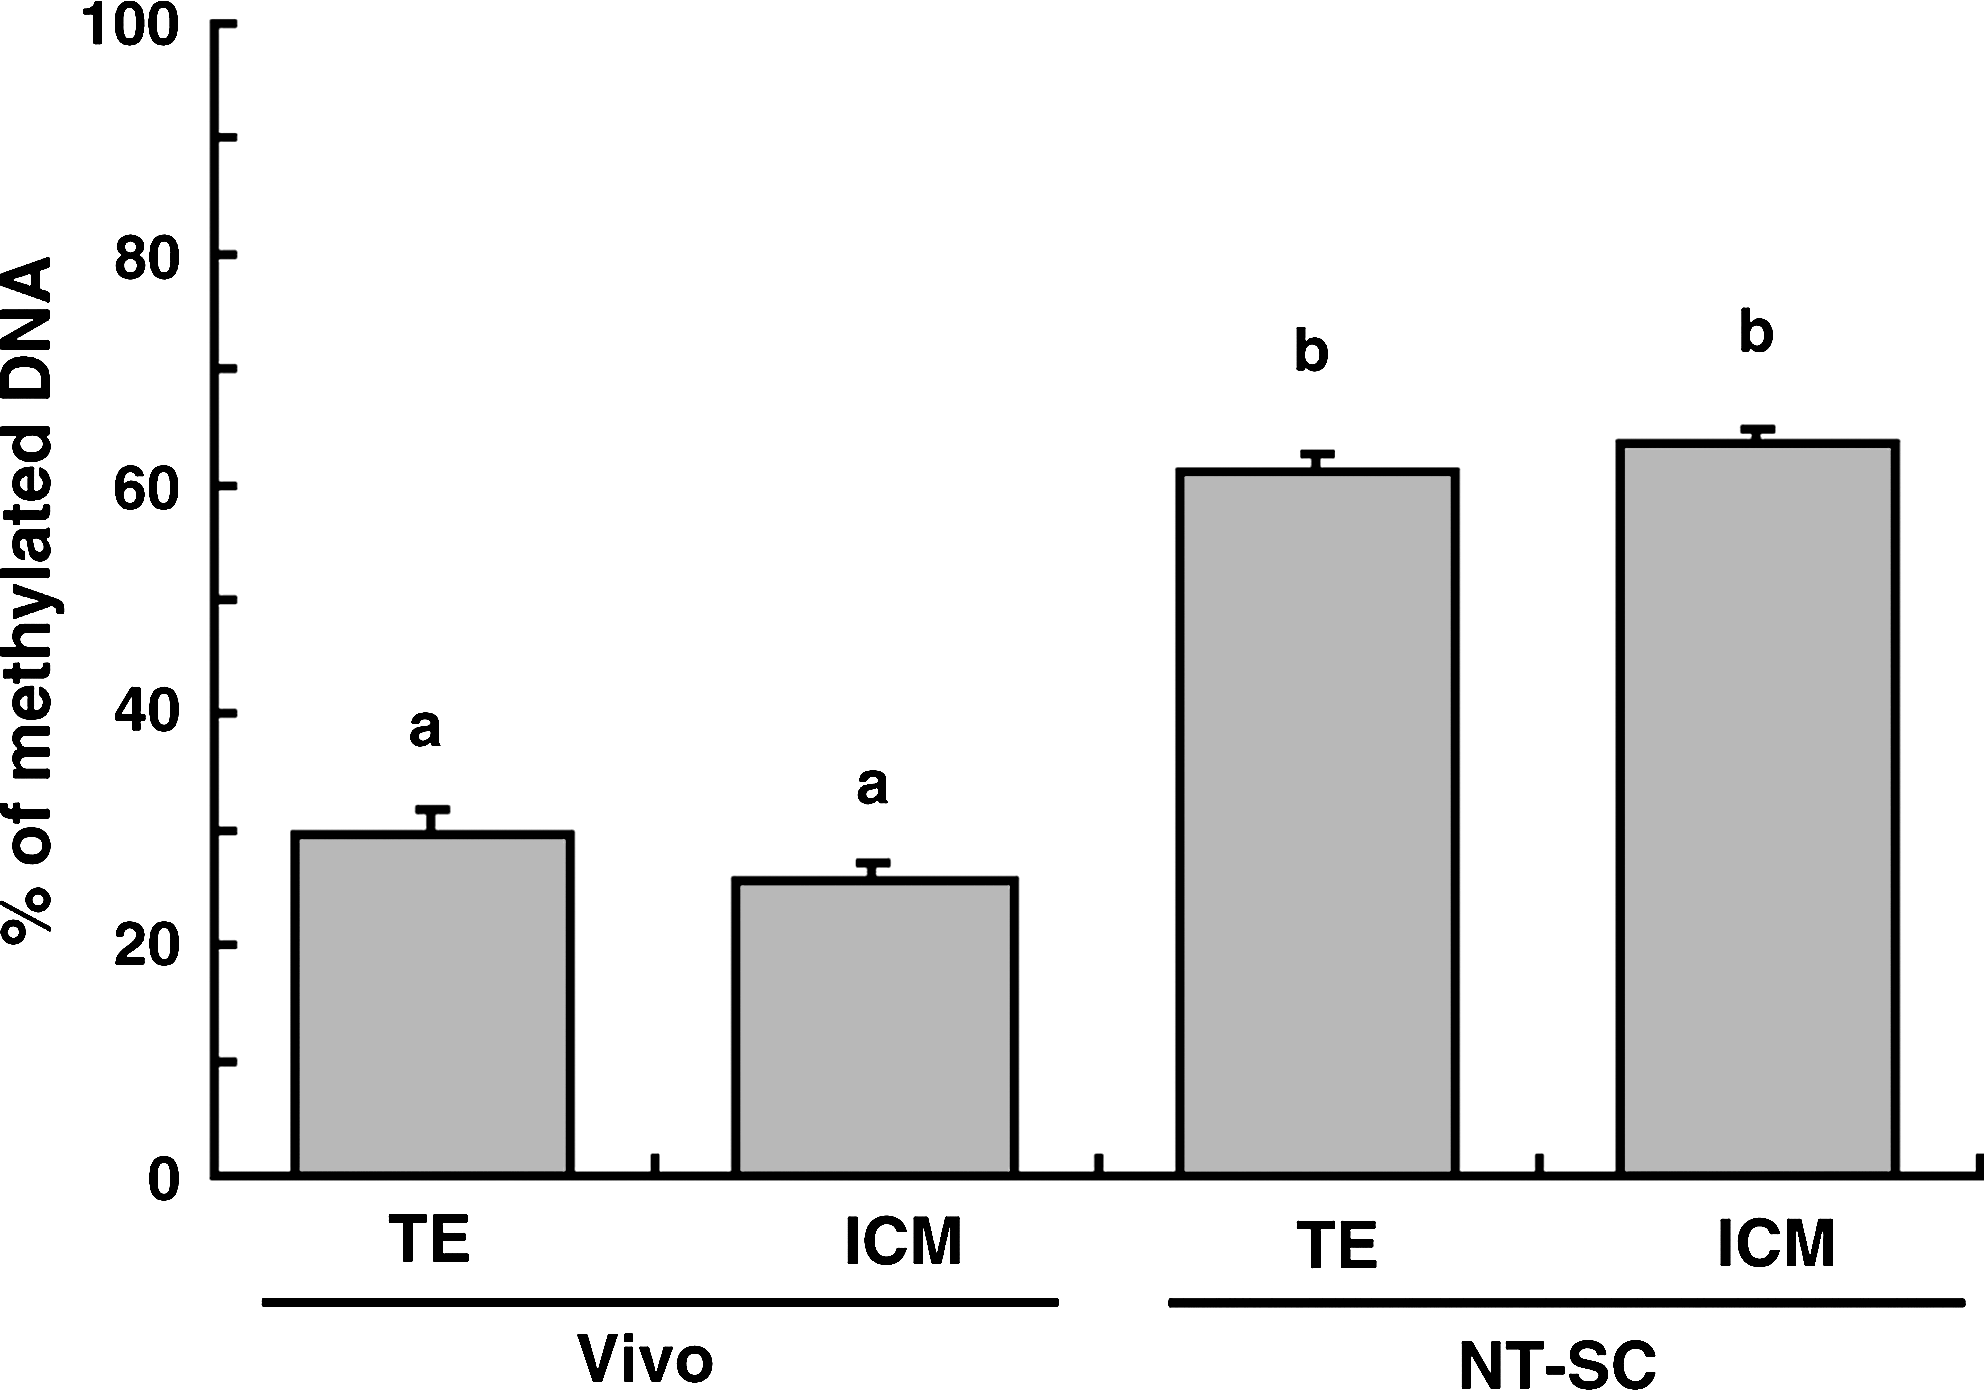
Methylation levels in TE and ICM parts of BC stage embryos derived from Vivo (TE, n = 9; ICM, n = 9) or by NT-SC (TE, n = 5; ICM, n = 5). a,bDifferent superscripts indicate a significant difference (p < 0.01).
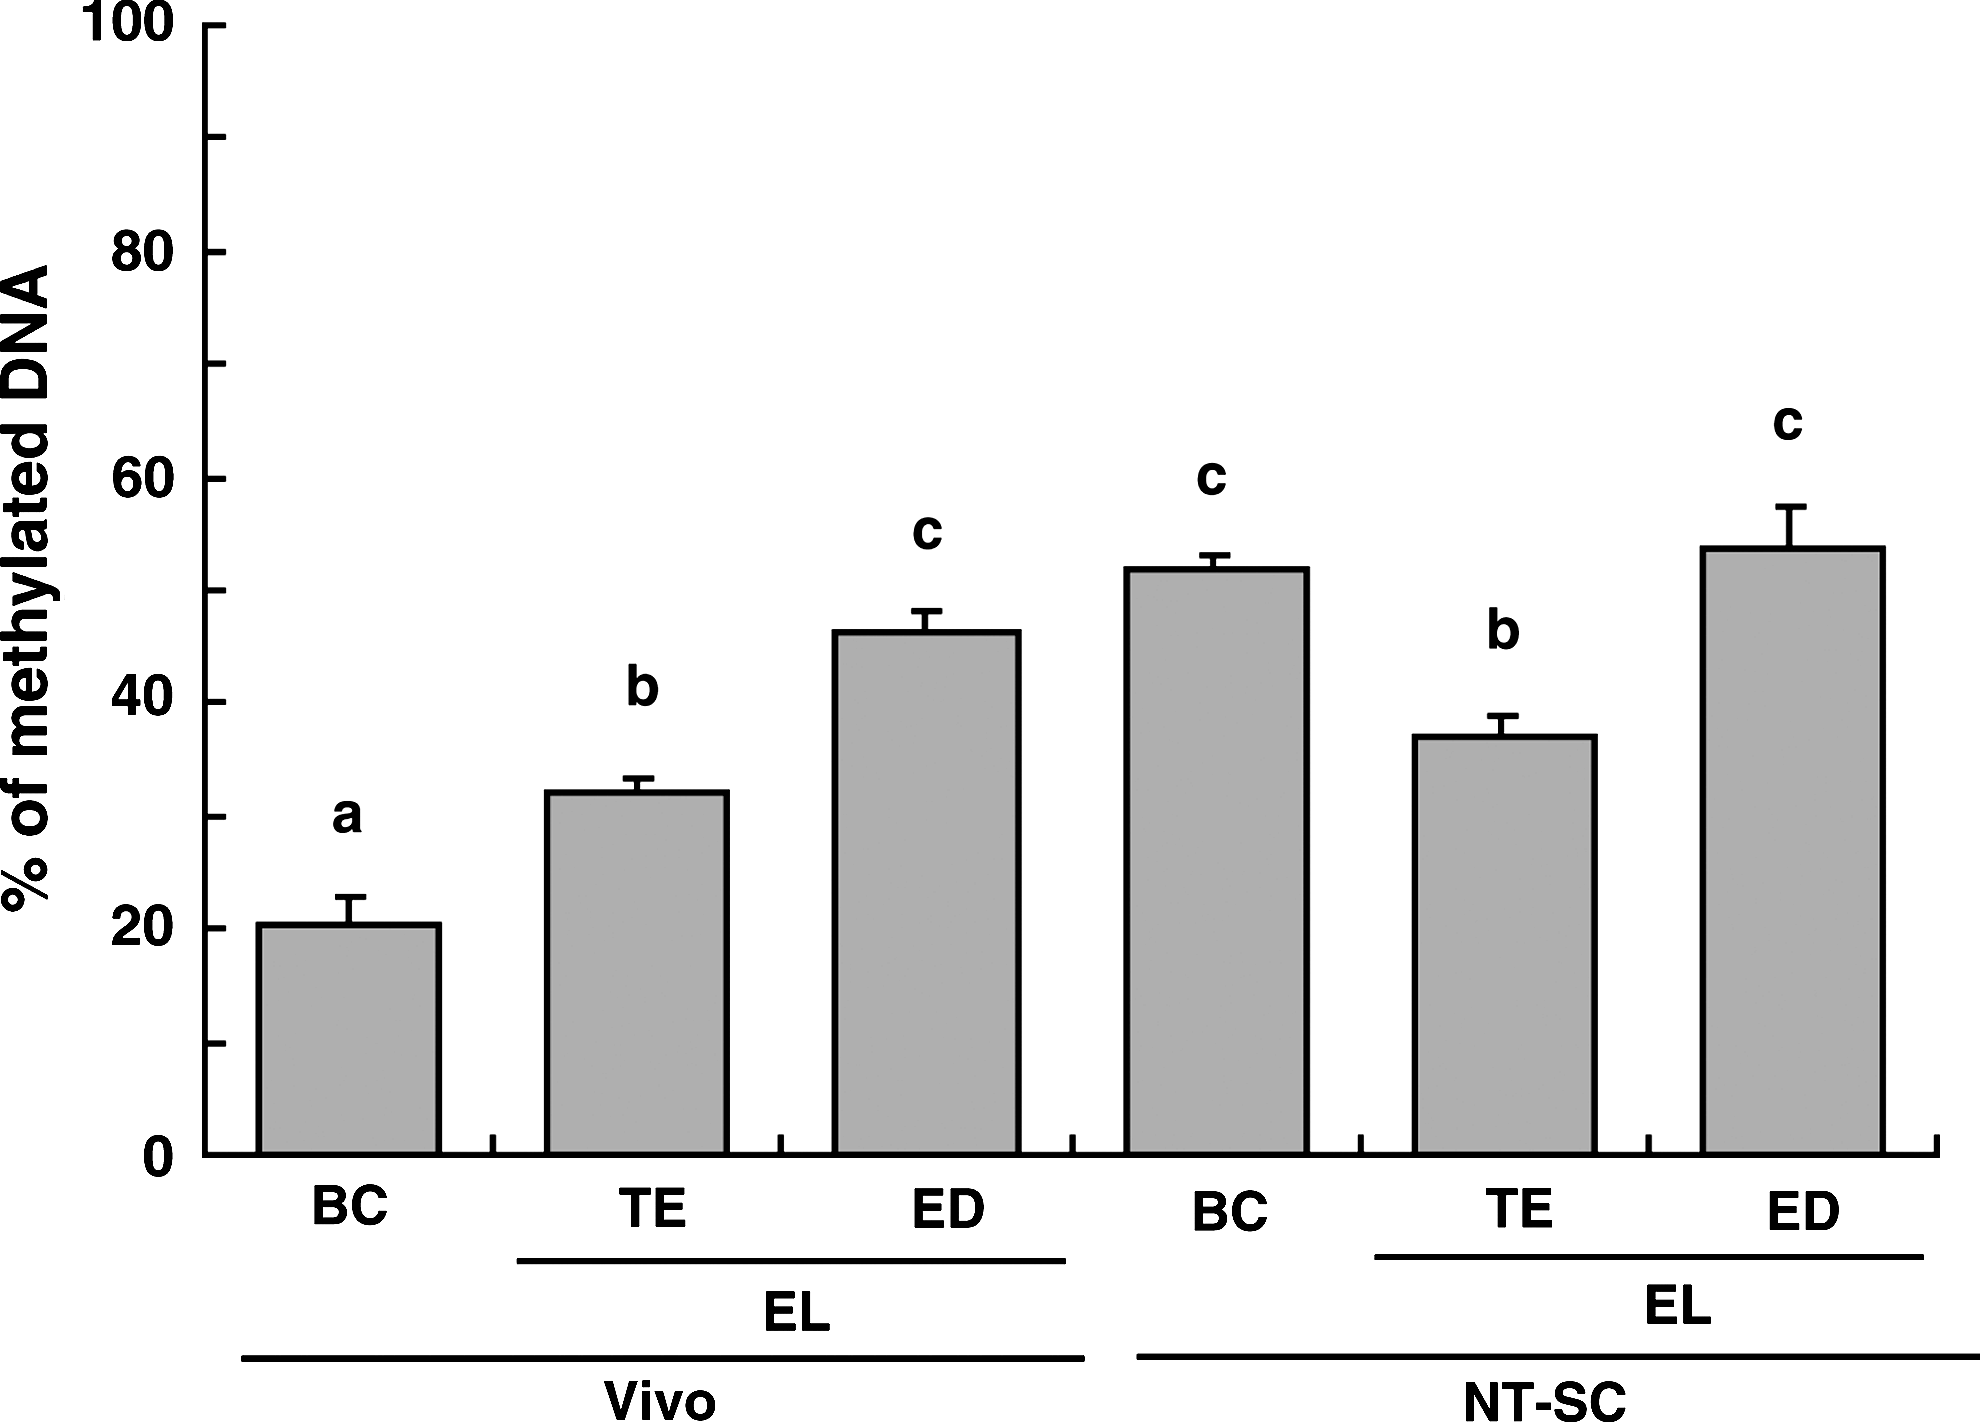
Changes in DNA methylation of bovine embryos derived from Vivo (BC, n = 20; TE, n = 17; ED, n = 17) and by NT-SC (BC, n = 21; TE, n = 13; ED, n = 5). BC embryos were not divided into ICM and TE parts; instead, whole embryos were used for analysis. a,b,cDifferent superscripts indicate a significant difference (p < 0.01).
Relative abundances of Dnmt gene transcripts in bovine embryos
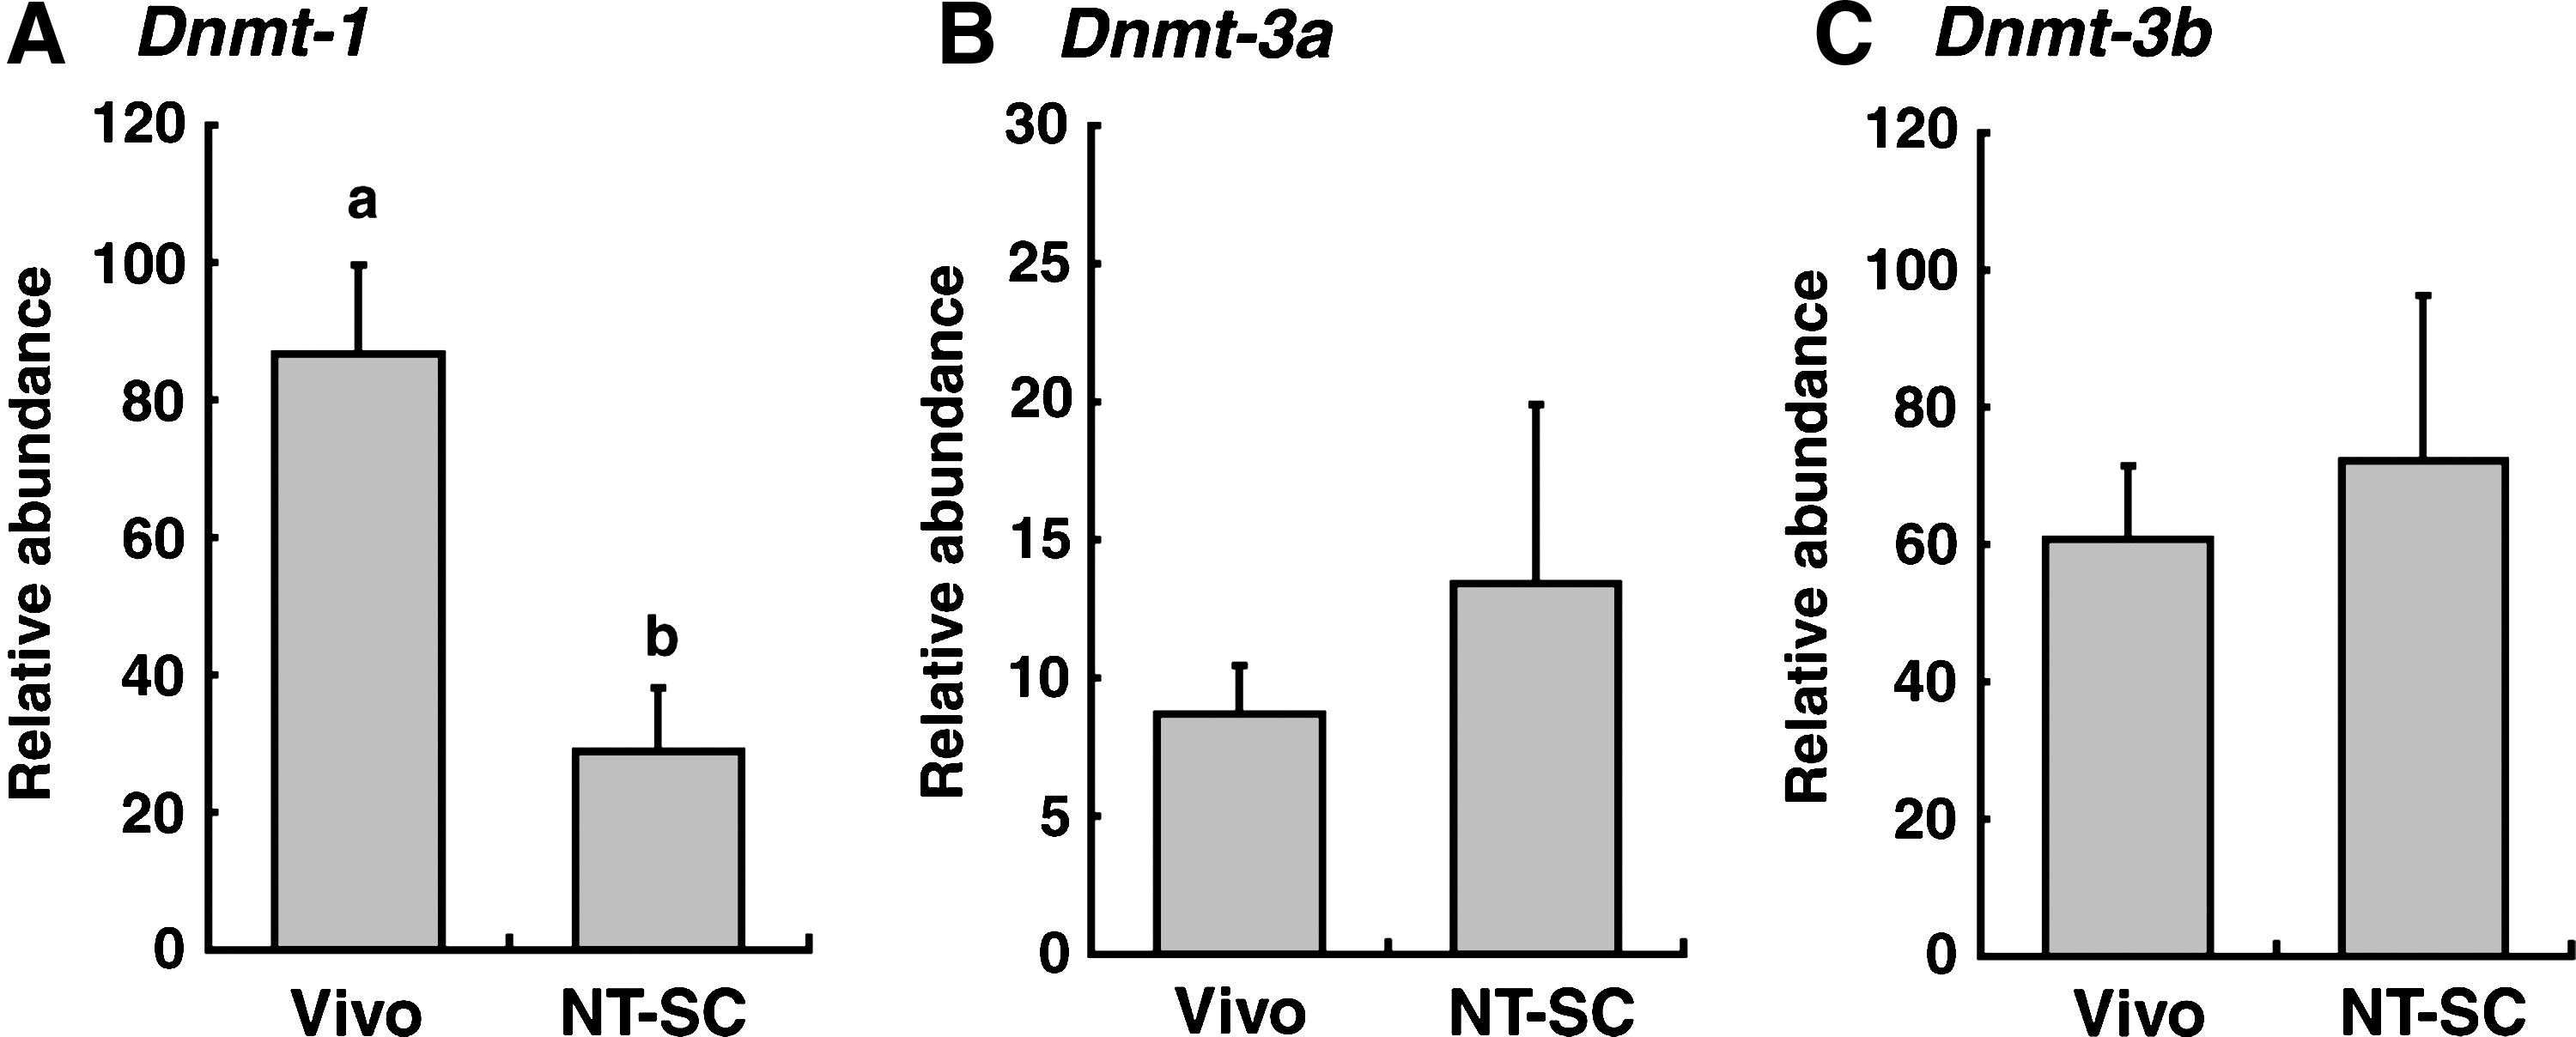
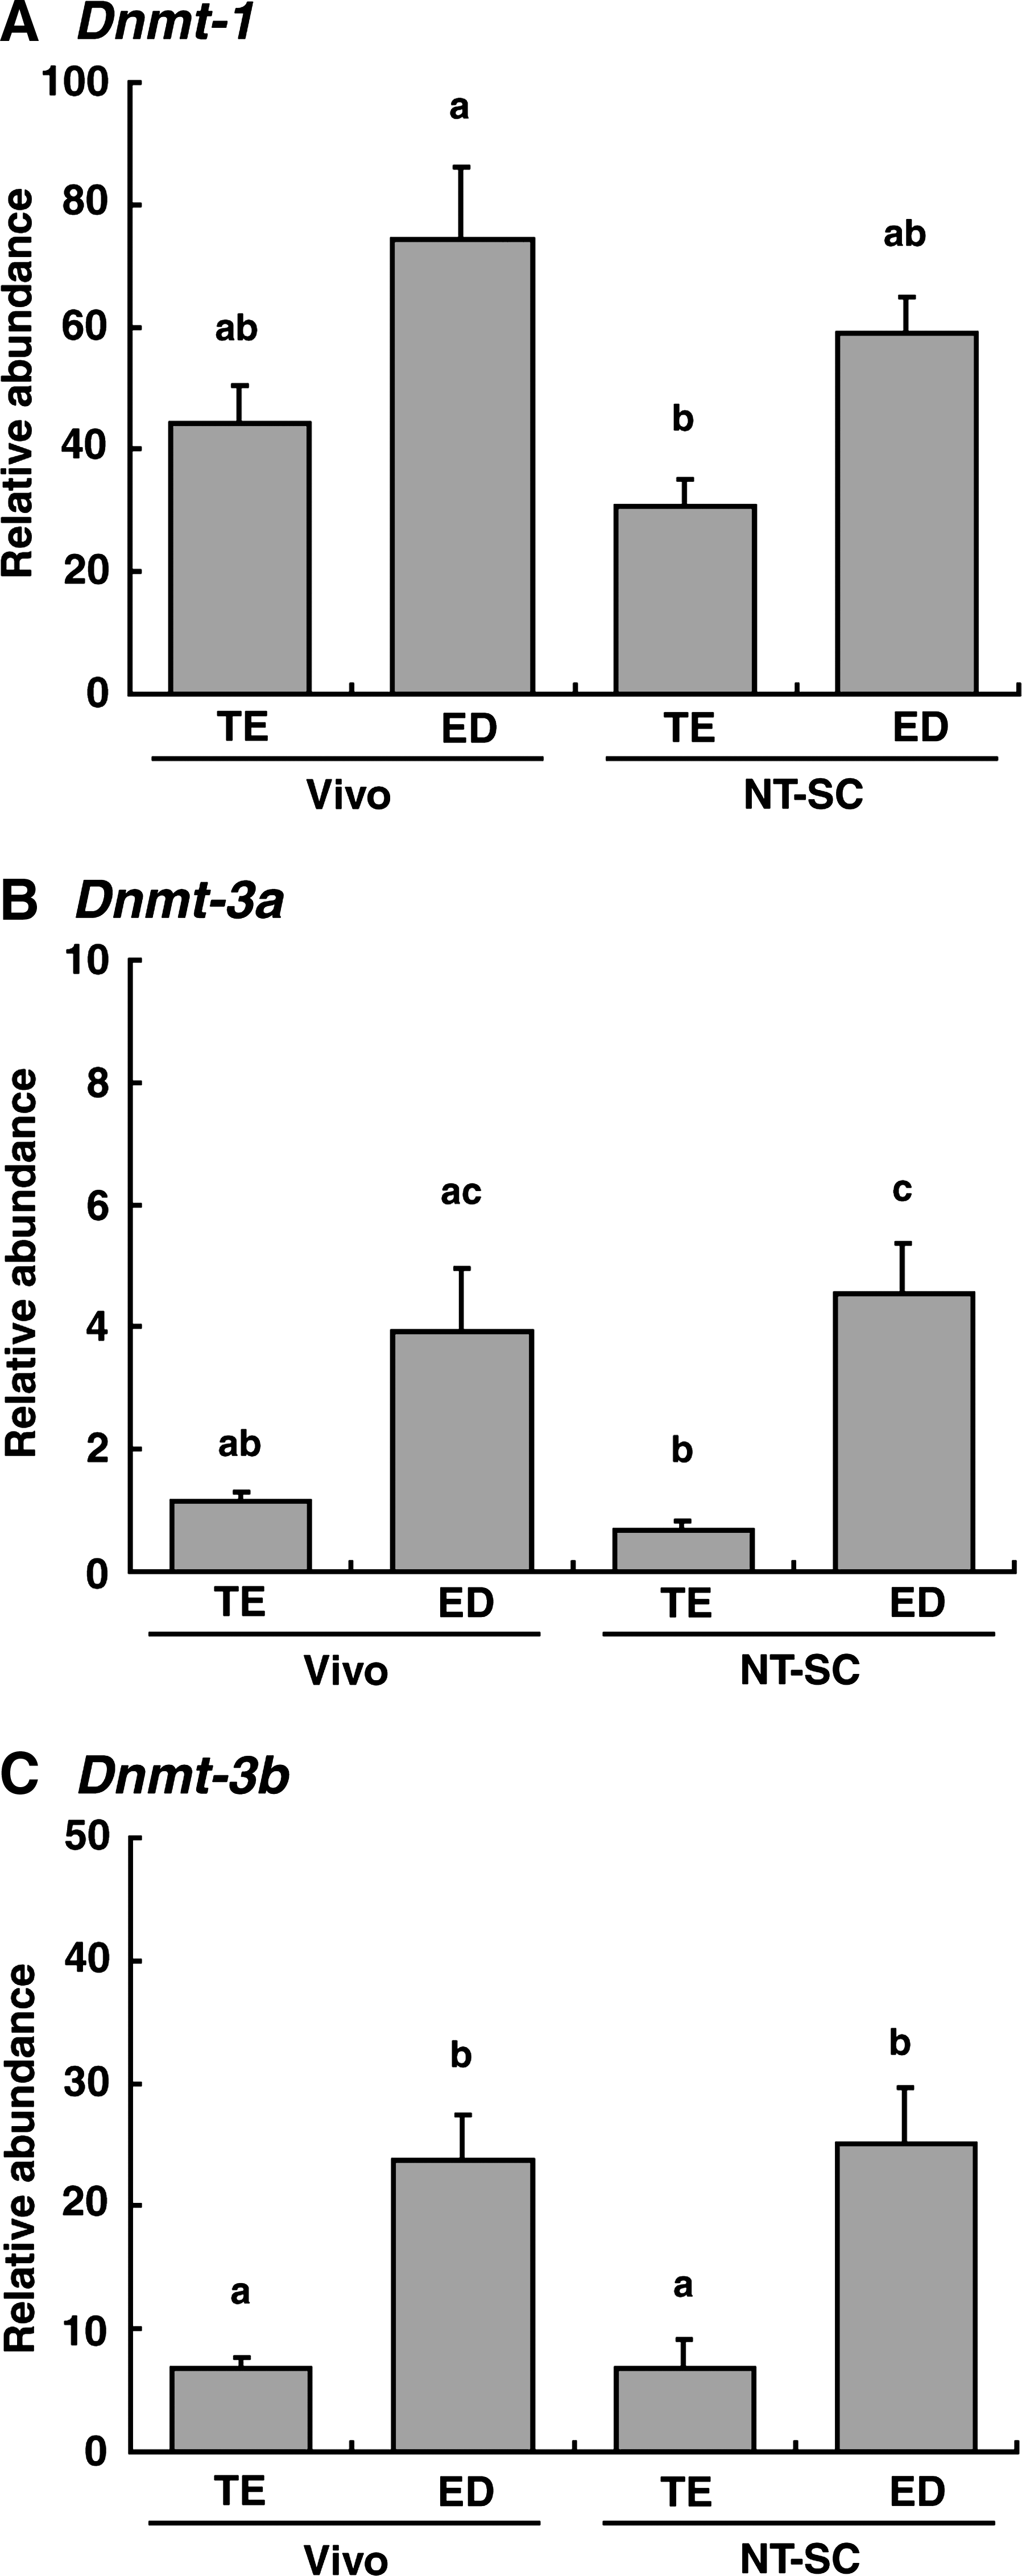
Transcripts of Dnmt-1, -3a, and -3b in bovine embryos at the BC stage are shown in Figure 5. The relative abundance of Dnmt-1 transcript was significantly lower in NT-SC embryos (p < 0.01) than in Vivo embryos (Fig. 5A). The transcript levels of Dnmt-3a and -3b did not differ significantly between NT-SC and Vivo embryos at the BC stage (Fig. 5B and C). Transcript levels of Dnmt genes in EL stage embryos are shown in Figure 6. The levels of Dnmt gene expression in the ED portion were higher than in the TE portion regardless of the origin of the embryos. In particular, the relative abundances of Dnmt-3a and -3b transcripts showed significant (p < 0.01–0.05) differences between the ED and TE (Fig. 6B and C). However, the transcript levels of each gene did not differ significantly between NT-SC and Vivo embryos (Fig. 6).
Relative abundance (mean ± SEM) of (
Relative abundance (mean ± SEM) of (
Discussion
During early development, a dramatic reduction in methylation levels occurs in mouse (Monk et al., 1987). This process of epigenetic reprogramming in early embryos erases gamete-specific methylation patterns in herited from the parents (Howlett and Reik, 1991; Monk et al., 1987; Oswald et al., 2000). NT-SC requires that the epigenetic information of the donor nucleus should be reprogrammed to an embryonic state (Mann et al., 2003), and it is a persuasive argument that aberrant epigenetic reprogramming of the cloned embryo is responsible for the developmental failure of cloned embryos. Genome-wide abnormalities in DNA methylation patterns or cytosine methylation levels after NT-SC have been observed in mice, cattle, and sheep (Beaujean et al., 2004; Bourc'his et al., 2001; Dean et al., 2001; Hiendleder et al., 2004; Kang et al., 2001; Ohgane et al., 2001; Santos et al., 2003). Several investigators have proposed that failure of DNA demethylation causes incomplete nuclear reprogramming in cloned embryos (Bourc'his et al., 2001; Kang et al., 2001, 2002). Although numerous reports have investigated DNA methylation and Dnmt mRNA levels in cloned embryos at the BC stage (Chung et al., 2003; Giraldo et al., 2008; Wrenzycki et al., 2001), little is known about this remodeling process in either Vivo or NT-SC bovine embryos at the EL stage, which is a very important period for cell differentiation before implantation. In the present study, we found that DNA methylation in bovine NT-SC embryos changed to normal levels during elongation after the BC stage.
In normally fertilized embryos, active demethylation of the paternal genome occurs before the first cell division and the maternal genome is progressively demethylated with each cleavage division (Bourc'his et al., 2001; Oswald et al., 2000; Santos et al., 2002). Consequently, the methylation status in normal embryos is at its lowest level at the BC stage. Nevertheless, bovine NT-SC embryos did not appear to undergo further demethylation after the two-cell stage, unlike normally fertilized embryos (Dean et al., 2001). In the present study, BC stage embryos obtained by NT-SC exhibited a significantly higher methylation level of the satellite I sequence than Vivo embryos. This result is consistent with a previous observation of a higher degree of methylation in NT-SC embryos that developed to the BC stage than in IVF and Vivo embryos (Kang et al., 2002). No significant change in the satellite I methylation level was observed in Vivo embryos during the one-cell to BC stages (Kang et al., 2005); the methylation level of this sequence may be maintained at least in this developmental stage. Therefore, the result we obtained in BC stage embryos does not point the abnormality of demethylation ability in NT-SC embryos. Kang et al. (2001) reported that the methylation level of the satellite I region in NT-SC embryos was lower than that in donor cells for NT-SC. A similar finding was obtained in our experiment: the methylation level of the satellite I sequence at the BC stage was significantly lower than that in donor cells (data not shown). These findings suggest that at least part of the demetylation of the donor cell genome occurs in the recipient cytoplast before the BC stage.
Kang et al. (2002) reported that there were significant differences in the methylation level of the satellite I sequence between regions of the NT-SC embryo at the BC stage; the TE was highly methylated compared with the ICM. However, our results indicated no significant difference between the TE and ICM regions at the BC stage. Furthermore, the DNA methylation status of both regions was similar in NT-SC and Vivo embryos. Similarly, there were no differences between the ICM and TE in methylation levels of bovine IVF embryos at the BC stage (Dean et al., 2001). De novo methylation is differentially regulated among the tissue of the conceptus, and embryonic tissue derived from the ICM is hypermethylated compared with extraembryonic tissue from the trophectoderm (Jaenisch, 1997; Li, 2002). Dean et al. (2001) made immunofluoresence observations using anti-5-methyl-cytosine antibodies in bovine IVF embryos, and found that, shortly after demethylation occurred there was a wave of global de novo methylation starting at the 16-cell stage, resulting in the establishment of a new embryonic methylation pattern. In the present study, the methylation level of the satellite I region was observed to increase during the elongation process in Vivo embryos. This increase in the methylation level was thought to be de novo methylation. De novo methylation was observed differentially between the ED and TE regions in EL stage embryos, and the methylation level was higher in the ED than in the TE region. In early embryos, de novo methylation is catalyzed by the Dnmt-3a and -3b (Okano et al., 1999); thus, the difference in the DNA methylation status between these regions may reflect the transcript levels of the Dnmt-3a and -3b genes. Our results indicate clearly that DNA methylation levels of bovine embryos during the BC to EL stages dramatically change in a tissue-dependent as in other spices.
Most interestingly, the DNA methylation level in EL stage embryos derived by NT-SC was sustained in the ED, and significantly decreased in the TE. Consequently, the DNA methylation status of NT-SC embryos at the EL stage was similar to that of Vivo embryos. In the present study, the DNA methylation status in individual embryos did not show large variation; the ICM and TE of NT-SC embryos at the BC stage were both heavily methylated. Therefore, we considered that the decline in the DNA methylation level in NT-SC embryos was not responsible for the selective development of embryos with a low level of methylation at the BC stage, which is thought to result from demethylation during the elongation process. Most previous studies in mouse embryos, have suggested that the genome-wide demethylation that occurs after fertilization is a passive process; that is, that it occurs as a result of the lack of maintenance methylation following DNA replication and cell division (Howlett and Reik, 1991; Rougier et al., 1998). It is well known that the DNA methylation pattern during embryo development and cell division is maintained by Dnmt-1 (Bestor, 2000; Li et al., 1992). However, Dnmt-1 is actively retained in the cytoplasm until the BC stage, which prevents binding to its DNA substrate in the nucleus (Cardoso and Leonhardt, 1999). These findings strongly suggest that cell division and Dnmt-1 are very important factors for the change in the DNA methylation level in preimplantation embryos. Because the cell number of the TE region is dramatically increased by elongation, Dnmt-1 is considered to have the most important role in the maintenance of DNA methylation. Giraldo et al. (2008) reported that levels of Dnmt-1 transcript were undetectable in Vivo embryos on days 7, 10, and 12. However, in the present study, transcription of the Dnmt-1 was observed in BC and EL stage embryos obtained by both NT-SC and Vivo procedures. The reason for such a difference is not clear, but several investigators (Golding and Westhusin, 2003; Wrenzycki et al., 2001) reported that Dnmt-1 transcript was detected in bovine BC embryos. Our results indicate that the level of Dnmt-1 transcript in NT-SC embryos that developed to the BC stage was significantly lower than that in Vivo embryos, and this aberrant expression of Dnmt-1 in NT-SC embryos is consistent with a previous report (Wrenzycki et al., 2001). Therefore, we infer that the low level of Dnmt-1 transcript in NT-SC embryos causes the passive demethylation in the TE region during the BC to EL stage. Transcription of the Dnmt-1 gene in mouse embryos is regulated by DNA methylation in the tissue-dependent differentially methylated region in the 5′ region of Dnmt-1 (Ko et al., 2005). Although the reason for the reduction in the level of Dnmt-1 transcript in NT-SC embryos is not clear, it is possible that the phenomenon is related to the genome-wide hypermethylation status of these embryos.
In conclusion, the results of an analysis of the DNA methylation status of the satellite I sequences at two different stages demonstrate that the DNA methylation level in bovine NT-SC embryos changed during the elongation process, and that these embryos show a normal level of DNA methylation at the EL stage. In the study, we reported that changes in the DNA methylation levels of satellite sequences. Further study should be focused on methylation status of global DNA and specific genes related with embryo development. The altered growth characteristics seen in fetuses from bovine embryos obtained using the NT-SC procedure are observed markedly beyond the EL stage, after embryo implantation. Further analysis of the DNA methylation status of fetuses and placentae that develop to later stages of gestation is necessary to clarify the cause of the abnormalities observed in NT-SC animals.
Footnotes
Acknowledgments
This work was supported by a Research Project for Utilizing Advanced Technologies in Agriculture, Forestry and Fisheries (No. 1602), Grant-in-Aid for Young Scientists B (No. 19780211), and Grant-in-Aid for Scientific Research on Priority Areas (No.21028001).
Author Disclosure Statement
The authors declare that no conflicting finanical interests exist.