
Abstract
Abstract
To improve the efficiency of somatic cell nuclear transfer (SCNT)-derived embryos in buffaloes (Bubalus bubalis), skin fibroblast, cumulus, and granulosa cells were cultured up to the 15th passage and cloned embryos were produced from each cell type. At the 15th passage the cumulative population doublings (CPDs) in cumulus cells was higher (60.78) than skin fibroblast (57.12) and granulosa (56.05) cell lines. Gene expression of chromatin remodelling proteins, that is, HDAC1, DNMT1, DNMT3a, and DNMT3b, were comparable at all five passages (P-3, P-6, P-9, P-12, and P-15) groups in cumulus cells but different in skin fibroblast and granulosa cells. Cleavage and blastocyst production rate in cumulus (65.9 and 27.4%)-derived embryos was higher than skin fibroblast (63.8 and 24.3%) and granulosa (62.5 and 22.3%)-derived embryos. Expressions of HDAC1, DNMT1, and DNMT3a mRNA in cumulus-derived blastocysts were similar to IVF blastocysts (control), whereas skin fibroblast and granulosa-derived blastocysts expression was significantly different (p ≤ 0.05). DNMT3b mRNA expression in all the three donor cell types and IVF control were similar. The expression pattern of these genes showed the effect of donor cell type with different epigenetic reprogramming capabilities for SCNT embryo production rate. Overall, results indicated that cumulus cells are the best nuclear donor for SCNT.
Introduction
Epigenetic marks can be modified with an increased level of acetylated histones and decreased levels of methylated DNA, in cells cultured for extended periods (Enright et al., 2003; Kubota et al., 2000). It was further reported that in vitro culture of cells can induce expression of genes that were not expressed before culture (Baker et al., 2001). A significant decline in mRNA coding for DNA methyl transferase protein (DNMT1) was observed in cells at late population doublings (PDs) when compared with cultured fibroblasts at early PDs (Giraldo et al., 2007).
Histone acetylation and DNA methylation play a key role in the remodeling process of the genome, and are linked with imprinting of genes in the early embryo (Grandjean et al., 2001) and many other chromatin-dependent processes (Kouzarides, 2007). Chromatin compaction is regulated by histone acetylation, which consists of the addition of an acetyl group to positively charged lysine residues of the histone N-termini (Beyhan et al., 2007). This reaction is reversible through histone deacetylases (HDACs), which induce the repacking of the chromatin and lead to gene silencing (McGraw et al., 2002).
The DNA methyl transferase 3 (DNMT3) family establishes the initial CpG methylation pattern de novo, whereas DNA methyl transferase 1 (DNMT1) maintains this pattern during chromosome replication (Chen and Li, 2006) and repair (Mortusewicz et al., 2005). As expected for maintenance, DNMT1 has a 30- to 40-fold preference for hemimethylated sites (Jeltsch, 2006). However, this division of labor is not so clear, as DNMT1 activity is required for de novo methylation at non-CpG cytosines (Grandjean et al., 2007), and perhaps to an extent even in CpG islands (Feltus et al., 2003; Jair et al., 2006).
The DNMT3 family includes two active de novo DNMTs, DNMT3a, and DNMT3b (Bestor, 2000). DNMT3a and 3b are thought to play major role in tissue-specific expression patterns and establishment of genomic imprints of particular genes (Bourc'his et al., 2001; Hata et al., 2002). These enzymes have the inherent ability to redirect gene expression patterns by altering the topology of DNA to a transcriptionally repressive state (Beyhan et al., 2007).
Very few reports are available regarding the component of gene expression in NT embryos produced from different types of somatic cells (Amarnath et al., 2007; Beyhan et al., 2007; Li et al., 2006), as no particular donor cell type has been established to be superior in overcoming the problems associated with the epigenetic reprogramming after nuclear transfer and cell potential of different donors to develop normal embryos. Even differential expression of gene levels among SCNT embryos from different types of donor cells is still not available. Epigenetic markers confer stability in gene expression during mammalian development. Therefore, any changes or defects in epigenetic markers are likely to be reflected in the gene expression profile (Giraldo et al., 2007).
The majority of studies concerning gene expression analysis of SCNT embryos have involved pooled samples of blastocysts, which might bias the results in favor of nonviable embryos. Therefore, to overcome these problems in the present study, we used a highly sensitive real-time PCR to compare the gene expression profiles of gene responsible for chromatin remodeling (HDAC1, DNMT1, DNMT3a, and DNMT3b) at different passage intervals of different nuclear donor skin fibroblast, cumulus, and granulosa cells as well as blastocysts derived from skin fibroblast (SNT), cumulus (CNT), and granulosa (GNT) cells.
Materials and Methods
All the chemicals used in the present study were purchased from Sigma-Aldrich (St. Louis, MO, USA) unless otherwise stated.
Collection of cumulus–oocyte complexes (COCs)
Buffalo ovaries were obtained from a nearby abattoir and transported in normal saline (0.9% NaCl) at 25–30°C to the laboratory within 3 h after slaughter and washed three times in the physiological saline. Ovarian antral follicles (2–8 mm) were aspirated using 18-gauge needle and follicular fluid collected into HEPES-buffered tissue culture medium-199 (TCM-199) plus phosphate-buffered saline (PBS; Gibco BRL/Life Technologies, Gaithersburg, MD) supplemented with 0.1% bovine serum albumin (BSA). COCs showing an even cytoplasm and surrounded by at least three layers of compact cumulus cells were selected. COCs were washed three times in TCM-199 medium supplemented with 10% fetal bovine serum (FBS; Hyclone, Logan, UT), gentamycin sulfate (10 μg/mL), and sodium pyruvate (0.2 mM), and incubated in groups of 20–25 in TCM-199 medium supplemented with gentamycin sulphate (10 mg/mL), β-estradiol (1000 IU/mL), FSH (1000 IU/mL), LH (1000 IU/mL), and 10% FBS at 38.5°C in 5% CO2 in air, for 24 h.
Preparation of oocytes for nuclear transfer
Matured oocytes (after 24–26 h in maturation medium) were vortexed in 80 μL maturation media and 20 μL hyaluronidase (0.1%) for 3 min in 1.5-mL centrifuge tubes (Eppendorf, Westbury, NY, USA) to remove cumulus layers and washed five times in HEPES-buffered TCM-199 medium. Oocytes were treated with 7.5 μg/mL cytochalasin-B (Cyto-B) in HEPES-buffered TCM-199 supplemented with 10% FBS for 1 h. Oocytes at metaphase II stage showing the second polar body extruded in perivitelline space were selected for SCNT.
Donor cells preparation
Skin tissues (1 × 1 cm) of ear pinna of adult buffaloes (2 years of age) were collected by biopsy. The skin samples were brought aseptically to the laboratory in Dulbecco's modified eagle medium (DMEM) plus 15% FBS (Hyclone) and antibiotics (penicillin + streptomycin) at 4°C. Primary culture was established in DMEM supplemented with 10% FBS, 5 mg/L antibiotics (penicillin + streptomycin), and 1 mg/L L-glutamine at 37°C, 5% CO2, and 95% humidified atmosphere. Primary cultures were harvested after 3–4 days at 70–80% confluency by the usual Trypsin–EDTA method and subjected to multiple passaging.
Granulosa tissues were collected from the buffalo ovaries follicular fluid, and cumulus cell were collected from the outer surface of the zona pellucida of matured oocytes. Primary cultures of these two cell types were established in similar culture conditions that were earlier used for skin fibroblast cells earlier. Primary cultures were harvested at the 70–80% confluency according to the method used for skin fibroblast cells and subjected to multiple passaging.
Cell proliferation rate (CPR)
Cells were serially passaged by reseeding at 3.2 × 10⁴/cm2 in culture flasks (Nunc, Naperville, IL, USA) and harvested at 70 to 80% confluency from passage 1 to passage 15. In each harvest the live and dead cell counts were calculated by the dye exclusion method, using a Neubar's hemocytometer. From the data on cell count at the time of seeding, harvesting, and duration of culture for each passage, the cell proliferation rate (r) per day was calculated according to the formula of Cristofalo and Phillips (1989).
where, NH is the number of cells harvested, NI is the number of cells initially seeded, T1 is the time at seeding (h), and T2 is the time till harvesting (h).
Mean population doubling time (MPDT)
The MPDT is expressed as the time taken to double the existing cell population, and was calculated using the formula reported by Cristofalo and Phillips (1989) and Davis (1994).
where, r is the cell proliferation rate.
Cumulative population doublings (CPD)
The CPD for each cell line was calculated by the following formula (Cristofalo and Phillips, 1989; Hayflick, 1973)
where, T2 − T1 is theduration in passage and r is the cell proliferation rate.
The data generated on CPR, MPDT, CPDs, and cell viability during 15 passages was grouped into passage intervals of 1–3, 4–6, 7–9, 10–12, and 13–15.
Production of nuclear transfer embryos
Recipient buffalo oocytes were micromanipulated according to procedure described for SCNT goat embryos by Gupta et al. (2007) using manipulation media (TCM-199 + 10% FBS) on a Nikon Diaphot microscope equipped with Narishige micro manipulators. The zona-pellucida above the first polar body was cut with a fine glass needle, and a small volume (10–15%) of the ooplasm was extruded along with the second polar body. The extruded ooplasm droplet was placed in 5 μg/mL Hoechst 33342 and seen under UV light for ensuring complete removal of oocyte chromatin material including polar body and metaphase plate-II.
The medium sized (12–15 μ) cells were selected as nuclear donors. Individual somatic cell from the seventh to the ninth passage from each cell line was injected into perivitelline space of the enucleated oocyte. The cell oocyte complex was placed in fusion medium (0.3 M Mannitol, 0.05 mM CaCl2, 0.1 mM MgSO4), followed by electrical stimulation using two DC pulses (15 μsec each, 1.8–2 kV/cm2, 15 sec apart) with ECM-2001 (BTX, Boston, MA). Fused SCNT complexes were washed in TCM-199 containing 10% FBS and were placed in TCM-199 supplemented with 5 μM ionomycin and 10% FBS for 10 min. After washing in the same culture medium, the oocyte complexes were incubated into TCM-199 plus 10% FBS medium containing 2.5 mM 6-Dimethyl amino purine (6-DMAP) + 10 μg/mL Cyclohexamide (CHX) + 7.5 μg/mL Cytochalasin-B for 3.30 h. The reconstructed embryos were finally cultured in HEPES-buffered TCM-199 medium containing 10% FBS in 100 μL droplets in incubator at 38.5°C, 5% CO2, and 95% humidity to produce developmental series from the two-cell stage to blastocysts.
In vitro fertilization
In vitro matured COCs were fertilized in vitro with capacitated frozen sperm as described by Madan et al. (1994). One straw of frozen buffalo semen was thawed at 37°C and washed twice by centrifugation at 500 × g for 10 min in BO medium (Brackett and Oliphant, 1975). After washing, the media was supplemented with 10 mM caffeine, 10 μg/mL heparin, and 0.2 mM sodium pyruvate. The pellet was resuspended in caffeine–BO medium at the concentration of 2 × 10⁶ sperm/mL. A 50-μL aliquot of semen suspension was added to each 50 μL droplet containing 20 oocytes, and they were cocultured for 6 h in a CO2 incubator at 38.5°C. The IVF embryos were cultured at 38.5°C in HEPES-buffered TCM-199 supplemented with 10% FBS medium for 7–8 days.
Differential staining
The quality of blastocyst was assessed by differential staining of the Inner cell mass (ICM) and the trophoectoderm (TE) cells according to Thouas et al. (2001). TE cells of blastocysts day − 7 were stained with 100 μg/mL flurochrome propidium iodide after treatment with permeabilizing solution containing 1% (v/v) Triton X-100 ionic detergent. Blastocysts were then incubated in 100% ethanol (for fixation) at 4°C and Hoechst 33342. Fixed and stained whole blastocysts were mounted and assessed for cell number using fluorescence microscopy.
Preparation of cell lysate, DNase digestion, and reverse transcription
Skin fibroblast, cumulus, and granulosa donor cells from passage group (P-0, P-1-3, P-4-6, P-7-9, P-10-12, and P-13-15) and morphologically normal blastocyst of IVF, SNT, CNT, and GNT embryos were collected separately. The cDNA was prepared using a cell to cDNA II kit (Ambion, Austin, TX). Cells and embryos were washed three times with the PBS by centrifugation for 5 min at 4°C at 1200 × g and 100 μL of the cell lysis buffer was added to prepare cell lysate. Embryo/cell lysate was supplemented with 0.2 μL (0.4 U/μL) of DNase I, and incubated at 37°C for 15 min. After incubation; each tube was heated for 10 min at 75°C to inactivate the DNase.
To synthesize the first strand of cDNA, 5 μL embryo/cell lysate, 4 μL dNTP mix, 2-μL random hexamers primers, and 5-μL RNase free water were assembled in a RNase free 0.5 mL tube, then heated for 3 min at 70°C. After cooling the mixture on ice, 2 μL 10 × RT buffer, 1 μL M-MLV reverse transcriptase, and 1 μL RNase inhibitor were added to the reaction tubes. Reverse transcription was carried out for 1 h at 42°C, followed by incubation at 95°C for 10 min. RT minus product with all the reaction components except the reverse transcriptase were produced for each sample, and were then employed for real-time PCR to demonstrate that the template for the PCR product was cDNA, not genomic DNA.
Primer design
Real-time PCR primers (Table 1) were designed using the software Beacon Designer 7.0 (Premier Biosoft International, Palo Alto, CA, USA).
Real-time PCR analysis of gene expression
Before the final step of gene expression analysis, each cDNA sample was first amplified with a pair of primers specific for β-actin mRNA to screen the samples for contamination with genomic DNA. Real-time PCR was performed on a Mx3000p Stratagene System (La Jolle, CA) using the Invitrogen SYBR Green qPCR supermix as a double-stranded DNA-specific fluorescent dye in 25-μL reaction to assess the gene expression of HDAC1, DNMT1, DNMT3a, and DNMT3b relative to reference histone H2A mRNA that have been used in expression experiment (Amaranth et al., 2007; Beyhan et al., 2007). At least three sets of all the three cell types at P-3, P-6, P-9, P-12, and P-15 and blastocyst derived from each cell type were analyzed for each gene examined. Cells from P-0 of somatic cells and IVF embryos served as control for gene expression study in somatic cell lines and cloned embryos. All PCR were conducted at least twice for every transcript of interest. In vitro fertilized (IVF) blastocysts were served as control for SCNT blastocyst.
Final concentration 10 nM of forward and reverse primers and cDNA 4 μL along with 12.5 μL 2 × PCR SYBR Green master mix was added per reaction. Samples not exposed to reverse transcriptase (RT) were used as negative controls. The PCR conditions were 95°C for 10 min, then 50 cycles consisting of denaturation at 95°C for 10 sec, then at annealing temperature for 10 sec, and extension at 72°C for 15 sec. Subsequent to the PCR, a dissociation curve analysis program was run to confirm a single specific peak and to detect primer/dimer formation using the program of 0 sec at 95°C, 10 sec at 56°C, then for 0 sec at 95°C with acquisition on the step mode. Product identity was confirmed by ethidium bromide-stained 2% gel electrophoresis.
The comparative CT method was used for relative quantification of target gene expression levels (Bustin, 2000). Quantification was normalized to the internal control Histone H2A mRNA. Within log-linear phase region of the amplification curve, each cycle doubled the amplified product. The ΔCT value was determined by subtracting the Histone H2A mRNA CT value for each sample from the target gene CT value. Calculation of ΔΔCT involved using the highest sample method ΔCT as an arbitrary constant to subtract from all other ΔCT sample values. Fold changes in relative mRNA expression of the target genes were determined using the formula 2−ΔΔCT.
Experimental design
Cell lines from buffalo SNT, CNT, AND GNT tissues were cultured up to the 15th passage, and CPD, population doubling time (PDT), CPR, and cell viability were calculated at every passage. The data was arranged into five class intervals of three passages each (1–3, 4–6, 7–9, 10–12, and 13–15). Gene expression pattern of HDAC1, DNMT1, DNMT3a, and DNMT3b mRNAs were checked in all the three cell lines at different passage groups. SCNT (derived from SNT, CNT, and GNT cell lines) and IVF embryos were produced and gene expression of HDAC1, DNMT1, DNMT3a, and DNMT3b were evaluated at the blastocyst stage.
Statistical analysis
Average and standard deviation were calculated for CPD, PDT, CPR, and cell viability of each cell line as well as cleavage and blastocyst production rates of SCNT and IVF experiments using the SPSS statistical program (SPSS 7.5 for Windows; SPSS, Inc., Chicago, IL, USA). The data were considered for significant differences by one-way analysis of variance (ANOVA) using the SPSS program (p ≤ 0.05).
Relative quantification of target gene expression levels as fold difference was based on three sets of samples. Data on mRNA expression was analyzed using the light cycler software (Stratagene). After testing for normality and equal variance, one-way ANOVA followed by post hoc multiple pair-wise comparisons using LSD and Duncan's multiple range tests for variable were employed to determine the difference in the gene expression pattern among somatic cell lines (SNT, CNT, GNT), SCNT, and IVF blastocysts using the SPSS 7.5 program. Differences were considered to be significant at p ≤ 0.05. If the n-fold difference relative to the calibrator for each treatment embryo equivalent did not fall within the confidence interval for the IVF control embryos, they were considered abnormal, either upregulated or downregulated.
Results
In cultured cells, CPR, PDT, cell viability, and expression of HDAC1, DNMT1, DNMT3a, and DNMT3b mRNA for SNT, CNT, and GNT cell lines were calculated. The data was arranged into five class intervals of three passages each (1–3, 4–6, 7–9, 10–12, and 13–15). The SNT, CNT, and GNT cell proliferation data are summarized in Table 2
Cell proliferation and gene expression analysis at different passages of skin fibroblast donor
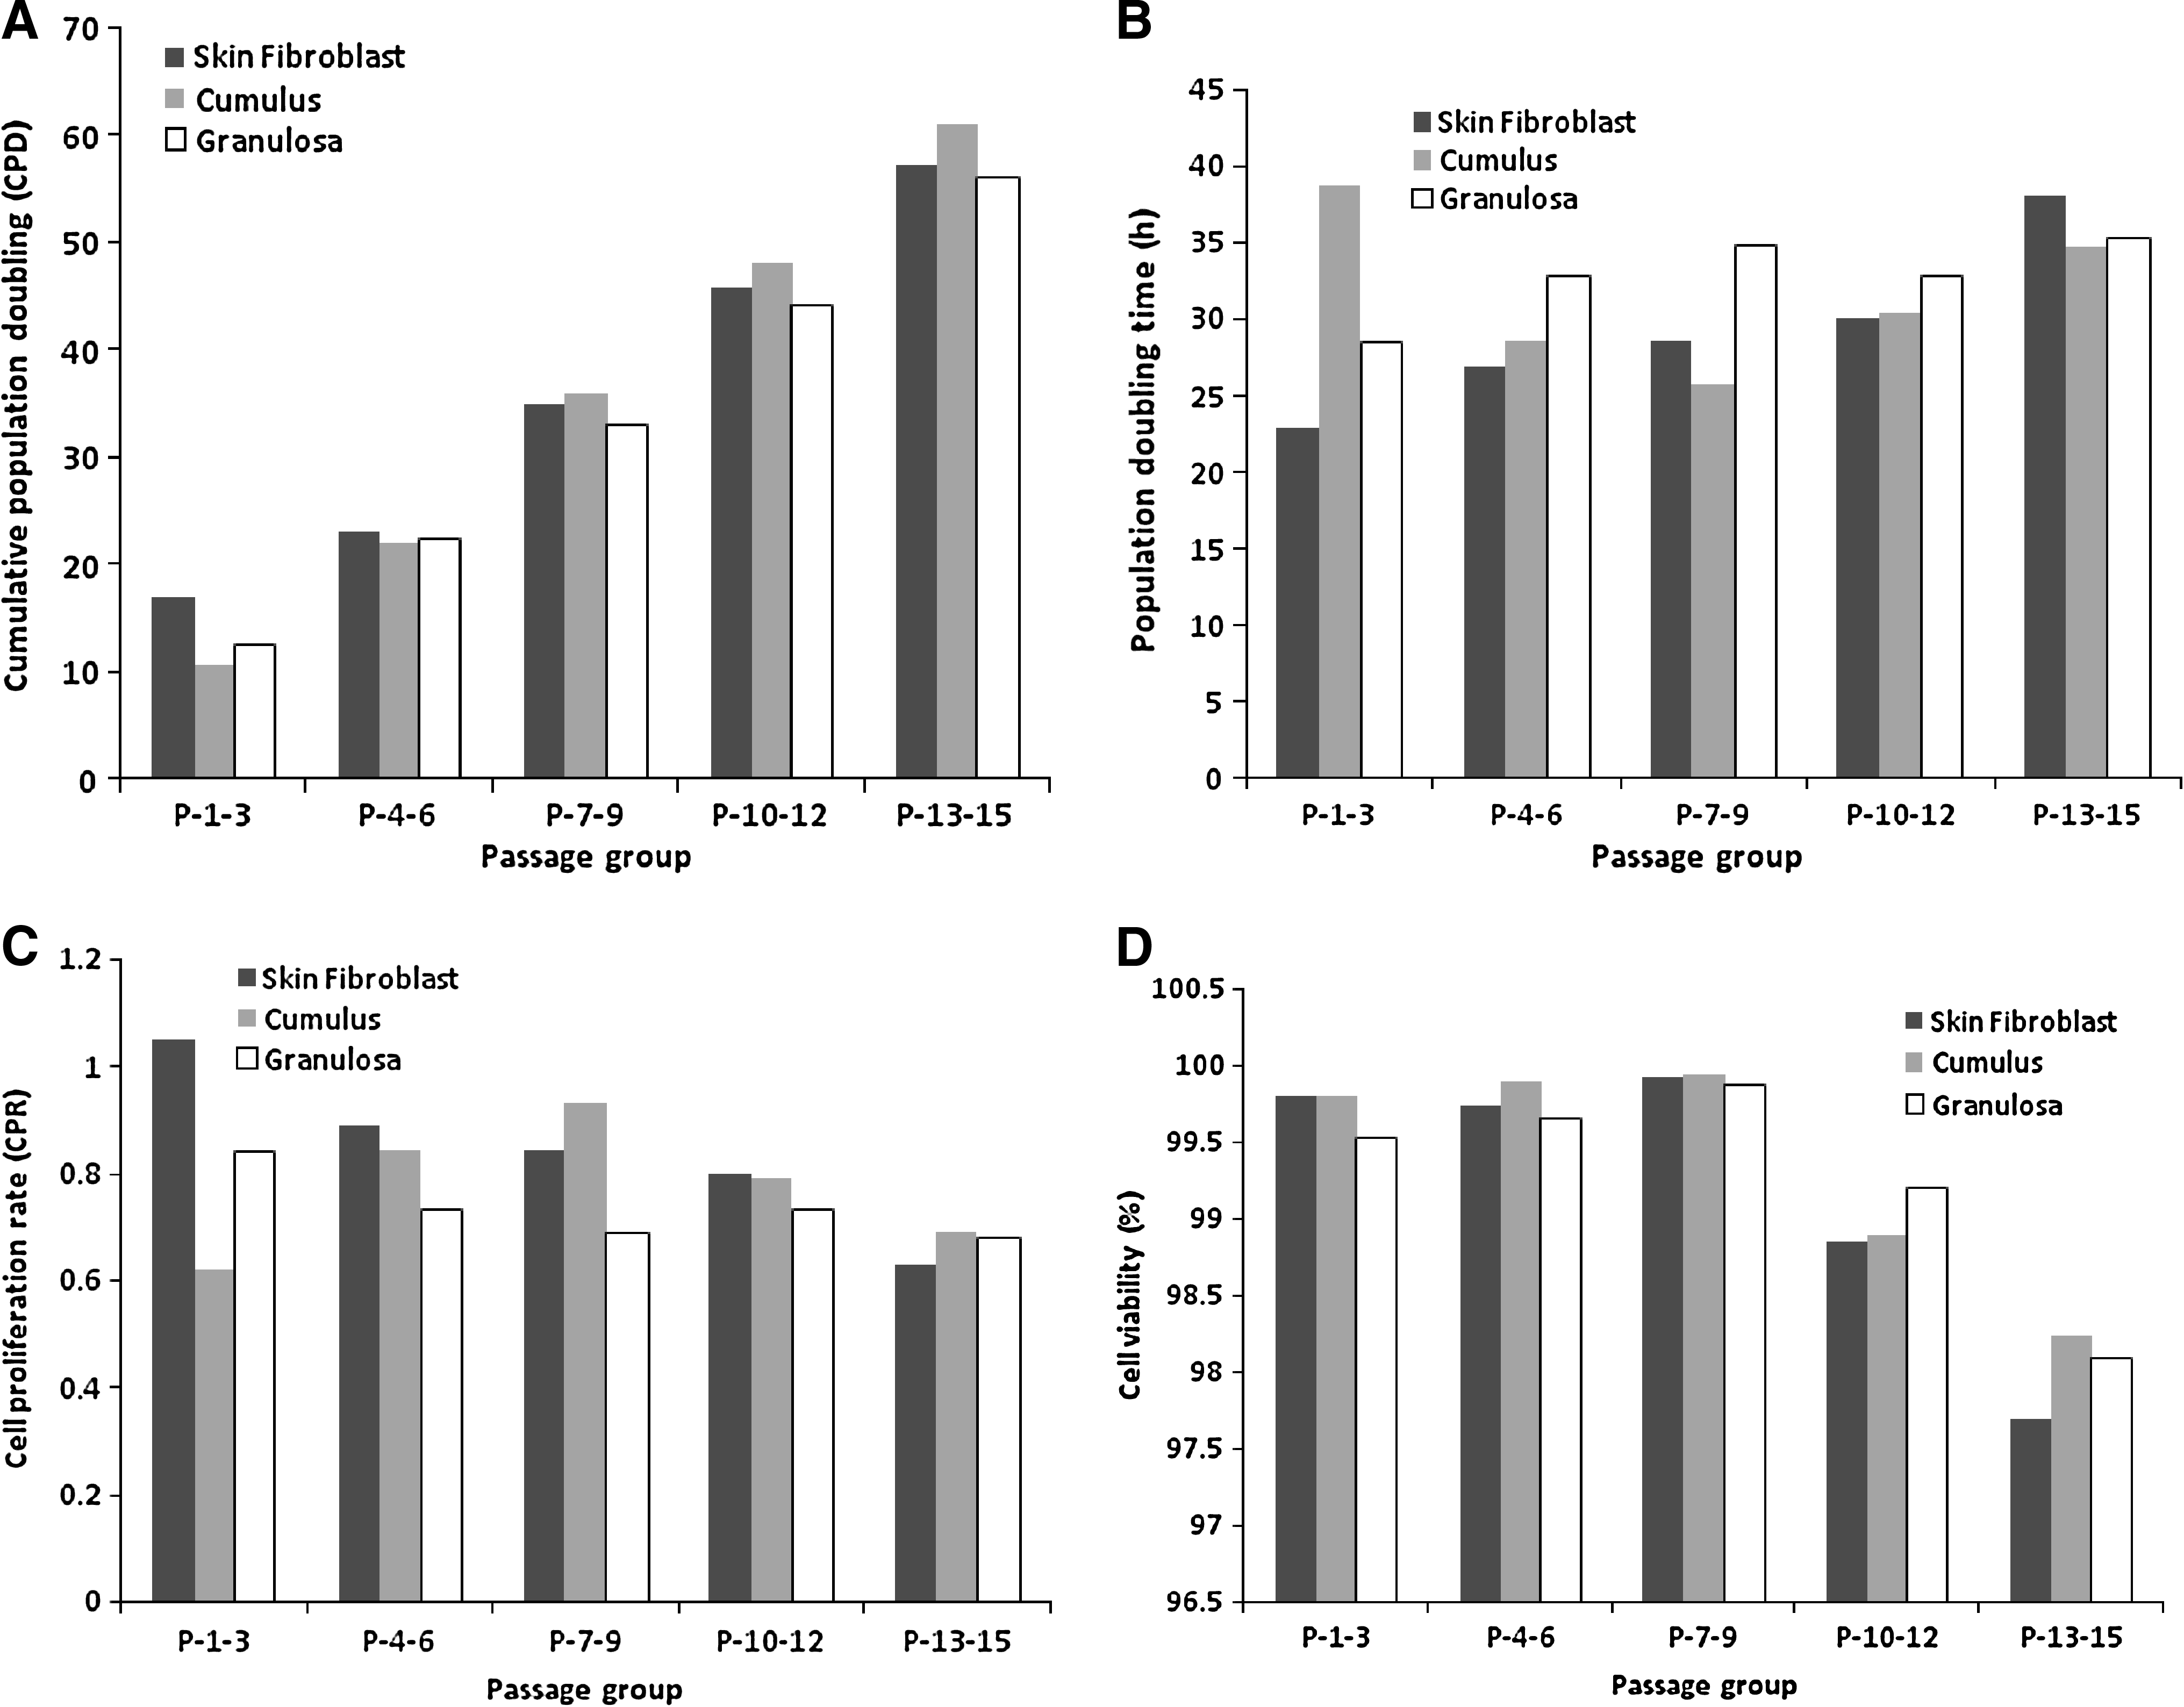
The CPD was 57.12 up to the 15th passage (Fig. 1A). PDT increased continuously from 22.85 ± 2.24 h (P-1-3) to 38.09 ± 10.38 h (P-13-15) (Fig. 1B). CPR decreased from 1.05 ± 0.15 to 0.63 ± 0.17 at P-1-3 and P-13-15, respectively (Fig. 1C). Cell viability was ranged between 97.69 ± 0.26% (P-13-15) and 99.92 ± 0.28% (P-7-9) (Fig. 1D).
(
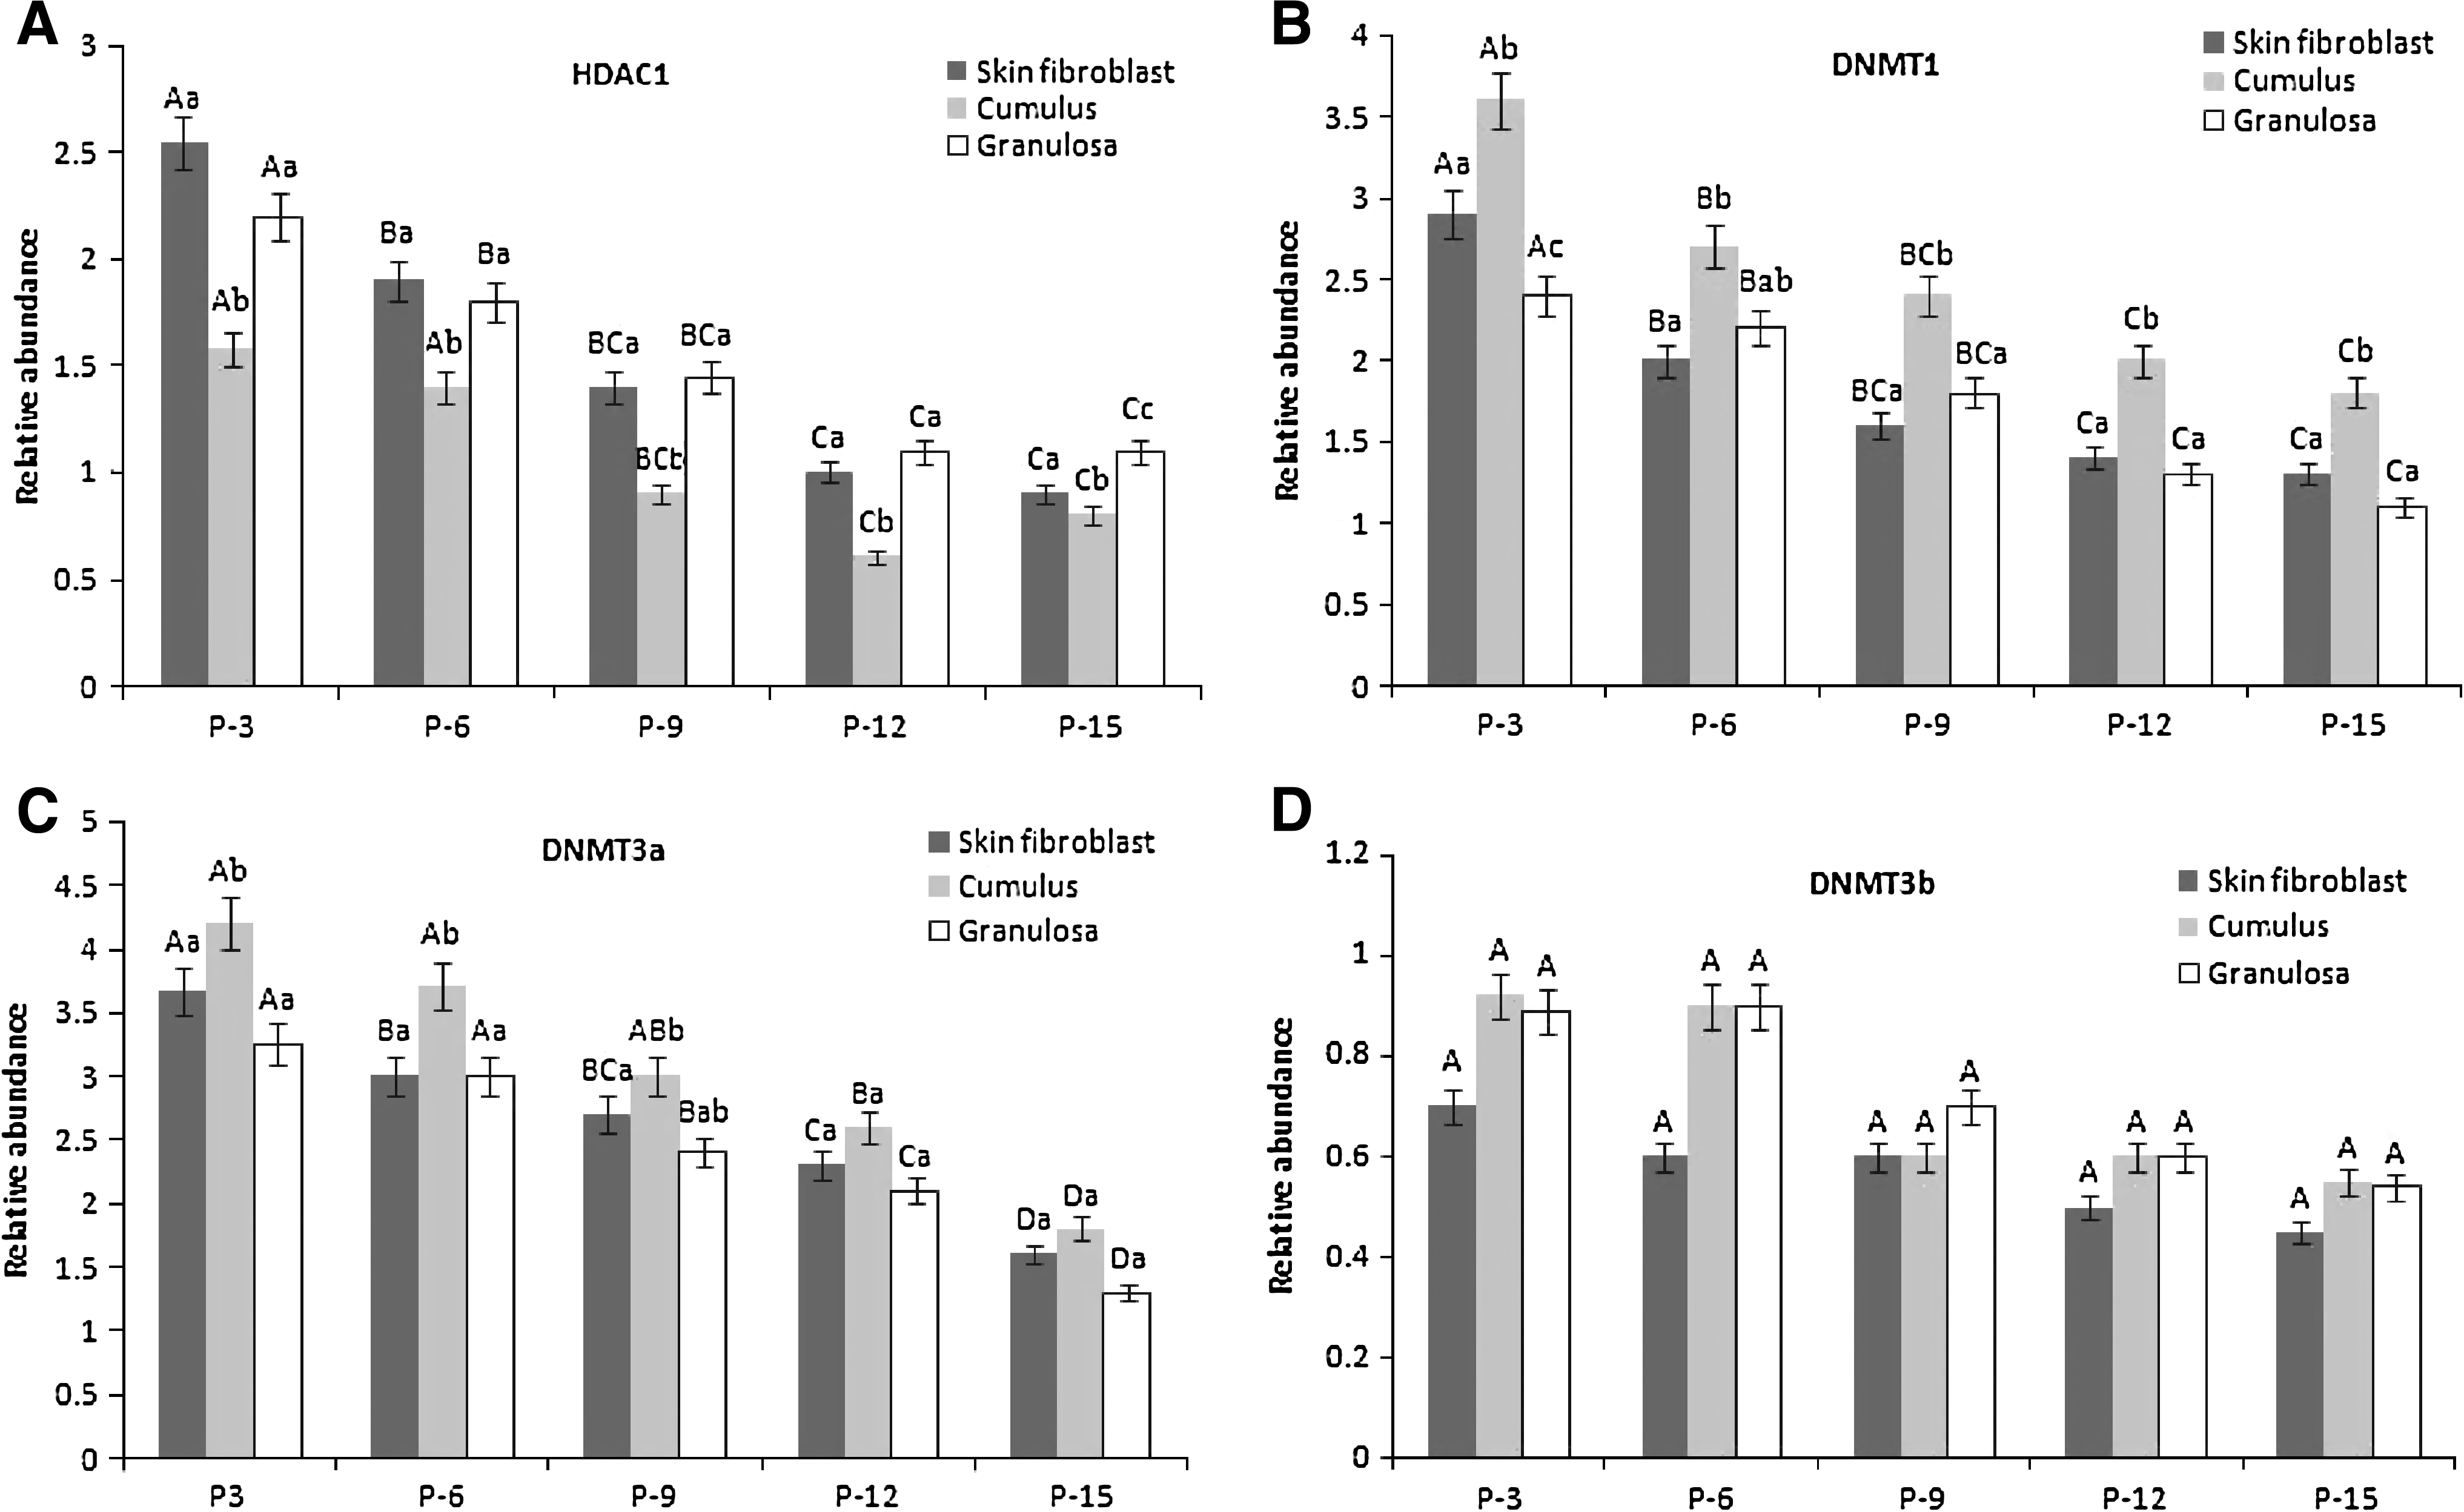
Expression of HDAC1 (Fig. 2A), DNMT1 (Fig. 2B), and DNMT3a (Fig. 2C) varied between different passage groups of the SNT cell line. Highest expressions of these three transcripts were observed at P-3 and reductions in expression in later passages. However, DNMT3b (Fig. 2D) mRNA remained constant at all the passages.
(
Cell proliferation and gene expression analysis at different passages of cumulus donor
In the CNT cell line the CPD was 60.78 after multiple passaging up to the 15th passage (Fig. 1A). PDT at P-1-3 was maximum (38.71 ± 7.61 h) and at P-7-9 was minimum (25.81 ± 4.68 h) (Fig. 1B). CPR increased from 0.62 ± 0.14 (P-1-3) to 0.93 ± 0.15 (P-7-9), and then again decreased in further passages (Fig. 1C). Highest cell viability 99.94 ± 0.16% was observed at P-7-9 (Fig. 1D).
The HDAC1 mRNA expression in earlier passages (P-3 and P-6) was significantly higher than in later passages (P-12 and P-15). Expression level at P-9 was intermediate between P-6 and P-12 (Fig. 2A). Similarly, DNMT1 transcript was significantly higher at P-3 but similar in later passages from the sixth passage onward. The DNMT3a mRNA expression level was similar up to P-9, but later passage up to P-15 showed decline (p ≤ 0.05) in expression (Fig. 2C). The DNMT3b mRNA expression level in all passage groups was similar (Fig. 2D).
Cell proliferation and gene expression analysis at different passages of granulosa donor
The CPD during the 15 passages was found to be an average of 56.05 (Fig. 1A). PDT ranged from 28.57 ± 3.81 at P-1-3 to 35.78 ± 3.05 at P-12-15 (Fig. 1B). CPR was irregular in different passage group and ranged from 0.68 ± 0.06 (P-13-15) to 0.84 ± 0.11 (P-1-3) (Fig. 1C). Cell viability was highest (99.87 ± 0.10%) at P-7-9 (Fig. 1D).
The HDAC1 mRNA level was highest at P-3 and reduced in later passages (Fig. 2A). The DNMT1 transcript was significantly higher at P-3 and was similar in other onward passages (Fig. 2B). The DNMT3a mRNA level was comparable up to P-9, but declined in later passages (P-12 and P-15) and at P-9 was comparable to both early and late passage (Fig. 2C). The DNMT3b mRNA level was found similar at all the passages (Fig. 2D).
Comparative quantitation of mRNA transcripts in different nuclear donor
The HDAC1 mRNA expression was significantly lower (p ≤ 0.05) in CNT cells in comparison to SNT and GNT cells at each passage group (Fig. 2A). The DNMT1 mRNA expression was higher in CNT cells at each passage group compared to its other two counterparts (Fig. 2B). The DNMT3a mRNA expression was not significant (p ≤ 0.05) between SNT and CNT cells, but significantly lower (p ≤ 0.05) in GNT cells (Fig. 2C). The DNMT3b expression was higher (p ≤ 0.05) in CNT cells (Fig. 2D). Expressions of all the four genes in each cell line were found similar from P-9 onward.
Comparison of development rate of SCNT embryos produced from different nuclear donor cells and IVF embryos
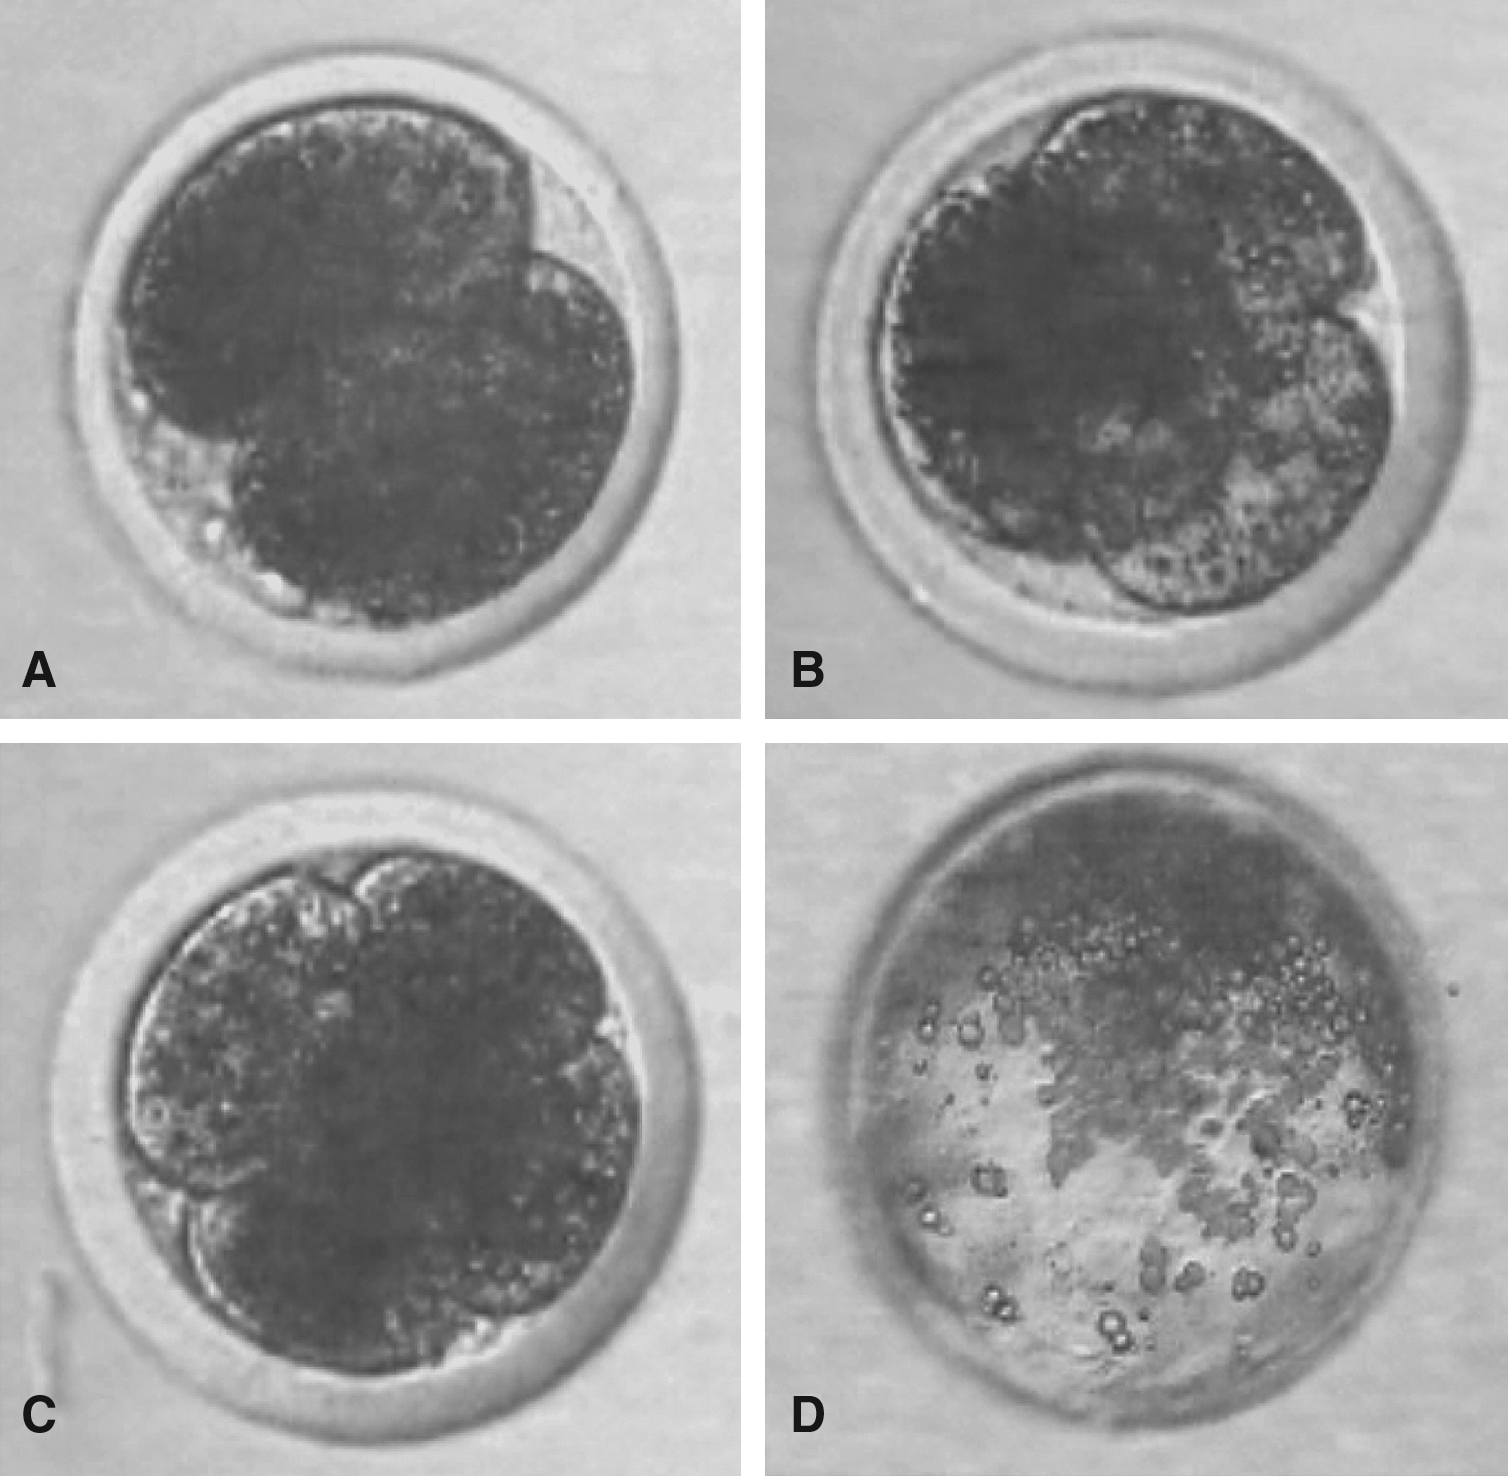
The SCNT embryonic development is presented in Figure 3A–D. The development rates of SNT, CNT, GNT, and IVF embryos are summarized in Table 3 Developmental data in the present study showed that cleavage rate in CNT (65.9 ± 2.1%) was higher than SNT (63.8 ± 1.0%) and GNT (62.5 ± 2.2%). A significantly higher percentage of blastocysts were produced by CNT (27.4 ± 1.7%) than blastocyst produced either by SNT (24.3 ± 0.9%) or GNT (22.3 ± 1.1%). Production rates of IVF embryos at the two-cell stage (79.1 ± 3.2%) and blastocyst (36.8 ± 0.8%) were significantly higher than the SCNT embryos production with all the three SCNT embryos. No significant differences in the number of cells in ICM or TE number, or the proportion of ICM over total cells was detected among SCNT groups.
(
Percentage of the number of oocytes that cleaved.
Percentage of the number of oocytes that developed to blastocysts.
Cell number during blastocyst stage.
Development rate with significant level (p ≤ 0.05).
Expression of mRNA transcripts in cloned embryos
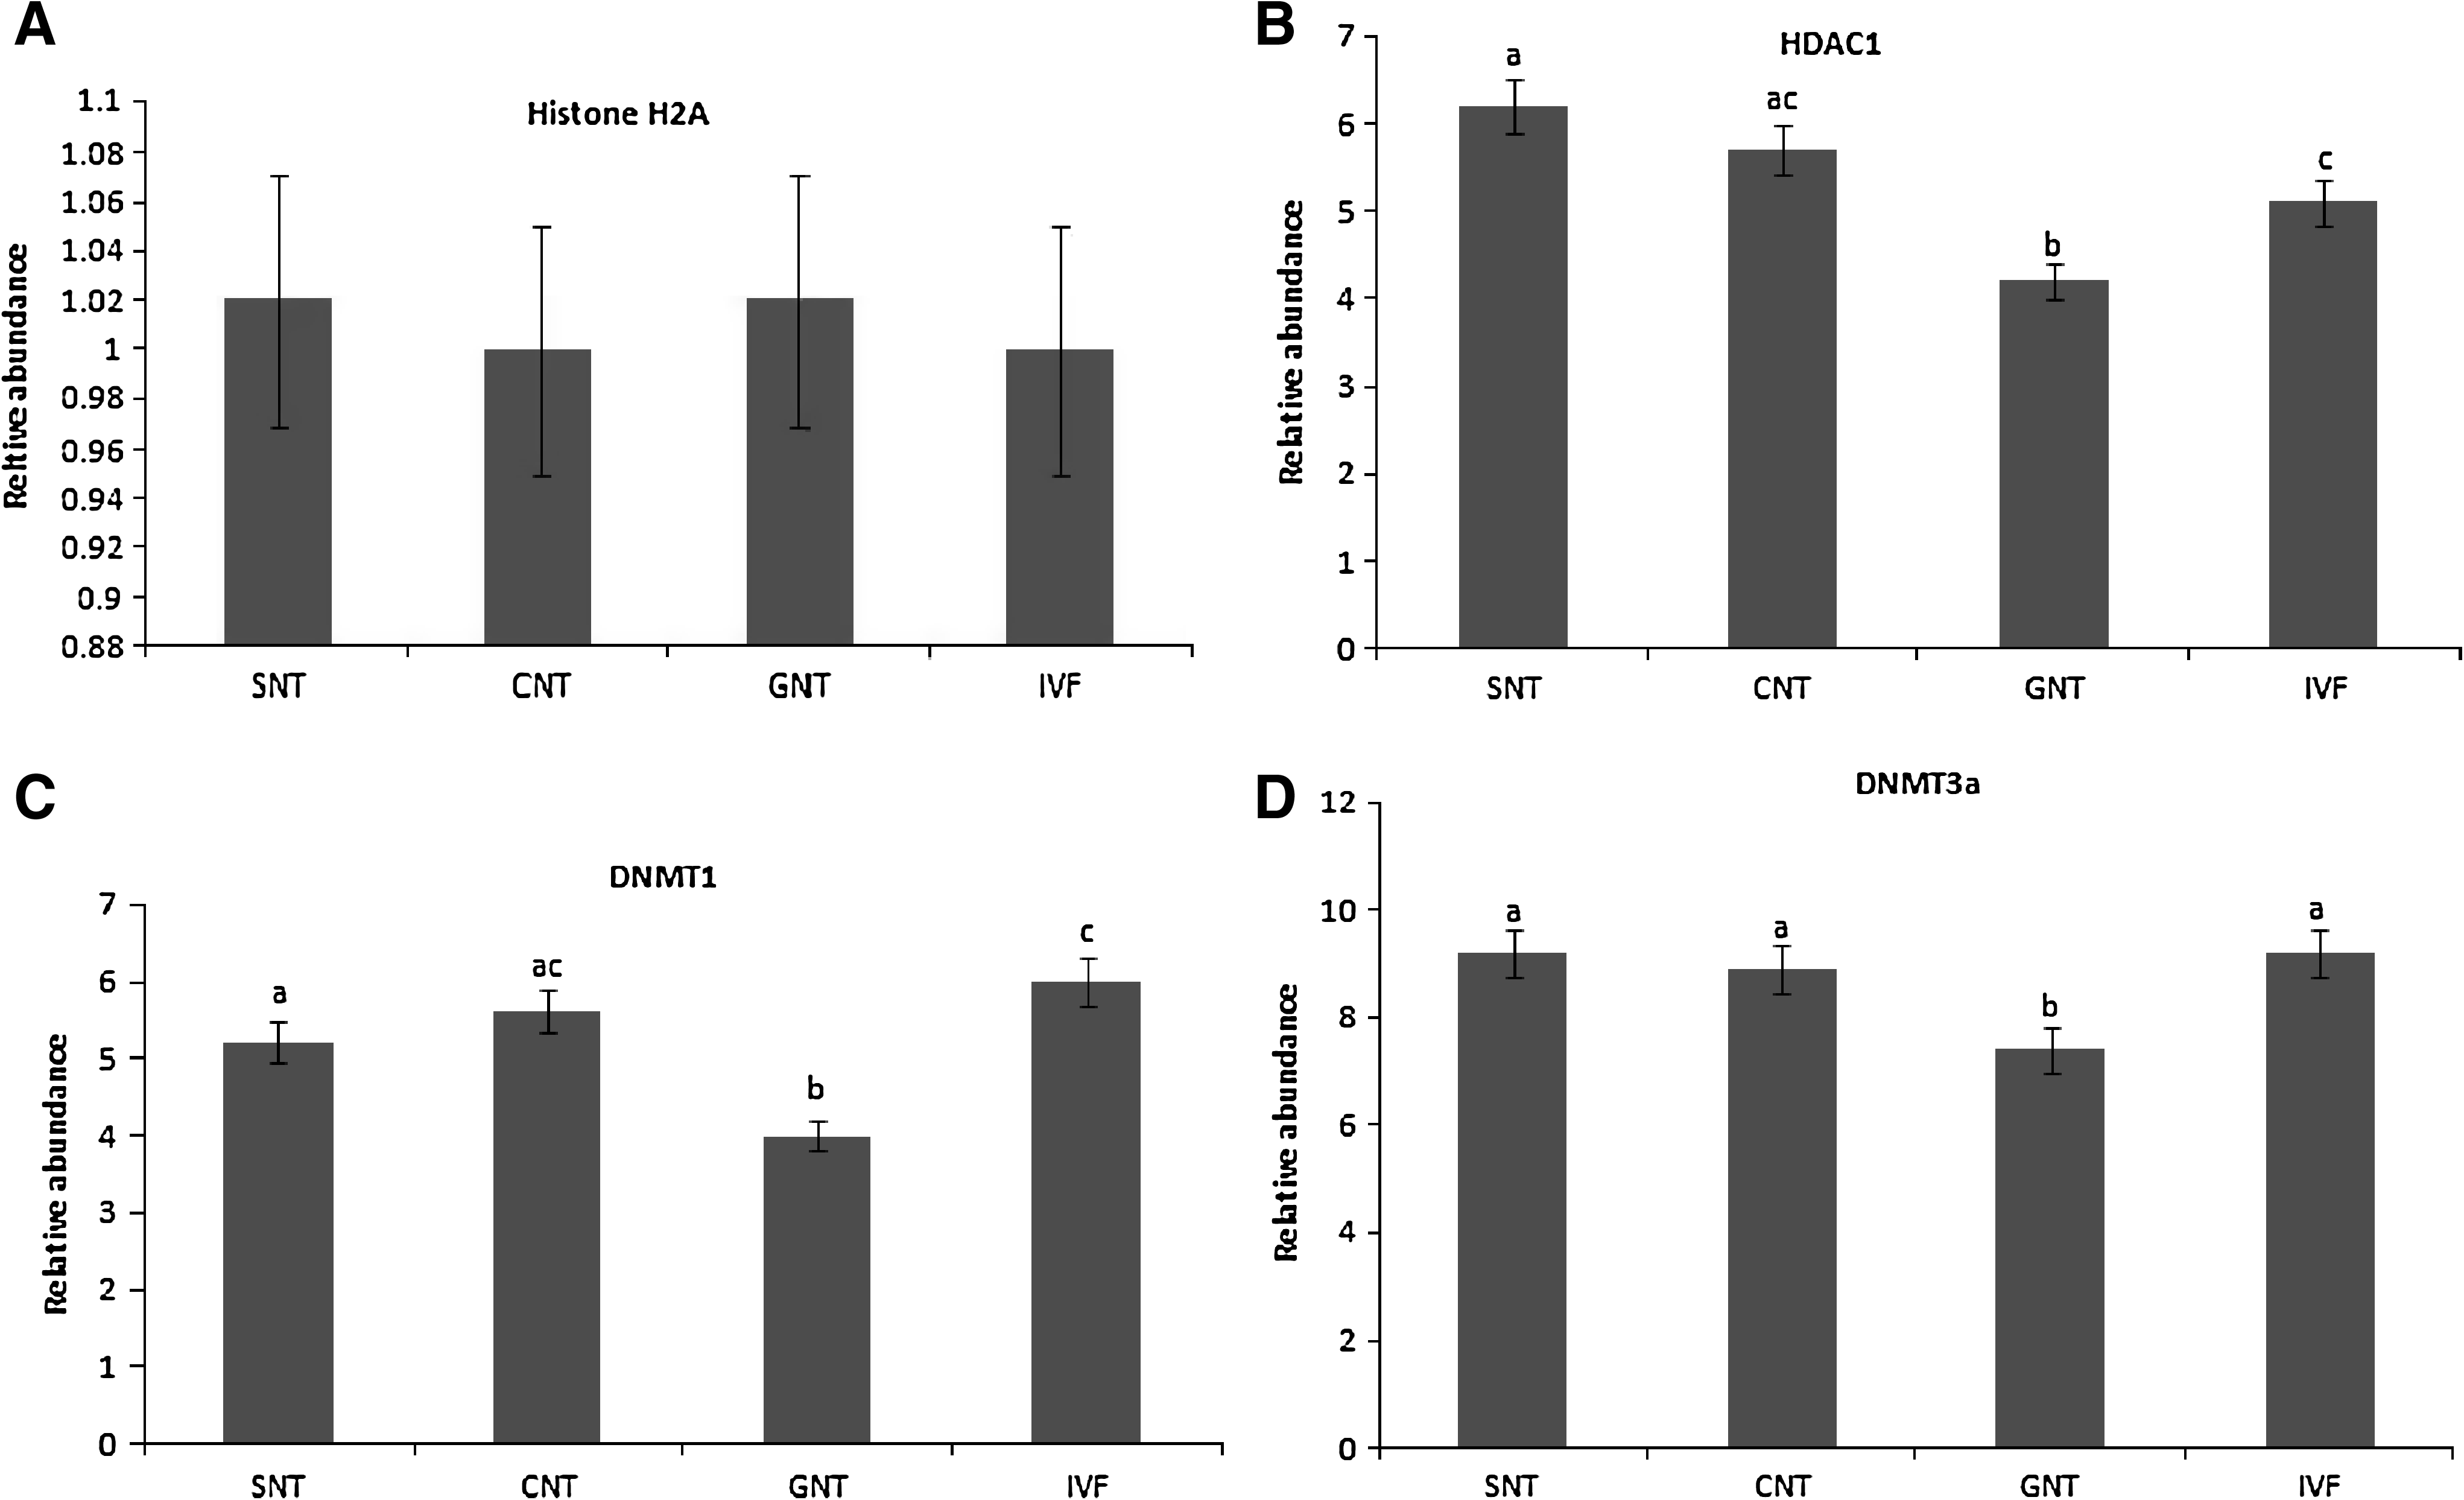
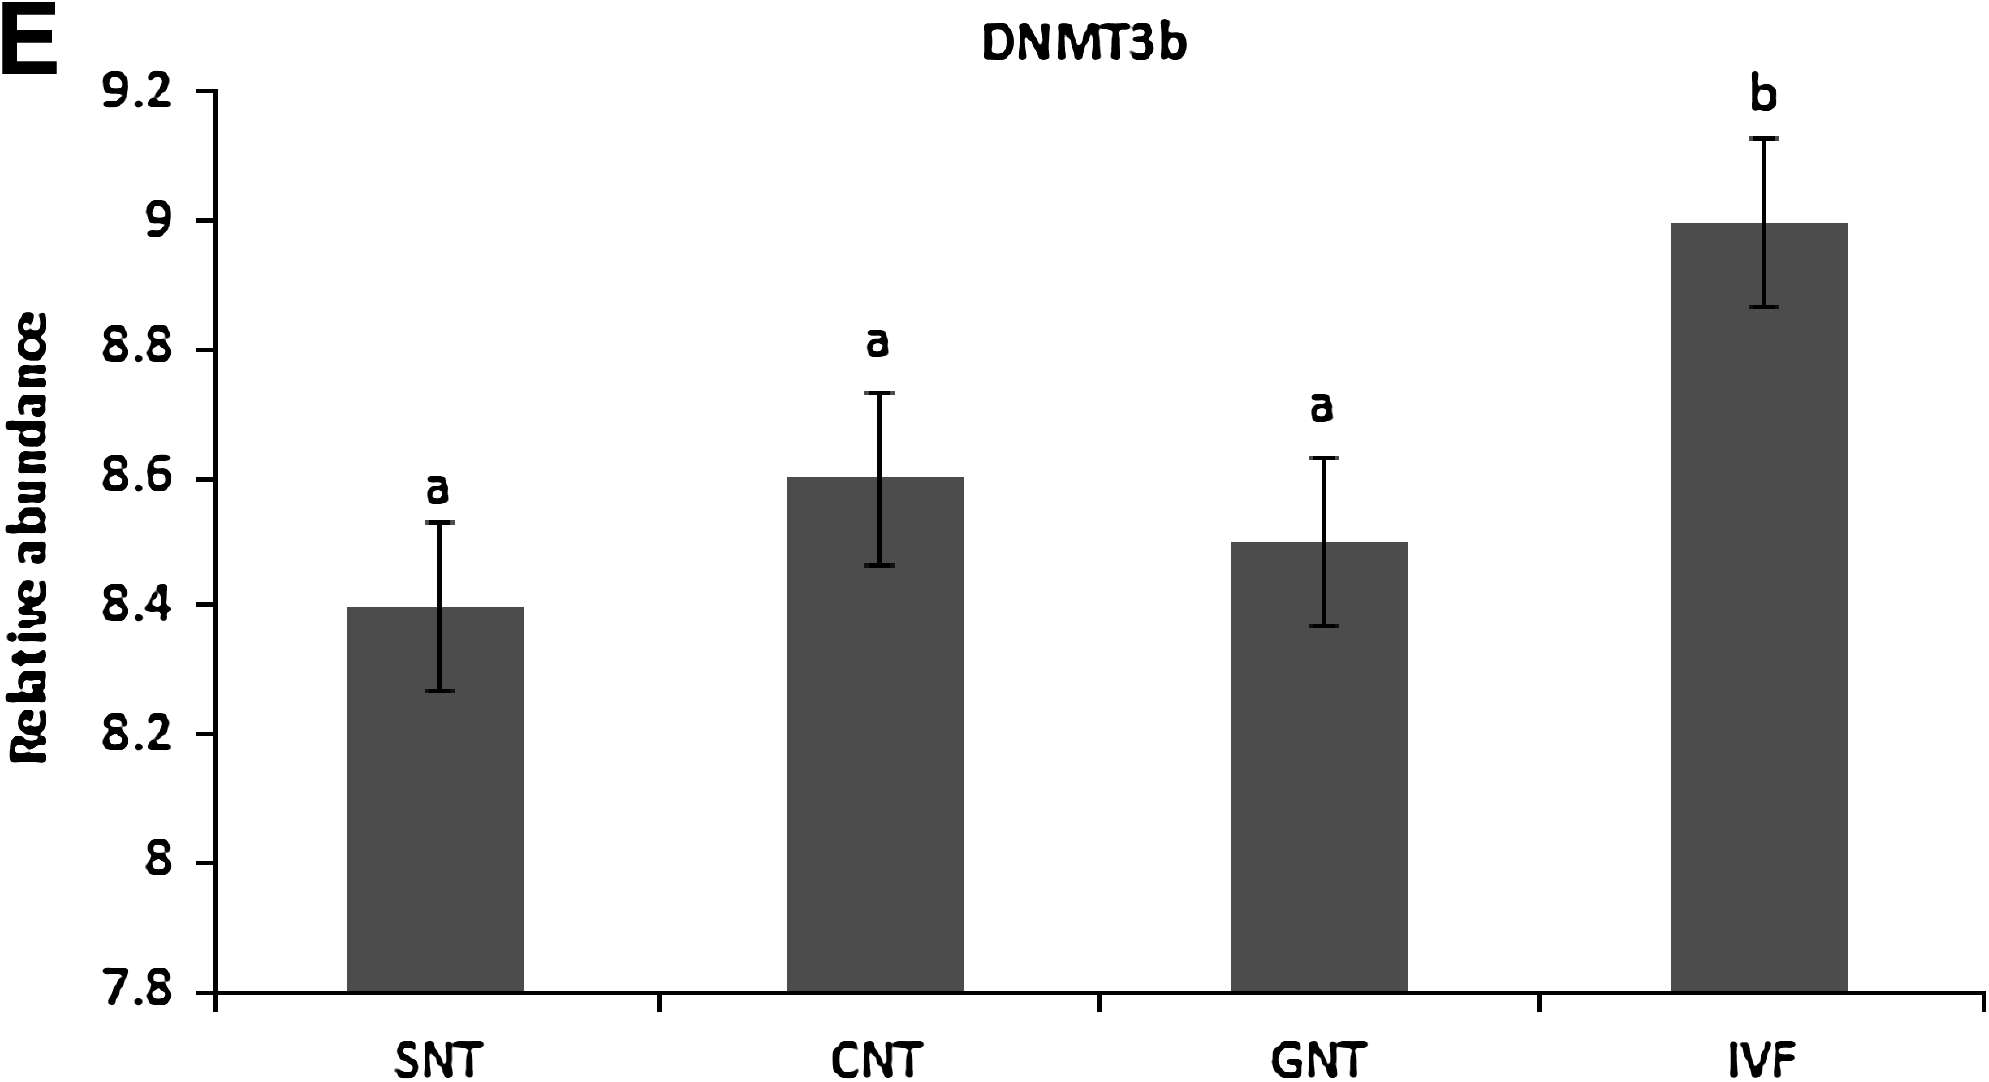
The H2A mRNA was uniformly expressed in all SCNT groups (Fig. 4A). Relative gene expression of HDAC1, DNMT1, DNMT3a, and DNMT3b in SCNT and IVF (control) blastocysts were analyzed at the blastocyst stage. Expression of HDAC1 mRNA was significantly higher (p ≤ 0.05) in SNT and was significantly lower (p ≤ 0.05) in GNT compared to IVF blastocysts (Fig. 4B). HDAC1 expression in CNT was not different (p ≤ 0.05) in comparison to IVF blastocysts. The DNMT1 mRNA transcript level in SNT and GNT was significantly lower (p ≤ 0.05) in comparison to IVF blastocysts; however, difference of DNMT1 level in CNT was not significant (Fig. 4C). Expression of DNMT3a was not significantly different (p ≤ 0.05) among SNT, CNT, and IVF blastocysts; however, GNT embryos expressed DNMT3a at significantly lower level than IVF blastocysts (Fig. 4D). DNMT3b expression was similar in SNT, CNT, GNT, and IVF blastocysts (Fig. 4E).
(
Discussion
Quantitation of cellular growth is an important parameter for monitoring the consistency of the culture, optimal time to subculture, optimal dilution, and estimation of plating efficiency (Freshney, 2000). According to Macieira-Coelho (2001), the long-term proliferative behavior of cultured cells corresponds to the specific attributes of the respective organism. Taking these reports into consideration, the cell lines in the present study were subjected to multiple passaging (up to the 15 passages). The CPR, MPDT, and CPD for all the three cell lines across the 15 passages were calculated based on the cell count.
The CPR is often used to determine the response of cells to a particular stimulus (Gupta et al., 2007). In our study, CPR showed significant variation among all the cell lines at an identical passage number. The CPR in skin fibroblast was highest at P-1-3, which decreased in later passages in each cell line. In the cumulus cell line proliferation rate was lower in early passages and increased as the culture progressed (seven to nine passages) and then again declined in later passages. The variation due to passaging was significant (p ≤ 0.05). The improved cell proliferation rates during early passages of the skin fibroblast cell line could be due to some degree to the admixture of epithelial type cells, whereas the cultures in later passages were free from such cells. The variation in the proliferative capacity of each cell line may differ, due to nutritional requirements, structural matrices of cells, and differential interactions with culture environmental conditions (Clark et al., 2003).
CPD during the entire culture period reflects the mitotic potential of the cell line (Hayflick 1965). In our study, the CNT cell line showed the highest CPD in comparison to the SNT and GNT cell lines. Merz and Ross (1969) and Cristofalo and Scharf (1973) reported that most of the cells are able to cycle through the proliferative lifespan, but there is a constant decrease of percentage of cells capable of rapidly initiating the cell cycle. The CPD achieved by different cell lines during the 15 passages varied markedly These results are in agreement with the results reported in cattle skin fibroblasts by Hill et al. (2001) and in goat skin fibroblasts by Gupta et al. (2007). CNT cell lines showed the highest CPD after multiple passaging up to the 15th passage than the SNT and GNT cell lines.
According to Freshney (2000), the PDT is an average value that applies to the whole population, and it describes the net result of a wide range of division rates, including a lag phase with zero growth in the initial period of culture. In the present study, the PDT in all the three cell lines tended to decrease from P-1-3 to P-13-15 except to P-1-3 of the CNT and P-10-12 of the GNT cell lines. CNT cells growth rate was faster than SNT and GNT cells, as the lowest PDT was found in the CNT cell line during different passages. Hill et al. (2001) reported the PDT 27.1 h in the first eight passages and 34.84 h in 9–18 passages of bovine fibroblast cells. Similar trends of PDT in goat skin fibroblasts subjected to multiple passaging have been reported by Gupta et al. (2007). However, the increase in PDT in the late passages could be due to the effect of replicative aging of all the three cell lines. The cell viability varied from 95 to 100% in different passages across different cell lines, and each cell line showed almost 100% viability at P-7-9. Hill et al. (2001) and Gupta et al. (2007) reported similar cell viability in skin fibroblasts in different passages.
Levels of the genes evaluated in the present study have a critical role in early embryonic development (Beyhan et al., 2007). Therefore, their expressions were checked in SNT, CNT, and GNT cell lines at P-0, P-3, P-6, P-9, P-12, and P-15. The transcript levels of all the four genes changed during the in vitro culture period of all the three cell lines. Reduction in the expression of HDAC1, DNMT1, and DNMT3a was observed in all the three cell lines at later passages (P-12 and P-15) compared with cells at earlier passages (P-3 and P-6), whereas the expression level at P-9 was found to be intermediate between earlier and late passages without any significant differences. However, DNMT3b mRNA remained constant. Our results are consistent with the Giraldo et al. (2008), where skin fibroblast cells at early and late passages showed differential expression pattern of DNMTs. Although the expressions of these four genes were more or less similar in cumulus cells, they varied substantially in fibroblast and granulosa cell lines. Amarnath et al. (2007) also reported differential expression pattern of other developmentally important genes between CNT and SNT cell lines with similar types of observations.
On the basis of our cell study reports of PDT, CPR, cell viability, and chromatin remodeling mRNAs (HDAC1, DNMT1, DNMT3a, and DNMT3b) expression of SNT, CNT, and GNT cell lines, cells from passage group 7–9 were selected for somatic cell nuclear transfer. Hill et al. (2001) and Gupta et al. (2007) also reported these passage groups as the most competent for SCNT.
Overall efficiency of SCNT cloned embryos derived from SNT, CNT, and GNT cells was lesser than IVF embryos. Cleavage and blastocyst production rate in CNT was significantly higher than SNT and GNT. Although the exact reason for the differential embryo production rate in the three donor cell types in unknown, differences in CPR, CPD, and cell viability reported in this study and epigenetic markers, such as DNA methylation, histone modification, and binding of nonhistone protein to chromatin among the different cell types (Morgan et al., 2005), could be the cause for developmental variation.
Subsequent to nuclear transfer, HDAC1, DNMT1, and DNMT3a genes that were differentially expressed in SNT and CNT cell lines had similar levels of mRNA expression in the blastocyst produced from these donor cells. Furthermore, the relative level of expression of DNMT1, DNMT3a, and DNMT3b in CNT blastocysts was comparable to those in the IVF-derived blastocysts. This supports the notion that oocyte have a unique potential to reprogram the gene expression of differentiated donor cells with a different epigenetic makeup to that of the embryonic state, thereby supporting early embryonic development and term (Meissner and Jaenisch, 2006).
At the blastocyst stage HDAC1 expression was similar between CNT and IVF control, whereas it was significantly higher in SNT and lower in CNT embryos in comparison to IVF control. Although, it is difficult to draw conclusions based on gene expression at the transcriptional level, it is tempting to speculate that increased HDAC1 levels in SNT embryos might indicate a requirement for an increased transcription repressive activity to reprogram the somatic cells. Expression level of HDAC1 in GNT blastocysts was significantly lower than those of SNT, CNT, and IVF controls. This might be an indication of failed reprogramming of inefficient donor nuclei after transfer in oocyte cytoplasm. According to Beyhan et al. (2007), donor cell efficiency has great impact on the HDAC1 mRNA expression in SCNT embryos, and this might be a reason for the differential HDAC1 expression in cloned blastocyst produced from different cell lines.
DNMT1 was differentially expressed in SNT and GNT blastocysts and was similar in CNT in comparison to IVF controls, although persistent execution of the donor cell program and possible differences in the physiology and metabolism of the SCNT embryos produced from different types of donor cells (Gao et al., 2003) might be responsible for the differential expression of DNMT1 gene. It is also possible that the differences in the transcriptional status resulted in inappropriate or premature translation of DNMT1 due to the loss or disruption of some as yet unidentified translational control mechanisms in different donor cell types.
Expression of DNMT3a in SNT and CNT was similar to that of IVF control, whereas it was lower in GNT. This suggests that differential DNMT3a mRNA levels in GNT have serious implications for the preimplantation development, and resulted in the lowest number of blastocyst formation of granulosa-derived blastocysts. Further aberrant epigenetic reprogramming in cloned embryos might be responsible for some developmental defects observed in SCNT embryos and fetuses. Given the possible role in de novo methylation (Okano et al., 1999), altered level of DNMT3a expression might contribute to the imprinting problems observed in cloned embryos.
In the present study, DNMT3b expressions was maintained throughout preimplantation development at normal levels. Chen et al. (2003) hypothesized the role of DNMT3b in laying down allele-specific imprints and methylating the viral sequences of the genome. Expression of DNMT3b mRNA may be required at high levels to achieve their developmental function, and thus, their expression is maintained in blastocysts derived from all the three nuclear donors.
Li et al. (2006), Beyhan et al. (2007), and Jang et al. (2005) also reported that there were differential expressions of genes between SCNT embryos produced from different types of donor cells. In this study CNT cells took less time to complete their cell cycle and had better cell proliferation rate in comparison to SNT and GNT cell lines. Expressions of HDAC1, DNMT1, DNMT3a, and DNMT3b at different passage groups were more or less similar in CNT cells but they varied substantially in SNT and GNT cell lines. SCNT embryos generated using cumulus cells were able to produce a greater number of apparently normally developing blastocysts and normal level of expression of HDAC1, DNMT1, DNMT3a, and DNMT3b mRNA. Abnormal gene expression of these genes were noted in the SNT and GNT blastocysts, indicating inefficient or delayed nuclear reprogramming and embryo growth in SNT and GNT.
Overall, our results indicate that cumulus cells are the best nuclear donor for the somatic cell nuclear transfer experiment on the basis of their cell proliferation and epigenetic reprogramming capabilities. This is the first study to investigate the differences in gene expression patterns in cloned buffalo embryos with respect to the three types of somatic cells. Ours and several other studies indicate that a number of genes are expressed uncharacteristically in SCNT embryos. Our studies indicate that the expression level of these genes is relatively less related to the production efficiency of developing preimplantation embryos in culture and a greater number of genes might be characteristically participating in the reprogramming of SCNT-derived embryos. Recent application of genomics approaches to gene expression analysis in SCNT embryos and differences that cause differential expression of certain genes remains elusive. Studies addressing these questions at different levels with a variety of different approaches could bring about crucially needed information in the future.
Footnotes
Author Disclosure Statement
The authors declare that no conflicting financial interests exist.