
Abstract
Abstract
Skin-derived progenitors (SKP) are neural crest derived and can generate neural and mesodermal progeny in vitro, corresponding to the multipotency of neural crest stem cells. Likewise, neural stem/progenitor cells (displaying as neurospheres) have the capacity of self-renewing, and can produce most phenotypes in the nervous system. Both form spheres when cultured with epidermal growth factor (EGF) and basic fibroblast growth factor (bFGF). Although the “stemness” of neural stem/progenitor cells has been extensively investigated, the molecular comparison of SKP spheres and neurospheres has not been elucidated. Here, SKP spheres and neurospheres from the same individual porcine fetuses were isolated with the same culture medium, and the multipotency was tested by in vitro differentiation assays. Microarray analysis was used to illustrate the “stemness” of SKP spheres and neurospheres. The upregulated genes that were in common in the SKP spheres and neurospheres are involved in ribosome, tight junction, gap junction, cell communication, calcium signaling, ErbB signaling, JAK–STAT signaling, MAPK signaling, etc. The differentially expressed genes between SKP spheres and neurospheres are mainly involved in ECM–receptor interaction and the transforming growth factor-beta (TGF-β) signaling pathway. Finally, treatment with leukemia inhibitory factor (LIF) or MEK inhibitor results in a distinctive impact on the “stemness” and differentiation genes of SKP spheres and neurospheres. Thus, the cell-intrinsic genetic program may contribute to the innate “stemness” of SKP spheres and neurospheres in a similar local microenvironment.
Introduction
The genetic and epigenetic regulation of the “stemness” in multipotent/pluripotent stem cells has been elucidated during the past decades (Cole and Young, 2008; Jaenisch and Young, 2008; Surani et al., 2007). Recent studies show that transcriptional regulatory circuitry is fundamental to understand the molecular machinery of pluripotency, which is exemplified by the core transcriptional regulatory circuitry centered on OCT4, SOX2, and NANOG and the integration of external signaling pathways with the core transcriptional network in embryonic stem (ES) cells (Boyer et al., 2005; Chen et al., 2008). The key features of transcriptional regulatory circuitry have been further demonstrated by the reprogramming of fibroblast (Takahashi and Yamanaka, 2006) or terminally differentiated B lymphocytes (Hanna et al., 2008) into pluripotent stem cells by defined factors. However, the transcriptional regulation of multipotency and self-renewal of adult stem cells has still been elusive, although a series of transcriptional profiling experiments have been carried out to identify the “stemness” gene or stem-cell molecular signatures on ES cells (Ivanova et al., 2002; Ramalho-Santos et al., 2002), hematopoietic stem cells (Georgantas et al., 2004; Terskikh et al., 2003), mesenchymal stem cells (Ng et al., 2008), neural stem cells (Maisel et al., 2007; Shin et al., 2007), NCSCs (Hu et al., 2006; Thomas et al., 2008), and epithelial stem cells (Doherty et al., 2008; Tumbar et al., 2004). The variation of transcriptional regulation may be caused by the noise of various genetic backgrounds or different extrinsic stimuli, which may trigger stem cells to display differential transcriptional profiling because transformation or reprogramming is likely to happen during long-term culture (Chang et al., 2008; Hochedlinger and Jaenisch, 2006). Additionally, the heterogeneity of ES cells and adult stem cells cause them to oscillate between one or more metastable states, making it more difficult to define a certain transcriptional state (Chou et al., 2008; Graf and Stadtfeld, 2008). It has been argued that pluripotency of stem cells in culture could represent a ground state independent of extrinsic instructions (Silva and Smith, 2008; Ying et al., 2008). Thus, a relatively stable “niche” will be indispensable to uncover the transcriptional regulation of multipotency and self-renewal of adult stem cells in vitro.
Previously we isolated porcine SKP spheres and dissected the mesodermal potency of SKP spheres by microarray analysis (Zhao et al., 2009, 2010). Here we aimed to decipher the neural potency of SKP spheres by comparing their transcriptional profiling with that of neurospheres. SKP spheres and neurospheres were isolated from the same individual fetuses to remove genetic background variation and cultured in the same medium so that the sphere “niche” can be kept in a relatively stable state. It appears that SKP spheres and neurospheres share common pathways but employ different signaling pathways for their individual “stemness” properties.
Materials and Methods
Animal use and care have been reviewed and approved by the Animal Care and Use Committee (ACUC) at the University of Missouri.
Cell isolation and cultures: SKP spheres and neurospheres
Unless indicated otherwise, media and components used in this study were purchased from Sigma (St. Louis, MO, USA).
Porcine SKP spheres ware isolated as described (Zhao et al., 2009). Then neurospheres isolation was modified accordingly (Deleyrolle and Reynolds, 2009). Briefly, embryonic brain tissue was collected from day 40–50 pCAG-EGFP transgenic porcine fetuses in a sterile laminar flow hood (Whitworth et al., 2009). The EGFP transgenic cells were used so that a marker is available for future studies where it will be necessary to track the SKP spheres and neurospheres in vivo. The brain tissues were washed with D-PBS (Invitrogen, Carlsbad, CA, USA) three times and chopped up into small pieces. The dissected tissue was then dissociated with a 200-μL pipette and then triturated approximately 10 times until a milky single cell suspension was achieved. The dissociated cells were washed three times with DMEM/F12 medium (1:1, Invitrogen) and then poured through a 40-μm strainer (BD Biosciences, Franklin Lakes, NJ, USA). The single cells were collected by centrifugation and were counted on a hemocytometer. The cells were then suspended with basic medium containing DMEM/F12 (1:1), B27 (50 × , Invitrogen), N2 (100 × , Invitrogen), 20 ng/mL EGF, 40 ng/mL bFGF, and Glutamine (100 × , Invitrogen) and cultured in suspension dishes (Sarstedt, Newton, NC, USA) for 3 days. Afterward, an appropriate volume of culture medium with 2 × growth factors and supplements were added to complement the depletion. The neurospheres appeared in 5–7 days and were harvested for RNA isolation or stored in liquid nitrogen. The SKP spheres and neurospheres were collected from six individual fetuses across three litters.
Immunocytochemistry
Cell cultures were washed with PBS to remove the residual medium and fixed with 4% paraformaldehyde for 20 min. The cells were then permeabilized with 0.1% Triton X-100 for 20 min at room temperature (RT). The fixed cells were washed and blocked with PBS/10% fetal bovine srum (FBS) (Hyclone, Logan, UT, USA) for 2 h at RT and then incubated with primary antibody diluted in PBS/FBS overnight at 4°C. Following the wash they were incubated with secondary antibody for 1 h at RT. Finally, they were incubated with Hoechst 33342 for 15 min. A parallel culture was stained only with secondary antibody as negative control and the culture without any antibody was used as a blank control. Primary antibodies were monoclonal anti-nestin (Santa Cruz Biotechnology, Santa Cruz, CA, USA; 1:200), monoclonal anti-GFAP (Sigma, 1:250), monoclonal antitubulin β-III (Sigma, 1:250), monoclonal anti-GFAP (Sigma, 1:250), monoclonal anti-NFM (Abcam, Cambridge, MA, 1:100), monoclonal anti-p75NTR (Abcam, 1:100) monoclonal anti-SMA (Abcam, 1:200), and monoclonal anti-tubulin β-III (Sigma, 1:250). Secondary antibodies were Alexa Fluor® 594 goat anti-mouse IgG (H + L) (Invitrogen, 1:500). The images were captured by a DS Camera Control Unit DS-U2 (Nikon, Melville, NY, USA) and processed by the NIS-Elements imaging software (Nikon).
Differentiation assay
The differentiation of SKP spheres was described before (Zhao et al., 2009). Intact neurospheres were introduced into poly-D-lysine (0.1 mg/mL)/laminin (0.02 mg/mL)-coated four-well chamber slides (Nunc, Rochester, NY, USA) and incubated with basic medium plus 1–2% FBS overnight to facilitate cell attachment. On the next day the medium was replaced by differentiation medium (DMEM/F12 + B27 +N2 + Glutamine). The medium was changed every 3 days by removing half of the old medium and adding the same volume of fresh medium with 2 × growth factors and supplements. The cultures were kept for 1–2 weeks and then subject to immunocytochemistry.
RNA isolation and amplification
Total RNA was extracted by using an AllPrep DNA/RNA mini kit (Qiagen, Valencia, CA, USA) following the manufacturer's instructions. The quality and quantity of total RNA were measured by NanoDrop Spectrophotometer (Thermo Fisher Scientific Inc., Wilmington, DE, USA). The total high-quality RNA was applied to WT-Ovation Pico RNA amplification system (NuGEN, San Carlos, CA, USA) for reverse transcription and cDNA amplification. The input amount of RNA was 5 ng and produced several micrograms of amplified cDNA (acDNA). The acDNA was purified by Micro Bio-Spin 30 Columns in RNase-Free Tris (Bio-Rad Laboratories, Hercules, CA, USA). The purified acDNA was aliquoted into 1 μg per vial and stored at −80°C.
Reference RNA (Ref RNA) preparation
The reference RNA sample was created by isolating total RNA from a large representation of nonreproductive and reproductive tissues across different developmental stages (Whitworth et al., 2004, 2005). The tissue RNA was extracted by using RNA Stat 60 protocol (Tel-Test, Friendswood, TX, USA) from a wide range of tissues. The total RNA of nonreproductive and reproductive tissues was mixed to a final ratio of 1:1. Then Ref RNA was reverse transcribed by SuperScript III First-Strand Synthesis System for RT-PCR (Invitrogen). After terminating reactions, the synthesized cDNA was purified by Micro Bio-Spin 30 Columns in RNase-Free Tris. The purified cDNA was divided into 1 μg per vial and stored at −80°C.
cDNA microarray preparation
The EST-based cDNA microarray platform was established at University of Missouri–Columbia (Whitworth et al., 2005). The general information of EST clones can be browsed at the Website: http://genome.rnet.missouri.edu/Swine/.
Labeling and hybridization
The starting amount of purified Ref cDNA or acDNA sample to be labeled and hybridized was 1 μg. To determine the effect of both amplification and dye-to-dye labeling an initial dye-swap experiment was performed on amplified and unamplified Ref cDNA. Initially, unamplified Ref cDNA was labeled Cy3 and the amplified Ref cDNA was labeled with Cy5. This labeling pattern was then reversed (swapped) for a total of four replicates. The dye-swap experiment showed no difference between amplified or unamplified Ref cDNA and no effect of labeling with Cy3 or Cy5. Once this was determined the sample RNA was always amplified and labeled with Cy5 and the Ref cDNA was always labeled with Cy3 for the following experiments.
The labeling kits used for this experiment include ULYSIS Alexa Fluor 647 Nucleic Acid Labeling (Cy5) and ULYSIS Alexa Fluor 546 Nucleic Acid Labeling (Cy3) (Invitrogen). Briefly, Ref cDNA and acDNA were fragmented by incubation with DNase I at 37°C for 15 min. Fragmented cDNA was labeled with Cy3 or Cy5 and purified using KREA pure dye removal purification columns (Kreatech Biotechnology, Amsterdam, The Netherlands). Absorbance was then captured at 260, 280, 550, and 650 nm to determine cDNA and dye concentration and also to calculate the degree of labeling (DoL) for Cy3 and Cy5. These measurements were all performed using a NanoDrop Spectrophotometer, and calculations were performed on the following Website (http://www.kreatech.com/Default.aspx?tabid=411). All DoL calculations fell within the recommended range of 1–3.6%. Cy5-labeled acDNA from the experimental samples and Cy3-labeled Ref cDNA were then combined into one tube, dried using the Centrivap concentrator system, and resuspended in hybridization buffer (50% formamide, 0.1% SDS, 5 × SSC). Poly A (20-mers, Integrated DNA Technologies, Coralville, IA, USA) was also added to the hybridization buffer to prevent binding of the poly A region to the 3′ cDNAs on the microarray. Samples were denatured at 95°C for 3 min, cooled to RT, and subsequently applied from one end of the microarray slide under a Lifter Slip (Erie Scientific Company, Portsmouth, NH, USA). Microarrays were incubated in a shake-and-bake hybridization oven at 42°C for 16 h with gentle shaking.
Microarray replicates
Each biological replicate consisted of RNA from 1 × 10⁵ cells of SKP spheres or neurospheres. Each biological replicate was analyzed on two microarrays for technical replication, resulting in three biological replicates and two technical replicates, that is, six microarrays measurements/treatments.
Wash and scan arrays
After hybridization, the arrays were sequentially washed by washing solution I (2 × SSC/0.1% SDS) twice, washing solution II (0.1 × SSC/0.1% SDS) once and washing solution III (0.1 × SSC). Each wash was performed on a shaker for 4 min and covered with foil to avoid light. The slides were then transferred into 95% ethanol immediately and dried by centrifugation at 1500 rpm for 5 min. The arrays were scanned by GenePix 4000B (Molecular Devices, Sunnyvale, CA, USA). The PMTs for wave lengths 532 and 653 were appropriately adjusted to ensure that the count ratio of Cy3 and Cy5 is 1.0. For every slide, the image was processed by GenePix Pro 4.1 (Molecular Devices) to assess the spot quality. The gene list was loaded onto the images and poor-quality spots (smeared or saturated) were removed manually. Then the raw results files were generated as input data for further analysis.
Data analysis by GeneSpring GX 7.3.1
The raw result files were loaded into GeneSpring GX 7.3.1 (Agilent Technologies, Santa Clara, CA, USA). The measurements were filtered to remove genes whose raw intensities were very close to background and prone to producing erroneous results. All slides were Lowess normalized per spot and per chip. One-way analysis of variance (ANOVA) was performed by using a parametric test with variances not assumed equal (Welch t-test) and false discovery rate cutoff of 0.05 with Benjamini and Hochberg multiple correction test. The condition tree was created based on global gene expression of SKP spheres and neurospheres. The gene ontology (GO) terms can be generated by GeneSpring GX 7.3.1 when connecting to a local annotation database. In addition, molecular signatures of SKP spheres and neurospheres were enriched by filtering out the genes of expression levels with and equal to or greater than twofold change compared with Ref cDNA.
Database for annotation, visualization and integrated discovery (DAVID) analysis
The online DAVID version 2008 was employed to perform functional annotation analysis (Huang da et al., 2009). The enriched gene lists and differentially expressed gene lists were submitted and converted into DAVID Gene IDs. Subsequently, the uploaded DAVID lists were subjected to functional annotation clustering, which uses fuzzy clustering by measuring the relationships among the annotation terms on the basis of the degree of their coassociation with genes within the user's list to cluster somewhat heterogeneous, yet highly similar annotation into functional annotation groups. A higher enriched score indicates that the gene members in the groups are involved in more important roles, which can be visualized by a 2D view tool. In addition, the identified KEGG pathway (http://www.genome.jp/kegg/pathway.html) can be found in functional annotation tables.
Unigene annotation of microarray
Sequences passing initial quality assessment were clustered based on a 0.95 sequence homology criteria to produce a project unigene set. The longest member of each cluster was chosen to represent the cluster. The annotation associated with each cluster is based on a multilevel strategy that involves multiple searches of several reference databases. The databases were searched in the order Human Reference Sequences (HumRefSeq), Vertebrate Reference Sequences (VertRefSeq), Unigene, and GenBank EST (GBEST), and the nonredundant nucleotide (NR) database from GenBank. The resulting BLASTN score from each database search, in turn, was compared with a threshold score. If the score was greater than the threshold, the corresponding annotation from the best hit was used as the annotation, and if not, then the next database was searched. A threshold value (score) of 100 was used when searching HumRefSeq and VertRefSeq while a threshold value of 100 (200 for Sus Scrofa hits) was used when searching the Unigene sequences. The threshold for searching the GBEST database was 100, whereas that of NR was 200. If none of these criteria were met, the sequence was considered to be unique. The resulting annotations were placed into a table listing the sequence name, database, BLAST score, E-value, and annotation of each member of the unigene set.
Real-time qPCR validation
Microarray results were verified by real-time qPCR. Eight genes were selected, which have significantly different expression levels between SKP spheres and neurospheres. The primers were synthesized by Integrated DNA Technologies and shown in Table 7. Real-time qPCR was performed by using Power SYBR Master Mix in ABI Prism 7500 real-time PCR system following manufacturer's instructions (Applied Biosystems, Carlsbad, CA, USA). The expression levels were analyzed by the relative standard curve method. Gradient dilutions (1/10 × ) of Ref cDNA were used to create standard curves. The housekeeping gene GAPDH was used as a calibrator gene.
LIF and MEK inhibitor treatments
Passage 2 SKP spheres and neurospheres were treated with either 10 ng/mL LIF (Millipore, Billerica, MA, USA) or 50 μM MEK inhibitor PD98059 (Cell Signaling Technology, Danvers, MA, USA) in basic medium (see above, Cell isolation and cultures) for 3 days. Thus, in total, there were six different treatments: SKP, SKP–LIF, SKP–MEK, NSC, NSC–LIF, and NSC–MEK. Then the treated cells were harvested and total RNA was extracted by using RNeasy Plus Mini Kit (Qiagen). The first-strand cDNA was synthesized by QuantiTect Reverse Transcription Kit (Qiagen). Real-time qPCR was performed by using iQTM SYBR Green Supermix (Bio-Rad) in My iQ Single-Color Real-time PCR Detection System (Bio-Rad). The strategy for data analysis was the same as described above. The target genes were focused on “stemness” genes (NANOG, SOX2, STAT3, and SOX9) and lineage specific marker genes (NESTIN, GFAP, p75NTR, and Tubulin β-III). The primers of these genes can be referred to our previous data (Zhao et al., 2009). Real-time qPCR data were obtained from three independent biological replicates and analyzed by one-way ANOVA.
Results
Characterization of SKP spheres and neurospheres
The SKP spheres and neurospheres appeared after 5–7 days of serum-free selection. They shared similar morphology and kept floating in early passages (Fig. 1A–C). After attachment of neurospheres caused by withdrawal of growth factors, neural progeny appeared in a few days (Fig. 1D). Furthermore, GFAP-positive (glial marker) and tubulin β-III-positive (neuron specific marker) cells were observed after 1 week's differentiation (Fig. 1E–F), indicating that porcine neurospheres have the characteristics similar to rodent neural stem cells. For SKP spheres, we observed tubulin β-III+, GFAP+, neurofilament F (NFM)+ and p75NTR+ cells upon differentiation (Fig. 1G–J), showing the neural potency of SKP spheres. In addition, smooth muscle actin (SMA)+ progeny also appeared in differentiation cultures (Fig. 1K), implying that porcine SKP sphere can differentiate into both neural and mesodermal progeny in vitro (Zhao et al., 2009). Thus we demonstrate that both SKP spheres and neurospheres can produce multiple-lineage progeny and are multipotent in vitro.
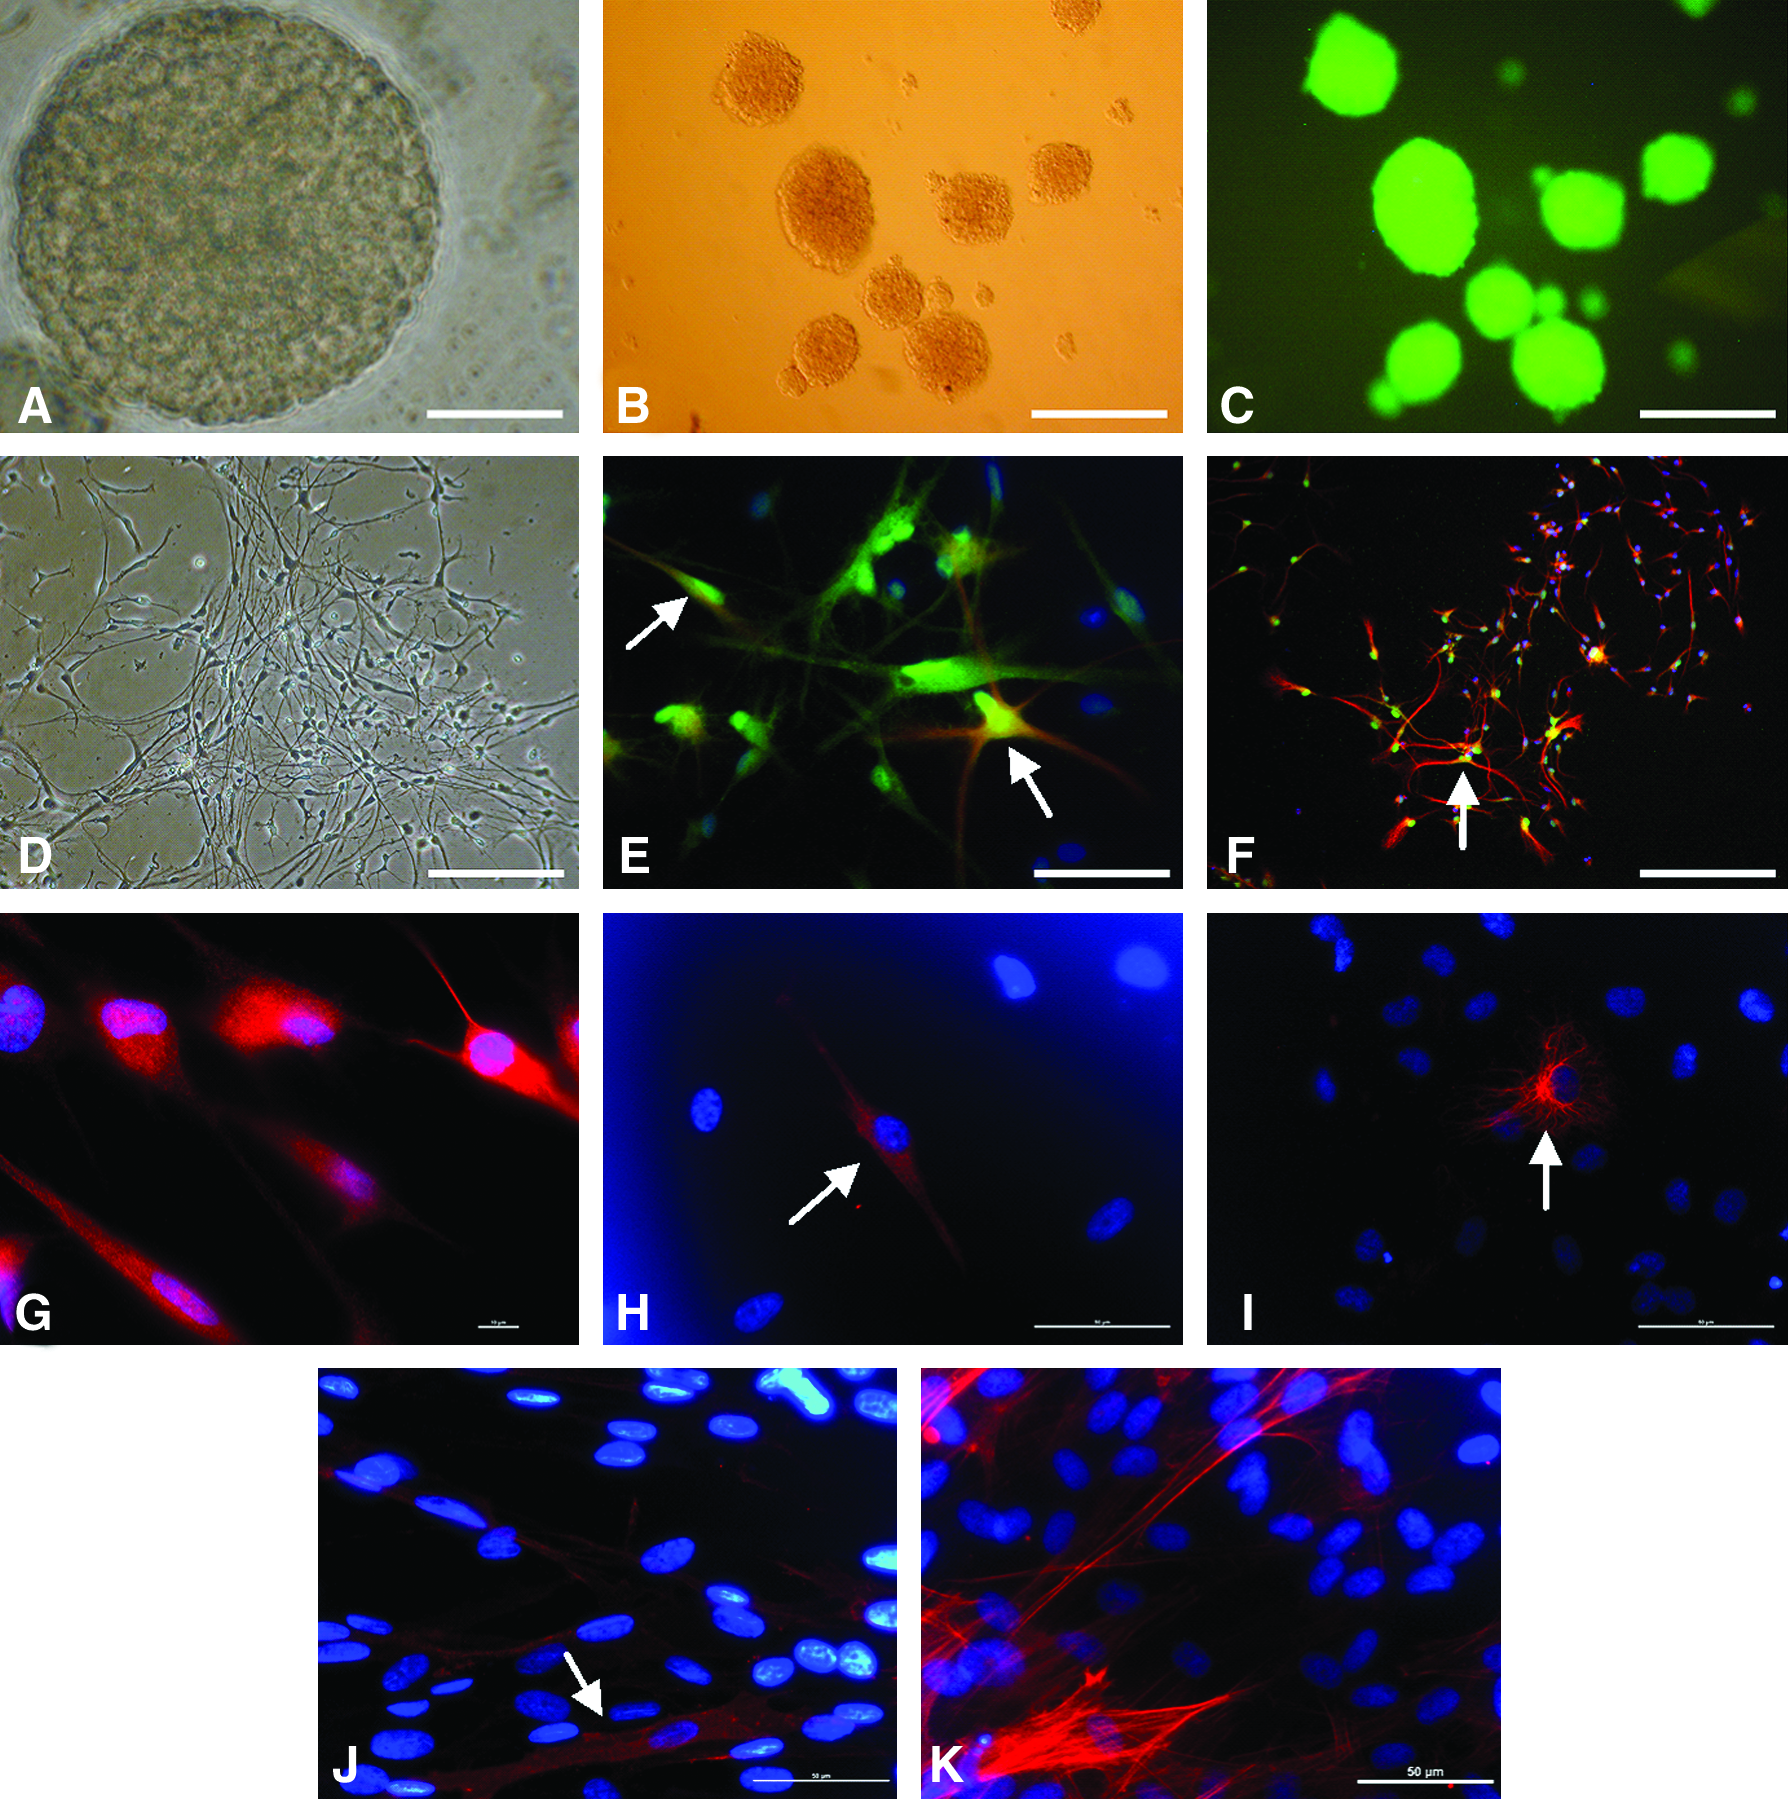
Characterization of SKP spheres and neurospheres in vitro. Typical SKP spheres (
We further compared the expression of specific marker genes in these sphere-forming stem cells. Both SKP spheres and neurospheres expressed transcripts for NANOG, STAT3, TWIST1, p75NTR, nestin, fibronectin, and vimentin (Fig. 2). However, neurospheres expressed high levels of SOX2 (a specific marker for neural stem cells (Suh et al., 2007)). The GFAP was exclusively expressed in neurospheres (Doetsch et al., 1999), whereas SNAI2 was specific for SKP spheres. These data show SKP spheres and neurospheres share a similar marker gene expression profile but possess their specific transcriptional states.
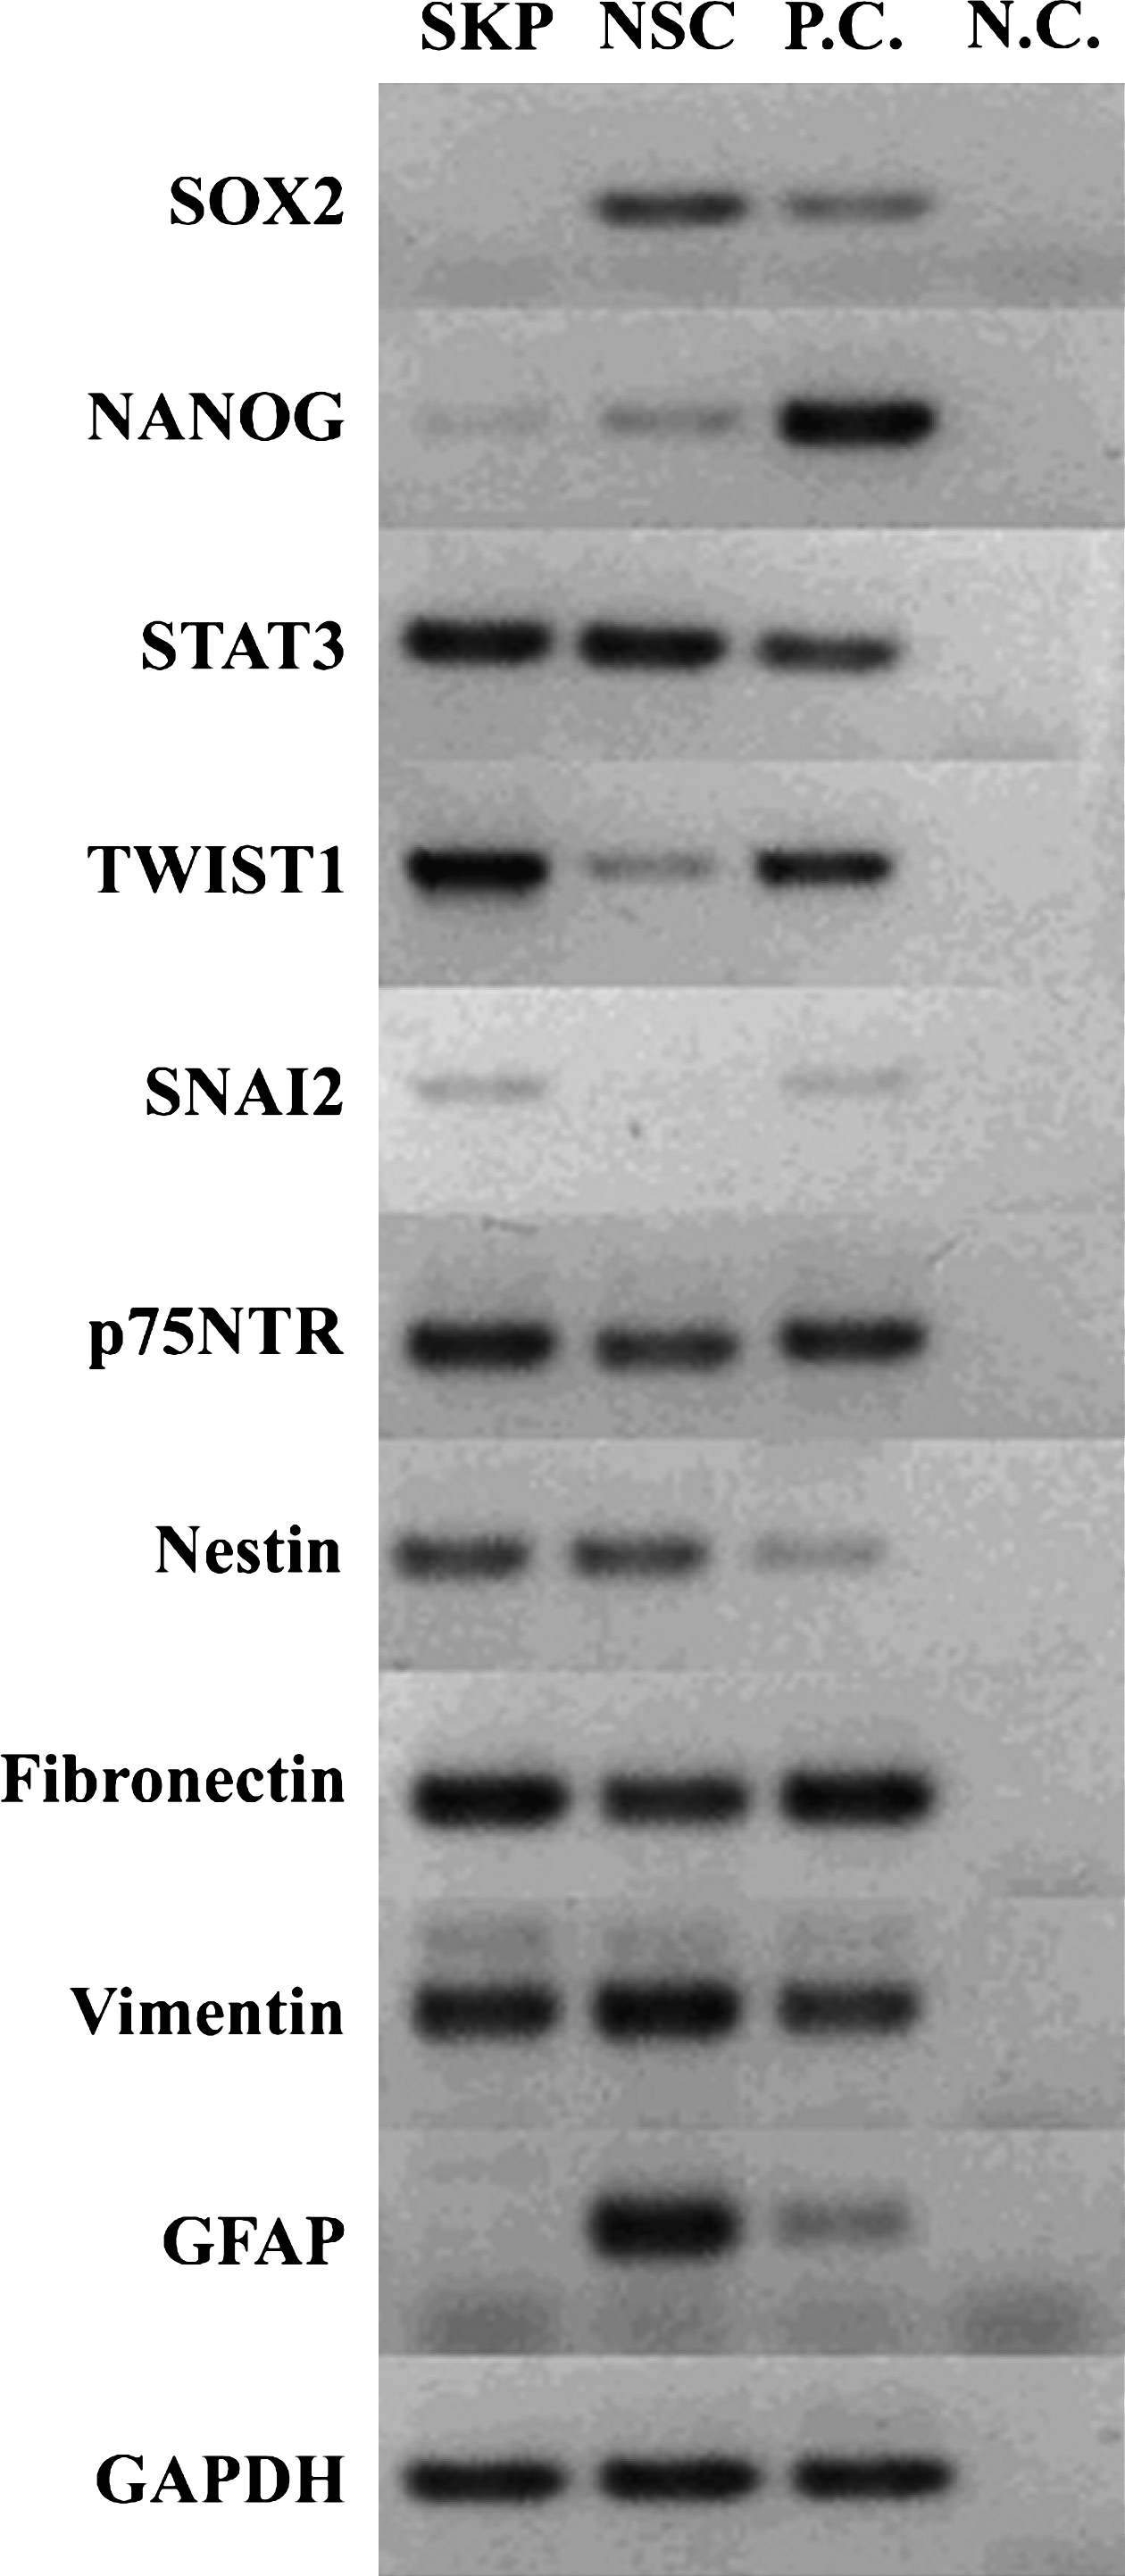
Marker gene expression between SKP spheres and neurospheres. The Ref cDNA was used as the template of positive control (P.C.), whereas no RT was used for negative control (N.C.). The RT-PCR was replicated for three biological samples and only one is displayed. The housekeeping gene GAPDH was used as a loading control.
Molecular signatures of SKP spheres and neurospheres
First, we normalized and filtered the scanned arrays using GeneSpring GX 7.3.1. We then chose the spots with intensity between 1500 and 60,000 in the raw and control data as the reliable data. As we used Cy3 to label the Ref cDNA and Cy5 to label samples, the normalized data should be the relative gene expression levels compared with those of Ref cDNA. Thus we generated a condition tree based on global gene expression of SKP spheres and neurospheres (Fig. 3). The distance of the condition tree is 0.561, showing a similar gene expression profile between SKP spheres and neurospheres.
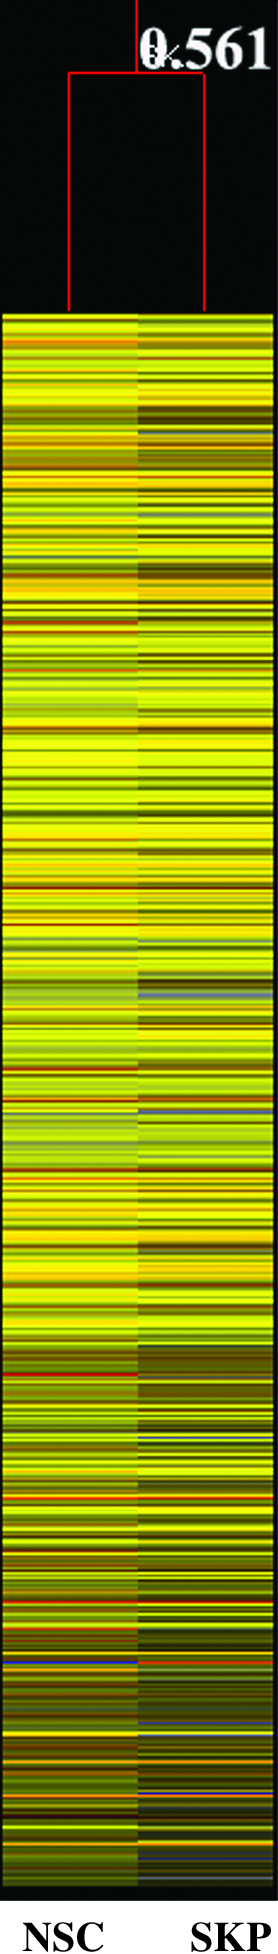
Condition tree shows the comparison of the global gene expression between SKP spheres and neurospheres. The greater expression level compared with Ref RNA is shown in red and those with a lower expression level in blue.
To identify the molecular signature of SKP spheres and neurospheres, we filtered out the spots with equal to or greater than twofold change compared with Ref cDNA as the threshold and generated enriched molecular signatures for SKP spheres and neurospheres, respectively. In total, there were 484 messages enriched in neurospheres and 254 messages enriched in SKP spheres. Most of the enriched messages have binding activity both in SKP spheres and neurospheres (Fig. 4). In addition, we identified 142 overlapped enriched messages whose function includes binding, enzyme regulator activity, catalytic activity, and structure molecule activity (Table 1). These overlapping messages may contribute to the genetic “stemness” program of the two sphere-forming stem cells in vitro.
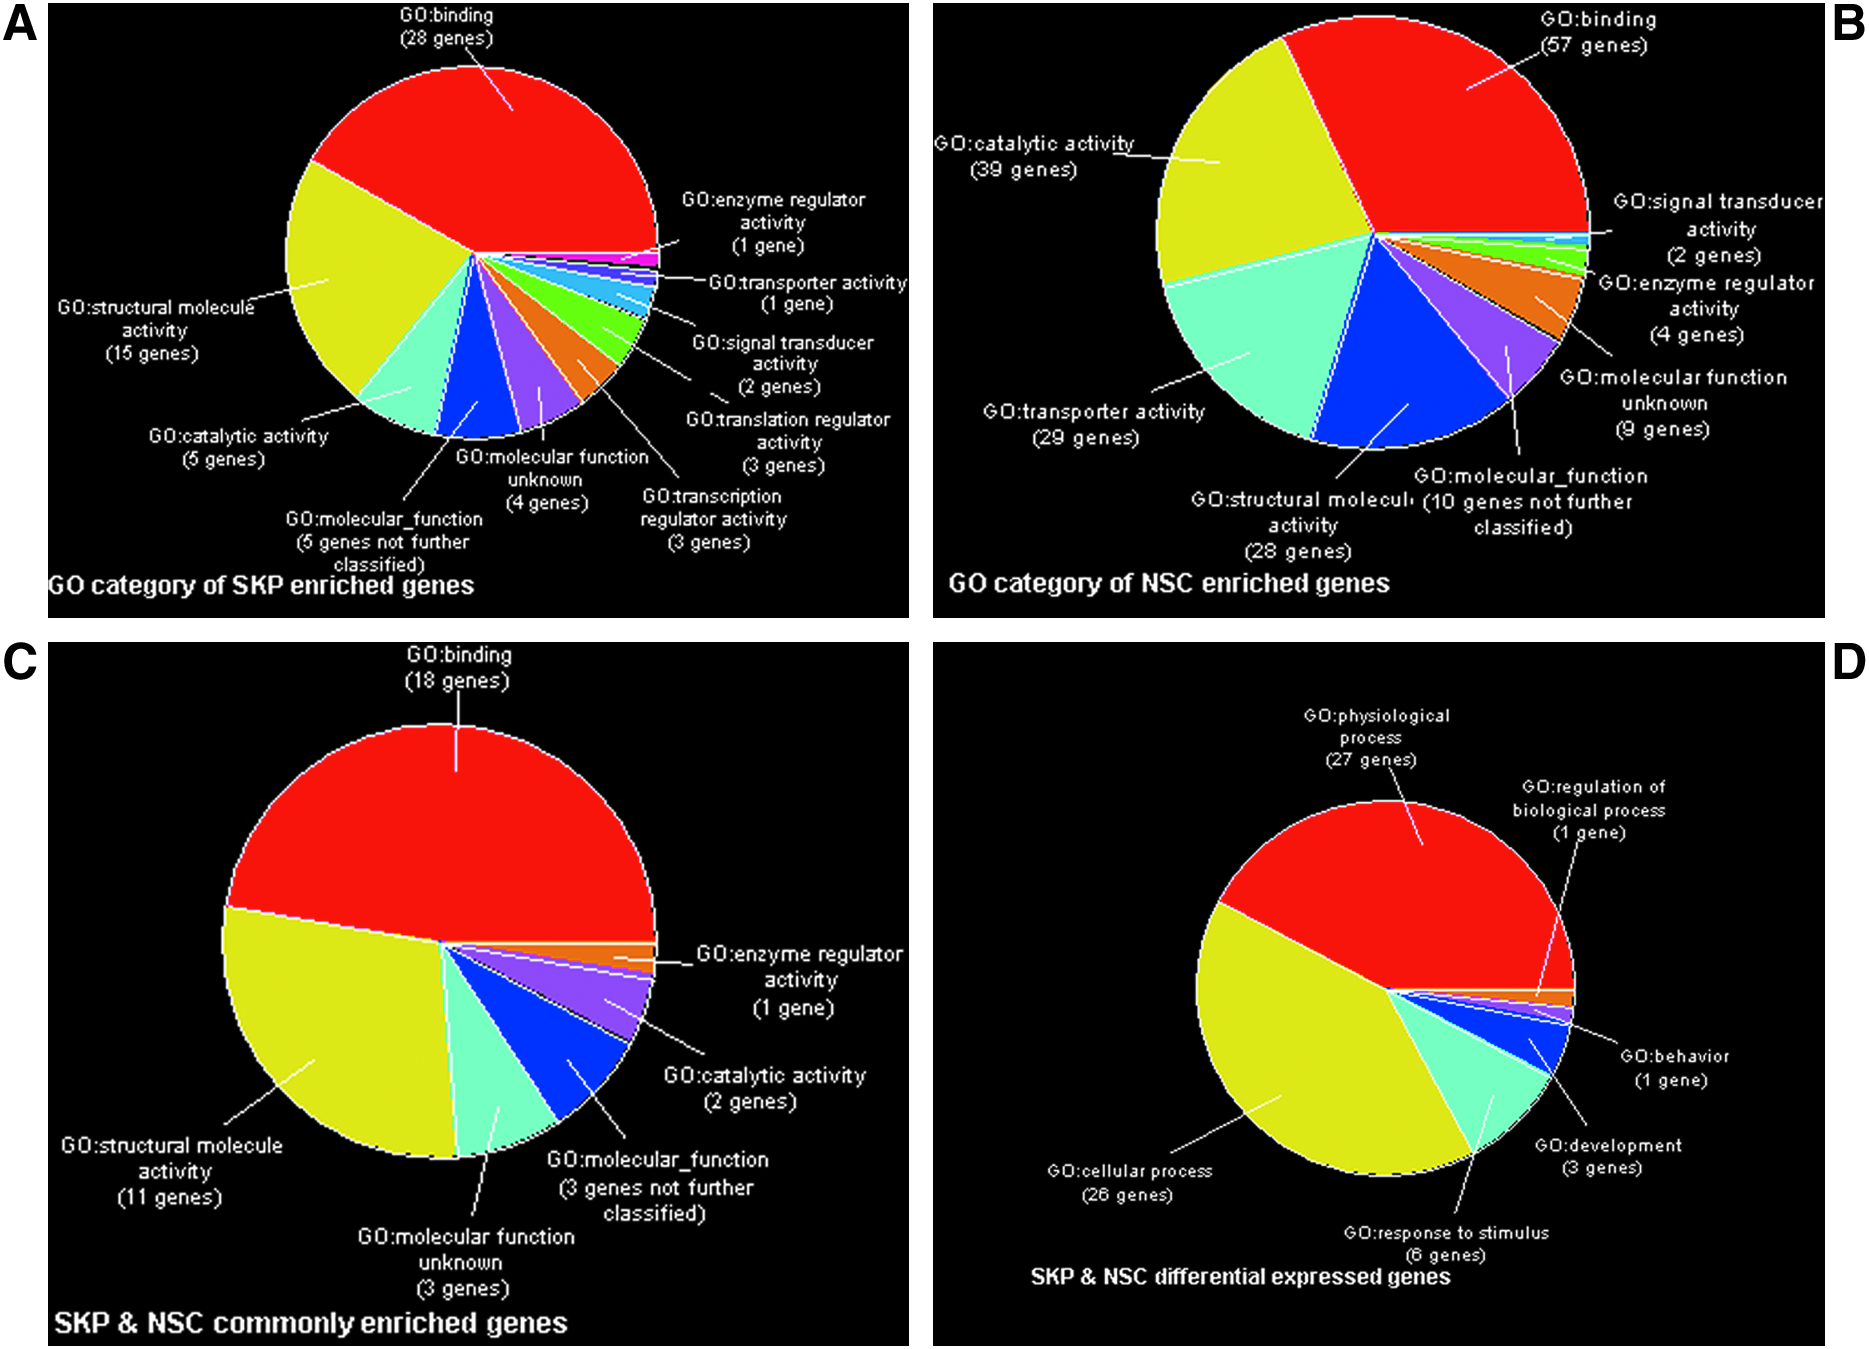
Gene ontology terms of enriched genes and differentially expressed genes. (
Note: as one gene may be involved in several molecular functions, there may be some genes appearing more than once in the table.
Differential gene expression between SKP spheres and neurospheres
To distinguish the transcriptional profiling of SKP spheres and neurospheres, we filtered out the genes with ≥ 1.5 fold-change compared with Ref cDNA to remove the transcriptional noise. In total, 1336 messages successfully passed through the threshold. We identified 72 differentially expressed messages between neurospheres and SKP spheres by ANOVA with Benjamini and Hochberg false discovery rate cutoff of 0.05 (Table 2). The upregulated genes in neurospheres are SOX9, PTGFR, MTMR4, BCL7B, CD61, LOC339123, ZC3H14, TIF-1A, RPS9, RCN2, CTSD, PITRM1, VPS35, FTL, CDC42SE2, FTH1, and CSTB. In contrast, the upregulated genes in SKP spheres comprise DDX50, SSR2, COL1A2, COL1A1, EIF3S6, DCN, COL3A1, RBM33, and POLD3. These differentially expressed genes are involved in physiological processes, cellular processes, response to stimulus, development, behavior, and regulation of biological processes (Fig. 4), which suggests that SKP spheres and neurospheres might respond to the same extrinsic stimulus in a cell-intrinsic fashion displaying as physiological processes and cellular processes.
The data are generated from 1336 genes that have the normalized value between 1.5 and 35.97 in either SKP spheres or neurospheres. The p value cutoff is 0.05 with Benjamini and Hochberg false discovery rate (FDR). The data are shown as mean ± SEM.
Functional annotation clustering of commonly and differentially expressed genes between SKP spheres and neurospheres
Functional annotation clustering of commonly and differentially expressed genes was performed by an online Functional Annotation Tool at DAVID Bioinformatics Resources 2008 (NIAID/NIH). The highest enrichment score of functional annotation clustering for commonly expressed genes is 6.75 (Fig. 5), whereas that for differentially expressed genes is 2.05 (Fig. 6). The overall enrichment score is based on the p-values (EASE score) of each term member (Huang da et al., 2009). For commonly expressed genes, various ribosomal proteins were highly enriched and involved in most terms of an annotation cluster: RNA binding, protein biosynthesis, ribosome, etc. (Fig. 5). From the genes that were differentially expressed, three isoforms of collagen and decorin (a leucine-rich proteoglycan) were identified to play a broad role in cell communication, skin development, signaling, extracellular matrix, etc. (Fig. 6). The data suggests that SKP spheres and neurospheres are likely to employ similar protein biosynthesis processes but different cell communication pathways to maintain their transcriptional states in vitro.
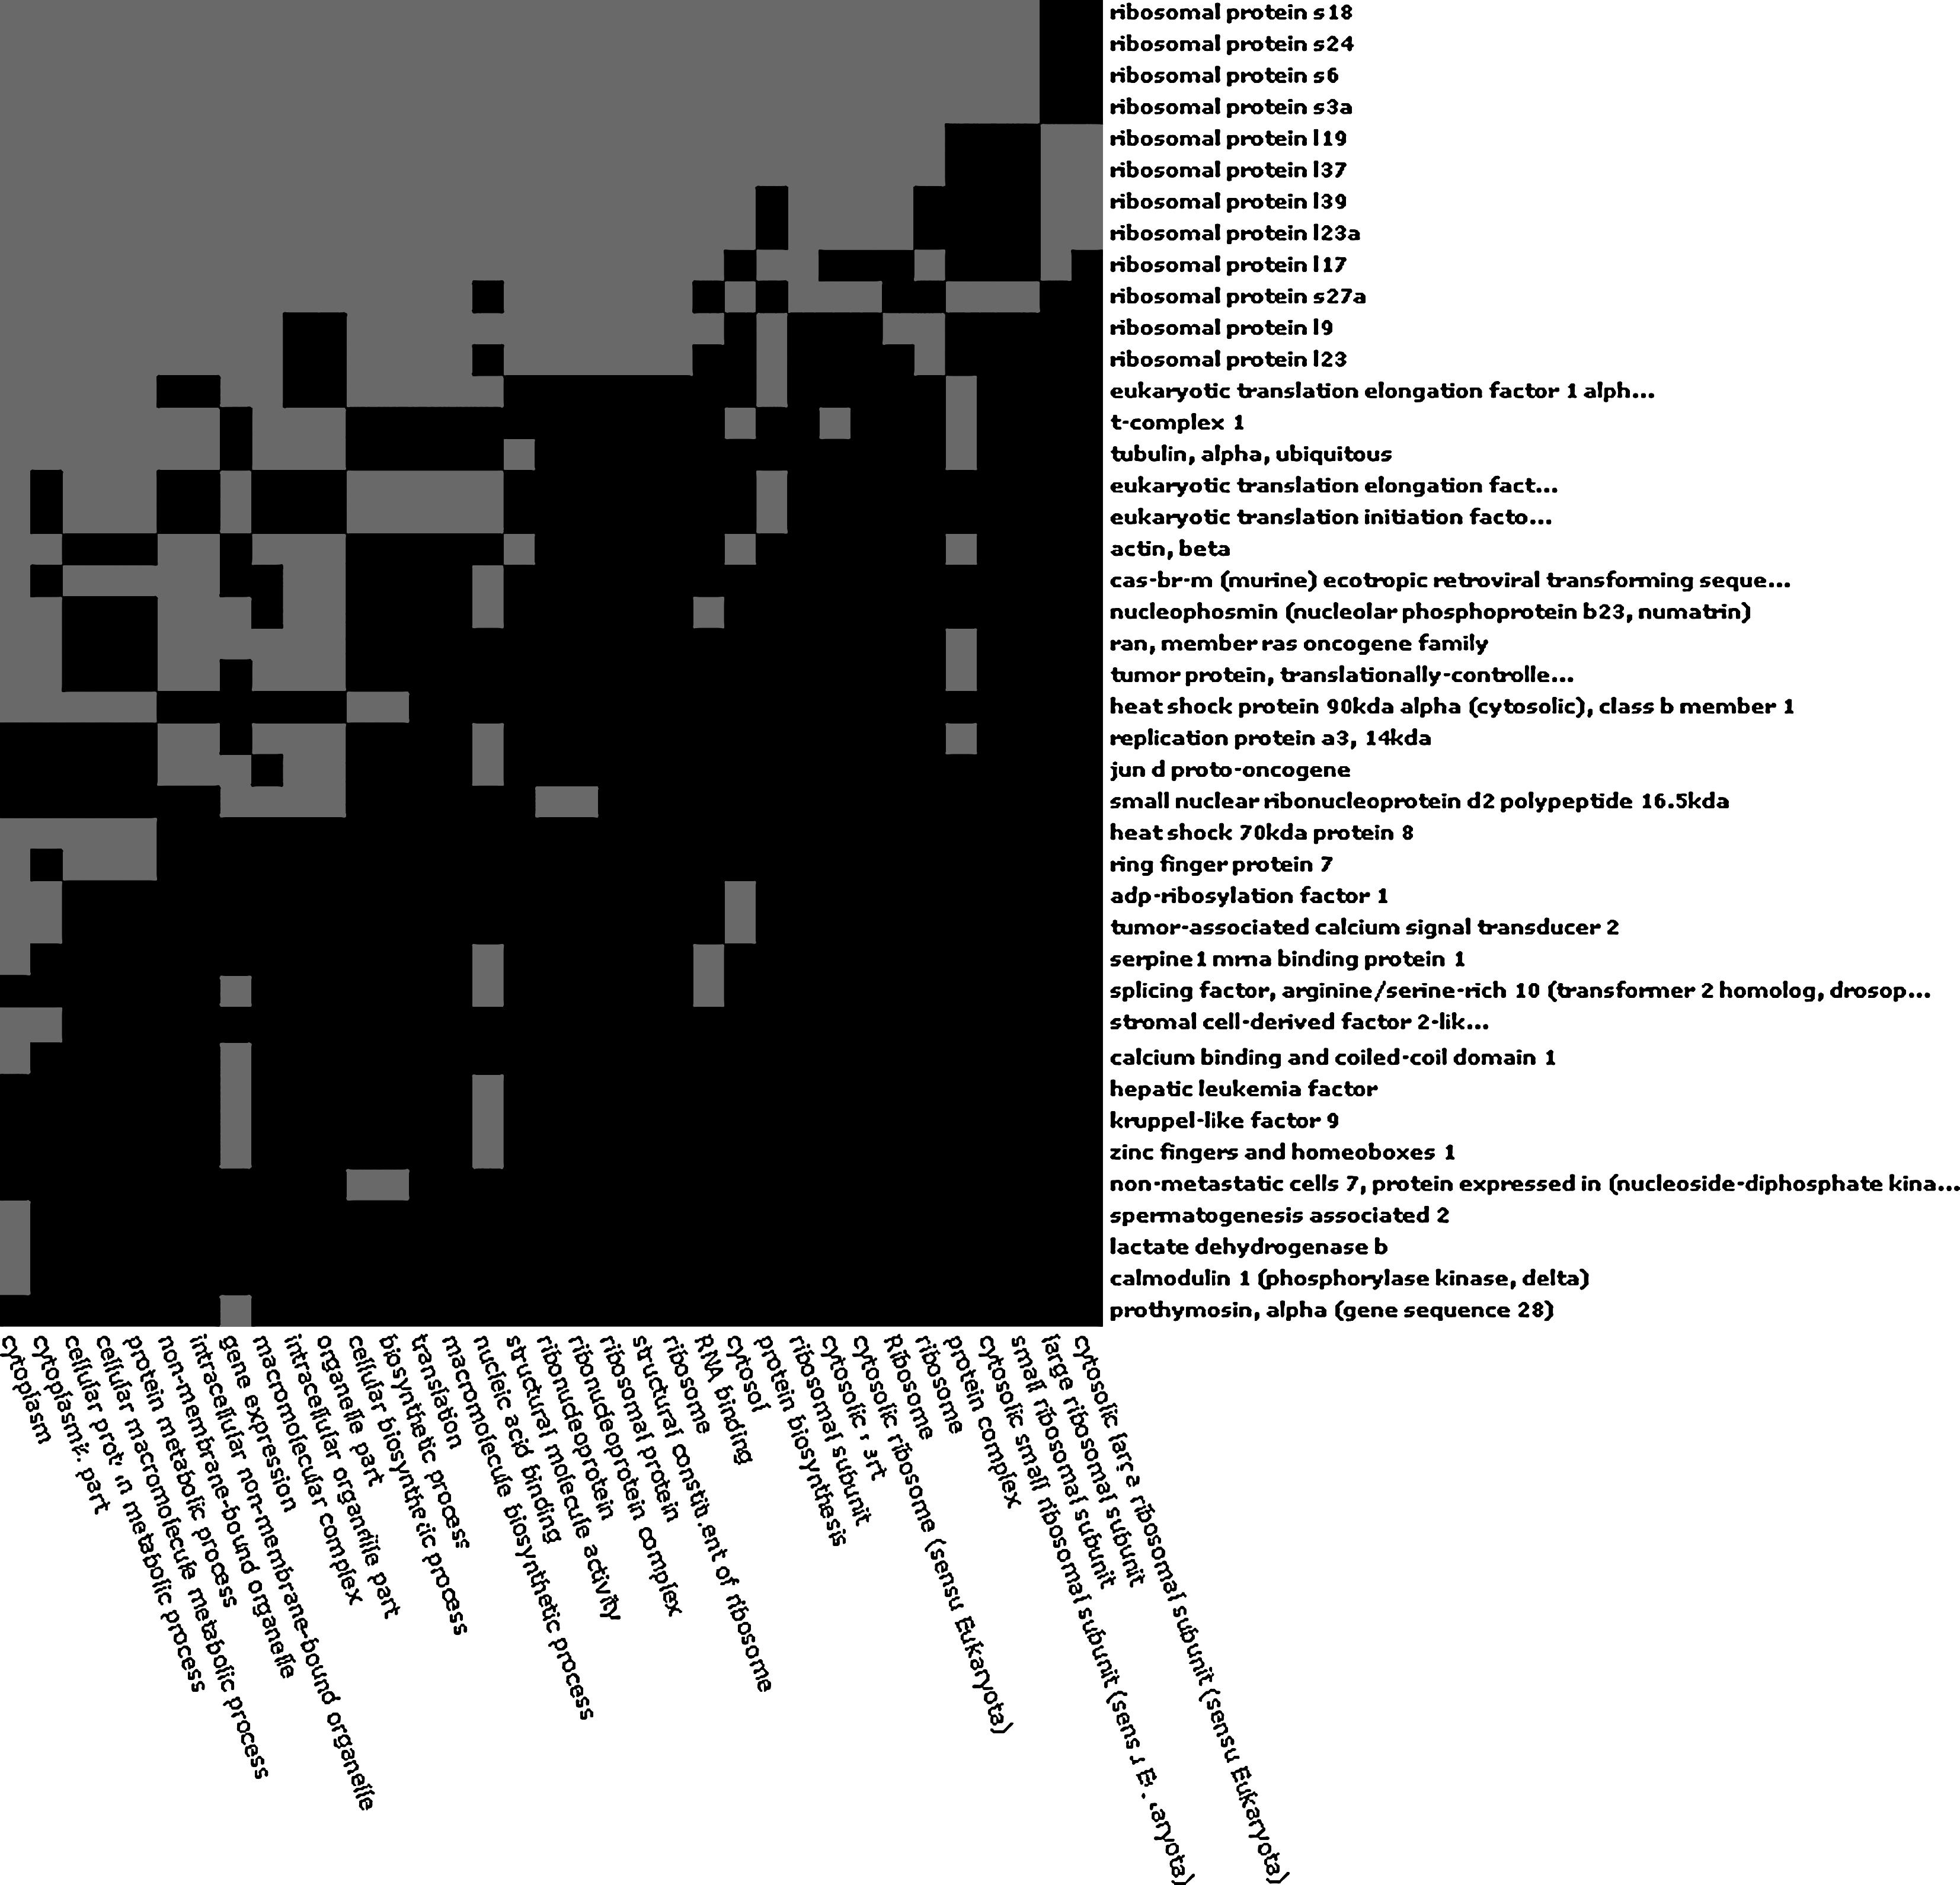
Functional annotation clustering of commonly enriched genes between SKP spheres and neurospheres by DAVID online. The 2D view of cluster shown here has the highest enriched score of 2.05. The gray boxes indicate corresponding gene-term associations positively reported, whereas the black boxes mean corresponding gene-term associations has not yet reported.
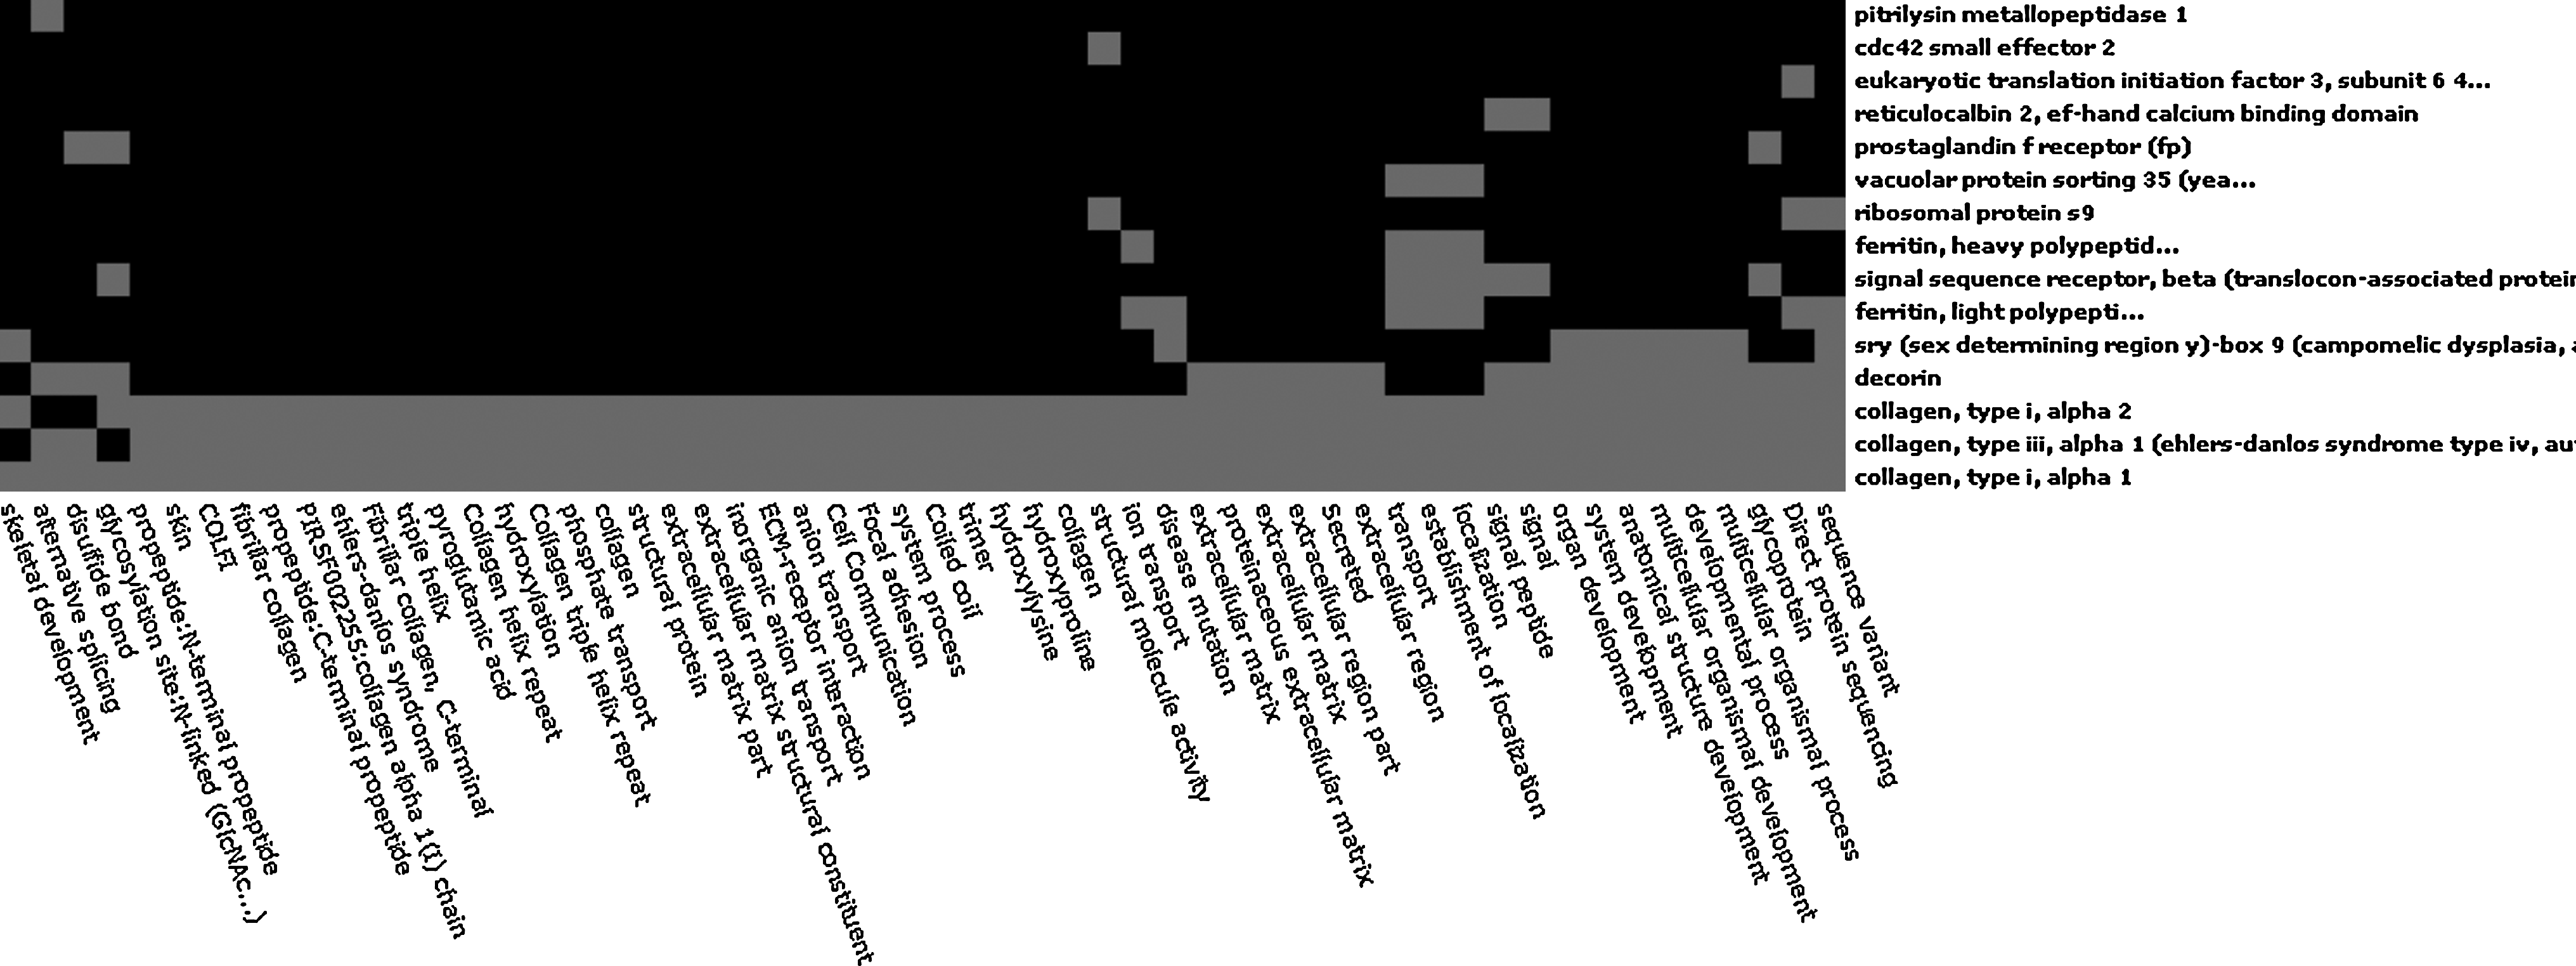
2D view of functional annotation cluster of differentially expressed genes between SKP and neurospheres by DAVID online (enriched score: 6.75). As mentioned above, the gray boxes correspond to gene-term associations positively reported, whereas the black boxes correspond to gene-term associations not yet reported.
KEGG (Kyoto Encyclopedia of Genes and Genomes) pathway analysis
Similarly, KEGG pathway analysis was performed by using DAVID online database. The input are SKP enriched genes, neurosphere-enriched genes, commonly enriched genes, and differentially expressed genes, and the output data are summarized in Tables 3–6. Interestingly, ribosome, antigen processing and presentation pathways are frequently involved in both SKP-enriched genes and neurosphere-enriched genes. In addition, they share pathways related to starch and sucrose metabolism, glycolysis, tight junction, gap junction, purine metabolism, glutamate metabolism, cell communication, MAPK signaling, calcium signaling, ErbB signaling, JAK/STAT signaling pathways, etc. (Table 5). However, the neurosphere-specific pathways include p53 signaling, Wnt signaling, cell cycle, axon guidance, and cytokine–cytokine receptor interaction; whereas TGF-beta signaling, cell adhesion molecules, and proteasome pathways are particularly involved by SKP spheres. For differential gene expression between SKP spheres and neurospheres, three important pathways appear to be involved: neuroactive ligand–receptor interaction, ECM-receptor interaction and TGF-beta signaling.
The related KEGG pathways were generated by DAVID online.
Effects of LIF and MEK inhibitor on the “stemness” of SKP spheres and neurospheres
To test the response of SKP spheres and neurospheres to extrinsic signals, we treated them with LIF or MEK inhibitor PD98095. Two groups of genes (“stemness” genes: NANOG, SOX2, STAT3, and SOX9; lineage specific genes: nestin, p75NTR, GFAP, and Tubulin β-III) were used to evaluate the influence of LIF or MEK signaling on the “stemness” of SKP spheres and neurospheres. The real-time PCR data show LIF significantly promoted the expression of GFAP (p < 0.01; Fig. 7), whereas MEK inhibitor significantly increased the expression level of both Tubulin β-III (p < 0.01; Fig. 7) and GFAP (p < 0.01, Fig. 7) by neurospheres. However, neither LIF nor MEK inhibitor can play a significant effect on the differentiation of SKP spheres because there is no significant difference of lineage specific gene expression upon treatments. In addition, there was no visible morphological change in SKP spheres caused by LIF or MEK inhibitor (data not shown). Thus, it seems that both LIF signaling and MEK inhibitor can enhance the lineage specific gene expression by neurospheres, probably advancing their differentiation.
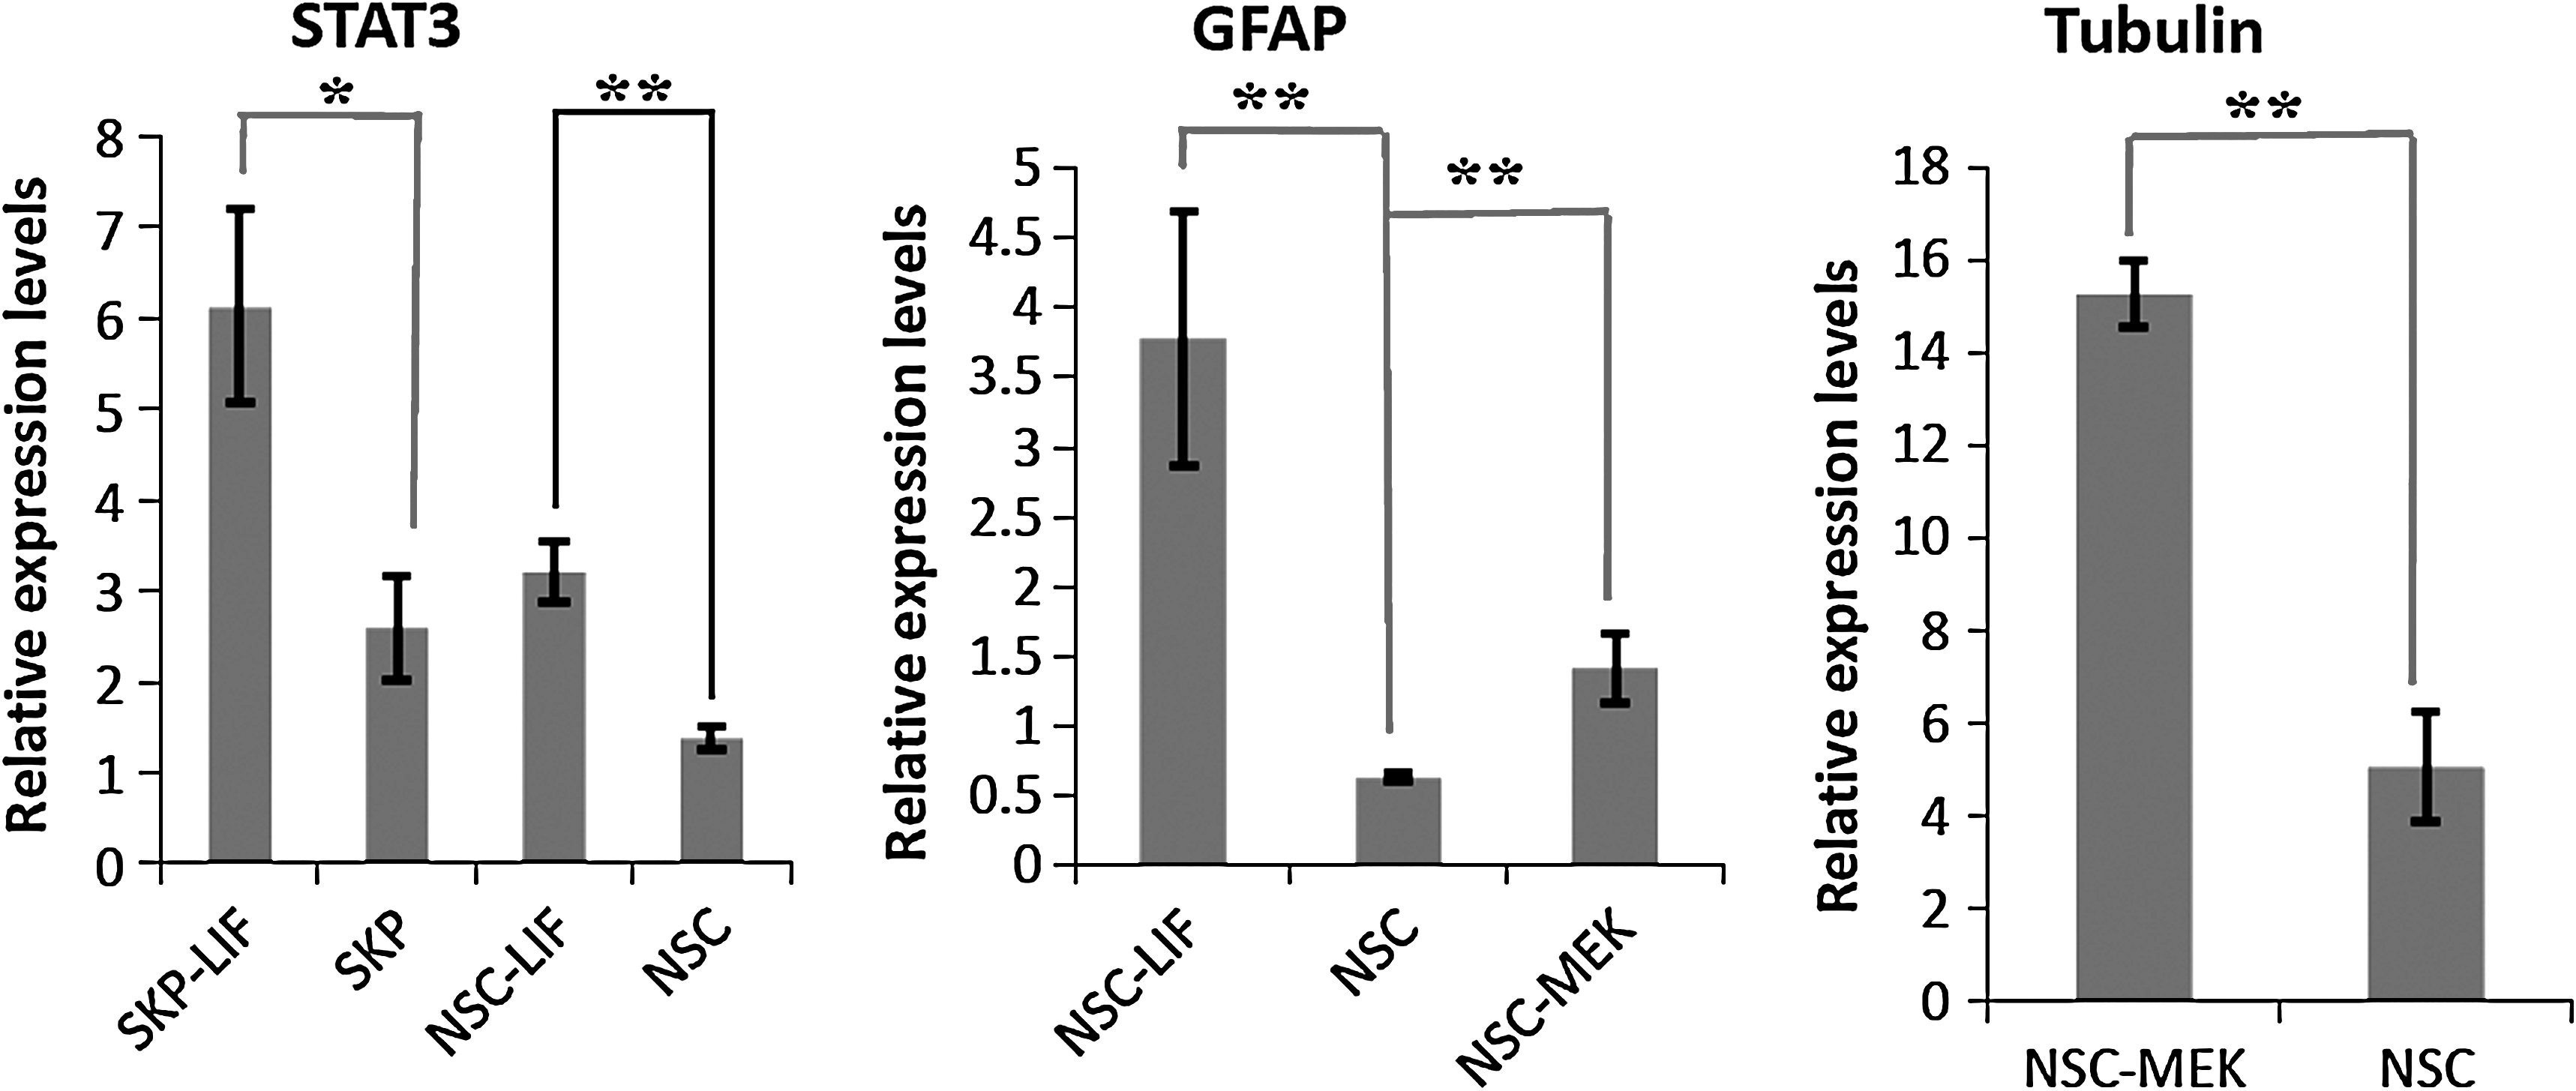
Distinct response of SKP spheres and neurospheres to LIF and MEK signaling. LIF can significantly promote STAT3 expression in both SKP spheres (p < 0.05) and neurospheres (p < 0.01, left panel). In neurospheres, both LIF and MEK inhibitor stimulated glial differentiation by increasing GFAP expression significantly (middle panel, p < 0.01), whereas MEK inhibitor enhanced the expression of tubulin β-III (right panel, p < 0.01). The relative gene expression levels were compared to those of GAPDH. *p < 0.05, **p < 0.01.
On the other hand, LIF signaling can significantly stimulate STAT3 both in SKP spheres (p < 0.05; Fig. 7) and neurospheres (p < 0.01; Fig. 7). Neither LIF nor MEK inhibitor can significantly affect the other “stemness” genes (NANOG, SOX2, and SOX9). Together, these data show SKP spheres and neurospheres respond similarly to some extrinsic signals but display distinct effects to other stimuli.
Real-time qPCR for data validation
Real-time qPCR assay was used to validate microarray data. Eight differentially expressed genes (SOX9, COL1A2, EIF3S6, DCN, POLD3, DDX50, SSR2, and FOXP1) were tested by relative standard curve methods (Table 7). The real-time data indicate the relative gene expression levels compared with GAPDH, whereas microarray data mean the relative expression levels compared with those of Ref RNA. The real-time qPCR and microarray data show similar gene expression patterns (Table 8), thus validating our current microarray platform.
Microarray data were normalized to Ref cDNA.
Real-time PCR values were normalized to housekeeping gene GAPDH.
Discussion
SKP spheres are neural crest derived and have certain characteristics of neural crest stem cells that can give rise to neurons and glias of the peripheral nervous system (PNS) and mesodermal lineage (Crane and Trainor, 2006); neurospheres are generated by neural stem cells in vitro and can produce neurons, astrocytes, and oligodendrocytes in the CNS (Gage, 2000). Both can contribute to neural progeny either in PNS or in CNS. The featured common enriched genes by SKP spheres and neurospheres are involved in tight junction, gap junction, cell communication, calcium signaling, ErbB signaling, JAK–STAT signaling, and MAPK signaling. It is suggested that these signaling pathways are likely to regulate the “stemness” of these two sphere-forming stem cells.
Tight junction, gap junction and calcium signaling might cooperate to establish the microenvironment of sphere-forming stem cells and regulate the balance between self-renewal and differentiation, which would maintain the dynamic heterogeneity of stem cells (Graf and Stadtfeld, 2008; Wong et al., 2008). Calcium pathways can influence the stem-cell behavior in the “niche” and represent a dimension of stem cell control that allows cells to response to extrinsic stimuli (Scadden, 2006). In addition, calcium is involved in the regulation of cellular proliferation in adult neurogenesis (Mishra et al., 2006). The ErbB protein or EGF receptor (EGFR) family has the activity of receptor tyrosine kinases (Trk). The ErbB signaling is required for self-renewal of human ES cells and inhibition of ErbB induces selective apoptosis (Anneren, 2008; Wang et al., 2007). Moreover, ErbB signaling can confer a motile phenotype to neural stem cells during brain development (Boockvar et al., 2003), regulate the development of glial cells in peripheral nerves (Jessen and Mirsky, 2005; Morris et al., 1999), and function in neurodevelopment, neurotransmission, and synaptic plasticity (Mei and Xiong, 2008). The ErbB signaling (neuregulin) could instructively restrict mammalian neural crest stem cells to a glial fate in vitro (Shah et al., 1994). Taken together, ErbB signaling could prospectively regulate the neural potential of SKP spheres and neurospheres.
The JAK–STAT signaling pathway mediates the cellular response to cytokines and growth factors and plays a central role in cell fate decisions, cell proliferation, and apoptosis. JAK–STAT signaling is essential for maintaining the undifferentiated state and self-renewal of mouse ES cells (Niwa et al., 1998; Ying et al., 2003), but it cannot prevent the differentiation or is not required for the self-renewal of human ES cells (Boiani and Scholer, 2005; Daheron et al., 2004). In addition, the JAK–STAT pathway is required for self-renewal of embryonic and adult neural stem/progenitor cells, and regulates the developmental switch from neurogenesis to gliogenesis (Bauer et al., 2007). LIF can bind to specific LIF receptors, and leads to the activation of the JAK/STAT pathway. In mouse ES cells, LIF signaling can maintain the pluripotency but is not necessary for the self-renewal of ES cells, as either artificial activation of STAT3 or the overexpression of NANOG or KLF4 or TBX3 is sufficient to maintain pluripotency in the absence of LIF (Chambers et al., 2003; Matsuda et al., 1999; Mitsui et al., 2003; Niwa et al., 2009). In the present study, STAT3 transcripts were detected in both SKP spheres and neurospheres. On the one hand, LIF signaling can significantly enhance the STAT3 expression in both SKP spheres and neurospheres, suggesting a potential role of the JAK–STAT pathway in maintaining the “stemness” of sphere-forming stem cells. On the other hand, LIF signaling promotes the differentiation of neurospheres but does not affect the differentiation associated genes in SKP spheres, indicating a differential effect of LIF signaling on the differentiation by SKP spheres and neurospheres.
MAPK/ERK signaling is a complex signal transduction pathway, which integrates intracellular response to the binding of growth factors and regulates the transcription and translation by coupling with G protein (Chang and Karin, 2001). ERK1/2 activation promotes differentiation, and suppression of ERK1/2 can enhance self-renewal of mouse and rat ES cells (Buehr et al., 2008; Burdon et al., 2002; Li et al., 2008; Qi et al., 2004; Ying et al., 2008). However, the MAPK/ERK pathway plays an important role in maintaining the pluripotency of human ES cells (Armstrong et al., 2006; Li et al., 2007b). MAPK/ERK signaling contributes to the proliferation and maintenance of neural stem/progenitor cells multipotency by suppressing glial differentiation and exhibits a key role in neurogenesis (Campos et al., 2004; Imamura et al., 2008; Samuels et al., 2008). Some players of the MAPK/ERK pathway are enriched in both SKP spheres and neurospheres. In addition, inhibition of MAPK cascade by MEK inhibitor promotes the differentiation in neurospheres, whereas the MEK inhibitor does not affect the “stemness” or differentiation in SKP spheres, implying a distinct role in modulating the multipotency and differentiation of SKP spheres and neurospheres.
Most of the differentially expressed genes are mainly involved in ECM–receptor interaction and the TGF-β signaling pathway. TGF-β signaling is required for maintaining pluripotency, and is involved in the differentiation of ES cells (James et al., 2005; Vallier et al., 2009; Watabe and Miyazono, 2009). Similarly, TGF-β signaling is crucial for multiple aspects of neural development: ectodermal specialization, neural crest formation, spinal cord patterning, and embryonic and adult brain development (Liu and Niswander, 2005). In neural crest stem cells, TGF-β signaling could instructively induce neurogenesis or nonneural lineage commitment depending on cellular context (Crane and Trainor, 2006; Shah et al., 1996). In addition, the equilibrium among bone morphogenetic proteins and their soluble inhibitors in the TGF-β signaling pathway has an important role not only in hair follicle morphogenesis but also in hair follicle stem cell activation during adult homeostasis (Blanpain and Fuchs, 2009). Because SKP spheres are neural crest derived and share some characteristics with neural crest stem cells, it is inferred that TGF-β signaling may regulate the “stemness” properties of SKP spheres and neurospheres.
Our data show that LIF signaling can promote STAT3 expression in both SKP spheres and neurospheres, whereas the MEK inhibitor can only enhance the expression of differentiation-associated genes in neurospheres. The MEK inhibitor does not exert any significant effect on either the “stemness” property or differentiation in SKP spheres. Together with the microarray data, it indicates that SKP spheres and neurospheres show distinct responses to external stimuli, and may employ divergent signaling pathways to regulate their individual stem cell states. We speculate that cell-intrinsic genetic and/or epigenetic programs may maintain the innate “stemness” of these two sphere-forming stem cells when they reside in a similar microenvironment. This study may help illustrate the fundamental mechanisms modulating the behaviors of neural stem cells and neural crest stem cells in vitro.
Footnotes
Acknowledgments
We thank Dr. Jianguo Zhao for helpful discussion, Dr. Yi-Liang Miao for illustration work, Dr. Gordon K. Springer and Dr. William G. Spollen at the Department of Computer Science, University of Missouri, for cDNA library annotation. This work was supported by NIH grant No. R01RR013438 and Food for the 21st Century at the University of Missouri.
Author Disclosure Statement
The authors declare that no conflicting financial interests exist.