




Abstract
Abstract
Limited studies have been published analyzing the gene expression patterns of cloned pigs. We compared the expression profiles of brain, kidney, and lung tissues, representing each of the three germ layers, of deceased neonatal cloned pigs with those of age-matched controls using a 13K oligonucleotide microarray. We found 42 (0.7% of total genes analyzed), 178 (2.9%), and 121 (1.9%) genes differentially expressed in the brain, kidney, and lung of clones, respectively, when compared with the corresponding organs from controls (fold change >1.5, p < 0.05, false discovery rate (FDR) = 0.05). These expression aberrations could potentially cause the following pathological anomalies in clones: diabetic nephropathy in the kidney and dysregulated surfactant homeostasis in the lung. Interestingly, upregulated expression of genes belonging to the MAPK pathway was observed in all three organs. To investigate whether the differences in levels of gene expression were caused by differential DNA methylation, the global DNA methylation level was measured by high-performance liquid chromatography. In controls, global concentration of methylated cytosine was 5.35%, whereas clones had significantly hypomethylated genomic DNA (4.57%). Bisulfite-pyrosequencing analyses of the promoter regions of differentially expressed candidate genes, c-MYC, Period 1 (PER1), Cathepsin L (CTSL), and Follistatin (FS), however, did not show any differences in the degree of DNA methylation between controls and clones. Our findings demonstrate that deceased neonatal cloned pigs have considerable gene expression abnormalities, which may have contributed to the death of the animals.
Introduction
Incomplete or aberrant epigenetic reprogramming after SCNT has been proposed as a cause for the abnormal phenotypes in cloned animals. DNA methylation is one of the major epigenetic modifications that regulate gene expression. It has been reported that the pig genome is more methylated and contains more CpG islands in the INS-IGF2-H19 gene cluster than the human and mouse (Amarger et al., 2002). Studies on DNA methylation in pigs are rather limited, and most of the studies have analyzed repetitive or nonfunctional genomic sequences (Amarger et al., 2002; Kang et al., 2001). For example, cloned pig preimplantation embryos were reported to have similar degrees of global DNA demethylation as in vivo embryos (Kang et al., 2001).
In the present study, we compared the global gene expression profiles of five deceased, neonatal cloned pigs to five age-matched controls to assess the overall degree of reprogramming at the gene level and to identify aberrantly expressed genes. Dysregulation of gene expression has been linked to abnormal phenotypes, so potential physiological defects in each organ were examined. To investigate whether aberrant DNA methylation was associated with abnormal phenotypes or differential gene expression in the cloned pigs, global and gene-specific levels of DNA methylation were measured.
Materials and Methods
Tissue collection
Frozen tissues from 10 cloned pigs (by using fibroblasts collected from a commercial intermixed breed of Large White, Duroc, and Landrace) that died shortly after birth and five age-matched controls from conventional breeding were collected. All controls were healthy and alive prior to euthanasia and tissue collection. The brain, kidney, and lung were chosen for analysis because they represent tissues from ectoderm, mesoderm, and endoderm. Cloned neonatal pigs had significantly lower mean body weight (914.2 g) than that of controls (2,105.4 g, p < 0.0001) (Table 1). Additionally, the relative mean organ weight (organ weight/body weight) of the lung was also significantly smaller (1.60 g/100 g of bodyweight) in the clones compared with the controls (2.11 g/100 g of bodyweight, p < 0.01). All tissues were snap frozen in liquid nitrogen and stored at −80°C until analysis.
p < 0.05, bp < 0.01, cp < 0.001, Student's t-test.
Microarrays
The porcine Array-Ready Oligo Set version 1.1 was purchased from Operon Technologies Inc. (Alameda, CA, USA). The microarray contained 13,297 oligonucleotide probes that were designed from The Institute of Genomic Research (TIGR) Porcine Gene Index (SsGI release 5.0). In BLAST analyses, 11,349 oligonucleotides (85.4%) hit to human or mouse RefSeq or pig annotated gene NCBI accession numbers, and 6244 oligonucleotides (47.0%) were assigned Gene Ontology (GO) terms (Zhao et al., 2005). All probes were printed in duplicate on glass slides at Microarrays Inc. (Nashville, TN, USA).
Target preparation and hybridization
Total RNA was isolated from the brain, kidney, and lung tissues of clones and the corresponding tissues of controls using the TRIzol® reagent (Invitrogen, Carlsbad, CA, USA). The isolated RNA was treated with DNase I (Invitrogen) to remove any possible genomic DNA contamination and stored at −80°C. All RNA samples were examined for integrity and purity, and RNA from five of each clones and controls having A260/280 > 1.8, and 2:1 intensity ratio of 28S and 18S rRNA were used for further analyses. Reference RNA was prepared from a pool of RNA from the brain, kidney, liver, and lung tissues of natural produced neonates. Ten microgram of each sample and reference RNA were reverse transcribed and indirectly labeled with Cy3 or Cy5 dye (GE Healthcare Life Sciences, Piscataway, NJ, USA), and hybridized to a microarray based on the protocol developed by TIGR. In total, 60 microarrays (10 animals × 3 organs × 2 dye-swap) were used including dye-swap hybridizations. Quality control of the experiment was performed by evaluation of the RNA quality and Pearson correlation analyses of dye-swap microarrays (Supplementary Table 1; see online supplementary material at www.liebertonline.com).
Data analysis and functional annotation
The microarrays were scanned with GenePix® 4000B (Molecular Devices, Union City, CA, USA) and signal intensities were extracted by GenePix® Pro 6.0 (Molecular Devices). Local background correction and linear normalization were performed, and probes were flagged as present if their intensities where at least 70% of the pixels were greater than two standard deviations (SD) higher than the background in either Cy3 or Cy5 channel. The present probes were used for data analysis with GeneSpring™ 6.1 (Agilent Technologies, Palo Alto, CA, USA). Loess normalization was applied to all microarrays, and probes that were present in at least 90% of the microarrays with raw expression values >100, and SD < 1.4 were designated as informative and used for further analysis. For hierarchical clustering, average linkage clustering by similarity measurement was performed. Differentially expressed probes were identified by the following criteria: Welch's t-test (p < 0.05) with the false discovery rate (FDR = 0.05) and fold change of >1.5. Functional annotation and pathway analysis (p < 0.05, modified Fisher exact test) were performed using the Database for Annotation, Visualization and Integrated Discovery (DAVID) (http://david.abcc.ncifcrf.gov) according to the user's guide (Dennis et al., 2003). Literature mining was performed with PubMatrix (http://pubmatrix.grc.nia.nih.gov) to identify the biological and clinical relevance of the differentially expressed genes (Becker et al., 2003). Gene-to-gene and pathway-to-pathway interaction was investigated using cocitation networking with PubGene (http://www.pubgene.org) (Jenssen et al., 2001).
Confirmation by quantitative real-time RT-PCR
From the list of differentially expressed genes involved in pathological annotation, we chose four genes differentially expressed in the kidney of clones, decorin (DCN), sarcoma virus 17 oncogene homolog (JUN), thioredox interacting protein (TXNIP), and extracellular signal-related kinase 2 (ERK2), for confirmation of microarray results using a 7500 Fast Real-Time PCR System (Applied Biosystems, Foster, CA, USA). Tubulin beta-2 (TBB2) was used as an internal control, and the reference RNA was used as a calibrator of the real-time reactions. Primers were designed using the Primer Express® (Applied Biosystems) based on the microarray probe sequences from GenBank or SsGI release 12.0 (Supplementary Table 6). The results were analyzed using Fast 7500 System SDS software 1.3.1 (Applied Biosystems) with the comparative CT method.
Global DNA methylation analysis
Because a decreased relative organ weight was observed in the lungs of cloned pigs, this tissue was further analyzed for global DNA methylation levels. Genomic DNA of the lung tissue was extracted from the organic phase using back extraction buffer (4 M guanidine thiocyanate, 50 mM sodium citrate, 1 M Tris base) after RNA isolation. Twenty microgram of the isolated DNA was treated with RNase A and H (Ambion, Austin, TX, USA), Nuclease P1 (US Biological, Swampscott, MA, USA), and Calf Intestinal Phosphatase (New England Biolab, Ipswich, MA, USA) to generate hydrophobic nucleosides. 5-methyl-2-deoxycytidine (5mC) was prepared by dephosphorylation of 5-methyl-2-deoxycytidine monophosphate (USB, Cleveland, OH, USA) using phosphatase. The other nucleoside standards were purchased from Sigma-Aldrich (St. Louis, MO, USA). Global concentrations of methylated cytosine were determined in duplicate by binary gradient Reverse Phase-HPLC as described (Cezar et al., 2003) with minor modification. Briefly, 50 μL of the digested sample were injected into System Gold® HPLC equipped with a C18 Ultrasphere® ODS column (Beckman Coulter, Fullerton, CA, USA) and separated at a flow rate of 0.75 mL/min. The gradient program was developed as follows: a mixture of 16.7% of mobile phase A [0.05M KH2PO4 (pH 4.0)] and 83.3% of mobile phase B (60% methanol) for 10 min followed by 100% of mobile phase B for 20 min with a 5-min duration. Separated nucleosides were detected at A280, and analyses were conducted using 32 Karat™ software (Beckman Coulter). The ratio between total dC (dC + 5mC) and dG, and the percentage of 5mC (%5mC/total dC) were calculated from peak heights of individual nucleosides relative to standard curves. Differences between clones and controls were assessed using a one-sided Student t-test (p < 0.05).
Gene-specific DNA methylation analysis
One and one half microgram of the lung DNA sample was treated with sodium bisulfite using the EZ DNA methylation kit™ (Zymo Research, Orange, CA, USA) according to the manufacturer's instructions. Candidate genes for gene-specific DNA methylation analyses were chosen based on the following criteria: (1) genes that were differentially expressed between clones and controls; (2) genes whose promoter sequence were available in GenBank (http://www.ncbi.nlm.nih.gov/Genbank/); (3) genes that contain putative CpG islands in the promoter as determined by using the EMBOSS CpG Plot (http://www.ebi.ac.uk/Tools/emboss/cpgplot/index.html); and (4) genes previously found to be regulated by DNA methylation in mammals. PCR was performed with 400 nM of each primer, 1.5 mM of MgCl2, 200 μM of each nucleotide and 2.5 U of Platinum® TaqPCRx Polymerase (Invitrogen, Carlsbad, CA, USA) under the optimized conditions (Supplementary Table 2). Pyrosequencing reactions were conducted in a PyroMark™ MD system (Biotage, Charlottesville, VA, USA) with PyroGold CDT reagents (Biotage) according to the manufacturer's instructions. Quantification of DNA methylation was performed using PyroQ-CpG™ (Biotage), and a one-sided Student's t-test was conducted.
Results
Gene expression profiles in the brain
In the brain, 10,867 probes (81.6% of total probes on the microarray) were identified as informative through advanced filtration (see Materials and Methods). In hierarchical clustering, expression profiles of clones and control animals were distinctly separated as two groups with correlation coefficiency (r) = 0.902 for clones and r = 0.797 for controls, respectively. Statistical analysis revealed that 42 genes were differentially expressed between clones and controls (fold change >1.5, p < 0.05, FDR = 0.05), and among them, 22 genes were upregulated and 20 were downregulated in clones. These differentially expressed genes were described in Supplementary Table 3. Functional annotations of these genes enriched by heuristic partitioning with DAVID are “regulation of cell proliferation,” and “MAPKKK cascade.”
Gene expression profiles in the kidney
A total of 10,640 probes (79.9%) were identified as informative in the kidney, and again clones and controls separated into two distinct groups by hierarchical clustering analysis with r = 0.658 for clones and r = 0.802 for controls (Supplemental Fig. 1A). Out of the informative probes, 178 genes were differentially expressed (fold change >1.5, p < 0.05, FDR = 0.05) between clones and controls, and 90 of these genes were upregulated and 88 were downregulated in clones. Differentially expressed genes were clustered into three distinct groups with 74, 73, and 32 genes (Supplementary Fig. 1B and Supplementary Table 4), and they were functionally annotated as “response to stress,” “cell cycle,” “transcription from RNA Polymerase II promoter,” “carbohydrate transporter activity” for genes in group 1, “organ development,” “peroxisome,” “amino acid metabolism,” “carboxylic acid metabolism” for genes in group 2, and “response to stress,” and “cell motility” for genes in group 3. Interestingly, upregulated “MAPK signaling pathway” was found in the kidney as was found in the brain of clones (p < 0.05, modified Fisher exact test). Additionally, downregulated “glycine, serine, and threonine metabolism pathway” was also identified as differentially expression in clones' kidneys. Literature mining revealed that seven of the differentially expressed genes were involved in diabetic nephropathy. These genes are DCN, FBJ murine osteosarcoma viral oncogene homolog (FOS), JUN, serpin peptidase inhibitor clade H member 1 (SERPINH1), salute carrier family 2 member 1 (SLC2A1), transforming growth factor beta 2 (TGFB2), and TXNIP (Table 2). All 12 differentially expressed genes related to diabetic nephropathy and MAPK pathway were clustered into a network as direct neighbor with maximum depth = 1, the most stringent criterion for gene interaction, suggesting that those genes interact directly with each other. The numbers of co-occurrence in same literature of the gene pairs varied from 1 to 2524 (from 1 to 2524 publications in which these genes were studied together). Representative co-occurrences of gene pairs TGFB2–JUN, DCN–JUN, DCN–FOS, SLC2A1–FOS, SLC2A1–JUN, and TXNIP–JUN were from 2 to 13 (Supplementaary Fig. 1C), suggesting that MAPK pathway might play a role in the development of diabetic nephropathy in pigs.
p < 0.05, modified Fisher exact test.
Gene expression profiles in the lung
In the lung, hierarchical clustering partitioned 9869 informative probes (74.1%) into two distinct groups of clones and controls with r = 0.805 and 0.955, respectively (Fig. 1A). Among the informative genes, 121 were differently expressed between clones and controls (fold change >2, p < 0.05, FDR = 0.05), with 64 of these genes being upregulated and 57 downregulated in clones. The differentially expressed genes were clustered into five groups of 37, 19, 8, 31, and 26 genes (Fig. 1B and Supplementary Table 5). The genes in group 1 were enriched in “transcription from RNA Polymerase II promoter,” “response to external stimuli,” “transmembrane receptor protein tyrosine kinase signaling pathway,” those in group 2 fell in the categories of “DNA binding,” genes in group 4 were involved in “cell cycle,” “extracellular matrix,” and those in group 5 were “microtubule,” “chromatin,” and “sterol biosynthesis.” Interestingly, the “MAPK signaling pathway” was upregulated in clones' lungs as well (p < 0.05, modified Fisher exact test). To associate dysregulated gene expression with functional abnormalities of the lungs, we conducted literature mining and identified seven genes that are involved in surfactant homeostasis: adrenergic receptor beta 2 (ADRB2), chromosome 9 open reading frame 13 (C5ORF13), JUN D proto-oncogene (JUND), poly (ADP-ribose) polymerase 1 (PARP1), cellular retinol binding protein 1 (RBP1), regulator of G-protein signaling 2 (RGS2), and squalene epoxidase (SQLE) (Table 2). Interestingly, 12 genes involved in the surfactant homeostasis and MAPK pathway are linked in a network, having a range from 1 to 934 of literature co-occurrence. Representative co-occurrences of gene pairs ADRB2–NR4A1, PARP1–JUN, PARP1–MYC, and SQLE–MYC were from 1 to 15 (Fig. 1C), suggesting that the MAPK pathway might be associated with surfactant homeostasis in pigs.
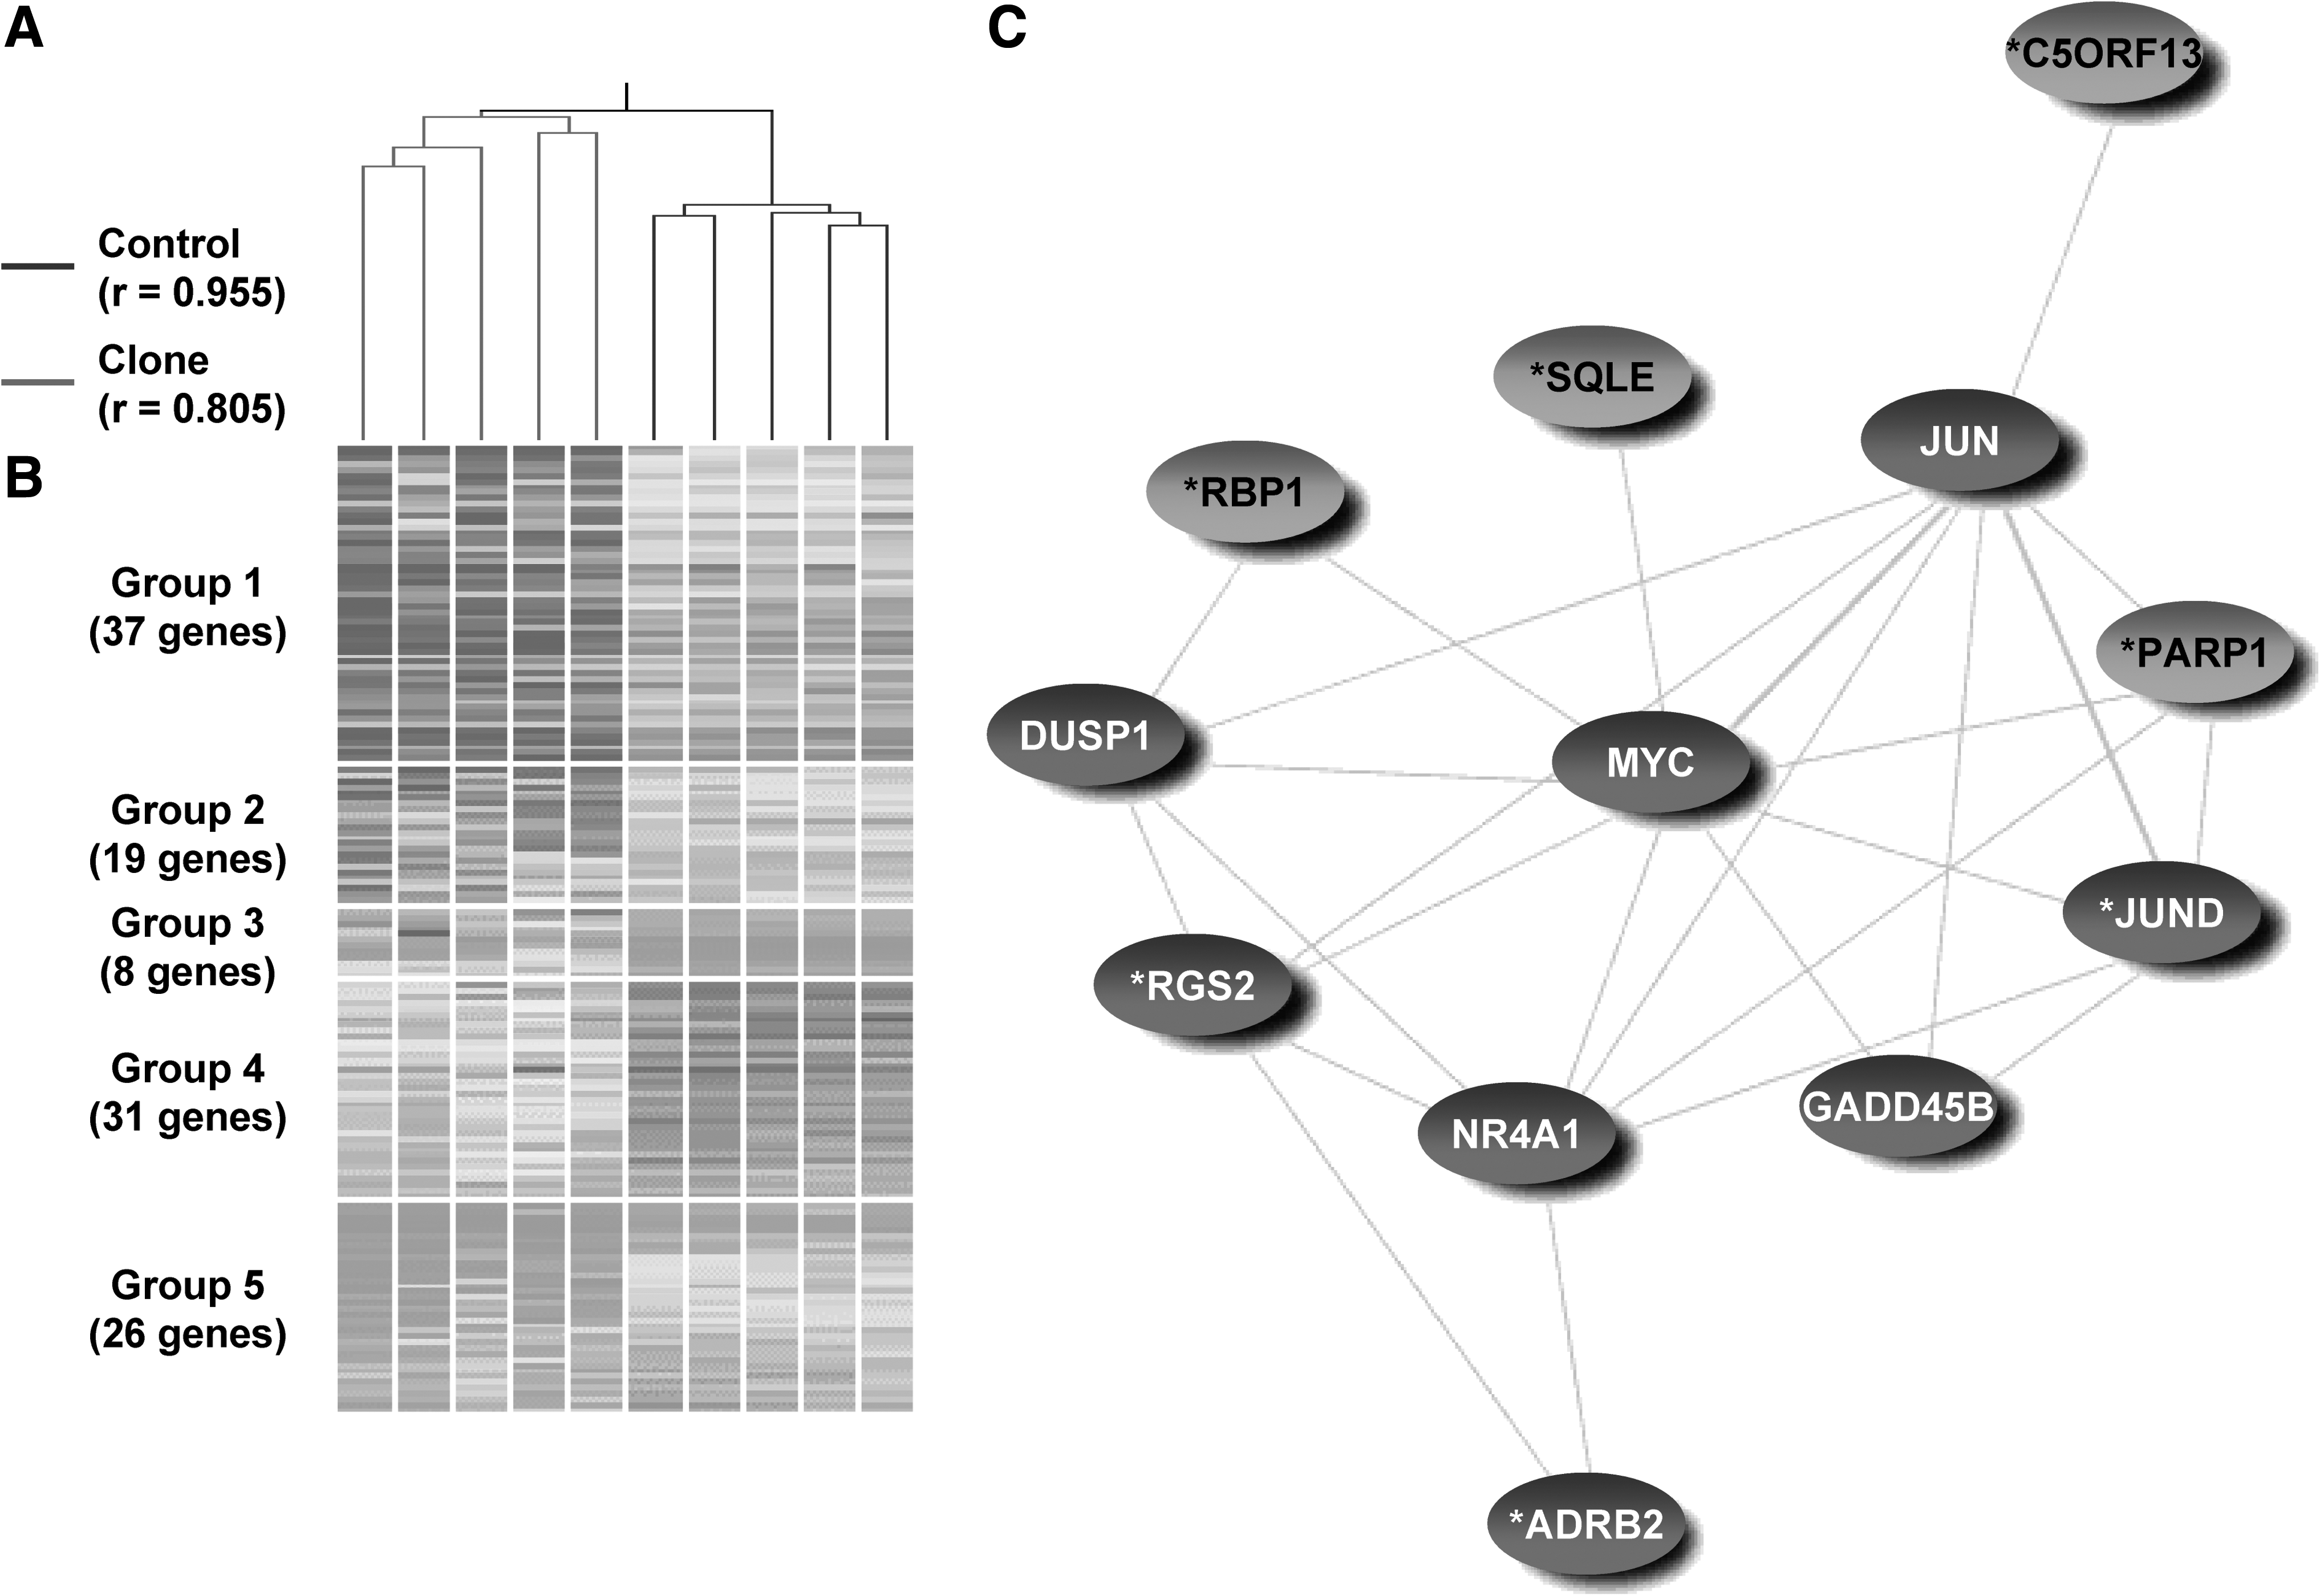
Gene expression analysis of the lung of deceased neonatal cloned pigs compared with age-matched controls. (
Quantitative real-time RT-PCR validation
Gene expression levels detected by microarray hybridization were confirmed by using quantitative real-time RT-PCR (Supplementary Table 7). DCN, representing downregulated genes in the kidney of clones, had 0.55-fold change in clones by quantitative PCR and it was comparable to the fold change of 0.58 by microarray. TXNIP and JUN represented upregulated genes in the kidney of clones, and fold changes of 1.7 and 3.96 for TXNIP and JUN were measured by quantitative PCR. These corresponded with the fold changes of 1.7 and 2.33 by microarray, respectively. ERK2 was a control for the nondifferentially expressed genes between clones and controls by microarray (fold change = 0.88), and quantitative PCR also showed expression level equal to 1 between clones and controls.
DNA methylation analyses
To investigate whether the overall gene expression dysregulation of the cloned animals were associated with changes in global DNA methylation, we used the HPLC technology to study global DNA methylation in the lung because this is the tissue for which we identified a decreased relative organ weight. Representative chromatograms of a standard mixture and each nucleoside of the lung DNA of the clone are presented in Supplemental Figure 2. Five deoxyribonucleosides and 8-Bromoadenine (8BroA), as an internal control, were well separated. The retention times of each nucleoside were comparable to those of the standards. No peak for dA, however, was found for the DNA samples. Instead, deoxyinosine (dI) and byproducts of phosphatase reaction were detected at 8.33 and 18.08 min, respectively. This unexpected digestion of dA was confirmed in a control experiment in which only dA was digested and profiled (data not shown). As shown in Table 3, the ratios of total dC:dG from all samples were almost 1, suggesting that there was no detection bias in the analysis. Interestingly, the mean proportions of 5mC in total dC in cloned pigs were significantly lower (4.57 ± 0.35%) than in controls (5.35 ± 0.4%; p < 0.01).
Differentially expressed (fold change >2, p < 0.05).
p < 0.01, Student's t-test.
Four genes (c-MYC, PER1, CTSL, FS) were chosen for gene-specific DNA methylation analyses in their promoter regions because they were either differentially expressed between the clones and controls and/or exclusively expressed in the lung of one group of animals. c-MYC and PER1 were 2.7- and 2.4-fold upregulated in clones compared to controls (p < 0.01). Gene-specific analyses of DNA methylation revealed that the putative CpG islands in the promoter regions of MYC and PER1 genes were both hypomethylated (<4.93%) in the clones. However, this was not different than the methylation status in controls, despite the observation that both genes were inversely related to the downregulation of DNA methyltransferase 1 (DNMT1) in clones (p < 0.001; Supplemental Fig. 3, Fig. 2). These observations suggest that the differences in the levels of expression of c-MYC and PER1 were not caused by differences in DNA methylation in the promoter regions. The putative CpG islands of additional two genes, CTSL and FS, which were exclusively expressed in cloned animals in the lung, however, were also hypomethylated (<13.24%) in the clones, and there were no statistical differences between clones and controls (Supplementary Tables 8 and 9). To confirm that our methodology was sound, we used a ubiquitously expressed gene, RDBP, as a control and the putative CpG island of this gene was hypermethylated (>79.23%) in the clone and control groups, indicating that the method we used did not cause the observation of hypomethylation in all differentially expressed genes analyzed (Supplementary Table 10).
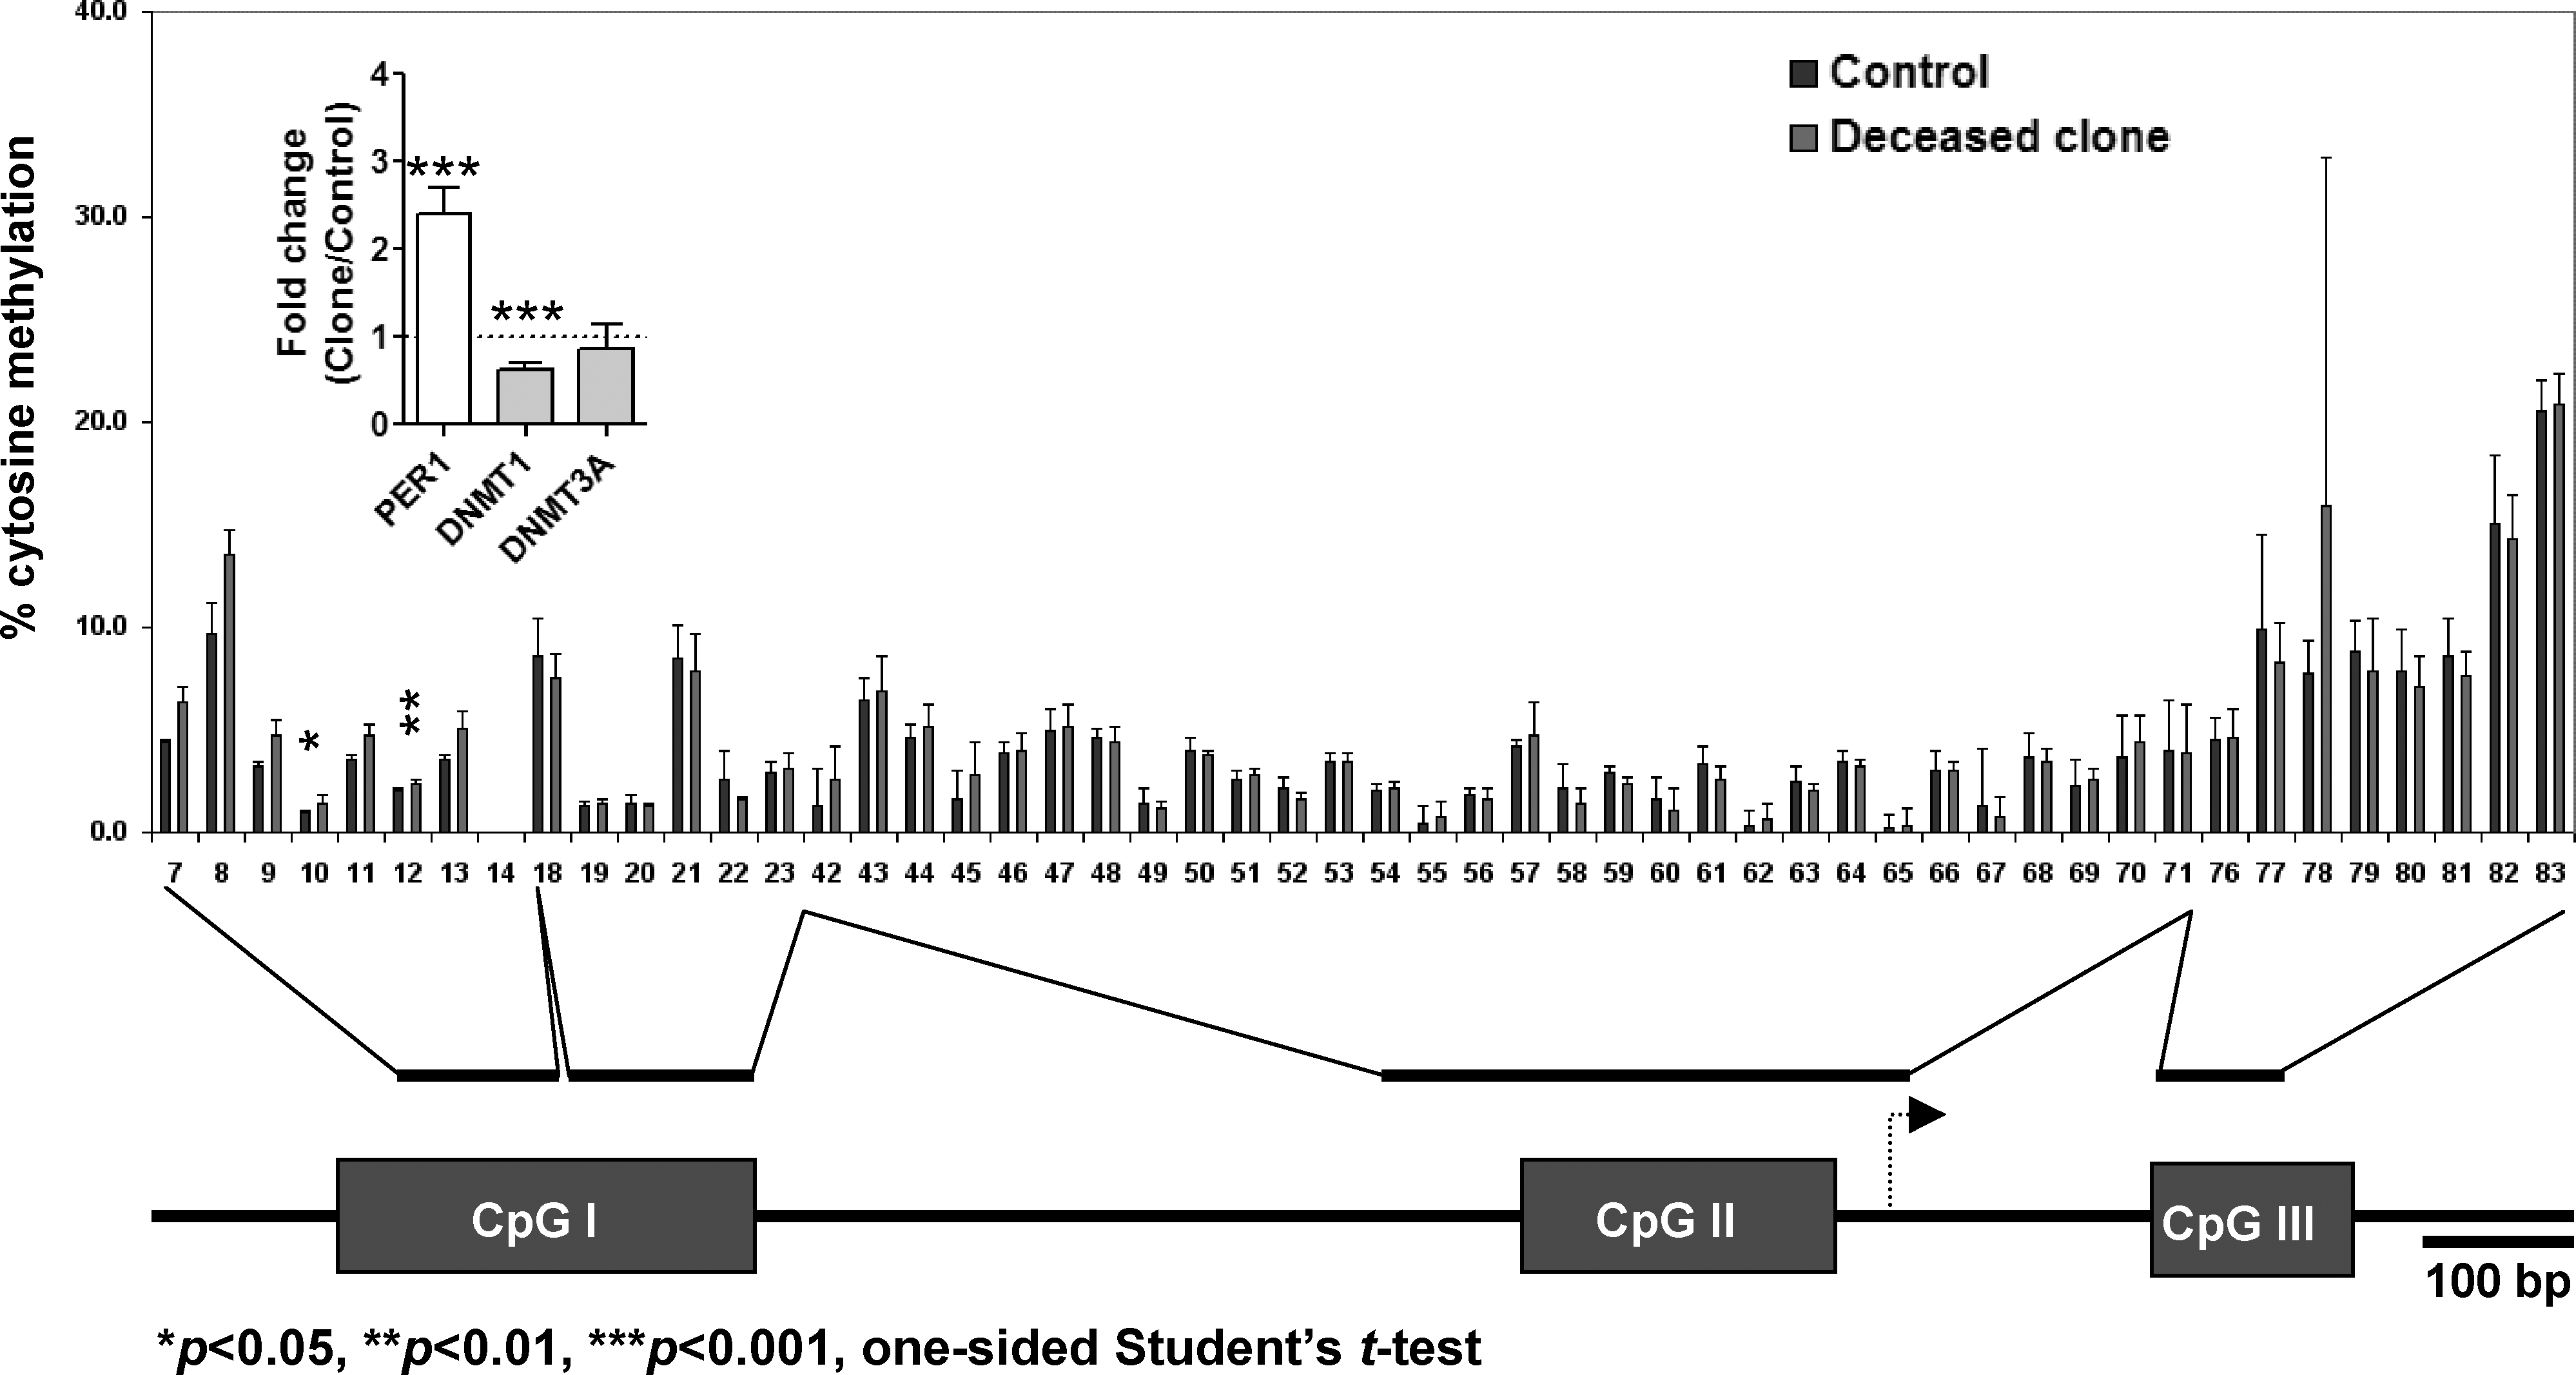
Gene-specific DNA methylation analysis of Period 1 (PER1) promoter region. Schematic diagram of pig PER1 promoter region with putative islands illustrated at the bottom of the figure. Bar indicates length of 100 bp and arrow indicates transcription start site. In the graph, X-axis indicates CpG number and Y-axis indicates percent (%) cytosine methylation. Blue bars represent the control mean methylation levels of individual CpGs with standard deviation, and the red bars represent the mean methylation levels of the clones. Insert compares relative expression levels of PER1 and DNA methyltransferases (DNMT1 and DNMT3A).
Discussion
It is well known that cloned animals, including pigs, suffer from several pathological phenotypes (Lai et al., 2002), and pulmonary hypertension is one of the most typical abnormalities. In this study, we compared the global gene expression profiles between deceased neonatal cloned pigs and their age-matched controls in three different organs, representing the three embryonic germ layers. Although cloned pigs were distinguished clearly from controls in their global gene expression profiles, the overall degrees of alteration in gene expression in cloned pigs are relatively small compared with the observations in cloned, neonatal mice (Humpherys et al., 2002). Differential gene expression in cloned animals is influenced by donor cell type as well as the tissue analyzed (Humpherys et al., 2002). For instance, the lung had the largest amount of gene expression dysregulation compared to the brain and kidney. This may suggest that the lung, of the endodermal origin, was affected to a higher degree by aberrant reprogramming after SCNT. The finding in gene expression profile was consistent with the gross developmental abnormalities, that is, reduced lung weight. In contrast, clones' brains had higher similarity in expression profiles compared to controls. This implies that the brain, of the ectoderm origin, might have undergone more uniform reprogramming after SCNT. Although it has been reported that nuclear reprogramming in cloned bovine embryos is significant and largely complete by the blastocyst stage, it was also suggested that subtle changes in gene expression could be magnified later or that problems with gene expression regulation could arise at later stages of development (Smith et al., 2005).
Literature mining using differentially expressed genes in the lung suggested an imbalance of surfactant homeostasis in the alveoli of clones as a functional abnormality; this cannot be assessed by histological examination. Among these genes, ADRB2 is a regulator of airway responsiveness. Overexpression of ADRB2 suppresses bronchoconstriction and increases alveolar fluid clearance by epithelial transporter activation, particularly in alveolar type II cells (McGraw et al., 2001). PARP1 has been identified to enhance the promoter activity of surfactant protein B (SPB), a protein required for pulmonary function after birth (Maeda et al., 2006). Cholesterol and dipalmitoylphosphatidylcholine are two major components of lung surfactants. Although the functional role of cholesterol in surfactant remains in debate, the surfactant contains up to 10% cholesterol by mass, and physiologically relevant amounts of cholesterol play an important role in surfactant function (Bernardino de la Serna et al., 2004). SQLE is an important enzyme for cholesterol biosynthesis (Honda et al., 1998), and downregulation of SQLE might be associated with pulmonary hypertension due to aberrant composition of surfactant. During fetal development the lung tissues do not mature until shortly before birth when the surfactant, which prevents the lung from collapsing, is made. In cattle, underdevelopment of the lungs is also the most reported cause of clone mortality after birth. Together, the results reported here and those in cloned cattle suggest an association of the timing of tissue maturation and the abnormal gene expression following SCNT.
The animals that were studied died shortly after birth, and no assessment regarding the functions of the analyzed tissues could be made. However, functional annotation and multiplex literature mining on dysregulated genes shed light on the potential functional abnormalities of these organs in clones. For example, in the brain, oligodendrocytes overexpressing CNP is associated with aberrant membrane expanses (Yin et al., 1997). Similarly, in the kidney, several dysregulated genes could potentially induce diabetic nephropathy in cloned pigs. TGFB2 cooperates to regulate nephrogenesis, and overexpression of this gene has been documented to be a major promoter of diabetic nephropathy (Lane et al., 2001). DCN is a natural inhibitor of TGF (Huijun et al., 2005), and downregulated DCN might activate diabetic nephropathy-associated TGFB2 pathway in clones. It has been reported that overexpression of SLC2A1/glucose transporter (GLUT1) in mesangial cells is associated with the expansion of extracellular matrix and other features of diabetic nephropathy (Brosius and Heilig, 2005). TXNIP/vitamin D3 upregulated protein 1 (VDUP1) is activated rapidly and constantly after exposure to high concentrations of glucose, resulting in the development of diabetic nephropathy (Cheng et al., 2006; Kobayashi et al., 2003). The abnormal expression of these important genes involved in renal function may have contributed to the clones' neonatal death.
Cloned animals of many species have been found to have birth weight aberrations. Cattle and mice tend to be bigger and cloned pigs smaller than conventionally produced peers (Humpherys et al., 2002; Smith et al., 2005). Imprinted genes, which are important for fetal growth, have been widely studied to understand pathogenesis in cloned animals (Humpherys et al., 2001; Kohda et al., 2005). In this study, we examined the expression of imprinted genes in the mouse and found that fibroblast growth factor receptor 2 (FGFR2), DCN, and coatomer protein complex subunit gamma 2 (COPG2) were differentially expressed between clones and controls. Interestingly, both FGFR2 and DCN also participate in the MAPK pathway and diabetic nephropathy in the brain and kidney, respectively.
It is important to point out that genes in the MAPK pathway were found to be upregulated in all organs studied herein. High MAPK activity in ovine oocytes has been found to increase the success of SCNT (Lee and Campbell, 2006). The high MAPK activities might have contributed to survival of these embryos. However, failure in fine-tuning the high MAPK activities needed at embryonic stages to a normal level during fetal development in these clones may also have contributed to their deaths because several genes in the MAPK pathway are necessary for normal myelin sheath formation (Lee et al., 2006) and nephrophysiology (Toyoda et al., 2004). Even though literature co-occurrences of some gene pairs of MAPK and pathological terms were as low as one publication, it is noteworthy that the literature database might have different weights of citations between well-studied genes and newly discovered or less investigated genes (Yoshida et al., 2002). Furthermore, it has been reported that gene pairs cocited more frequently in the literature might be functionally related (Schlitt et al., 2003).
To our knowledge, this is the first study in which the global concentration of 5mC was measured in pigs. We determined that the global 5mC concentration is higher in pigs than in other species studied. In several eukaryotic DNA samples, such as cattle, salmon, and humans, less than 2% of 5mC was reported (Kuo et al., 1980). In pigs generated by conventional reproduction, however, more than 5% of 5mC was measured by high-performance liquid chromatography (HPLC). This observation is consistent with the high GC content of specific CpG islands reported in the pig (Amarger et al., 2002). For example, the total length of CpG islands in the H19 region is 10 times higher in pigs than in humans, and there is a ∼5% increase in CG content in the pig INS-IGF2-H19 than in the corresponding region in humans (Amarger et al., 2002). Despite our finding of the total 5mC of 5%, this is still a very small fraction of the total cytosine in the genome. It could be that higher GC content and CpG islands in the pig increases the difficulty of nuclear reprogramming in this species. Because we have found gross abnormalities in the lung, we studied both global and gene-specific DNA methylation in this tissue. Similar to what was reported in aborted and deceased cloned calves (Cezar et al., 2003), cloned pigs that died shortly after birth had lower concentrations of 5mC than their age-matched controls, suggesting a hypomethylated genome in clones. Cloned pig preimplantation embryos were found to have similar DNA methylation patterns in repetitive sequences (represents global DNA methylation levels) compared with controls (Kang et al., 2001). Thus, the DNA hypomethylation we detected might have occurred after early embryonic development. Additionally, we also identified reduced expression of DNMT1 in the clones' lungs, which might be responsible for hypomethylation in this tissue. Furthermore, an inverse correlation was observed between the global concentration of DNA methylation and the number of differentially upregulated genes in the clones, concordant with the mechanism of gene silencing by DNA hypermethylation.
It was surprising that we observed no difference in gene-specific DNA methylation levels between cloned and control pigs for the candidate genes at their promoter regions. The lack of differences in the degree of gene-specific DNA methylation might be caused by the heterogeneous cell population of the tissue, which can cause a dilution effect that interferes with precise quantification of DNA methylation levels. Nonetheless, it is noteworthy that there are species-specific differences in modifying the epigenetic status of cloned donor genomes, and it implies that the analyzed differentially expressed genes may be regulated by a mechanism other than DNA methylation in pigs.
Adult cloned pigs have been documented to have normal clinical chemistry and bodyweights similar to those of age-matched controls up to 27 weeks of age (Archer et al., 2003; Shibata et al., 2006). It remains to be clarified whether gene expression aberrations exist in these seemingly normal animals and to what extent epigenetic aberration and gene expression levels the clones can tolerate.
In summary, this study demonstrates that deceased, neonatal, cloned pigs have a phenotypic abnormality in the lung tissue, which was associated with increased dysregulated gene expression. Abnormal expression of genes was identified in important functions of each organ examined: surfactant in the lung, myelin sheathing in the brain, and diabetic nephropathy in the kidney. More significantly, we identified that the MAPK pathway was abnormally upregulated in all organs studied, suggesting that failure to properly regulate this pathway can lead to the abnormal development observed in the cloned pigs.
Footnotes
Acknowledgments
The authors thank to Dr. Sung-Duk Kim for statistical consultation. This work was supported by grant 1265-31000-091-02S from the United States Department of Agriculture Agricultural Research Service (USDA-ARS) and from the National Institutes of Health (RR013438).
Author Disclosure Statement
The authors declare that no conflicting financial interests exist.
References
Supplementary Material
Please find the following supplemental material available below.
For Open Access articles published under a Creative Commons License, all supplemental material carries the same license as the article it is associated with.
For non-Open Access articles published, all supplemental material carries a non-exclusive license, and permission requests for re-use of supplemental material or any part of supplemental material shall be sent directly to the copyright owner as specified in the copyright notice associated with the article.
