
Abstract
Abstract
Somatic cell nuclear transfer (NT)-specific effects on postblastocyst early cattle embryogenesis were investigated by comparison to in vitro-produced (IVP) embryos grown under identical conditions to embryonic days (E) 14 and 15. Recipient effects were excluded by transferring mixed batches of NT and IVP embryos into each cow. Embryo recovery rates, proportions with an epiblast and embryo, as well as epiblast dimensions did not differ between NT and IVP embryos. A developmental expression profile was determined for nine trophoblast markers, two inner cell mass (ICM)/epiblast markers, and E-cadherin at nine time points between E7 and E26, providing a molecular gene signature assay for developmental progression. Gene expression levels for these genes (Cdx2, Elf5, Mash2, Ifn-tau, Furin, Kunitz1, Pag11, Gata3, Oct4 and Ifitm3) were equal in NT and IVP embryos of equivalent length. Furthermore, the average residual deviation of all 10 genes did not differ significantly suggesting an overall “normality” in gene expression of E14/15 NT embryos. The absence of NT-specific defects during the second, highly selective, week of cattle embryogenesis is interpreted as supportive for the view that NT-associated defects are predominantly of an epigenetic nature.
Introduction
Materials and Methods
Donor somatic cell lines for use in NT
Genetically modified cell lines were used as donor cells to allow the identification of NT embryos postrecovery. Primary bovine female embryonic fibroblast cells (EF5) were stably transfected with the green fluorescent protein expression plasmid pcDNA6.2-GW/EmGFP (Invitrogen, Auckland, NZ) using Lipofectamine-2000 according to the manufacturer's instructions (Invitrogen). After puromycin selection, individual colonies were picked and expanded. Before use in NT, cell lines were karyotyped according to standard procedures and assayed for green fluorescence protein (GFP) expression by fluorescence microscopy.
Generation of IVP and NT blastocysts
Ovaries were sourced from local abattoirs predominantly from Friesian, Jersey, or a Friesian–Jersey cross dairy cows. Oocytes were aspirated, maturated, and fertilized using standard cattle techniques (Thompson et al., 2000). Frozen–thawed spermatozoa from one Friesian bull was used throughout the entire data set. The zona pellucida was removed 20 h after in vitro fertilisation (IVF), by a short incubation in 0.5% pronase (Sigma, Auckland, NZ) in HSOF containing 0.5 mg/mL of polyvinyl alcohol. Zygotes were singly cultured in vitro for 7 days in biphasic synthetic oviduct medium (SOF; Thompson et el., 2000) supplemented with 10 μmol 2,4-dinitrophenol from day 5 to 7 (Thompson et al., 2000).
Oocytes from the same pool of ovaries were used as hosts for zona-free somatic cell NT, performed as previously described (Smith et al., 2007), although omitting the serum starvation step to prevent potential epigenetic shutdown of transgene expression.
Embryo transfer
Seven days after IVF or NT, groups of grade 1 and 2 blastocysts (early to expanded) were selected for transfer by morphological evaluation (Robertson and Nelson, 1998). Grading and selection of blastocysts were completed by the same experienced embryologist throughout the entire data collection period to reduce variability. The number of blastocysts transferred per recipient was 10 NT and 5 grade and stage-matched IVP (in one case the ratio was 7:7). Blastocysts were washed twice in Emcare Hold (ICPbio, Auckland, NZ) and loaded into 0.25-mL plastic straws for transfer. Blastocysts were transferred nonsurgically into the uterine horn ipsilateral to the corpus luteum (CL) of estrus-synchronized animals 7 days after standing estrus. In three separate NT runs, a set of 10 NT and 5 IVP grade and stage-matched blastocysts were transferred to each of two, two, and three recipients, respectively. In one of these transfers a set of seven NT and seven IVP embryos were used.
Recipients
Parous nonlactating dairy cows 3 to 5 years of age were tested for their suitability as optimal recipients by repeated transfer and recovery of embryos. Four cows always yielding high recoveries were chosen and used throughout these experiments. Recipients were maintained under pastoral farming conditions but kept indoors in a physical containment level 2 facility (http://www.biosecurity.govt.nz/files/regs/stds/154-03-02.pdf, page 22) from 3 days prior to transfer to flushing. These cows were synchronized using a single intravaginal progesterone-releasing device for 10 to 12 days (CIDR-BTM, InterAg, Hamilton, NZ). At device insertion, 1 mg of estradiol benzoate (CIDIROL, InterAg) was administered intramuscularly. Four days before device removal, animals received 500 μg cloprostenol (Estroplan, Parnell Laboratories, Auckland, NZ). Animals were checked for signs of estrus three times daily and only those observed in standing estrus on the day of IVF/NT, and which possessed a palpable CL, were selected to receive embryos. Embryos were transferred transcervically with a standard 0.25-mL embryo transfer instrument into the uterine horn ipsilateral to the CL. Embryos were recovered by nonsurgical flushing at 7 or 8 days posttransfer corresponding to a gestational age of 14 or 15 days as described previously (Berg et al., 2010). The same operator transferred and recovered the embryos.
Embryos used for determining gene expression profiles over developmental time were recovered at 2 days (E9), 4 days (E11), 7 days (E14), and 10 days (E17) posttransfer by nonsurgical flushing. For E20 and E26 embryos, reproductive tracts were removed immediately following recipient slaughter (captive bolt and exsanginuination) and transported to the laboratory within 45 min of slaughter. The uterine horns were dissected free of surrounding tissue and separated from the tract well below the bifurcation. The horn ipsilateral to the CL was flushed once with 20 mL of Emcare Complete (ICPbio, Auckland, NZ) introduced via syringe and blunt needle at the uterotubal junction and recovered at the severed end after gentle massage.
Embryo analyses
Embryos were identified by stereomicroscopy, their origin recorded, total length measured using graduated eyepieces, and examined for the presence of an embryonic disc/epiblast. Embryos that were dark/opaque with cells sloughing off and embryos that had arrested at the blastocyst stage were classified as dead. Embryos were examined for expression of fluorescent proteins using either Leica DMIRB and DMI6000B inverted microscopes with I3/GFP filter sets. This method did not always unequivocally identify transgenic embryos as autofluorescence at E14 was found to interfere with the weak fluorescence obtained when GFP was driven by the standard cytomegalovrius (CMV) enhancer.
Embryos were then cut into several fragments for use in genotyping, gene expression analyses, and fixation in 4% PFA/PBS–0.1% Tween-20. For the identification of NT (transgenic) embryos, an embryo fragment was PCR-genotyped, after a 2-h digestion at 55°C with shaking at 900 rpm in 30 μL proteinase K buffer (Donnison et al., 2005), using GFP primers (449 bp) 5′-CCGACCACAT GAAGCAGCACGAC and 5′-TCACGAACTC CAGCAGGACCAT and 0.25 μL of centrifuged (16,000 × g, 10 min) lysate. Animal procedures were conducted under the approval of the Ruakura Animal Ethics Committee (R.A.E.C. 11183).
Expression analyses
RNA isolation, spike addition, reverse transcription, real-time PCR and quantitation procedures were performed as detailed previously (Smith et al., 2007), with the following modifications. The minicolumn step was replaced with an ethanol precipitation and wash. Real-time PCR was done on a Corbett Rotorgene 6000 (Qiagen, Bio-Strategy, Auckland, NZ) with SYBR ExTaq Mix (Takara Bio Inc., Shiga, Japan) with 3-min initial denaturation, followed by 40 cycles of 95°C for 10 sec, 60°C for 25 sec. For primer details see Table 1. We quantified transcripts relative to the geometric mean using three housekeepers (HK) while normalizing for different amplification efficiencies, a, as follows: expression level of gene of interest (goi) = [agoi^(−Ctgoi)]/([aHK1^(−CtHK1) ×aHK2^(−CtHK2) × aHK3^(−CtHK3)]^(1/3)), where Ct represents the number of cycles required to reach a constant threshold level of fluorescence and the term ax^(−Ctx) is equal to the starting concentration of gene X (which is the variable to be measured), times a constant that depends on the threshold level. Each sample was measured in triplicate, one measurement being of a twofold dilution. Samples not showing halving of copy number ± 50% when diluted twofold were deemed to lie outside the linear range and discarded. A no-template control, RT-control, and dissociation curve analysis were included in each real-time run.
Statistical analysis
Logistic regression analyses using modeling of binomial distributions were used to examine significance of number of embryos retrieved and number with epiblast with the aid of GenStat statistical software (VSN International, Oxford, UK). The natural logarithm of embryo and epiblast length and or width was analyzed for age and type (NT vs. IVP) effects using REML in GenStat, specifying transfer batch as a random effect to take account of the structure of the experiment. The natural logarithm of gene expression data was correlated against the natural logarithm of embryo length using SigmaPlot 10 (Systat Software, Chicago, IL, USA). The overall variation of gene expression between IVP and NT embryo gene expression (10 genes) were analyzed by comparing the natural logarithms of the average squared student residuals on ln embryo length using Analysis of Variance (DataDesk 6.1; Data Description, Ithaca, NY, USA).
Results
Recoveries and morphological characteristics of NT and IVP embryos
Embryonic day 14 and 15 embryos were recovered after seven embryo transfers of 15 blastocysts (mostly 10 NT-derived and 5 IVP controls). Neither the proportion of embryos retrieved nor the proportion with an epiblast differed significantly between cotransferred IVP and NT embryos (Table 2). Indeed, the proportion of embryos with an epiblast relative to the number transferred was identical (51%).
Similarly, at E14 and E15 embryo length, which is a reflection of trophoblast proliferation, was identical for both groups of embryos at each stage (Fig. 1). As expected, trophoblast proliferation is intense at E14 as shown by a 2.6- (NT) to 2.7-fold (IVP) increase in length over the next 24 h (Fig. 1). Epiblast dimensions did not differ between E14 NT and IVP embryos. The average length of 200 μm exceeding the width of 150 μm was due to a change of shape of the disc from circular to oval, which is characteristic for this stage of development (Vejlsted et al., 2006).
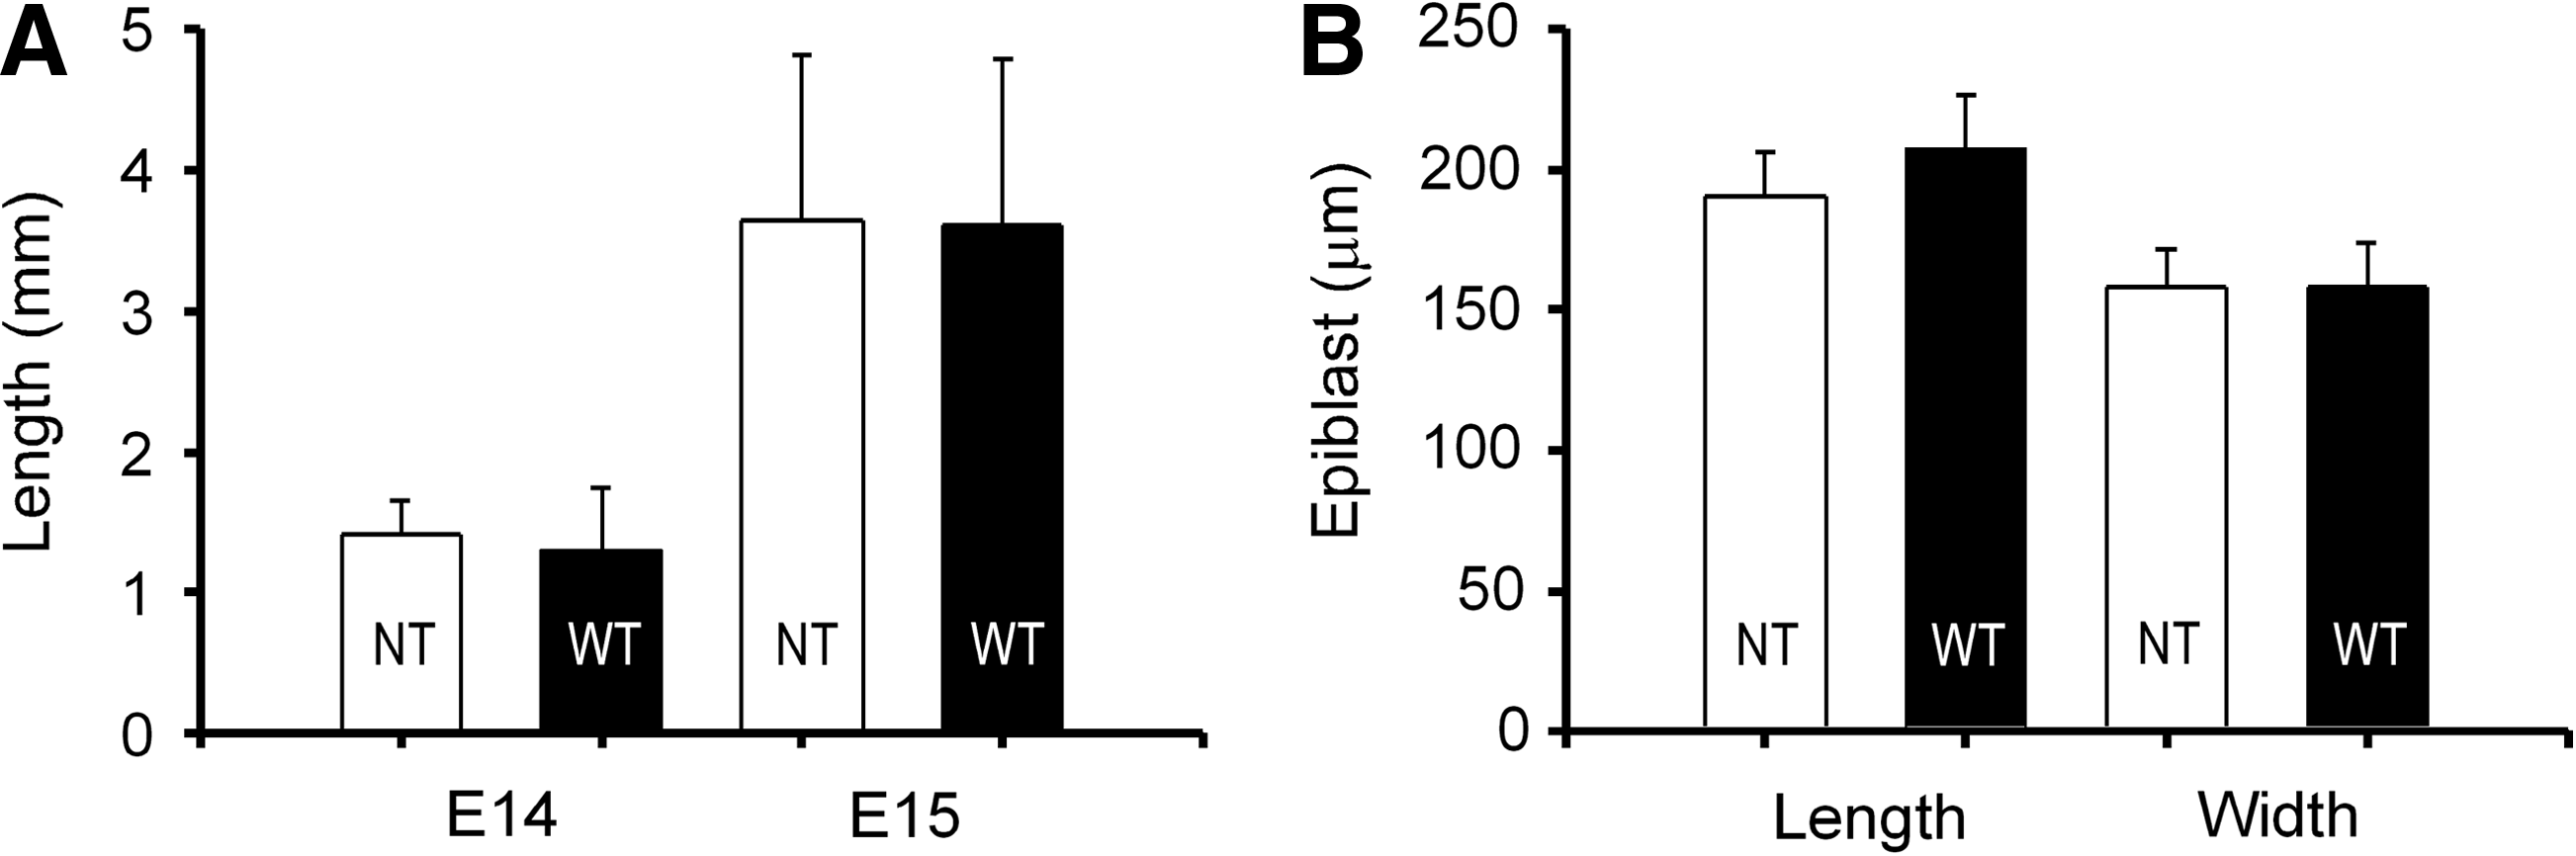
Characterisation of cotransferrred nuclear transfer (NT) and wild-type (WT/IVP) embryos at embryonic days (E) 14 and 15.
Gene expression profiling of bovine embryos between blastocyst and neurulation stages
For comparing the developmental stage of the E14–E15 embryos at a molecular level, we sought to determine a set of markers showing dynamic changes in expression over this period. We measured the developmental expression of nine trophoblast markers, two ICM/epiblast markers, and E-cadherin at nine time points between E7 and E26 (Fig. 2). The trophoblast markers Cdx2 and Elf5 peaked at around E9, with Elf5 levels extremely low and undetectable at the blastocyst stage. This phase was succeeded by Mash2 expression, with maximum levels at E14 then dropping to nearly undetectable levels by E20, the time of apposition. Mash2 expression was closely followed in developmental time by the three trophoblast markers Ifn-tau-c1, Furin, and Kunitz1, all showing maximum expression at E17. Of the three genes, Ifn-tau exhibited the sharpest rise and fall in expression, Furin the shallowest. Pregnancy associated protein 11 was expressed quite suddenly and at very high levels at E14 and E17 and was maintained at half to a third of these levels thereafter. The binucleate cell marker Placental Lactogen (Plac Lac) was detectable only from E20, rising exponentially thereafter. Gata3, implicated in early trophoblast determination in the mouse, exhibited a biphasic expression pattern, being high at E7 and E9, before rapidly dropping at E11 and then steadily climbing to intermediate levels. These genes thus describe a distinct signature for the developmental state of the trophoblast, although the late expression of Plac Lac made it unsuitable for examination of E14–E15 embryos. Similarly, the precipitous drop in E-cadherin transcripts after blastocyst stages followed by unchanging expression levels between E9 and E26 render this epithelial cell marker unsuitable for developmental age determination.
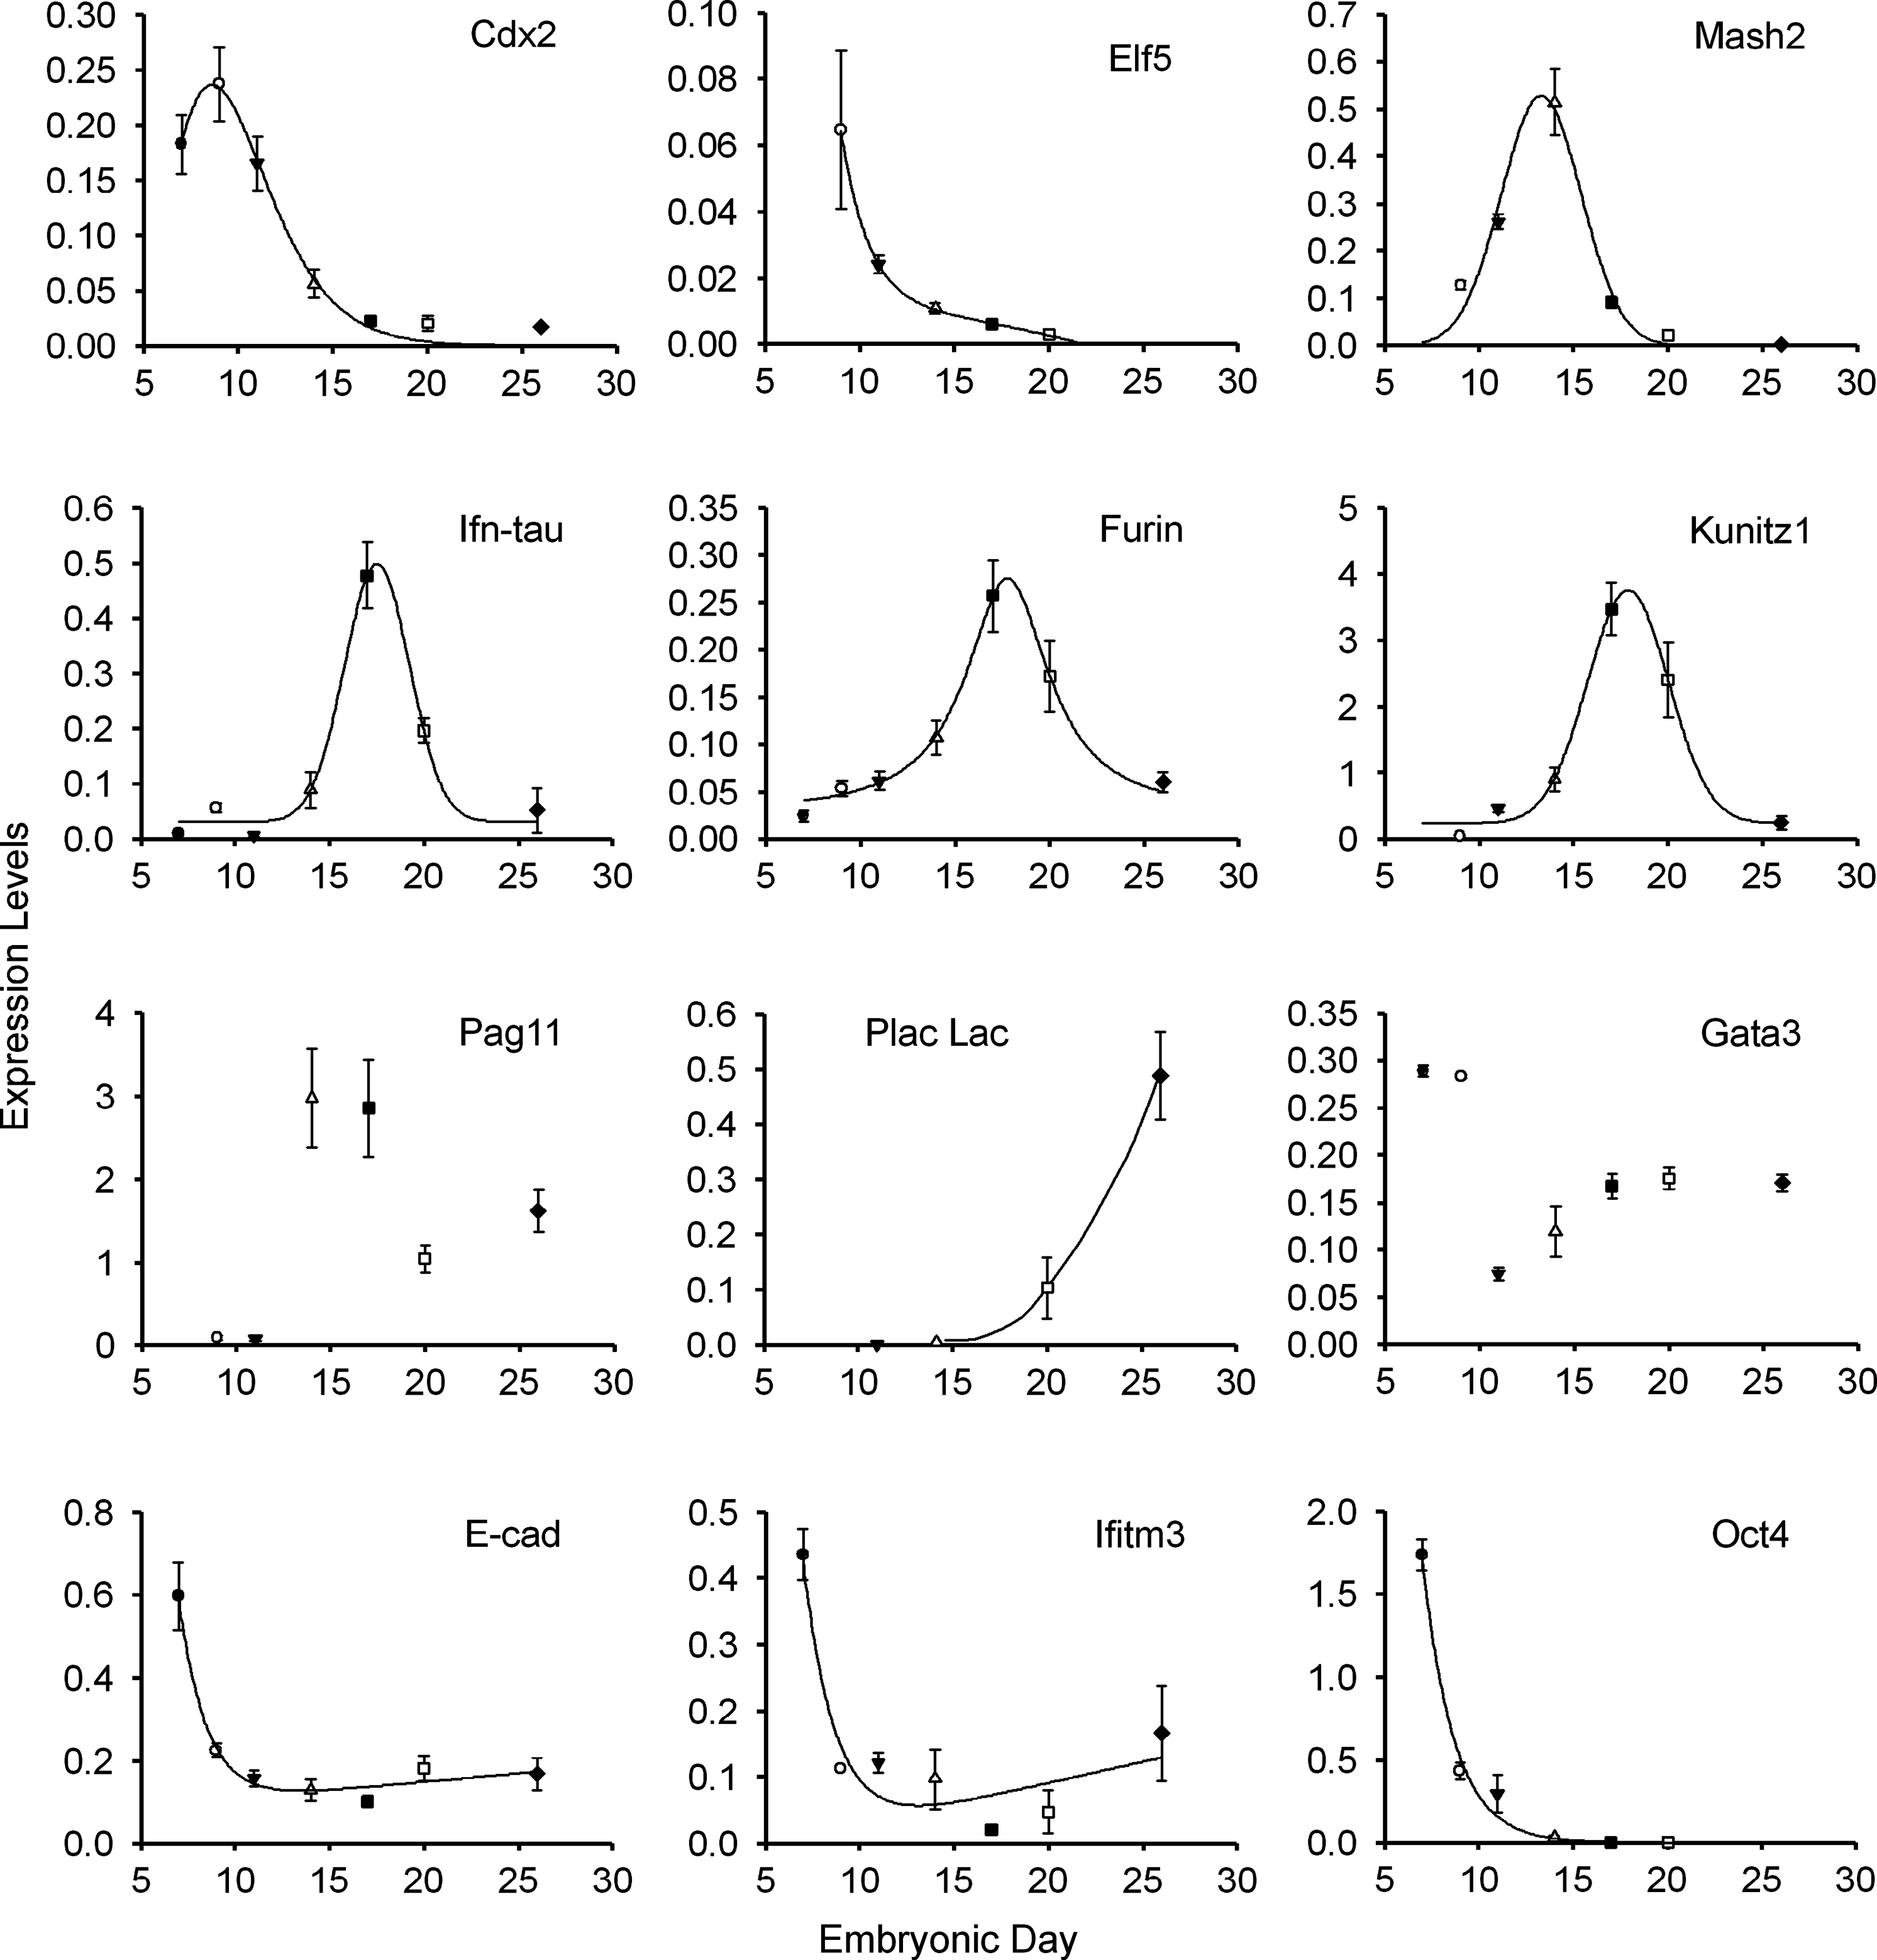
Quantitative expression profiles of developmentally important genes between E7 and 26 indicates specific gene expression signatures at successive time points of embryogenesis. Expression was normalized against the geometric mean of three housekeepers taking amplification efficiencies into account. Hence abscissa levels of different genes are directly comparable. Each point represents the average of triplicate measurements taken on four individual embryos (E14–E26) or four pools of embryos (E7, n = 20; E9, n = 10; E11, n = 2). Only extraembryonic membranes were included at E26. Error bars, SEM.
The epiblast-specific markers Oct4 and Ifitm3 (Smith et al., 2007) transcripts rapidly decreased from blastocyst stages reflecting the decreased contribution of the ICM/epiblast tissue to the whole embryo over this period. Furthermore, in the case of Oct4 at least, initial expression in the trophoblast is gradually extinguished during this period (manuscript under review). Notably, whereas transcripts of both genes become practically undetectable by E17, Ifitm3 expression can again be detected from E20 onward, suggesting a new domain of expression.
Gene expression in NT and IVP E14–E15 embryos
Having demonstrated the dynamic pattern of gene expression with time of development and knowing the great heterogeneity in development even among embryos retrieved from the same recipient (this data, and see Berg et al., 2010), it is clear that a simple comparison of gene expression at most developmental ages could easily yield misleading results. Therefore, gene expression was measured relative to embryonic length. This is based on the premise that the length of the conceptus at E14 to E15 reflects the developmental stage. This hypothesis was supported by the data (Fig. 3). The expression of trophoblast markers such as Cdx2 and Elf5, which declines with developmental stage (Fig. 2), exhibited a significant negative correlation with increasing embryonic length (Fig. 3). Conversely, Ifn-tau-c1, Kunitz1, Furin, and PAG-11, all increasing in expression as gastrulation proceeds between E14 and E17 (Fig. 2), are positively correlated in terms of expression level and embryo length at E14–E15 (Fig. 3). Mash2, at the peak of its expression at E14–E15 shows, as expected, no clear correlation between length and expression at this stage.
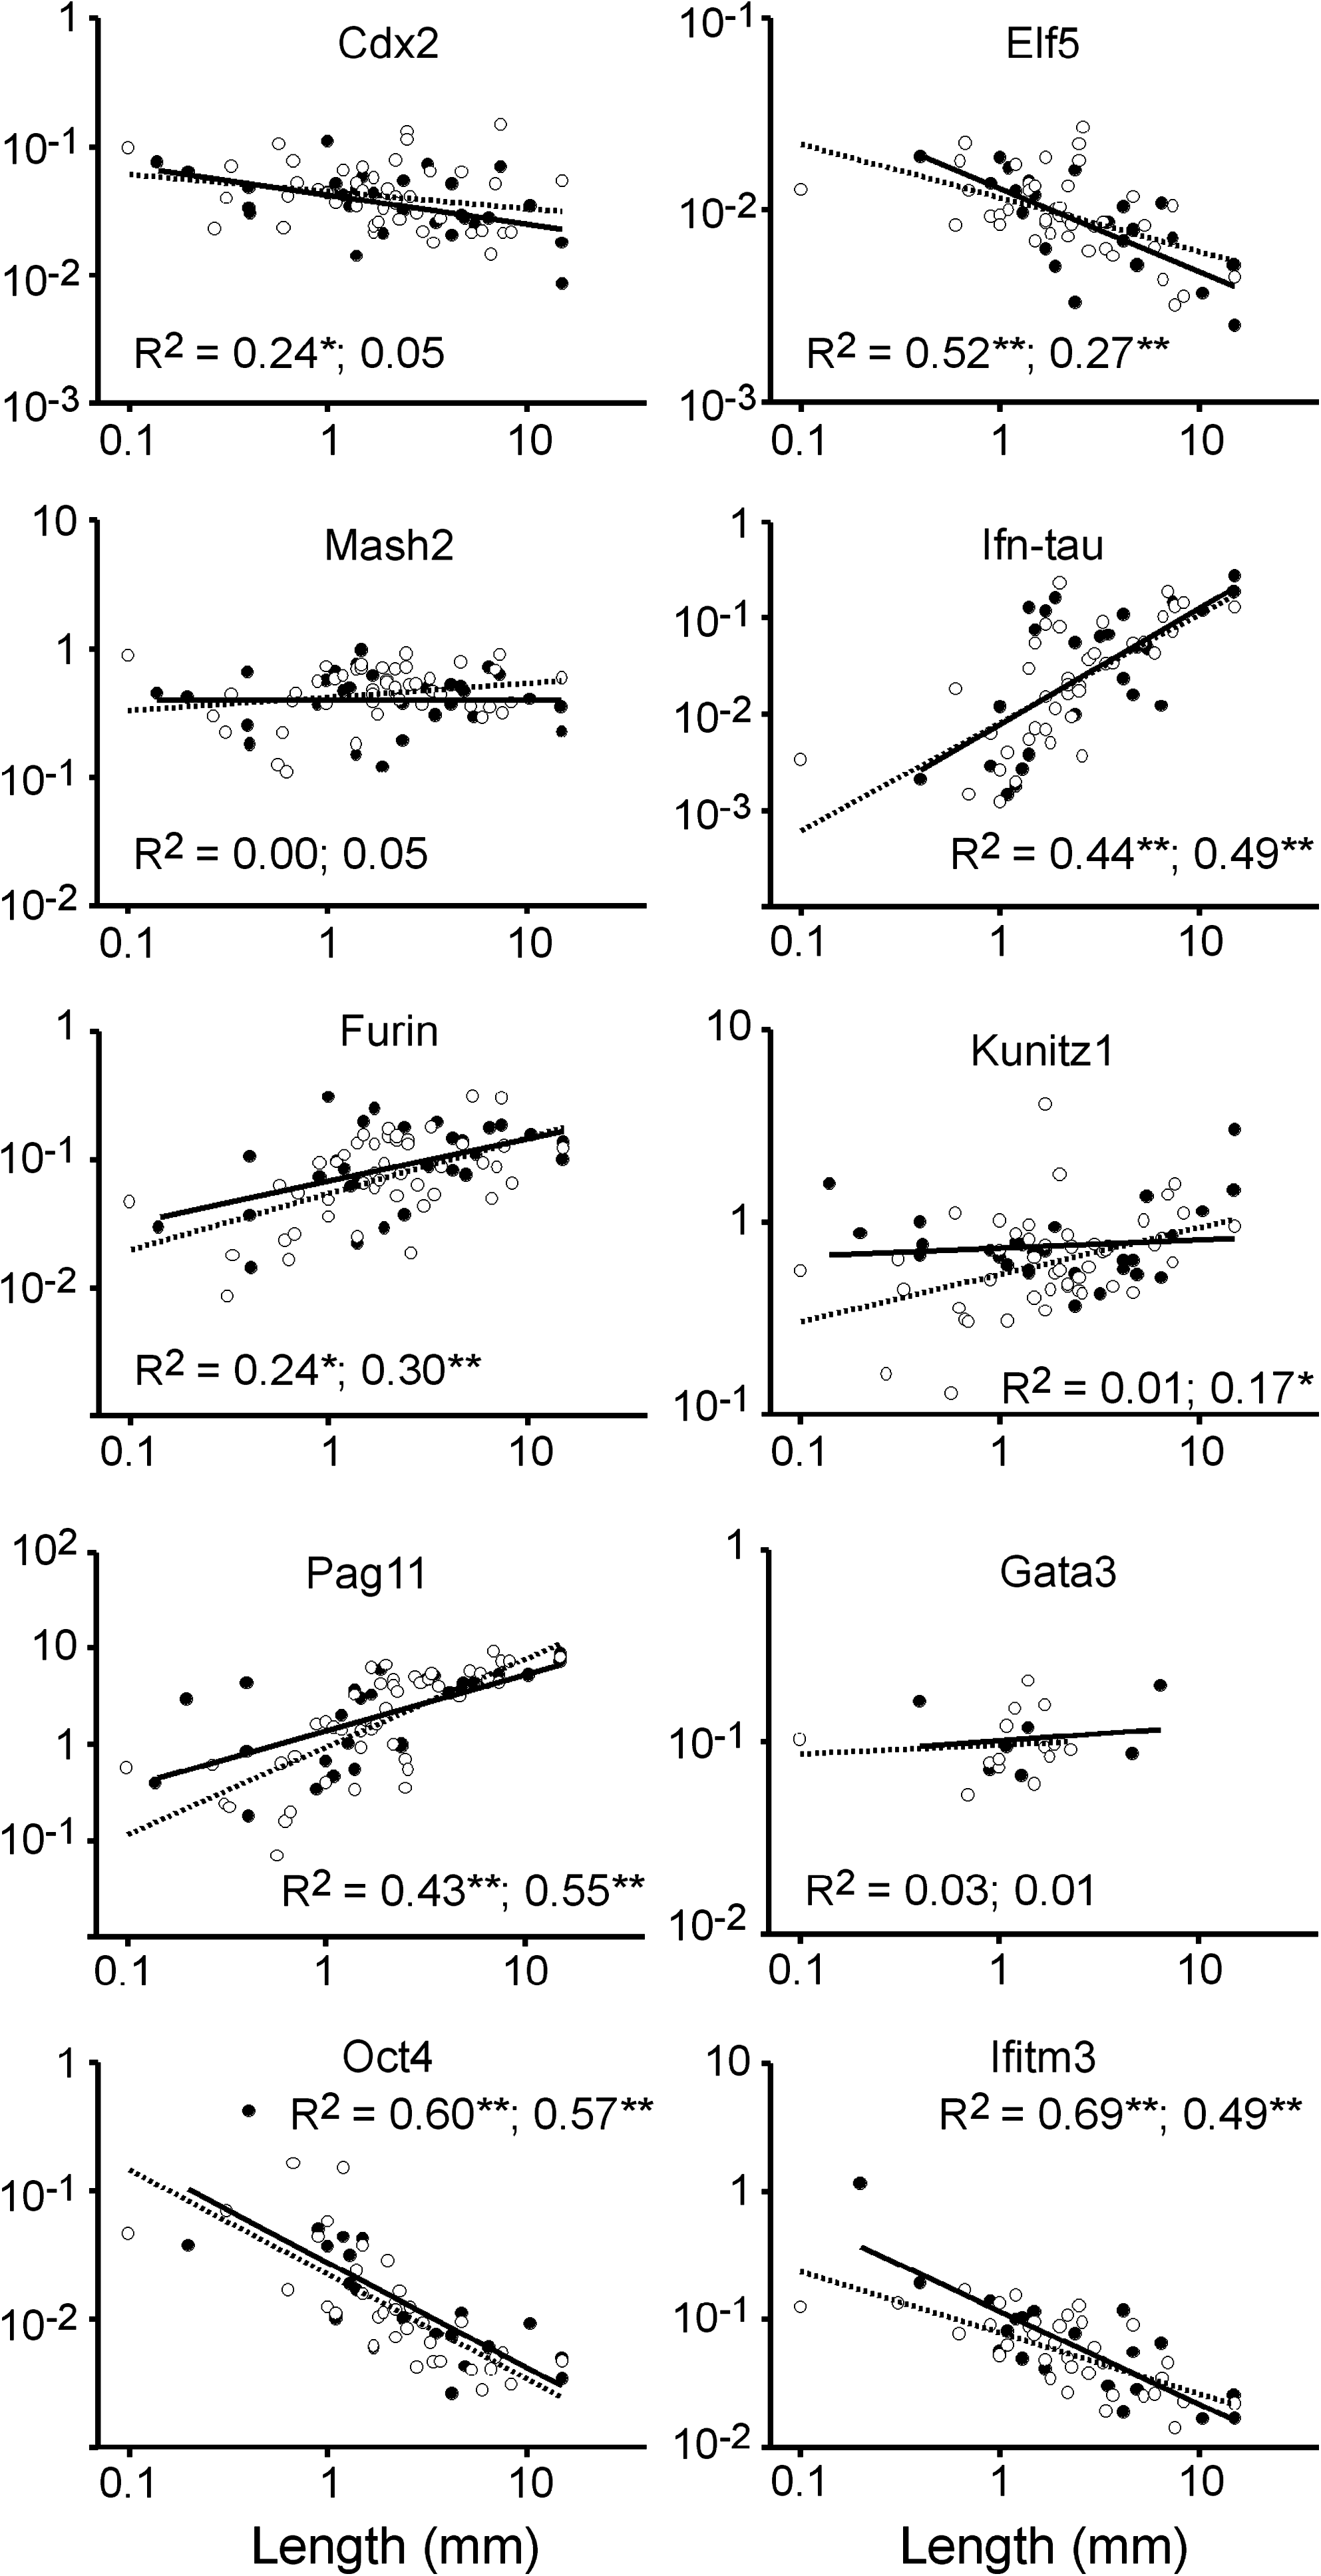
Gene expression levels versus embryo lengths for E14 and E15 cotransferred NT and IVP matched blastocysts. Expression levels determined as for Figure 2. Open circle and dashed lines represent NT embryos with trendlines, closed circles and solid lines are wild-type embryos. For the epiblast markers Oct4 and Ifitm3 (Fragilis), only embryos with discernable epiblasts were included. R2 are shown for WT, then NT; **p < 0.001; *p < 0.01; no star = P > 0.10.
Comparing NT to IVP embryos incorporating the effect of length revealed no significant differences for the eight trophoblast and two epiblast markers examined. Correlations between gene expression and length were equal in terms of trend (positive or negative) and nearly indistinguishable in terms of slope in NT and IVP embryos (Fig. 3).
The overall abnormality of gene expression of an individual embryo was examined by quantifying the variation in expression from the level expected for its length for all ten genes (Fig. 4). A comparison of these averaged residuals between NT and IVP embryos revealed no difference, indicating that the gene expression profile of NT embryos does not differ more from the overall (NT and IVP) average than does that of IVP embryos.
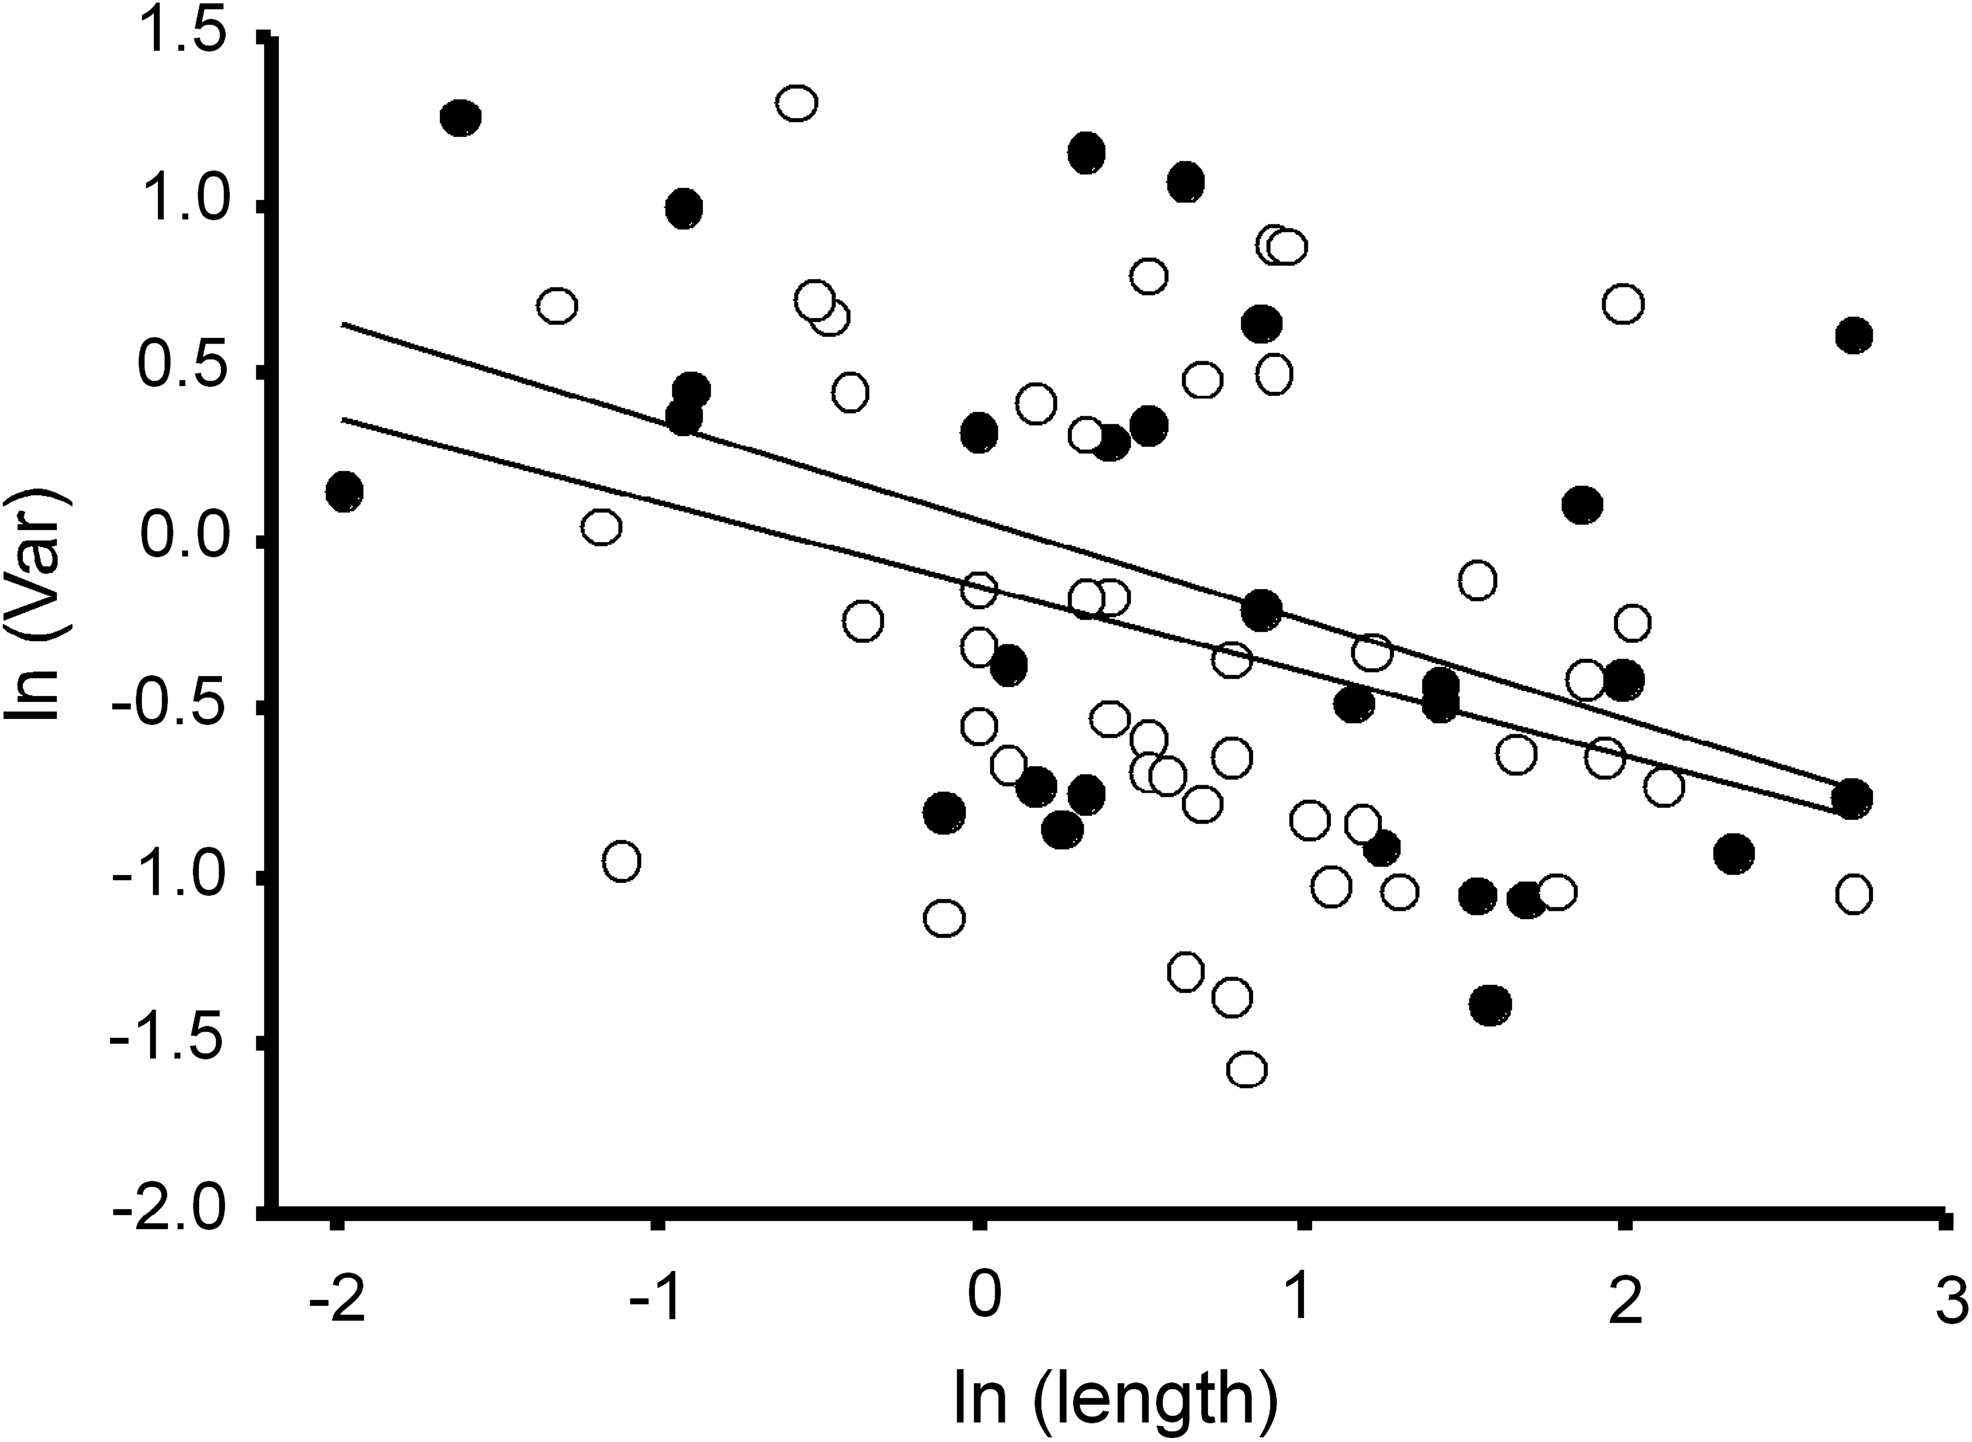
Gene expression level variation. The natural logarithm (ln) of gene expression variation, ln (Var), for the 10 genes shown in Figure 3, calculated as the average of the squared residuals for each embryo, is plotted against the ln of embryo length (in mm). Open circles represent E14 and 15 NT embryos, closed circles IVP embryos. No significant difference in gene expression variation is seen between NT and IVP embryos (p = 0.3).
Discussion
Our results demonstrate that when keeping environmental conditions equal, E14–E15 NT embryos are indistinguishable from their IVP counterparts in terms of survival, frequency of epiblast formation, embryo length, and epiblast dimensions. Furthermore, NT embryos retrieved are also indistinguishable molecularly, in as far as they express the expected amounts of 10 different genes according to their developmental age as assayed by embryo length.
How do the results presented relate to others? Similar to this study, Ideta and colleagues (2007) found no significant differences between NT and IVP embryos in recovery rates, proportion with epiblast, and length. Alexopoulus et al. (2008), using vitrified as well as fresh blastocysts and recording extremely low recoveries (7–25%), noted reduced recovery and length of NT embryos at E14 but not at a significant level. Castro's group recovered E17 IVP and NT embryos at similar frequencies but found a significant twofold reduction in NT embryo length (Rodriguez-Alvarez et al., 2010). The latter result should be interpreted cautiously, as only six IVP embryos were examined, and length can vary dramatically even within the same recipient (Berg et al., 2010). Thus, in terms of recoveries and morphological characteristics, previous data agrees with or at least does not rigorously contradict our data. We cannot directly compare our gene expression results to others as expression has previously been quantified only at embryonic day 17, with one group finding no difference in Interferon-tau but upregulation of Mash2 expression in NT embryos (Arnold et al., 2006), the other noting a significant increase of Ifn-tau in NT embryos (Rodriguez-Alvarez et al., 2010). These contradictory results may be reconciled by our demonstration that gene expression varies dramatically over short developmental time windows. Thus, treatment comparisons of gene expression need to include a measure of development (length/embryological stage) other than chronological age, at least for those genes and time periods where levels are changing rapidly. As the E17 gene expression studies have not included this criterion, it is unclear whether differences are due to the NT treatment or the “developmental age” of the embryos used for the analyses.
What is the significance of our results? High in vivo losses (11%) (Roche et al., 1981) show that the embryo is highly susceptible to developmental errors during the second week of embryogenesis. This reflects the fact that embryos have to surmount several critical events during this period, including hatching, differentiation of the ICM into epi- and hypoblast, intense trophoblast proliferation, and the onset of gastrulation. Thus, the equal survival rates and gene expression levels shown by trophoblast and epiblast markers, of NT and IVP embryos through this critical phase implies that the treatment of somatic cell NT confers no disadvantage to embryonic health above that already conferred by in vitro culture. This suggests that the reason why NT leads to reduced birth rates compared to IVP is predominantly due to NT-specific errors manifesting their effect at later stages. Indeed, IVP generated fetuses are lost at relatively low rates, with, on average, only 11–13% fetal death observed after E40 (Agca et al., 1998; Farin et al., 2006). In contrast, at least a third of NT pregnancies terminate during the foetal period (Oback and Wells, 2003), with 8% annual losses observed even after parturition (Wells et al., 2004).
These observations allow some speculation as to the nature of NT-specific deleterious changes. During the reprogramming of the donor nucleus after somatic cell NT, two events occur. Gene expression is reset from the donor state to an early embryonic state, allowing the activation of a spatially and temporally correct embryonic gene expression program. Second, the epigenetic state of the nucleus is reset by virtue of chromatin and DNA methylation remodeling. This affects the potential of genes to be activated or repressed. Importantly, because of the hierarchical nature of gene regulatory networks leading to the progressive refinement of embryonic patterning (Davidson and Erwin, 2006; Erwin and Davidson, 2009), errors in gene expression arising through the incomplete shutdown of donor-specific genes or activation of embryonic genes, would tend to lead to rapid phenotypic consequences visible during the embryonic phase. In contrast, epigenetic changes or errors are by definition mitotically heritable (Jaenisch and Bird, 2003), and thus may exert their phenotypic effect at any stage of development. For example, the effect of an altered epigenetic state of the heart-specific enhancer of a gene will only become apparent during heart formation/function even though the change may have occurred at the zygotic stage. Thus, the absence of phenotypic changes in NT embryos after 2 weeks of gestation, as seen here, together with observations of high NT fetal mortality, argues that NT-specific errors are late-acting and thus predominantly of an epigenetic nature. Conversely, the high rate of early embryo mortality of IVP or NT embryos (relative to AI) is likely to involve culture-induced aberrant gene expression at blastocyst stages, leading to the immediate defects seen over the subsequent week. This line of thought predicts that cultured NT and IVP embryos should differ, in terms of gene expression profiles, more from their in vivo counterparts than from each other. We have observed this when minimizing genetic heterogeneity (Smith et al., 2007), a finding directly (Camargo et al., 2005) and indirectly (Tesfaye et al., 2004) supported by others. Furthermore, the identical rates of development to E14–E15, when tightly controlling the environment of matched NT and IVP blastocysts grown in parallel under equal conditions, raises questions as to the significance of those gene expression differences that are detected between these type of blastocysts. We had previously reported blastocyst NT/IVP differences in Ifitm3 expression (Smith et al., 2007), but embryos surviving to E14–E15 expressed this gene at equal levels (this study). Notably, global gene expression profiling of NT and IVP embryos have led to lists of genes aberrantly expressed at blastocyst stages, but despite most studies using fibroblasts as donor cells, the identified genes were strikingly different (Beyhan et al., 2007; Pfister-Genskow et al., 2005; Smith et al., 2005; Somers et al., 2006). This suggests, first, that NT-specific defects are stochastic and/or are masked by the high variability seen in IVP embryos. Second, NT-specific changes in gene expression (relative to IVP blastocysts) do not lead to measurable phenotypic consequences in the subsequent week of development, possibly due to the self-correcting robust gene regulatory networks guiding early development (Davidson and Erwin, 2006). These speculations lead to two conclusions. (1) Gene expression studies at the blastocyst stage are unlikely to yield insight into NT-specific changes. (2) Using development to gastrulation stages as a measure of the accuracy of NT reprogramming is as problematic as measuring development to blastocyst stages, in both cases reflecting predominantly the efficiency of the in vitro culturing system.
The gene expression profiles of cattle trophoblast markers indicate a distinct shift in expression with developmental time. This series can be summarized (maximum expression) as Cdx2, Gata3 (E7–9)→Elf5 (E9)→Mash2 (E13)→Pag11 (E14)→ Ifn-tau-c1, Furin, Kunitz1 (E17)→Plac Lact (>E26). The orthologous genes in the mouse exhibit a similar temporal expression pattern. Cdx2 and Gata3 expression is seen from morula stages in all trophoblast cells, then Cdx2 refines to the undifferentiated extraembryonic ectoderm layer (E×E) of trophoblast at egg cylinder stages (Strumpf et al., 2005). Elf5 expression commences in the E×E layer at E5.5 (Donnison et al., 2005). Mash2 expression is seen a day later, in the nonoverlapping ectoplacental cone region, which contains differentiated trophoblast cells that will give rise to spongiotrophoblasts and giant cells, which are the mouse equivalent of binucleate cells. The mouse homologue of Kunitz1 (Spint1/HAI-1) is detectable from E7.5 in the E×E-derived labyrinth region, marking diploid cuboidal trophoblast cells as well as differentiated syncytiotrophoblasts (Fan et al., 2007; Tanaka et al., 2005). The large family of mouse Placental Lactogen genes are expressed last, from E8.5 onward, with high expression in giant cells (Simmons et al., 2008). Only Furin (Spc1) expression does not fit the cattle series in that it can be detected relatively earlier, from around E5.5 (Beck et al., 2002). In the mouse, the temporal order of expression of these genes reflects the progressive differentiation of a proliferative stem cell-like trophoblast cell into the spatially distinct syncytio-, spongio-, or giant-trophoblasts. Thus, Cdx2 and Elf5 expression characterizes the stem cell state, Mash2 and Furin, an intermediate diploid state that leads to either spongiotrophoblasts or giant cells, whereas Plac Lact expression characterizes fully differentiated cells (Simmons and Cross, 2005). Kunitz1 marks an alternate, Mash2-independent, differentiation pathway. The similar temporal gene expression profiles between cattle and mouse trophoblast markers suggests similar differentiation pathways. This applies at least to the terminal differentiation marker Plac Lact expressed specifically in fully differentiated bovine binucleate cells (Wooding, 1992). These cells are first seen from E17 (Greenstein et al., 1958) and eventually make up 20% of the trophoblast (Wooding, 1992), explaining the rapid but relatively late rise in Plac Lact levels starting between E17 and E20. Ultrastructurally, ruminant trophoblast cells progress from an initial flat squamous epithelium at blastocyst stages to a cuboidal or polygonal shape as elongation starts (E11 in sheep, E13 in cattle) (Guillomot, 1995; Wintenberger-Torres and Flechon, 1974). By E17 in cattle, some of these cuboidal cells have formed columnar cells with large fatty acid vacuoles; others have started differentiating into future binucleate cells (Greenstein et al., 1958). In both sheep (E16) and cattle (E18) there is evidence for a nonrandom distribution of cell types within the trophoblast with cells nearer the embryo containing fewer liposomes (Greenstein et al., 1958; Wintenberger-Torres and Flechon, 1974) and cuboidal trophoblast cells persisting at the extremity of the conceptus at later stages (Greenstein et al., 1958). Thus, although there are no obvious cattle correlates to mouse spongio- or syncytiotrophoblasts, morphological heterogeneity does exist among cattle trophoblasts. It will be of future interest to determine whether any of the temporally regulated trophoblast markers can specify bovine trophoblast subpopulations, and whether these are restricted spatially as in the mouse. Some evidence for such a scenario is provided by the expression pattern of the gene c12, seen in only some dispersed cells of the tubular E14–E15 cattle embryo (Degrelle et al., 2005).
Footnotes
Acknowledgments
We thank Dr. David Wells and his team for the generation of nuclear transfer embryos, Anita Ledgard for help with embryo retrieval, and Harold Henderson for help with statistical analysis. This work was funded by NERF Grant C10X0303 from the New Zealand Foundation for Research, Science and Technology.
Author Disclosure Statement
The authors declare that no conflicting financial interests exist.