




Abstract
Abstract
Hypoxia promotes the proliferation of neural progenitor cells (NPCs), and low oxygen is a useful tool for expansion of NPCs in vitro. To further understand the regulation of the mechanisms involved, we first identified the gene expression profile of NPCs and characterized their metabolic changes in vitro under 3% oxygen. NPCs derived from E13.5 rat mesencephalon were cultured under either normoxia or hypoxia for 24 h and 72 h. Total RNA was subjected to cDNA microarray analysis of 5705 genes. The results showed that approximately 1.24% of gene expression changed under low oxygen at the two time points. Among the 142 differentially expressed genes, the greatest number was involved in glycolysis and metabolism. The metabolic changes of NPCs under low oxygen conditions were also assayed. The glucose content in the conditioned medium incubated in low oxygen decreased significantly; however, the levels of pyruvate and lactic acid increased compared to conditioned medium cultured in normoxia. The NPCs under low oxygen consumed more glucose and produced energy by glycolysis. The information gained from gene expression and metabolic analyses of NPCs under low oxygen conditions will provide new approaches for the evaluation of NPCs as potential in vivo cellular therapeutics.
Introduction
The effects of oxygen availability on stem cell physiology have gained increased attention recently (Zoran, 2009). It is also well established that oxygen levels influence such fundamental processes as cell metabolism, proliferation, and survival (John et al., 2007). Hypoxia is an important mediator for a variety of signaling pathways as well as overall gene expression (Taylor and Pouyssegur, 2007). However, to date, in vitro studies using NPCs have primarily been done under atmospheric conditions of 20% oxygen (Zoran, 2009). Thus, oxygen concentration should be considered for in vitro culture of NPCs as well as for in vivo cell transplantation.
Neural stem/progenitor cells (NSCs or NPCs) may be obtained from embryonic or adult brain tissue. They may also be acquired from pluripotent stem cells such as embryonic stem cells or induced pluripotent stem (iPS) cells, which are self-renewing and have the multipotential ability to differentiate into neuron and glial cells in vitro (McKay, 1997; Okano, 2002; Reynolds et al., 1992). NPCs have been utilized therapeutically for neurodegenerative and ischemic diseases (Storch and Schwarz, 2002). The transplantation of NPCs to treat neural degenerative diseases such as Parkinson's disease and brain trauma has made great progress. However, little attention has been paid to the “hypoxic niche” on which transplanted neural stem cells lie, because the normal mammalian cell culture system employs 20% oxygen. The molecular mechanisms that trigger cell proliferation and sustain NPCs survival under low oxygen conditions are not well understood. To investigate these molecular mechanisms we have examined the gene expression profiles of NPCs under normoxia and low oxygen (3%), which mimics certain aspects of the in vivo microenvironment. We utilized a microarray containing 5,705 genes and analyzed the differentially expressed genes in NPCs under hypoxic conditions. To understand how the NPCs grow under hypoxia, we assayed the metabolic changes of NPCs under low oxygen conditions. Thus, elucidation of the genetic program of NPCs under low oxygen conditions is important for the evaluation of NPCs as potential cellular therapeutics.
Materials and Methods
Animals
Pregnant Wistar rats at 13.5 days of gestation (E13.5) were used. The Institutional Animal Care and Use Committee (IACUC) of Academy of Military Medical Sciences approved all experiments involving rats.
Isolation and Expansion of NPCs
Isolation and expansion of NPCs was performed as described previously (Zhang et al., 2007). Briefly, cells derived from Wistar rat mesencephalon (E13.5) were mechanically dissociated and grown in DMEM/F12 (1:1) medium containing 25 mM glucose, 2 mM L-glutamine, 5 IU of penicillin, 5 μg/mL streptomycin, 1% N2 (Life Technologies, Grand Island, NY, USA), 1% B27 (Life Technologies), 20 ng/mL epidermal growth factor (EGF) (Invitrogen, Carlsbad, CA, USA), and 20 ng/mL basic fibroblast growth factor (bFGF) (Invitrogen). The primary neurospheres were defined as passage zero (P0) NPCs. These neurospheres were treated with 0.25% trypsin and dissociated into single cells for propagation. NPCs were used for the following experiment at passage 2–5.
Identification of Neural Stem Cells
The generated neurospheres were collected and washed twice with DMEM/F12 and then treated with 0.25% trypsin and dissociated into single cells. The single cells were plated in poly-D-lysine-coated 35-mm dishes and fixed with 4% paraformaldehyde at 4°C for 2 h. Immunofluorescence staining was then performed according to a standard protocol (Zhang et al., 2007). The primary antimouse Nestin antibody (Chemicon, Temucula, CA) was used at a 1:1000 dilution to identify NPCs. A FITC-conjugated secondary antibody (Molecular Probes, Eugene, OR, USA) was used at a 1:1000 dilution for visualization.
Low oxygen conditions
To establish low oxygen (3% O2) conditions, an incubation chamber (Model 3111, Thermo Electron Cooperation, Marietta, OH, USA) with a built-in oxygen control system was used, which can automatically control the oxygen concentration. The neurospheres were treated with 0.25% trypsin and dissociated into single cells. The single cells were plated on 10-cm dishes at 5 × 10⁵ cells per mL in 10 mL growth medium, DMEM/F12 containing EGF and bFGF, and incubated under normoxia (20% O2) or hypoxia (3% O2) for 24 or 72 h. These cells were then processed for protein or RNA extraction.
Cell proliferation assay
Cell proliferation rates and cytotoxicity were assayed using the
Protein extraction and Western blot
Cells were harvested quickly after either hypoxic or normoxic culture for 72 h. Total protein was extracted with lysis buffer. Extracts were analyzed by a protein assay kit (Bio-Rad) and were fractionated by 6% polyacrylamide-SDS gel electrophoresis and transferred to a polyvinylpyrrolidone difluoride membrane (Immobilon-P, Millipore, Bedford, MA, USA). The membrane was blocked with Tris-buffered saline (TBS-T) containing 5% dry milk at room temperature for 2 h. Membranes were incubated with mouse anti-MAP2 monoclonal antibody (Chemicon, 1:1000 dilution), rabbit anti-GFAP polyclonal antibody (Santa Cruz, Santa Cruz, CA, USA, dilution at 1:500), mouse anti-CNPase monoclonal antibody (Sigma, St. Louis, MO, USA, dilution at 1:2000), or mouse anti-Nestin monoclonal antibody (Chemicon, dilution at 1:1000) in TBS-T containing 5% nonfat dry milk. Membranes were treated with goat or rabbit antimouse secondary antibodies conjugated with horseradish peroxidase (Santa Cruz, 1:1000 dilution) in TBS-T containing 5% nonfat dry milk. Immune complexes on the membrane were visualized by using an enhanced chemiluminescence (ECL) detection system (Amersham Biosciences, Piscataway, NJ, USA).
Microarray analysis
Total RNA was extracted from cells with TRIZOL reagent (Invitrogen, Gaithersburg, MD, USA) and was further purified with an RNeasy mini kit (Qiagen, Valencia, CA, USA) according to the manufacturer's instructions. The RNA was quantified by spectrometry, and the quality was confirmed by gel electrophoresis. The rat genome-wide long oligonucleotide microarray was constructed by Capital Biochip Corporation (Beijing, China). The Rat Genome Oligo Set Version 1.0 consisting of 5′-amino-modified 70-mer probes representing 5705 genes was purchased from Qiagen (http://oligos.qiagen.com/arrays/oligosets_overview.php). In addition to the internal controls provided by the manufacturer, three Arabidopsis genes with a length of 70 bases were added as external controls. Fluorescent dye (Cy5 and Cy3-dCTP) labeled DNA was produced via Eberwine's linear RNA amplification method and subsequent enzymatic reaction. Arrays were scanned with a Scan-Array Express scanner (Packard Bioscience, Kanata, OT, Canada), and the obtained images were analyzed with GenePix Pro 4.0 (Axon Instruments, Foster City, CA). A space- and intensity-dependent normalization method based on a LOWESS program (Yang et al., 2002) was employed. Spots with a ratio outside the 95% confidence interval were determined to be significantly differently expressed genes.
Semiquantitative reverse transcription-polymerase chain reaction (PCR)
Total RNA was extracted from prepared cells as described above, and 5 μg of total RNA was reverse-transcribed into cDNA using avian myeloblastosis virus transcriptase (Ambion, Austin, TX, USA) and oligo (dT) primers. PCR amplification was performed in 25 μL reactions containing 1 μL of cDNA and 2.5 U of Taq DNA polymerase (Takara, Otsu, Japan). Primer sequences used for semiquantitative RT-PCR analysis are listed in Table 1. 18S rRNA amplified from the same samples served as an internal control. PCR mixtures were denatured at 95°C for 5 min, and cDNA templates were amplified as follows: 25 cycles (28 cycles for 18S) of denaturation at 95°C for 1 min, annealing at 45–55°C for 45 sec, and extension at 72°C for 1 min. At the end of the cycling, the samples were incubated at 72°C for 10 min. The amplified DNA products were visualized on a 2% agarose gel and photographed under ultraviolet light.
Measurement of glucose, pyruvate concentration and pH, ATP value
The NPCs were plated on 35-mm dishes at 5 × 10⁵ cells/mL in 2 mL of culture media and incubated under normoxia (20% O2) or hypoxia (3% O2) for 1, 3, or 5 days. Each sample medium was subsequently collected and filtered with a centrifugal filter to remove large macromolecules that may damage the microdialysis analyzer. The concentration of glucose (mmol/L) and pyruvate (μmol/L), lactic acid (mmol/L), and the pH was measured for six to eight samples of control (i.e., nonconditioned medium) and conditioned medium per group using a CMA 600 microdialysis analyzer (Japan).
To measure cellular ATP, the NPCs were plated on a 96-well plate at 1 × 10⁵ cells/mL in 100 μL culture media and incubated under normoxia (20% O2) or hypoxia (3% O2) for 1, 3, or 5 days. Cellular ATP content was assayed using the CellTiter-Glo reagent (Promega, Madison, WI), following the manufacturer's instructions. The quantity of ATP was calculated by simultaneously generating an ATP standard curve as previously reported (Crouch, 1993). Cellular ATP levels were then normalized to the number of cells in each sample (n = 8).
Statistical analysis
All of the experimental data shown were repeated at least three times, unless otherwise indicated. Data were presented as mean ± SEM. Statistical significance was determined by t-test. Statistical probability of p < 0.05 was considered significant.
Results
Low oxygen promotes the growth of embryonic neural progenitor cells
Neurospheres derived from rat mesencephalon (E13.5) at passage 2–5 were used for the experiments. Figure 1Aa shows that the NPCs dissociated from neuropheres were Nestin-positive. Usually, a single cell grows into a neurosphere after 3 days of culture, so the number of neuropheres represents the proliferative ability of neural stem cells in culture. The NPCs were cultured under either normoxia (20% O2) or low oxygen (3% O2) for 1, 3, or 5 days. The number of neurospheres formed under low oxygen conditions was greater than those formed under normoxic conditions (Fig. 1Ab and Ac), which is consistent with our previously reported results (Zhang et al., 2007). The growth curve of NPCs was assayed by CCK-8 as shown in Figure 1B after the same number of cells was used to seed the 96-well plate for each condition. The results show that low oxygen promoted the proliferation of NPCs significantly compared to normoxic conditions at the third and fifth day.
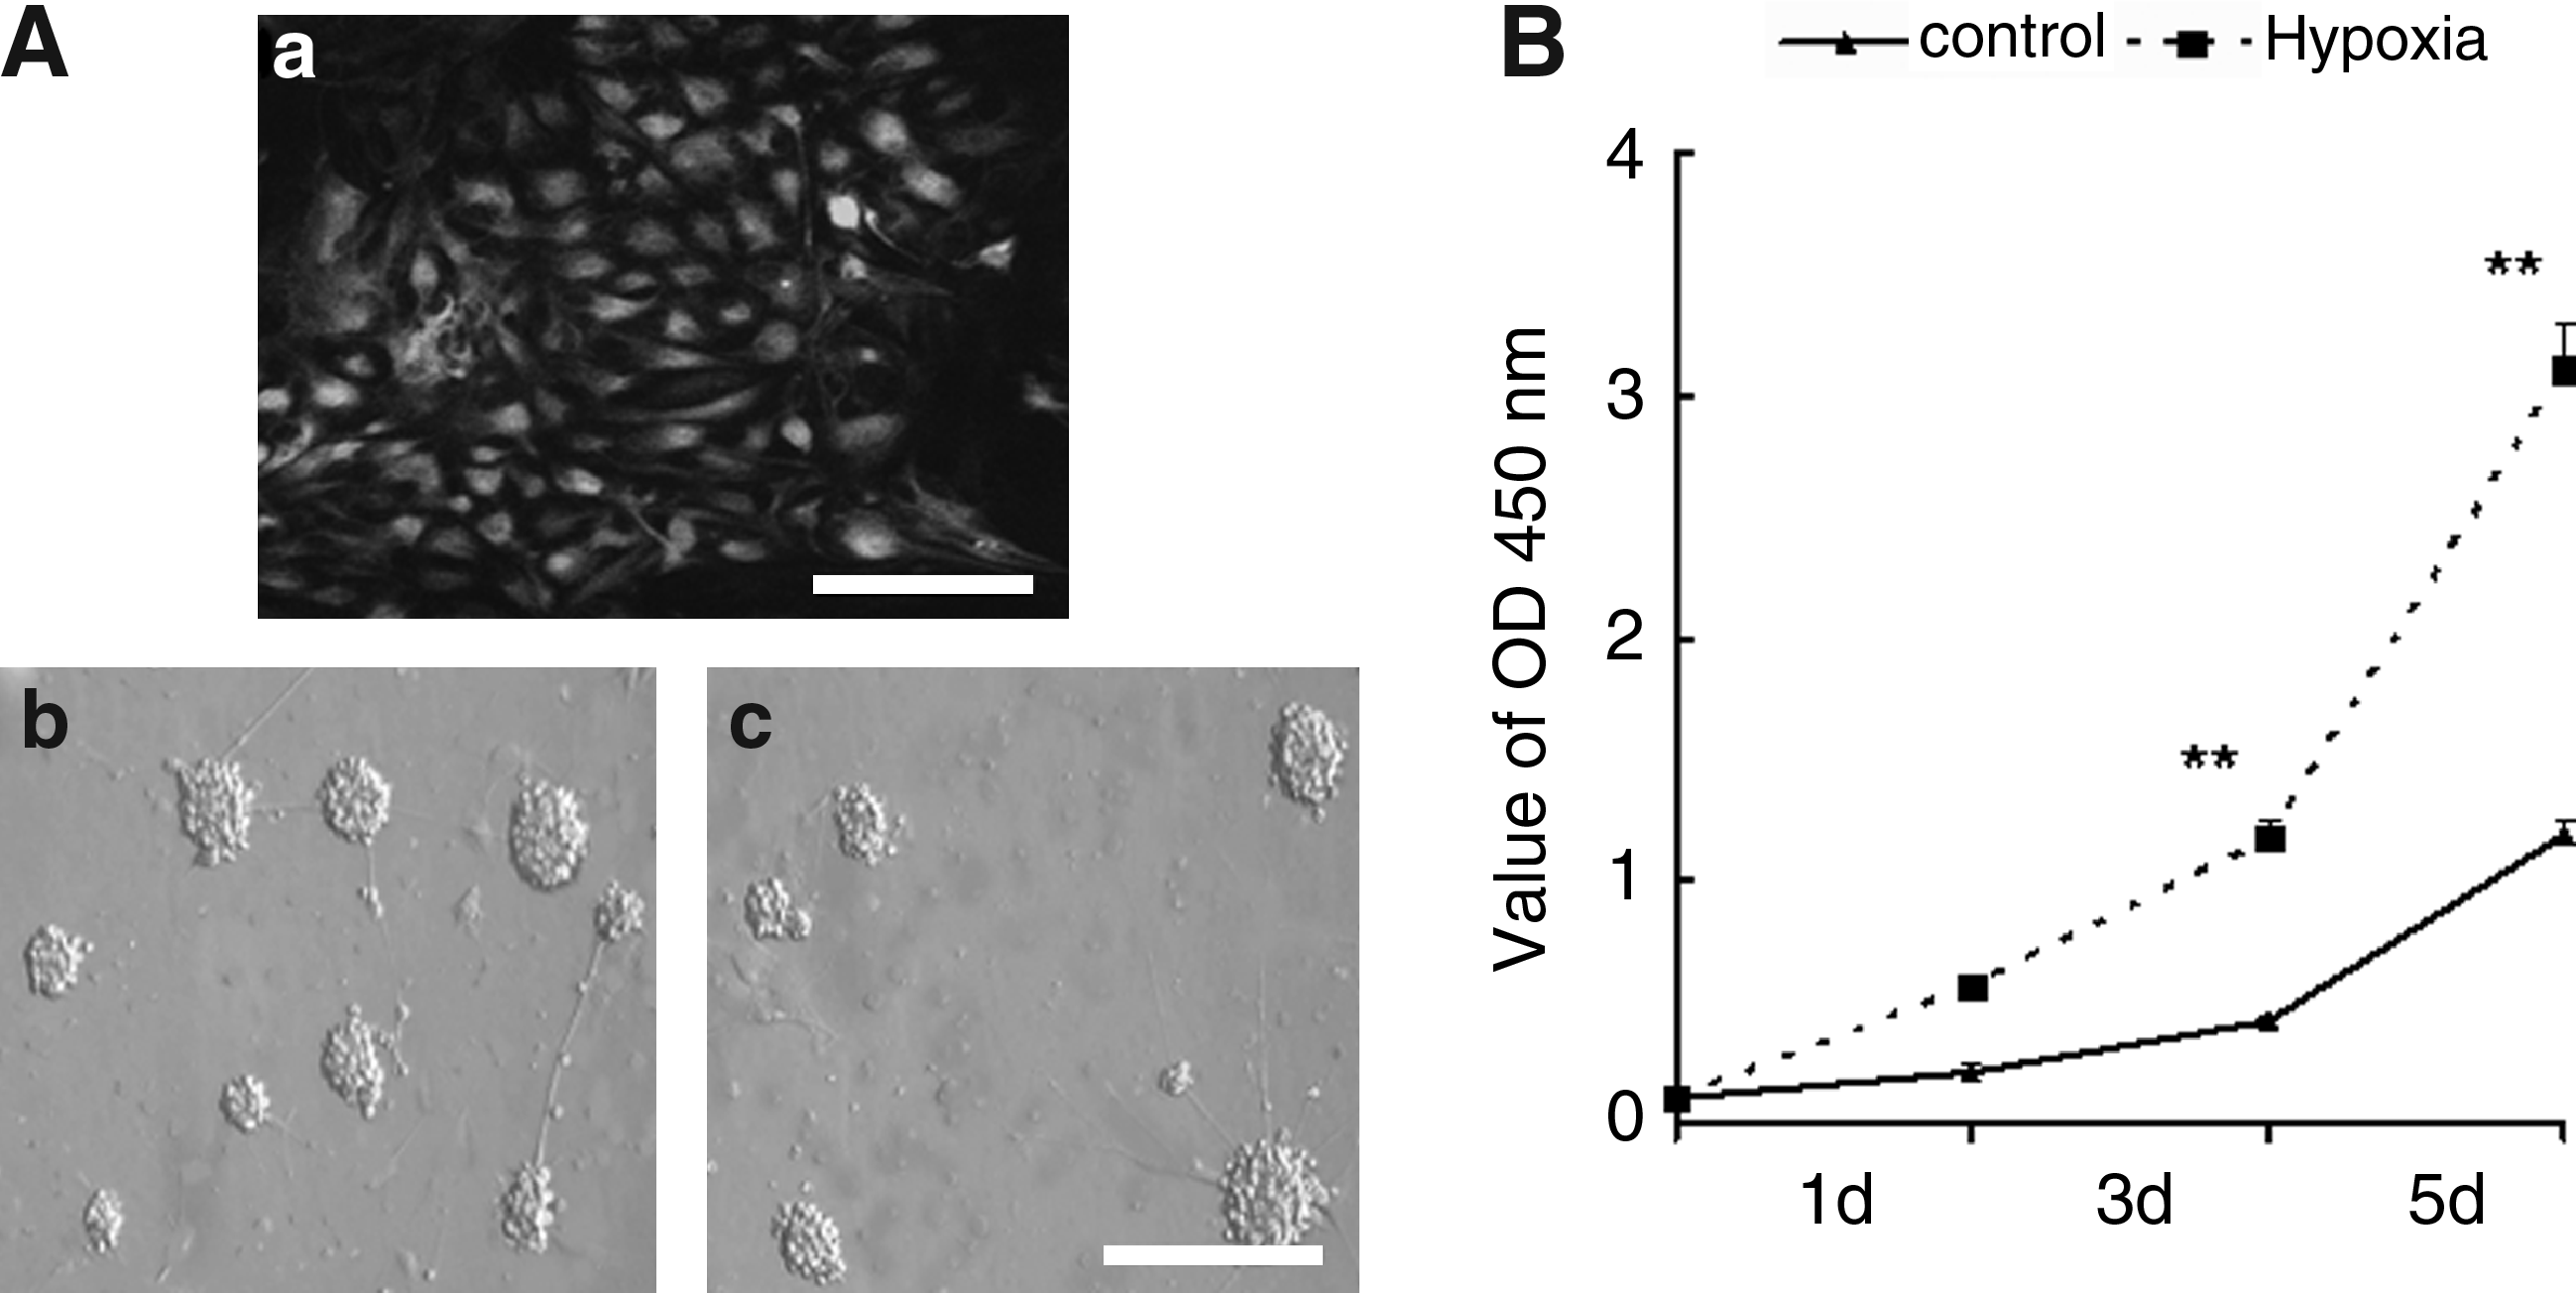
Effect of low oxygen on the growth of neural stem cells. (
Properties of neural progenitor cells expanded under low oxygen in vitro
In general, neural stem cells derived from embryonic brain grow as neurospheres in vitro and have the a heterogeneous phenotype (Lillien, 1998; Reynolds et al., 1992; Suslov et al., 2002), these neurospheres can automatically and partly differentiate into neurons, oligodentrocytes, or astrocytes in growth media. The properties of NPCs cultured under low oxygen were examined by testing the expression of Nestin, GFAP, MAP2, and CNPase, which are commonly used markers for uncommitted progenitors, astrocytes, neurons, and oligodendrocytes, respectively (Fig. 2). The data shows that the expression of GFAP and Nestin do not change significantly at the protein level, but MAP2 and CNPase expression decreased significantly in NPCs under low oxygen conditions. This suggests that NPCs under low oxygen conditions maintain the ability to self-renew, whereas their ability to differentiate is inhibited.
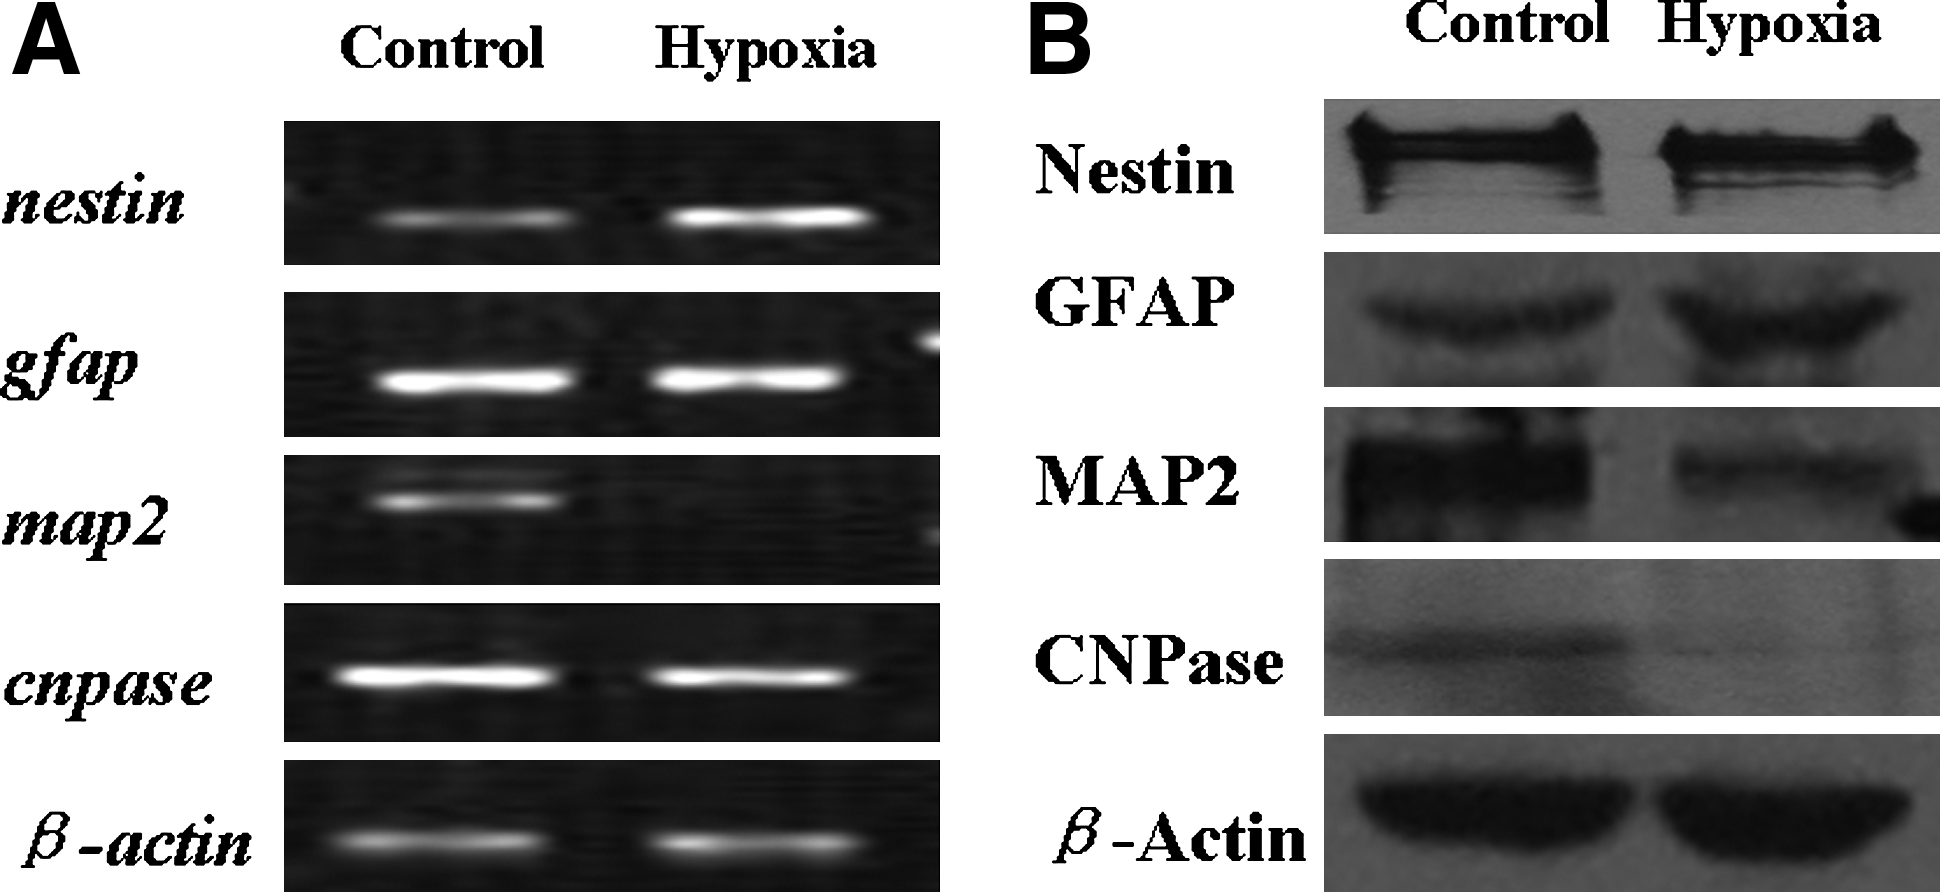
Gene expression of neural progenitor cells under low oxygen for 3 days. (
Differentially expressed genes in neural progenitor cells under low oxygen
From the data above, we can conclude that low oxygen significantly promotes the proliferation of NPCs and supports the property of self-renewal in vitro. However, the molecular mechanisms underlying this hypoxia-driven proliferation are unknown. To address this question, a cDNA microarray containing 5704 rat genes was used to characterize the gene expression pattern during hypoxia-driven proliferation of NPCs. NPCs were cultured under either normoxia or hypoxia for 24 h or 72 h, and the isolated RNA was subjected to cDNA microarray analysis. Of the 5704 genes examined, 49 were downregulated less than 0.5-fold and 22 were upregulated more than twofold at 24 h. At 72 h, 60 genes were upregulated and 11 were downregulated. The total number of differentially expressed genes was 71 at 24 h (Fig. 3A) and 71 at 72 h (Fig. 3B). Thus, the percentage of changed genes at each time point was approximately 1.24%; the majority of differentially expressed genes were downregulated at 24 h and upregulated at 72 h. A selection of upregulated genes from the microarray data is shown in Table 2. This gene expression pattern indicates that although the expression of most genes does not change under conditions of hypoxia, NPCs are able to adapt quickly to low oxygen.
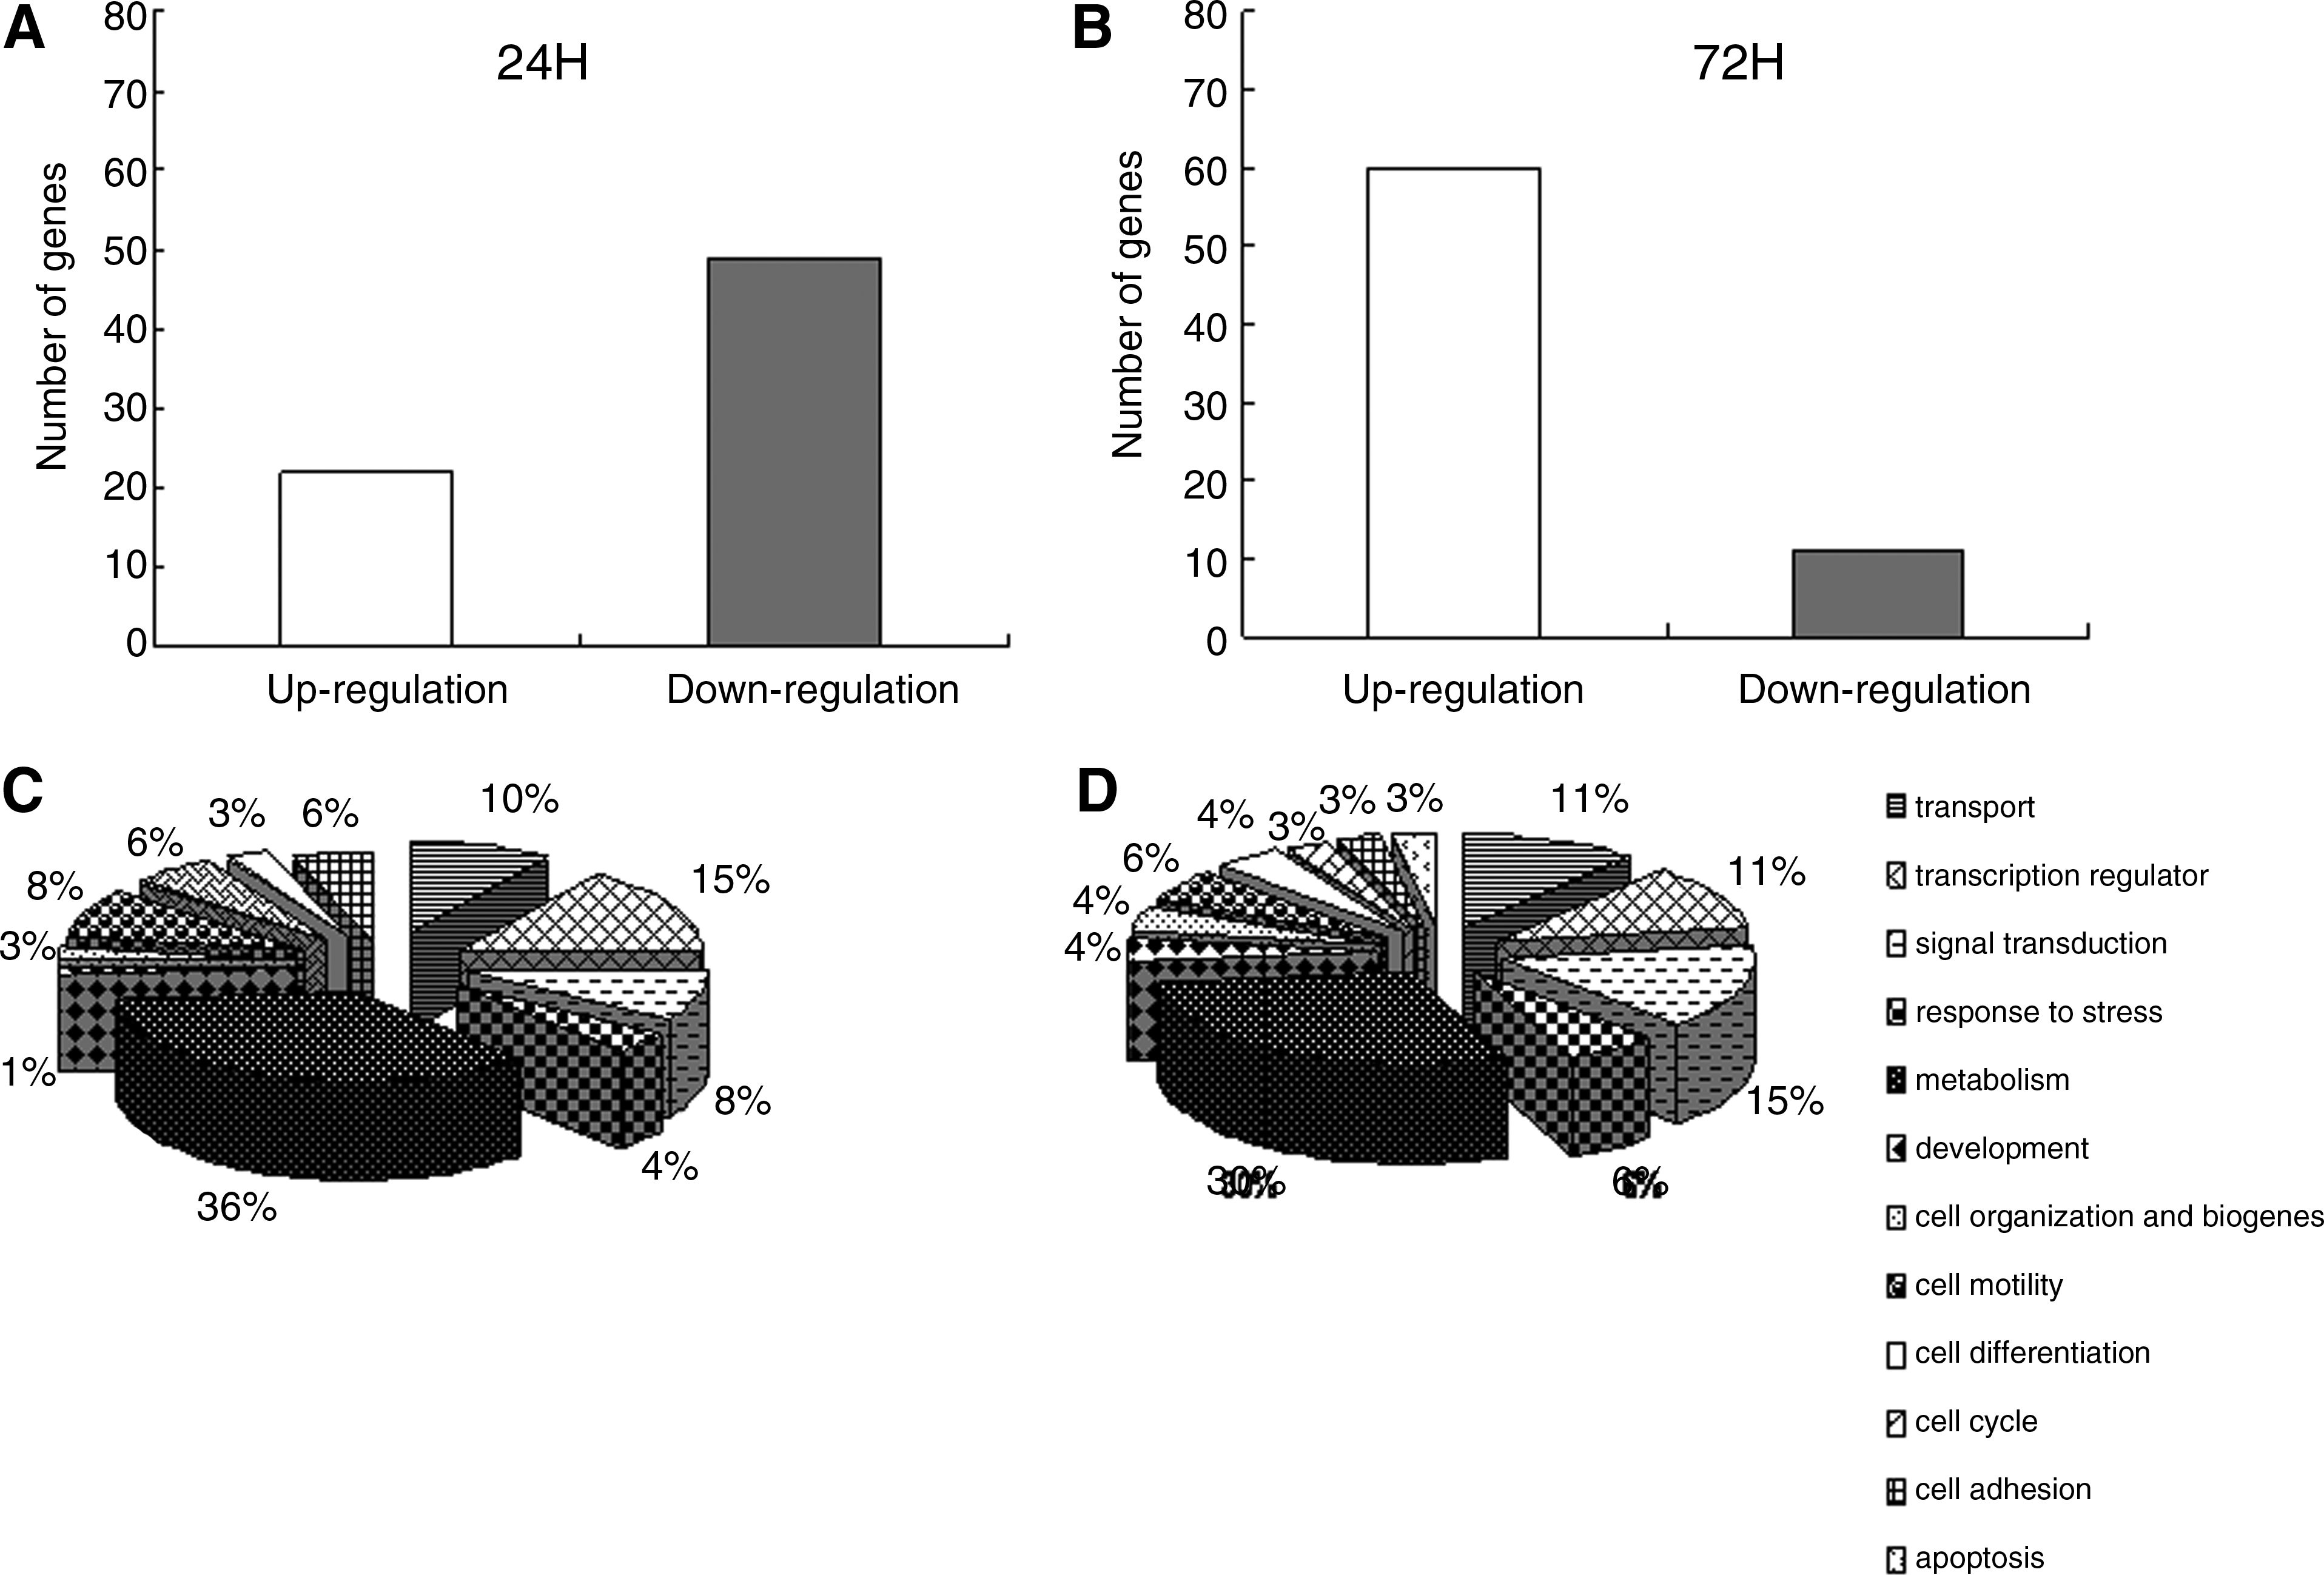
The number of differentially expressed genes and their functional classification. (
To understand the biological significance of these changes in gene expression, the identified genes were sorted in alphabetical order and categorized into one or more of 12 functional categories based on the Gene database (Fig. 3C and D). Among the 71 differentially expressed genes identified at 24 h, the greatest number were involved in glycolysis and metabolism (36%), followed by transcriptional regulation (15%) and cell organization and biogenesis (10%) (Fig. 3C). These functional categories change in the differentially expressed genes at 72 h (Fig. 3D) are similar to those at 24 h (Fig. 3C). These data suggest that NPCs have specialized metabolic adaptations that allow them to adapt to hypoxia and maintain their self renewal properties.
Confirmation of selected genes by RT-PCR
It has been reported that hypoxia inducible factor-1 (HIF-1) is a key transcription factor involved in the response of NPCs to hypoxic conditions (Zhao et al., 2008). To further confirm the differentially expressed genes identified by microarray, RT-PCR was used to test selected genes involved in regulating glucose metabolism, specifically enolase1 (eno1), lactate dehydrogenase A (ldha), triosephosphate isomerase (tpi1), phosphoglycerate kinase 1 (pgk1), and glyceraldehyde-3-phosphate-dehydrogenase (gapdh). Among the 142 differentially expressed genes, we identified seven known HIF-1 target genes (ldha, aldoa, eno1, gapdh, tpi1, pgk1, and bnip3) (Table 2), which were mostly upregulated at both time points. Some genes upregulated under hypoxia are involved in cell proliferation and survival, including dnaja2, ccnb1, tgfβ2, ccng1, and rgs7. Figure 4 shows RT-PCR confirmation of gene expression of 10 genes (hif1, bnip3, pk1, enol, hsp70, ldha, tpi1, pgk1, tgfβ2, and gapdh). The expression of bnip3, PK, eno1, hsp70, ldha, tpi1, and pgk1 in NPCs under hypoxia did increase compared to normaxia; however, the expression of hif1, tgfβ2, and gapdh did not show clear change in the gel. The identities of most differentially expressed genes were consistent with the microarray results. These changes in gene expression under low oxygen conditions represent a mild metabolic adaptation and an enhanced proliferative state of NPCs.
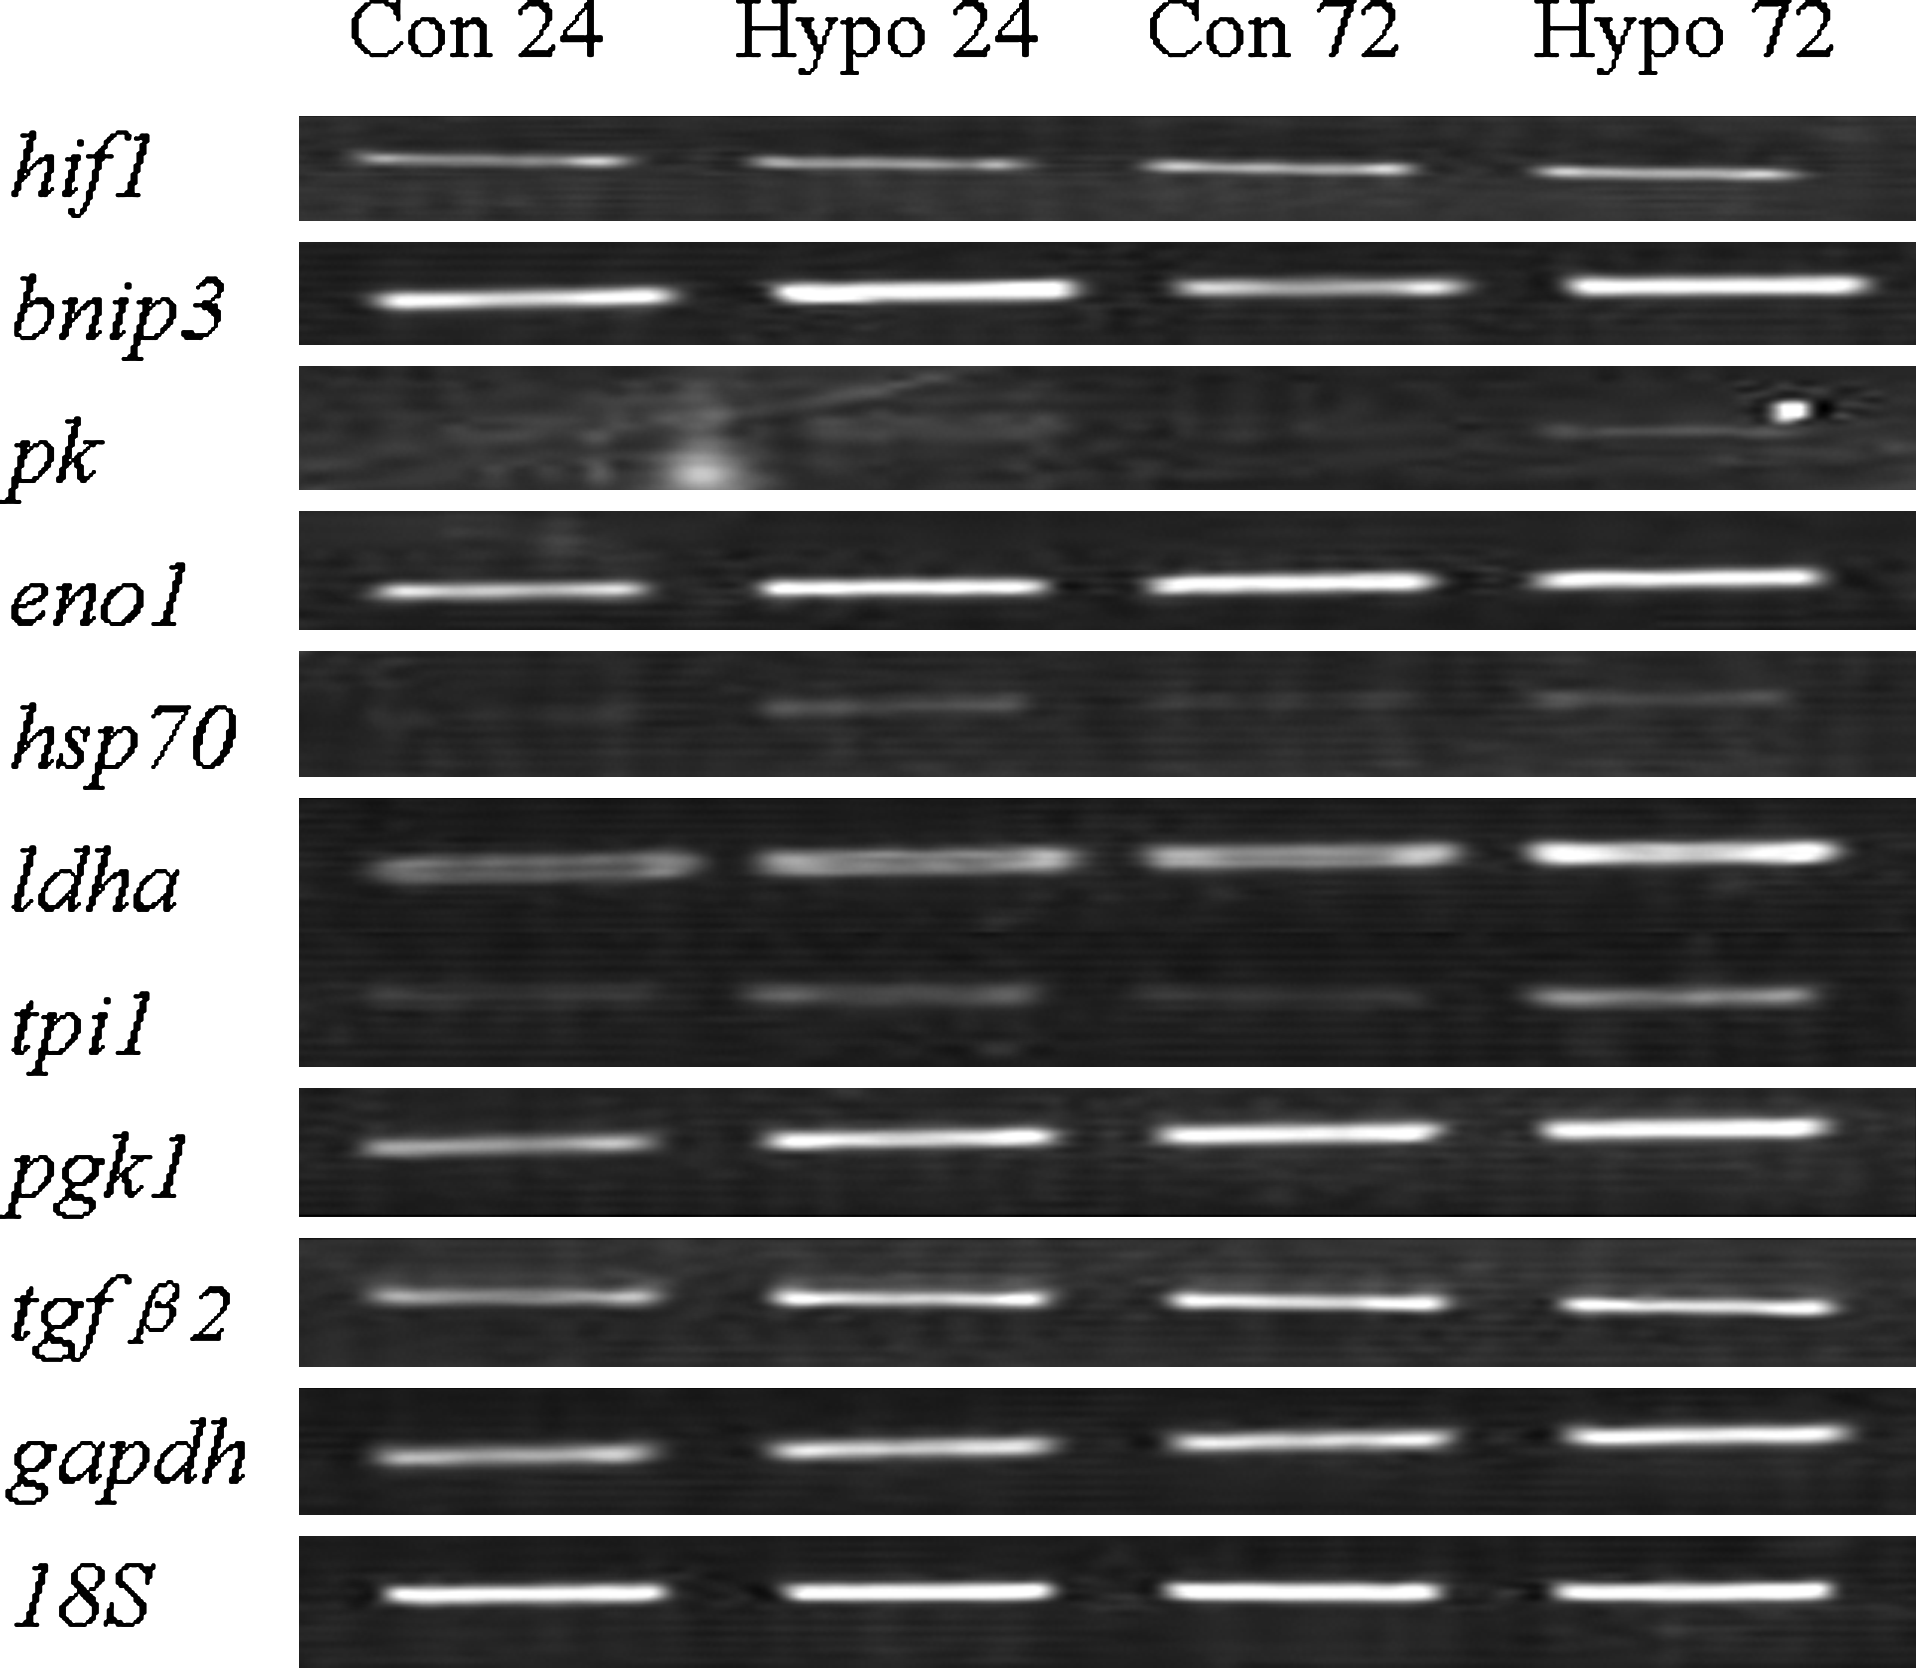
Confirmation of the selected differentially expressed genes by RT-PCR. The expression of bnip3, PK, eno1, hsp70, ldha, tpi1, pgk1, and tgfβ2 in NPCs under hypoxia were examined by RT-PCR at both 24 h and 72 h. The expression levels of the following genes were consistent with microarray results: bnip3, PK, eno1, hsp70; tpi1, ldha, pgk1; while the expression of hif1, tgfβ2, gapdh did not show clear change in the gel. Abbreviation: PK, pyruvate kinase; eno1, enolase-1; hsp70, heat-shock protein 70; tpi1, triosephosphate isomerase1; ldha, lactate dehydrogenase A; pgk1, phosphoglycerate kinase 1; tgfβ2, transforming growth factor β2.
Effect of low oxygen on metabolic products (pyruvate, lactic acid, and pH) in the medium of NPCs
The above data suggests that NPCs under low oxygen conditions undergo metabolic adaptations, as demonstrated by the upregulated expression of genes encoding glycolysis-related enzymes. To adapt to periods of low oxygen, cells undergo metabolic changes in terms of energy production (John et al., 2007). We next assayed the metabolic products of NPCs under low oxygen conditions. We found that glucose content in the media of NPCs did not change under either normoxia (18.50 ± 0.25 and 18.50 ± 0.63 mmol/L) or hypoxia (18.43 ± 0.45 and 18.70 ± 0.45 mmol/L) at the first or third day, but decreased significantly at the fifth day under hypoxia (14.77 ± 0.78 mmol/L) compared with normoxia (17.60 ± 0.44 mmol/L). The concentration of pyruvate in the medium decreased under hypoxia with time but is significantly higher than the concentration obtained under normoxic conditions (Table 3). This suggests that NPCs cultured under low oxygen primarily utilize glucose by anaerobic glycolysis to produce energy for maintaining cell growth and survival. Simultaneously, the lactic acid concentration in the medium increased (Table 3) and as a result, the pH value in the medium decreased significantly by the third day and continued to do so by the fifth day of culture in the NPCs under hypoxia compared with normoxia. Therefore, NPCs under hypoxia may utilize more glucose and produce more pyruvate than those under normoxia, which resulted in a lower pH level in the medium.
p < 0.05 versus 1d, bp < 0.05 versus control.
N, normoxia; H, hypoxia.
Effect of low oxygen on cellular ATP
The above data demonstrate a the genetic program change and metabolic adaptation of NPCs under low oxygen. Cellular ATP levels were measured under low oxygen and normoxia conditions to investigate the effects of low oxygen on energy levels in NPCs. Cells were grown for 1, 3, and 5 days in medium under normoxia (20% O2) and hypoxia (3% O2). ATP measurements were assayed at each time point (Fig. 5A), and simultaneously the cell survival was examined using the CCK-8 assay (Fig. 5B). The quantity of ATP in the medium gradually increased with the time for NPCs under normoxia, whereas ATP levels were maintained at the same level at the first and third days, declining at the fifth day under hypoxia compared to normoxia (Fig. 5A).
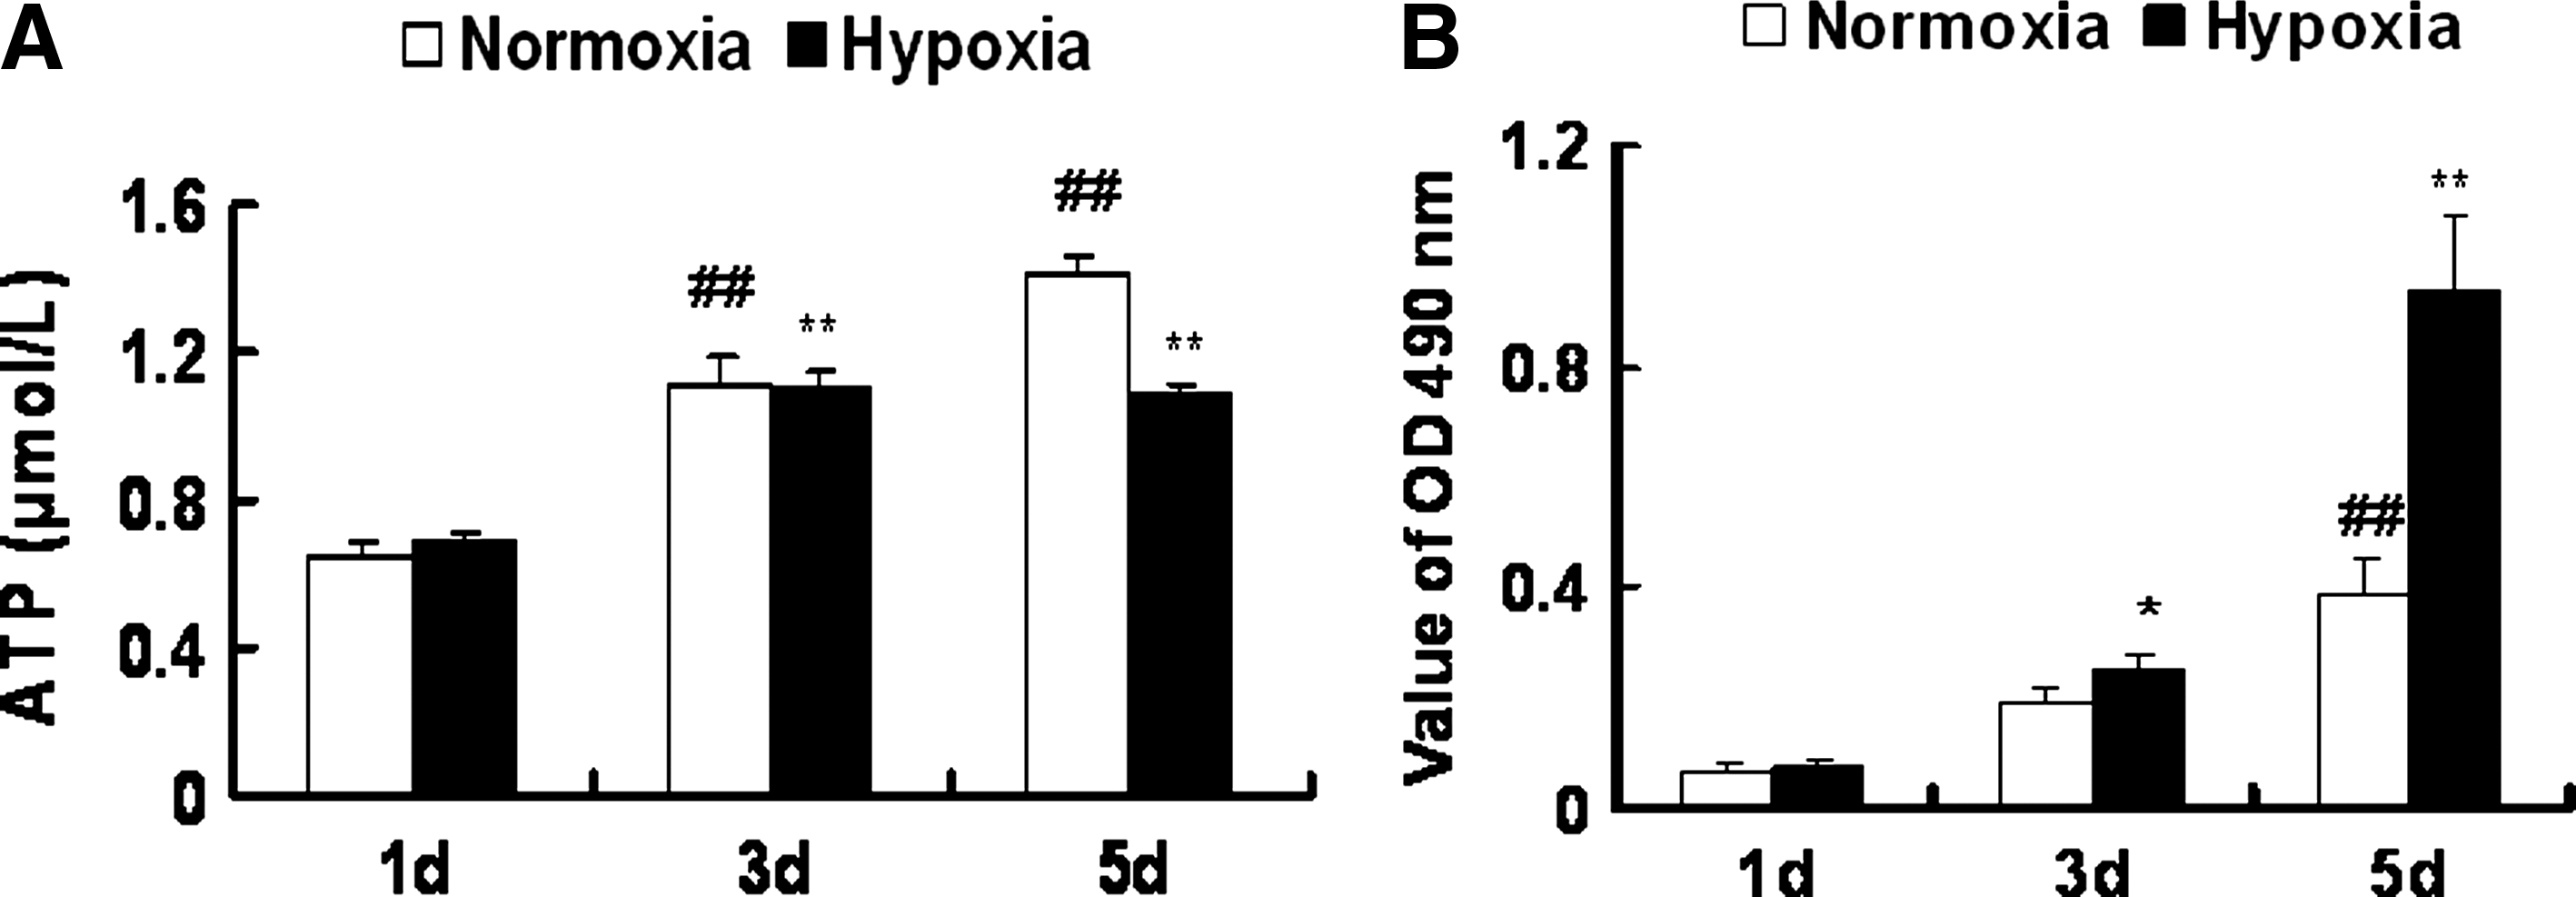
Effects of low oxygen on cellular ATP levels in NPCs. Cells were grown for 1, 3, or 5 days in medium under normoxia (20% O2) or hypoxia (3% O2). ATP value and cell survival measurements were performed at each time point. (
Discussion
NPCs have multipotent differentiation potential and are thought to be a promising therapeutic for neurodegenerative diseases and brain injury (Storch and Schwarz, 2002). Transplantation of stem cells by allograft involves exposure of these cells to hypoxic conditions. However, mechanisms of hypoxic adaptation and resistance are not completely understood. This study examined for the first time the gene expression profile of NPCs in vitro under low oxygen (3%) and the corresponding metabolic changes involved to determine how these cells respond to such an environment. The results demonstrate that NPCs adapt to low oxygen by switching their metabolism to anaerobic glycolysis, thereby maintaining their survival and growth under these conditions. These genetic and metabolic changes under low oxygen might provide new clues important for evaluation of NPCs as potential cellular therapeutics in vivo.
Hypoxia is not only a physiological regulator but also a pathological condition involved in various diseases. Recent studies have demonstrated that low oxygen can regulate the proliferation and differentiation of stem cells both in vivo and in vitro. In particular, mild hypoxia might become a useful tool for the expansion of neural stem cell in vitro (Zhu et al., 2005). Here, we analyze hypoxia-driven proliferation by neural stem cells to identify functionally coordinated alterations in gene expression. The percentage of affected genes under 3% oxygen at 24 or 72 h is only 1.24%. The majority of differentially expressed genes were downregulated at 24 h and upregulated at 72 h. Consistent with the observation that DNA replication is inhibited in the cell in early stages of hypoxia (Taylor and Pouyssegur, 2007), our data at 24 h showed that 22 genes were upregulated and 49 genes were downregulated. In addition, hypoxia is a potent modulator of gene expression, influencing the expression of approximately 1.0% of genes in the genome (Ratcliffe et al., 1998; Semenza, 2003).
It is well documented that HIF-1 is a key regulator in response to hypoxia (Seagroves et al., 2001; Zhao et al., 2008). However, we found only a few differentially regulated genes that are targeted by HIF-1. One possible explanation is that HIF-1, as a transcription factor, regulates its targeted genes over time; therefore, our ability to detect differentially regulated HIF-1 target genes at one time point is limited. Another possible explanation is that hypoxia targets a complex range of physiological processes during the proliferation of NPCs. These changed genes could be regulated directly or indirectly by HIF-1. In this study, we only analyzed changes in gene expression induced by 3% oxygen at two time points (24 and 72 h). Further studies should be conducted to analyze gene expression prior to 24 h during the proliferation of NPCs under hypoxia.
Neural stem cells possess the potential for proliferation, differentiation, self-renewal, and quiescence both in vitro and in vivo. Both of these states is likely to be associated with a specific metabolic phenotype, characterized by the production of both energy and special substrates necessary for cells to function in that particular situation (Crouch et al., 2003). Hypoxic cells can rapidly alter their metabolism from aerobic to anaerobic production of energy (Seagroves et al., 2001). This switch is associated with a large increase in the expression of glucose transporters and glycolytic enzymes (John et al., 2007). In this gene expression analysis, we found that the majority of genes differentially expressed under hypoxia are related to metabolism. Consistently, aerobic oxidative metabolism was inhibited, and anaerobic glucose metabolism increased. Accordingly, the expression of metabolic enzyme genes related to anaerobic glycolysis, including ldha, pgk1, and gapdh, increased (Fig. 4). As the duration of hypoxia increased, the glucose content of the culture medium decreased, whereas the lactic acid concentration increased compared to normoxia. Therefore, we concluded that NPCs exposed to limited oxygen preferentially use a cytoplasmic, glycolytic pathway that leads to an increased acid load, in part due to the high level of lactic acid production (Zoran, 2009).
The relationship between metabolic change and proliferation of NPCs is not well understood. Several links between cell cycle control and specific metabolic pathways have been identified (John et al., 2007). Almost anoxic conditions induce a switch to anaerobic metabolism, but relatively higher oxygen concentrations, between 1 and 5% O2,, induce the synthesis of highly energetic phosphates due to a specific isoform of cytochrome oxidase (Papandreou et al., 2005). Glucose plays a central role as an energy source in cellular metabolism; it is the primary source of ATP for cells utilizing either oxidative phosphorylation or anaerobic glycolysis (Seagroves et al., 2001). Previous studies have indicated that glucose carbon redistribution between major metabolic pathways plays a critical role in cell proliferation. Proliferating cells are highly dependent on de novo synthesis of purines and pyrimidines, as well as ribose for nucleic acid synthesis, which is produced from glucose (Zoran, 2009). These processes in turn become highly dependent on the availability of glucose carbons and increased activity of related enzymes (John et al., 2007). Here, we also found that the glucose content was markedly decreased at the fifth day under hypoxic conditions, which is consistent with the above results. Thus, this “moderate” hypoxia is not typically toxic or growth inhibitory to cells when sufficient nutrients and glucose are present. As long as glucose is in excess, glycolysis is capable of supplying enough energy to the cells, although glycolytic ATP production declined at the fifth day.
In this study, we found that lactic acid secretion increased and the pH decreased in the media of NPCs under hypoxia compared with the normoxia. This mildly decreased pH might help promote the proliferation of NPCs exposed early stages of hypoxia. However, it has been reported that most cells cease proliferation or undergo cell death with prolonged exposure to hypoxia (<1% oxygen) and acidic environments (John et al., 2007). Therefore, the ultimate effects of low oxygen on cell proliferation depend on two factors: oxygen level and exposure time.
Hypoxia targets a complex range of physiological processes during the proliferation of NPCs. Gene expression patterns under low oxygen demonstrate that different molecular mechanisms regulate the properties of NPCs. Glucose, the substrate of anaerobic glycolysis, plays a central role as an energy source in cellular metabolism under hypoxia. These findings have implications for the possible use of these cells as therapeutics to treat brain diseases.
Footnotes
Acknowledgments
We thank Prof. Zhang Tianming for his enlightening views. This work was supported by a grant from the National Basic Research Program of China (Nos. 2006CB504100 and 2011CB910802) and a grant from the National Nature and Sciences Foundation of China (Nos. 90919052 and 308311605).
Author Disclosure Statement
The authors declare that no financial conflict of interest exists.