
Abstract
Abstract
Induced pluripotent stem cells (iPSCs) generated by forced expression of four transcription factors offer promises for regenerative and therapeutic uses in human diseases. However, it is necessary to overcome the risk of tumorigenicity caused by the use of potent oncogenes and the use of randomly integrating vectors before the iPSC technology can be applied to human medicine. Stem cells and cancer cells share many features in common, implying that there are similar underlying mechanisms in their development. Small molecules have been used to induce cell reprogramming for lineage trans-differentiation and for maintaining pluripotency of stem cells. In this study, we investigated the possibility of replacing all reprogramming viral factors with small molecules. To this end, we evaluated the effects of carcinogens at nongenotoxic levels on somatic cells. We identified 16 candidate chemicals through biology-oriented in silico high-throughput screening with commercially available inventories from Sigma-Aldrich for cancer research, and established a reprogramming protocol of 16-day treatment followed by 5 days of recovery. This protocol was applied to B6/129 mouse embryonic fibroblasts (MEFs) at passage 3. From recovery day 2, colonies appeared at an efficiency of 0.02%. These colonies were positive for both alkaline phosphatase and surface specific embryonic antigen-1 (SSEA-1) at a comparable level to those of mouse embryonic stem cells (ESCs). Global gene expression analysis with a 38K gene MEEBO microarray revealed that the colonies had 564 (1.5%) differentially expressed genes compared to MEFs at day 0 of treatment, and these genes were enriched in “neuromuscular differentiation.” Moreover, 122 differentially expressed genes in the colonies were ESC-enriched, including downregulated somatic markers and upregulated stem cell markers. In conclusion, combined chemical treatment of MEFs herein might have caused these cells to transverse to an intermediate state within the mesodermal lineages.
Introduction
However, current technology for the generation of iPSCs is not optimal for clinical application. For example, aberrant silencing of imprinted gene cluster has been reported in iPSCs (Liu et al., 2010; Stadtfeld et al., 2010). Furthermore, the induction efficiency of iPSCs is as low as 0.0001%, and the induction process takes up to 5 weeks (Amabile and Meissner, 2009). Additionally, mouse offspring produced by germline-competent iPSCs developed tumors due to the reactivation of the exogenous cMyc gene (Okita et al., 2007). Subsequent studies have improved the efficiency dramatically by modifying the original method. Relatively safer methods such as a nonintegrating vector system (Okita et al., 2008) or recombinant proteins increased the complexity of the process and suffer from extremely low efficiency (Kim et al., 2009b; Zhou et al., 2009).
A major area of iPSC research is to identify small molecules that can eliminate the need for viruses or recombinant proteins. For instance, valproic acid (VPA), an HDAC inhibitor, has been used to replace the Sox2 virus (Huangfu et al., 2008). A soluble Wnt protein also enhanced the reprogramming efficiency in the absence of cMyc virus (Marson et al., 2008). A combination of small molecules, such as BIX-01294 and BayK8644, a G9a histone methyltransferase inhibitor and a L-channel calcium agonist, respectively, enabled reprogramming of MEFs with only Oct4 and Klf4 viral cotreatment (Shi et al., 2008). Furthermore, Klf4 was successfully replaced by kenpaullone (Lyssiotis et al., 2009), a small molecule identified by high throughput screening (HTS). These achievements provide mechanistic insights into the reprogramming process. However, none of the small molecules can replace the Oct4 virus. Moreover, any combination of small molecules with Oct4 virus alone was not sufficient to induce pluripotency from terminally differentiated somatic cells.
Stem cells and cancer cells share many common features, such as self-renewal and differentiation. Additionally, important signaling pathways in stem cells, such as Wnt, sonic hedgehog, and Notch, are also active in solid tumors and leukemia (Pardal et al., 2003). In human testicular germ cell tumor (TGCT) or embryonal carcinoma cells, genes associated with “stemness” such as NANOG, OCT4, KIT, and several members of the DPPA family are highly expressed (Sperger et al., 2003). Furthermore, it was revealed that up to 50% of genes expressed in TGCT precursors overlapped with those of human ESC (Almstrup et al., 2004). The mechanism of pluripotent gene expression in TGCT is yet to be clarified. It is well known, however, that small molecules are attributed as one of the major contributors of cancer initiation and/or cancer proliferation. Therefore, chemical carcinogens at nongenotoxic levels might have a direct impact on the reprogramming process.
In this study, we investigated the possibility of completely replacing reprogramming factors with small molecules. To this end, we evaluated the effects of compounds from cancer research inventories at nongenotoxic levels on somatic cellular reprogramming, and we obtained cells reprogrammed to an intermediate state of differentiation.
Materials and Methods
High-throughput screening of chemical candidates
Unless stated otherwise, all chemicals were purchased from Sigma-Aldrich (St. Louis, MO, USA).
Chemical candidates from the Sigma-Aldrich chemical inventory for cancer research were selected by in silico HTS. The inventory contains four different categories of chemicals including 46 carcinogens, 150 antitumor agents, 118 chemopreventive agents, and 112 antineoplastic agents. In silico HTS was performed with these chemicals by using PubMatrix based on cocitation analysis (Becker et al., 2003). The first round of HTS was performed with biological queries of “global gene expression” and “embryonal carcinoma” or “dedifferentiation.” The second round of HTS was carried out with “Oct4,” “Sox2,” “Klf4,” “Wnt signaling,” or “Notch signaling.” Chemicals cocited with these pluripotency-related queries in the same literature were identified. To eliminate possible false positive findings, we performed literature mining and selected true candidates that satisfied all biological/pluripotency-related queries without false positive findings.
Cytotoxicity evaluation of chemical candidates
Chemical candidates were evaluated for physicochemical property such as solubility and half-life. A 3-day cytotoxicity study was conducted using the reference doses (RfD) of each selected candidate on 1.5 × 10⁵ CD1 MEFs at passage 3. Briefly, CD1 MEFs were seeded in six-well plates (Becton Dickinson Labware, Franklin Lakes, NJ, USA), and were exposed to individual chemicals on a daily basis in MEF medium. MEF medium was prepared in DMEM medium (Invitrogen, Carlsbad, CA, USA) supplemented with 15% fetal bovine serum (FBS) (Invitrogen), 100 U/mL penicillin, and 100 μg/mL Streptomycin (Invitrogen). After the 3-day treatment, cell proliferation was determined by the colorimetric assay. Briefly, working solution of 3-(4,5-dimethylthiazol-2-yl)-2,5-diphenyltetrazolium bromide (MTT, 0.5 mg/mL) (Calbiochem, San Diego, CA, USA) was added to each well and incubated at 37°C for 2 h. At the end of incubation period, the medium was removed and the converted formazan was dissolved by adding 1 mL of acidic isopropanol (0.04 M HCl in isopropanol). Absorbance of the converted dye was measured at wavelength of 570 nm with background subtraction at 650 nm in microplate reader (BioTek instruments, Winooski, VT, USA). When the cell number of a treatment was less than 80% of control, the chemical was considered cytotoxic and a dose range-finding (DRF) study was carried out with four serially diluted dose levels from RfD (dilution factor = 4) to determine the no observed adverse effect level (NOAEL).
Regulatory effects of chemical candidates on pluripotent gene expression
The potential of an individual candidate to activate pluripotent genes was evaluated by gene expression analysis. Briefly, an individual chemical in MEF medium at NOAEL was given daily for 3 days to 1.5 × 10⁵ B6/129 MEFs at passage 2. Total RNA was extracted by using TRIzol (Invitrogen) with DNase I (Invitrogen) treatment to remove any possible genomic DNA contamination. RNA was purified by using RNeasy mini kit (Qiagen, Valencia, CA, USA), and cDNA was generated by Superscript III reverse transcriptase (Invitrogen). Expression levels of Sox2, Klf4, and cMyc were measured by quantitative real-time PCR (qPCR) with ABI 7500 Fast Real-Time PCR System (Applied Biosystems Inc., Foster City, CA, USA). Primer sets for qPCR were as follows: Klf4 (forward) 5′-CCA GAT GCA GTC ACA AGT CCC-3′, (reverse) 5′-ACG ACC TTC TTC CCC TCT TTG-3′, and cMyc (forward) 5′-CTG TTT GAA GGC TGG ATT TCC T-3′, (reverse) 5′-GTC GAG GTC ATA GTT CCT GTT GG-3′. Primer sets of Sox2 and Gapdh were taken from a previous study (Kim et al., 2009a). For qPCR, a 20-μL reaction mixture (1 × SYBR Green PCR master mix; Applied Biosystems Inc.) containing 5 ng of cDNA and 0.3 μM of each primer was subjected to an initial denaturation at 95°C for 10 min, followed by 40 cycles of denaturation at 95°C for 15 sec and annealing/extension at 60°C for 1 min. Data analysis was performed with ABI prism SDS software (Applied Biosystems Inc.), and the relative expression levels of the target genes to that of Gapdh were calculated by using the comparative CT method according to the manufacturer's instruction.
Reprogramming protocol optimization
Based on the NOAEL of each candidate established, chemical cocktails were formulated at four descending dose levels from NOAEL with fourfold interval, and the 3-day cytotoxicity study was performed to find the maximum tolerated dose (MTD) of the cocktail against cell proliferation in MEF medium. MTD was defined as the highest dose level of treatment at which cells can proliferate at least twice compared to the initial cell concentration before treatment.
Treatment period was optimized on the basis of colony formation efficiency. To 1.5 × 10⁵ B6/129 MEFs at passage 2, the chemical cocktail treatment at MTD was carried out for 4, 8, 12, 16, and 28 days in mouse ESC medium. ESC medium was prepared in DMEM medium (Invitrogen) supplemented with 15% FBS (Invitrogen), 100 U/mL penicillin and 100 μg/mL streptomycin (Invitrogen), 1000 U/mL Leukemia Inhibitory Factor (Millipore, Billerica, MA, USA), 1% (v/v) nonessential amino acid (Millipore), and 1% (v/v) 2-mercaptoethanol (Millipore). At the end of the treatment, MEFs were trypsinized and transferred onto mitomycin C-treated CD1 feeder cells and allowed to recover for 5 days in ESC medium. Once the colonies were visible during recovery, they were picked up by pipette and transferred onto newly prepared feeder in a four-well plate (Becton Dickinson Labware) for further growth.
Characterization of chemically induced colonies
The chemically induced colonies were characterized by (1) marker expression, (2) microarray analysis, and (3) chimera formation. The colonies were characterized 1 week after the first colony pickup. Alkaline phosphatase (AP) activity of the colonies was measured by using Vector Red Alkaline Phosphatase Substrate Kit I (Vector Laboratories, Burlingame, CA, USA) according to the manufacturer's instructions. Surface specific embryonic antigen-1 (SSEA-1) expression from the colonies was evaluated by using mouse SSEA-1 antibody (Millipore) as described previously (Kim et al., 2009a).
On days 0 and 16 of treatment, total RNA from MEFs and the colonies was isolated and reverse transcribed to generate cDNA. R1 mouse ESCs (Wood et al., 1993) were used as an ESC control. Pluripotent marker gene expression was measured by semiquantitative RT-PCR (semi-qPCR). Primer sets of Oct4, Sox2, Nanog, and Gapdh were taken from our previous study (Kim et al., 2009a), and the primer set of Fibrillin2 as a mouse fibroblast marker was taken from PrimerBank at Harvard University (Stadtfeld et al., 2008a) and the sequences are as follows: (forward) 5′-ACG CAA ATC AAT TCA GCA GTG T-3′, (reverse) 5′-GGT TGT CCA CAG TAA GTT CCG A-3′.
Global gene expression profiles of induced MEFs at 8 and 16 days of treatment, the chemically induced colonies, and ESCs were compared to MEFs at day 0 of treatment using DNA microarray. In addition, iPSCs produced in our lab from B6/129 MEF by conventional retroviral transduction of Yamanaka factors, which have been characterized to have germ-line transmission ability, was included in this comparison. Briefly, 10 μg of each RNA and Universal Mouse Reference RNA (Stratagen, La Jolla, CA, USA) were reverse transcribed, labeled with Cy3 or Cy5 dye (GE Healthcare Life Sciences, Piscataway, NJ, USA) for dye-swap, and hybridized to a 38K Mouse Exonic Evidence Based Oligonucleotide (MEEBO) array at 42°C for 40 h. The arrays were scanned in GenePix 4000B (Molecular Devices, Union City, CA, USA) and signal extraction followed by local background subtraction were performed using GenePix Pro 6.0 (Molecular Devices). Genes were flagged as present if more than 70% of their feature pixels were more than two standard deviations (SD) above background in either Cy3 or Cy5 channel. The data were loaded in GeneSpring 6.1 (Agilent Technologies, Palo Alto, CA, USA). Lowess normalization was applied before statistical analysis, and genes that were present in at least 90% of the microarrays with raw expression values >100, and a SD of <1.4 were used for hierarchical clustering. Differentially expressed (DE) genes were identified by fold change of greater than 2.0 and p-value cutoff of 0.05 followed by Benjamin and Hochberg's false discovery rate of 0.05. Annotation analysis was performed using the Database for Annotation, Visualization and Integrated Discovery (DAVID) (http://david.abcc.ncifcrf.gov) according to the user's guide (Dennis et al., 2003).
Characterization of the colonies was followed by an embryo aggregation study to evaluate the pluripotency of the colonies. In vivo embryos at the eight-cell stage were collected from CD1 mice (Charles River Laboratories, Wilmington, MA, USA). The zona pellucidae of the embryos were removed by incubation in acid-Tyrode's solution (Invitrogen) and coincubated with the cell colonies for 3 days. If there were embryo–colony aggregates, they were transferred into synchronized CD1 female mice to generate chimeric offspring.
Results
In silico HTS
Out of the 426 compounds screened, 131 were found to meet our biological queries. From these, a second round of HTS gave rise to 37 chemicals cocited with pluripotency-related query in the same literature. After literature mining, 16 candidates that satisfied all biological/pluripotency-related queries without false positive findings were identified as follow; BIO (Calbiochem), 4-(Methylnitrosamino)-1-(3-pyridyl)-1-butanone (NNK, Toronto Research Chemicals, Canada), Forskolin (FK), (−)-Nicotine (NIC), Phorbor 12-myristate 13-acetate (PMA), Retinoic acid (RA), Troglitazone (TGZ), Cytochalasin D (CD), Etoposide (ETS), Butyric acid (BA), Trichostatin A (TSA), BIX 01294 (BIX), Chaetocin (CTC), 5-Aza-2′-deoxycytidine (AZC), N-Acetyl-L-Cysteine (NAC), and Mevinolin (LST). Mode of action and cellular targets of each candidate are summarized in Table 1. Eight candidates are known to upregulate Wnt, Notch, or MAPK signaling pathway. Five candidates have been reported to inhibit epigenetic modifying enzymes such as histone deacetylase (HDAC) or DNA methyl transferase 1 (DNMT1). One candidate is an antioxidant, and the mode of action of the other two candidates (NIC and RA) has not been elucidated. Specifically, BA is a pan HDAC inhibitor and stimulates KLF4 promoter activity in a dose- and time-dependent manner in a human colon cancer cell line (Chen et al., 2004b). TSA and AZC are very classic epigenetic modulators by inhibiting HDACs and DNMT1, respectively. Cotreatment of TSA and AZA reactivates endogenous Oct4 in Oct4-negative NIH/3T3 cell line (Hattori et al., 2004). ETS is a genotoxicant, but ETS also upregulates Notch1 expression in human prostate cancer cell line (Alimirah et al., 2007). Interestingly, expression level of ETS-induced 2.4 mRNA (EI24) is changed dramatically in the direct reprogramming process (Mikkelsen et al., 2008), implying that ETS might be a potent small molecule to replace or cooperate reprogramming factor(s). CD is a cytoskeleton-reorganizing agent, which also induces Wnt5a to antagonize the effects of transforming Wnt proteins through cell migration in a normal human breast epithelial cell line, but not in a breast cancer cell line (Jonsson et al., 1998). Together, we identified candidate compounds through our in silico HTS that have reported regulatory roles on all the pluripotent genes that we aimed to modify in the reprogramming of somatic cells.
RfD, reference dose; NOAEL, no observed adverse effect level; MTD, maximum tolerated dose.
The 3-day cytotoxicity study of individual candidates revealed that CD, ETS, BA, TSA, and CTC at RfD induced cytotoxic effects on MEFs (Fig. 1A). NOAELs of these candidates were determined by the 3-day DRF study as follows: 62.5 nM of CD, 0.7 μM of ETS, 4 μM of BA, 12.5 nM of TSA, and 7.81 nM of CTC (Fig. 1B). Interestingly, qPCR revealed regulatory effects of the candidates on the expression of Yamanaka factors in MEFs after a 3-day treatment at NOAEL. PMA, CD, ETS, and CTC upregulated Sox2. BIO, CD, ETS, BA, and TSA upregulated Klf4. BIO and CD upregulated cMyc. FK, NIC, ETS, BA, TSA, BIX, and AZC downregulated cMyc. None of the candidates, however, showed a regulatory effect on Oct4 (Table 1). Based on NOAELs of individual candidates, a chemical cocktail was formulated and applied to MEFs for 3 days. MTD of each candidate for the formulation of the chemical cocktail was summarized in Table 1.
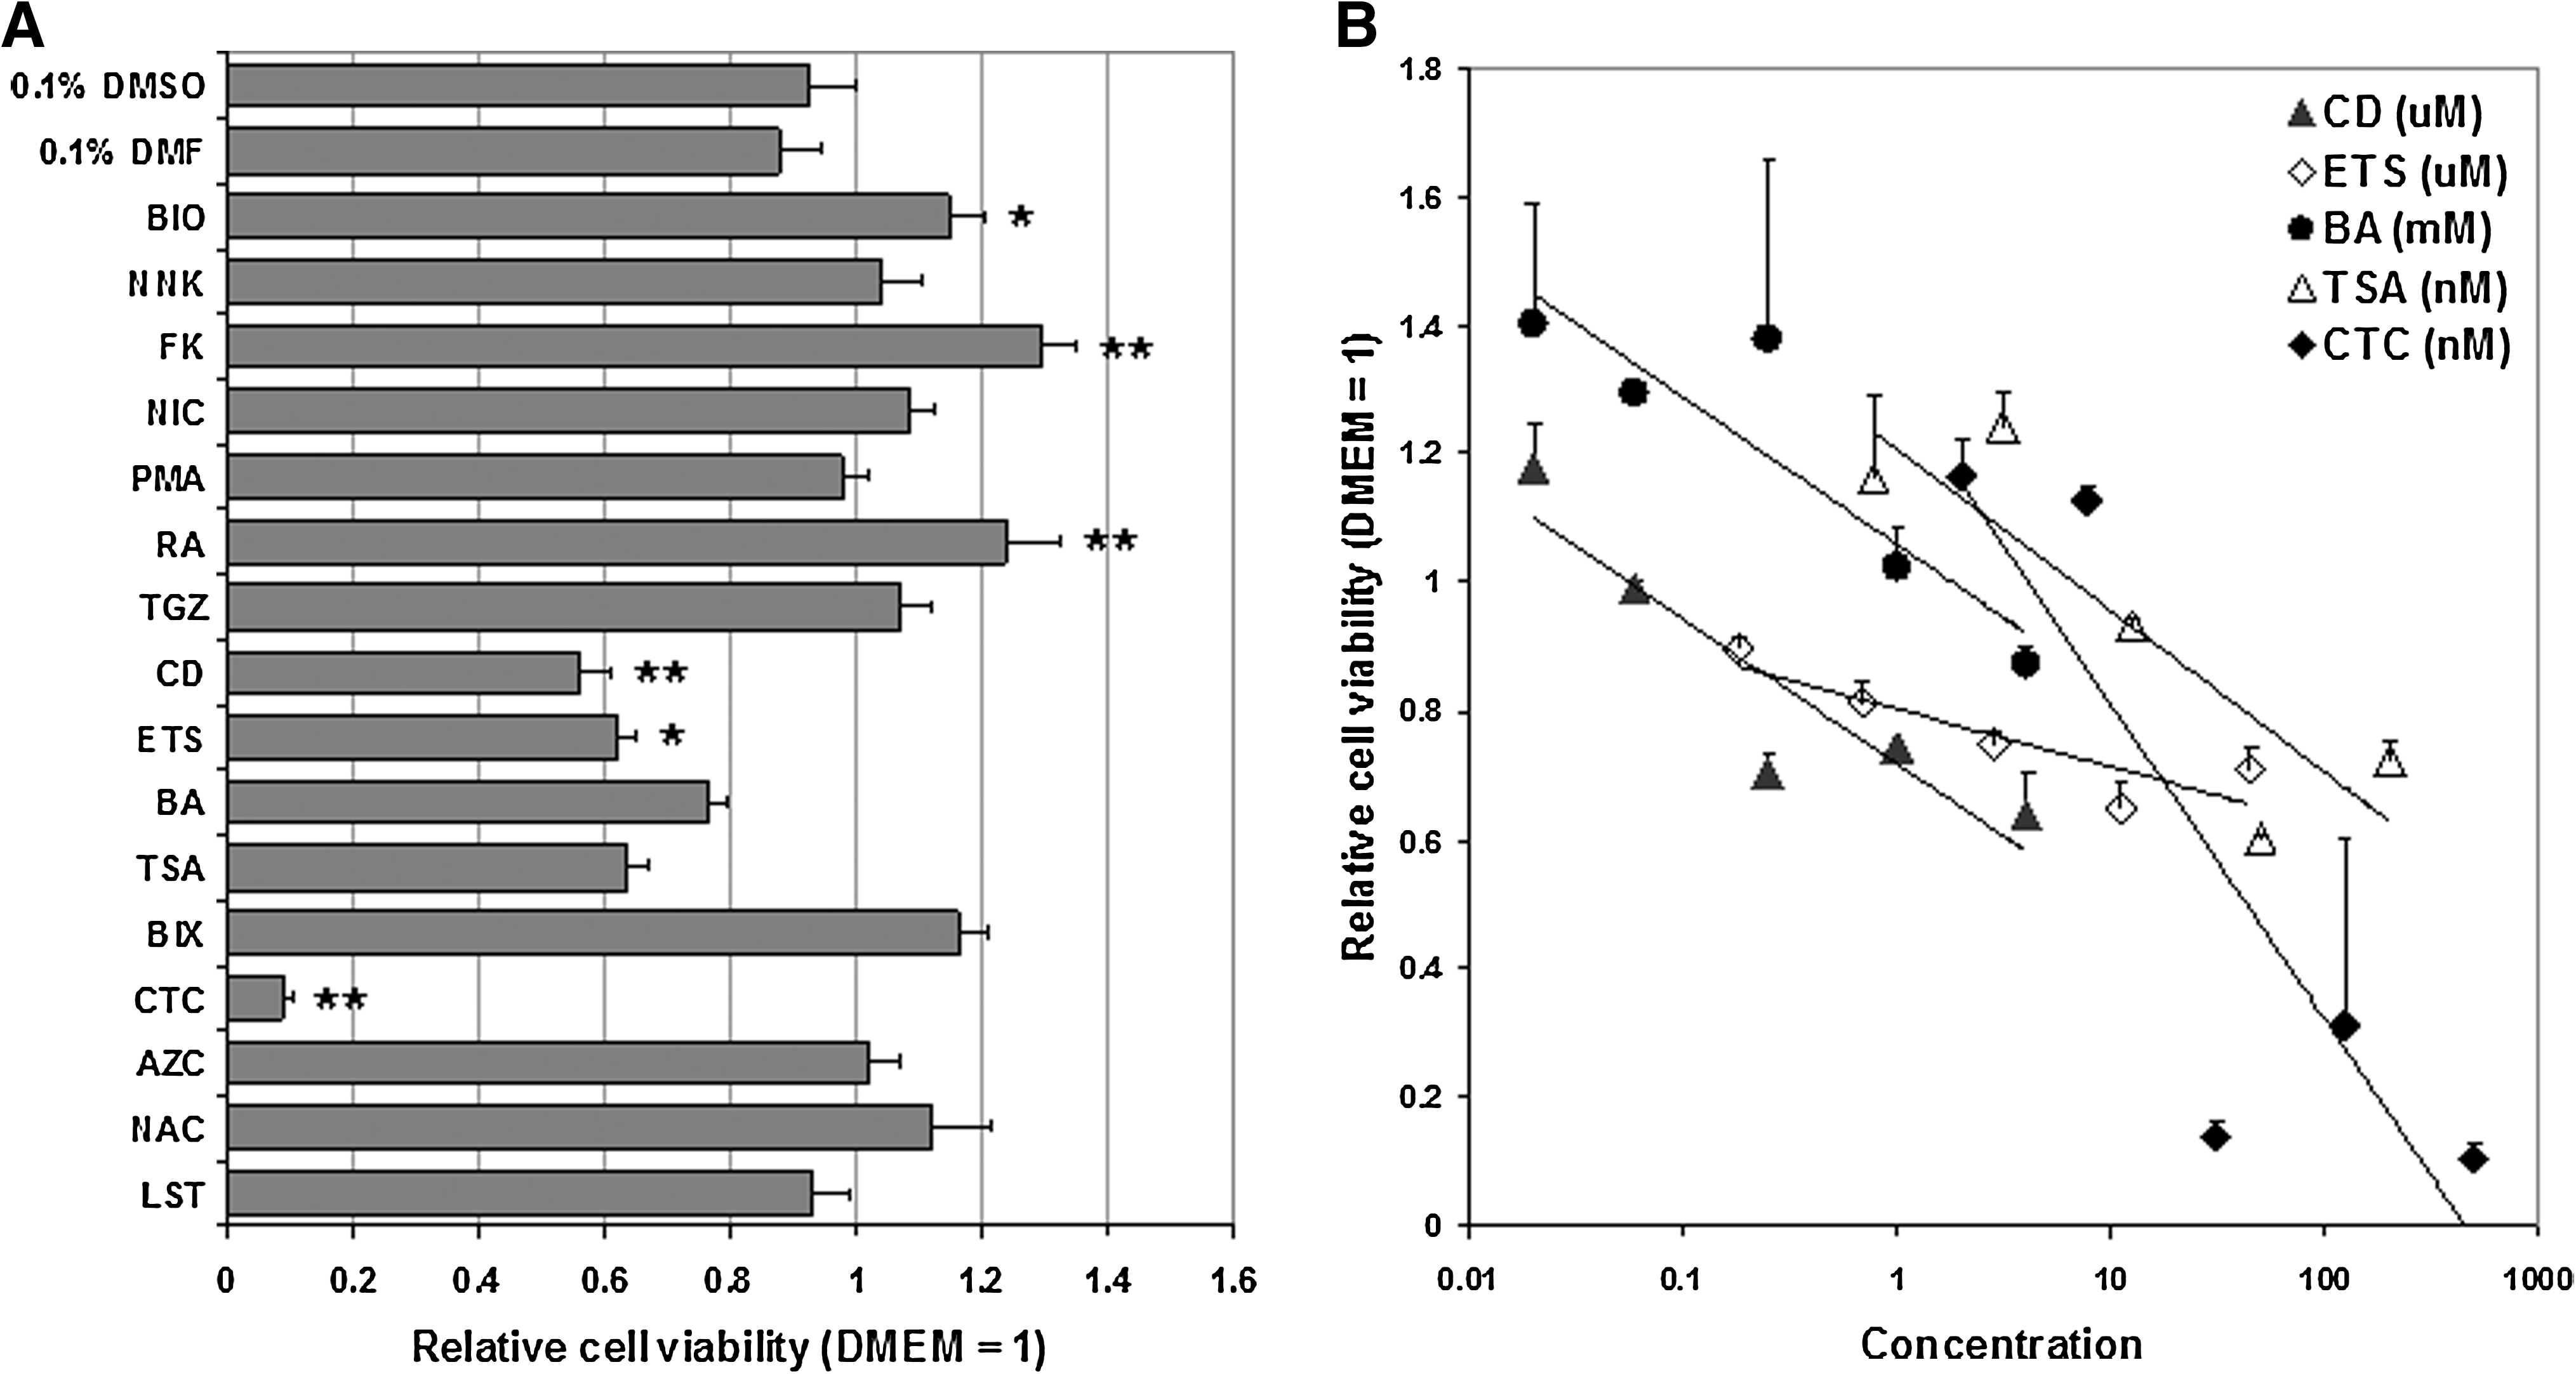
Determination of no observed adverse effect level (NOAEL) of individual chemical candidates. (
Establishment of reprogramming protocol
After 24 h of preincubation of 1.5 × 10⁵ MEFs at passage 2 in six-well plates, daily cocktail treatment was initiated and continued up to 28 days. There was no significant morphological change during the treatment. During the recovery period for cells treated for 4, 8, or 12 days, no colony formation was observed. In contrast, colonies with clear boundary and flattop appeared on day 4 of recovery from cells that were treated for 16 and 28 days. These colonies were resistant against trypsin and collagenase dissociation; therefore, manual colony pickup was performed for transfer and maintenance. After the first colony pickup, about 48% of the colonies from the 16-day treatment were viable and continued to grow for at least three passages at 5-day intervals (Fig. 2A–C). Colonies from the 28-day treatment, however, disappeared 3 days after their first appearance. Colony formation during the recovery period of the 16-day treatment was reproducible, and the overall efficiency of colony formation was approximately 0.02% (Fig. 2D).
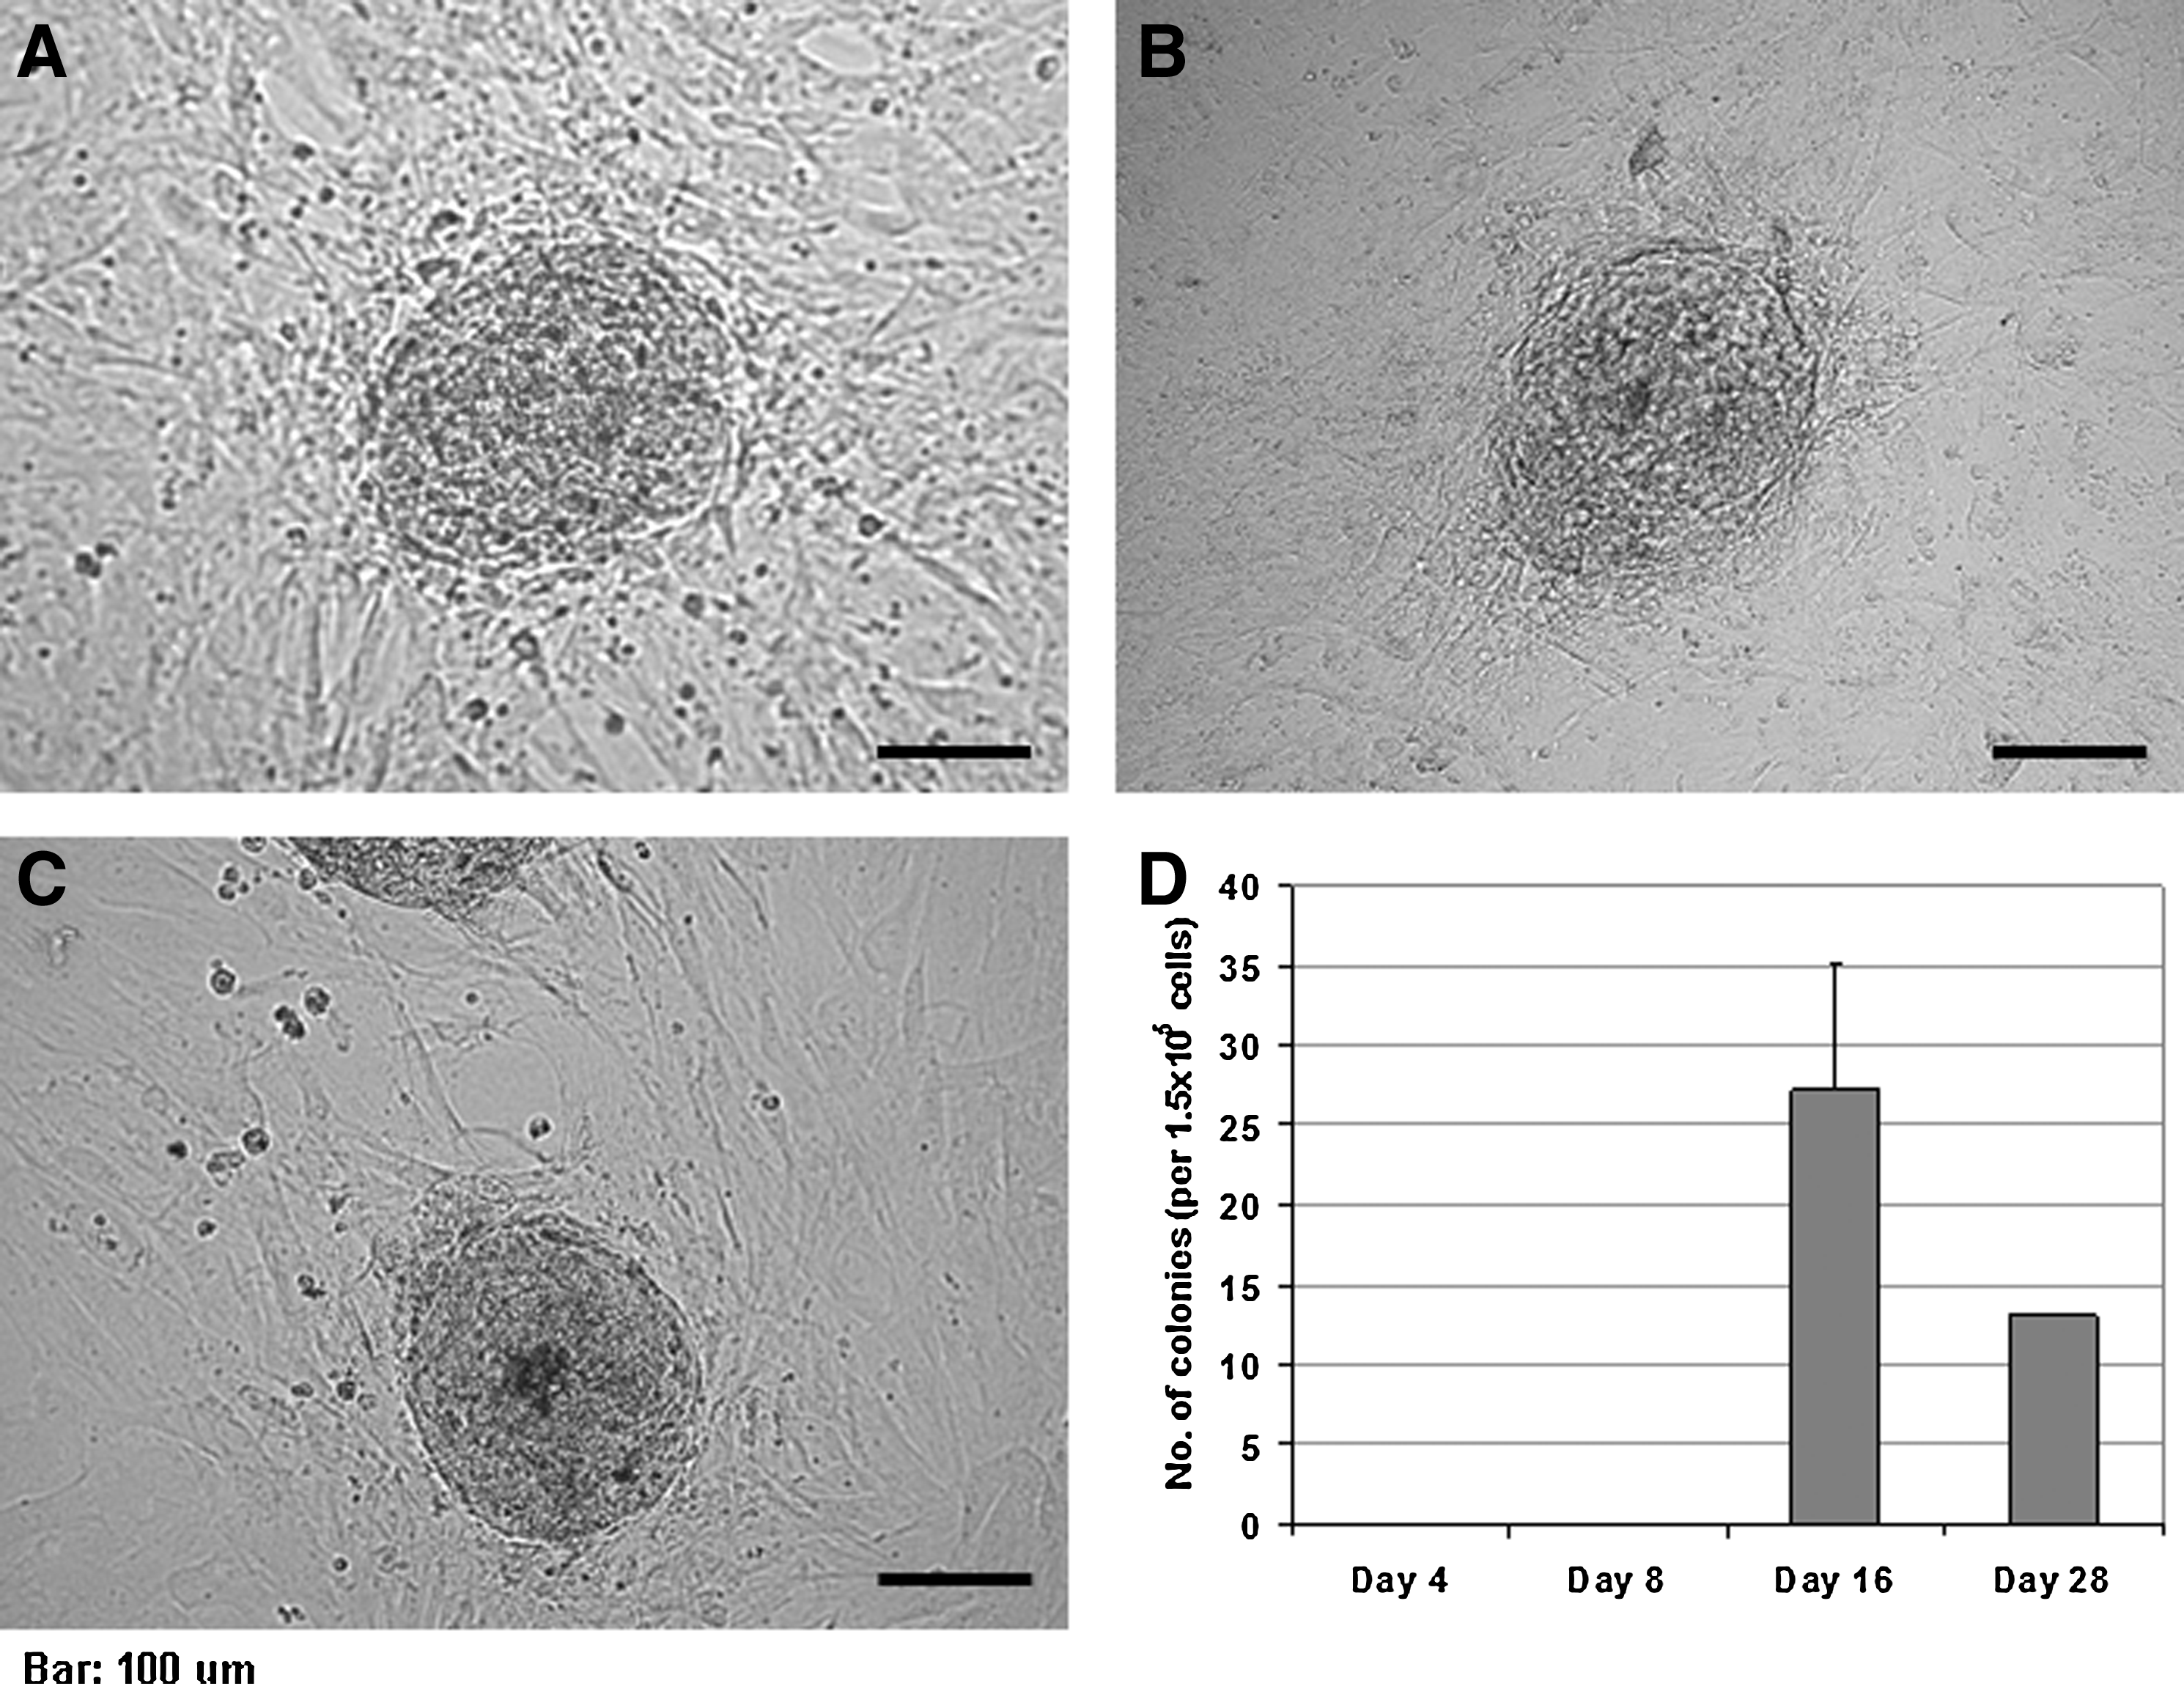
Chemical induction of colony formation. (
Characterization of chemically induced colonies
As depicted in Figure 3, chemically induced colonies showed AP activity and SSEA-1 expression that were compatible to those of ESCs. Semi-qPCR revealed a downregulation of the somatic cell marker, Fibrillin2, in chemically induced colonies at levels compatible to the ESC control R1 (Fig. 4). Basal levels of expression of Sox2 and Nanog were found at day 16 of treatment in MEF, as well as in chemically induced colonies. The expression levels, however, were lower than those in ESCs. Reactivation of Oct4 was not observed in MEFs at either day 16 of treatment or in the chemically induced colonies.
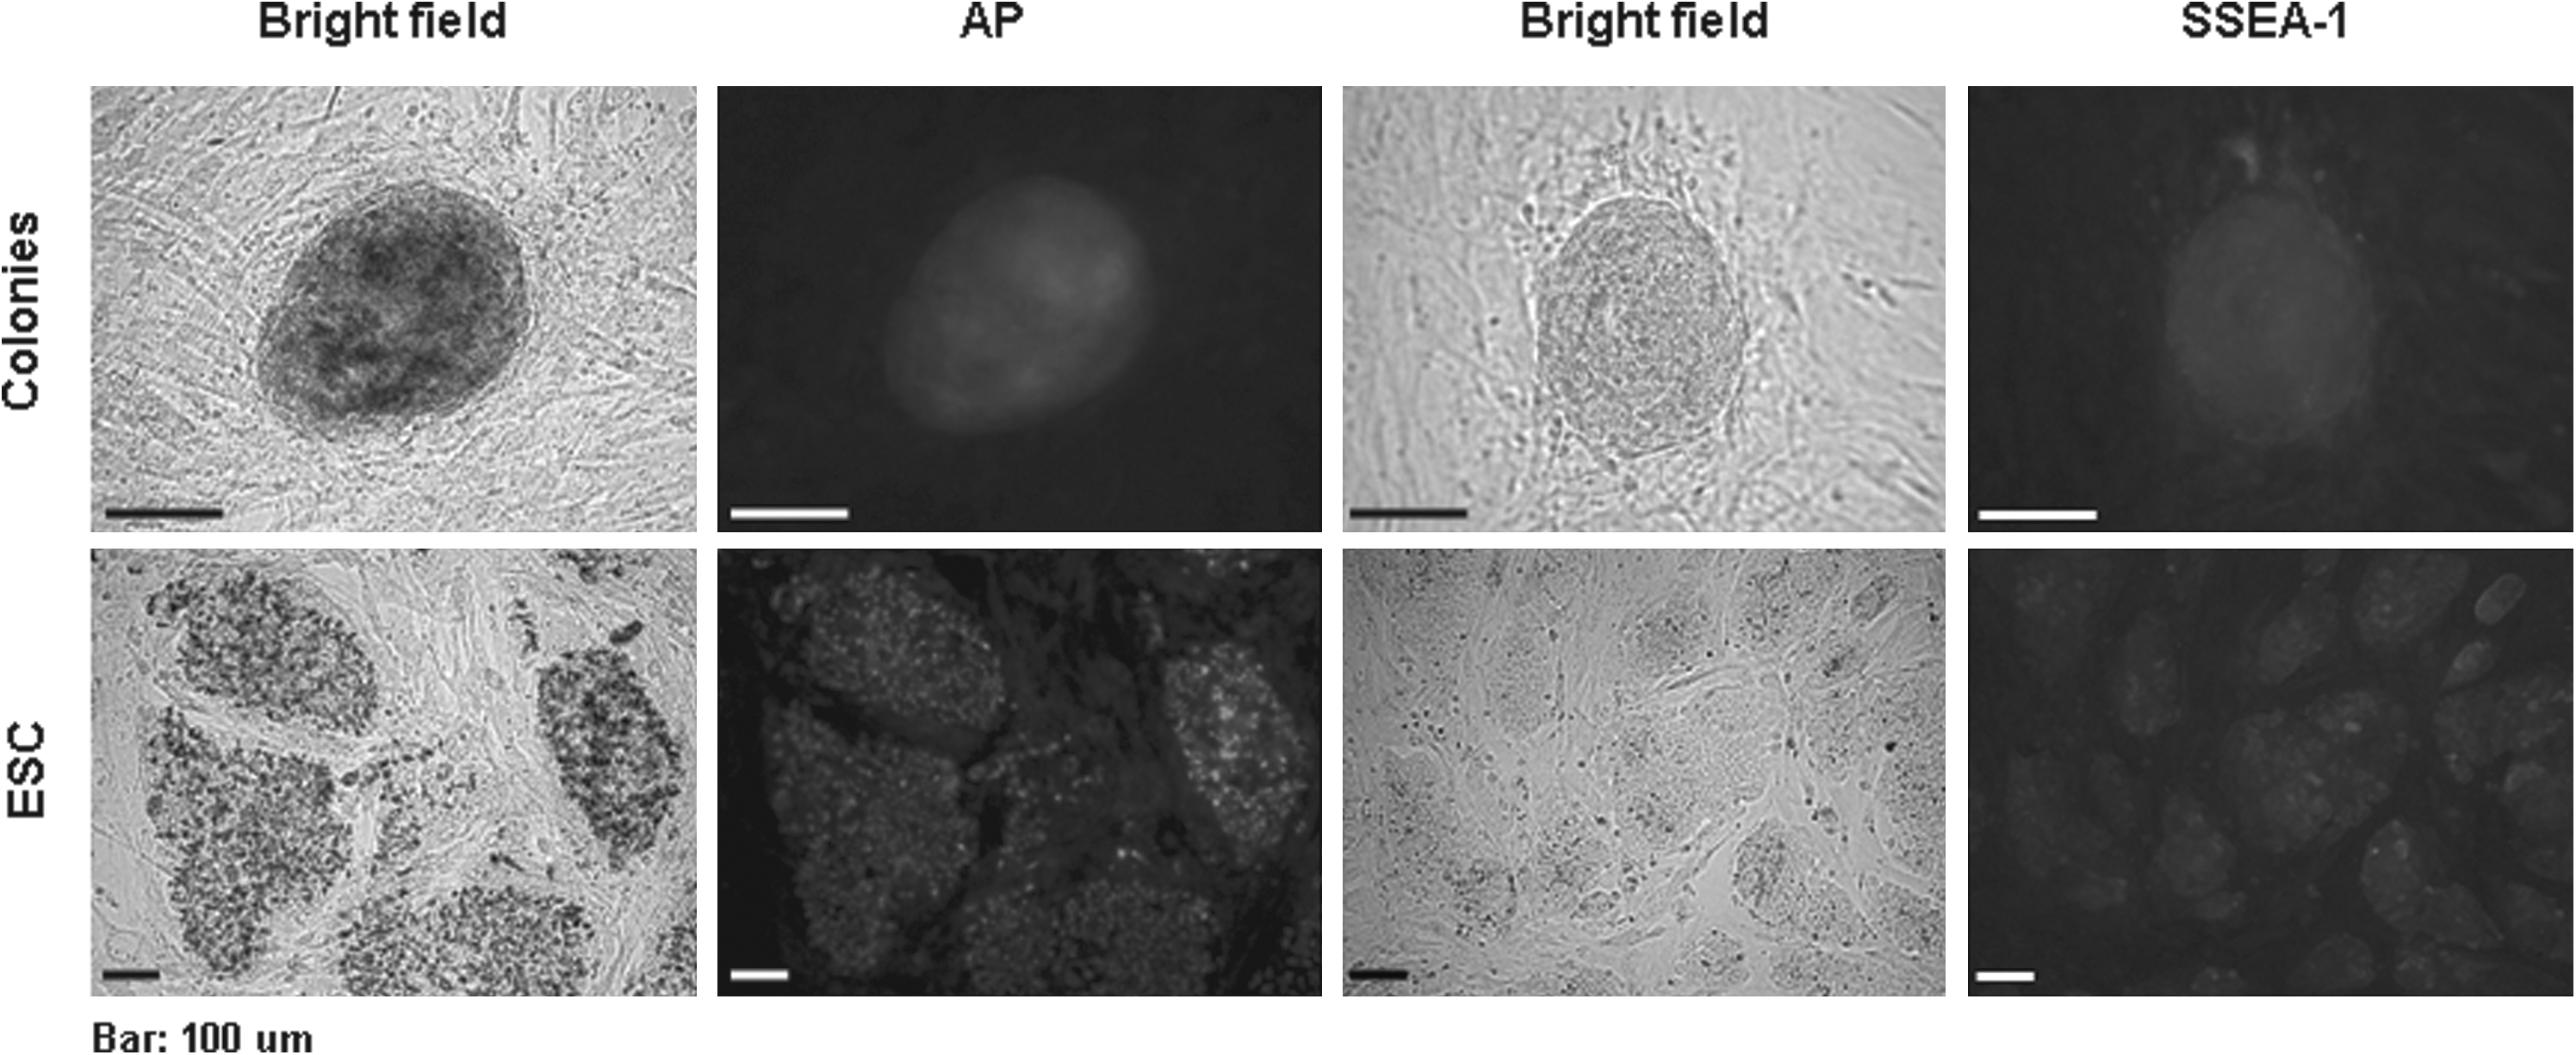
Immunochemical characterization of chemically induced colonies which were positive for both AP (Alkaline phosphatase) and SSEA-1 (stage-specific embryonic antigen-1). Bar = 100 μm.
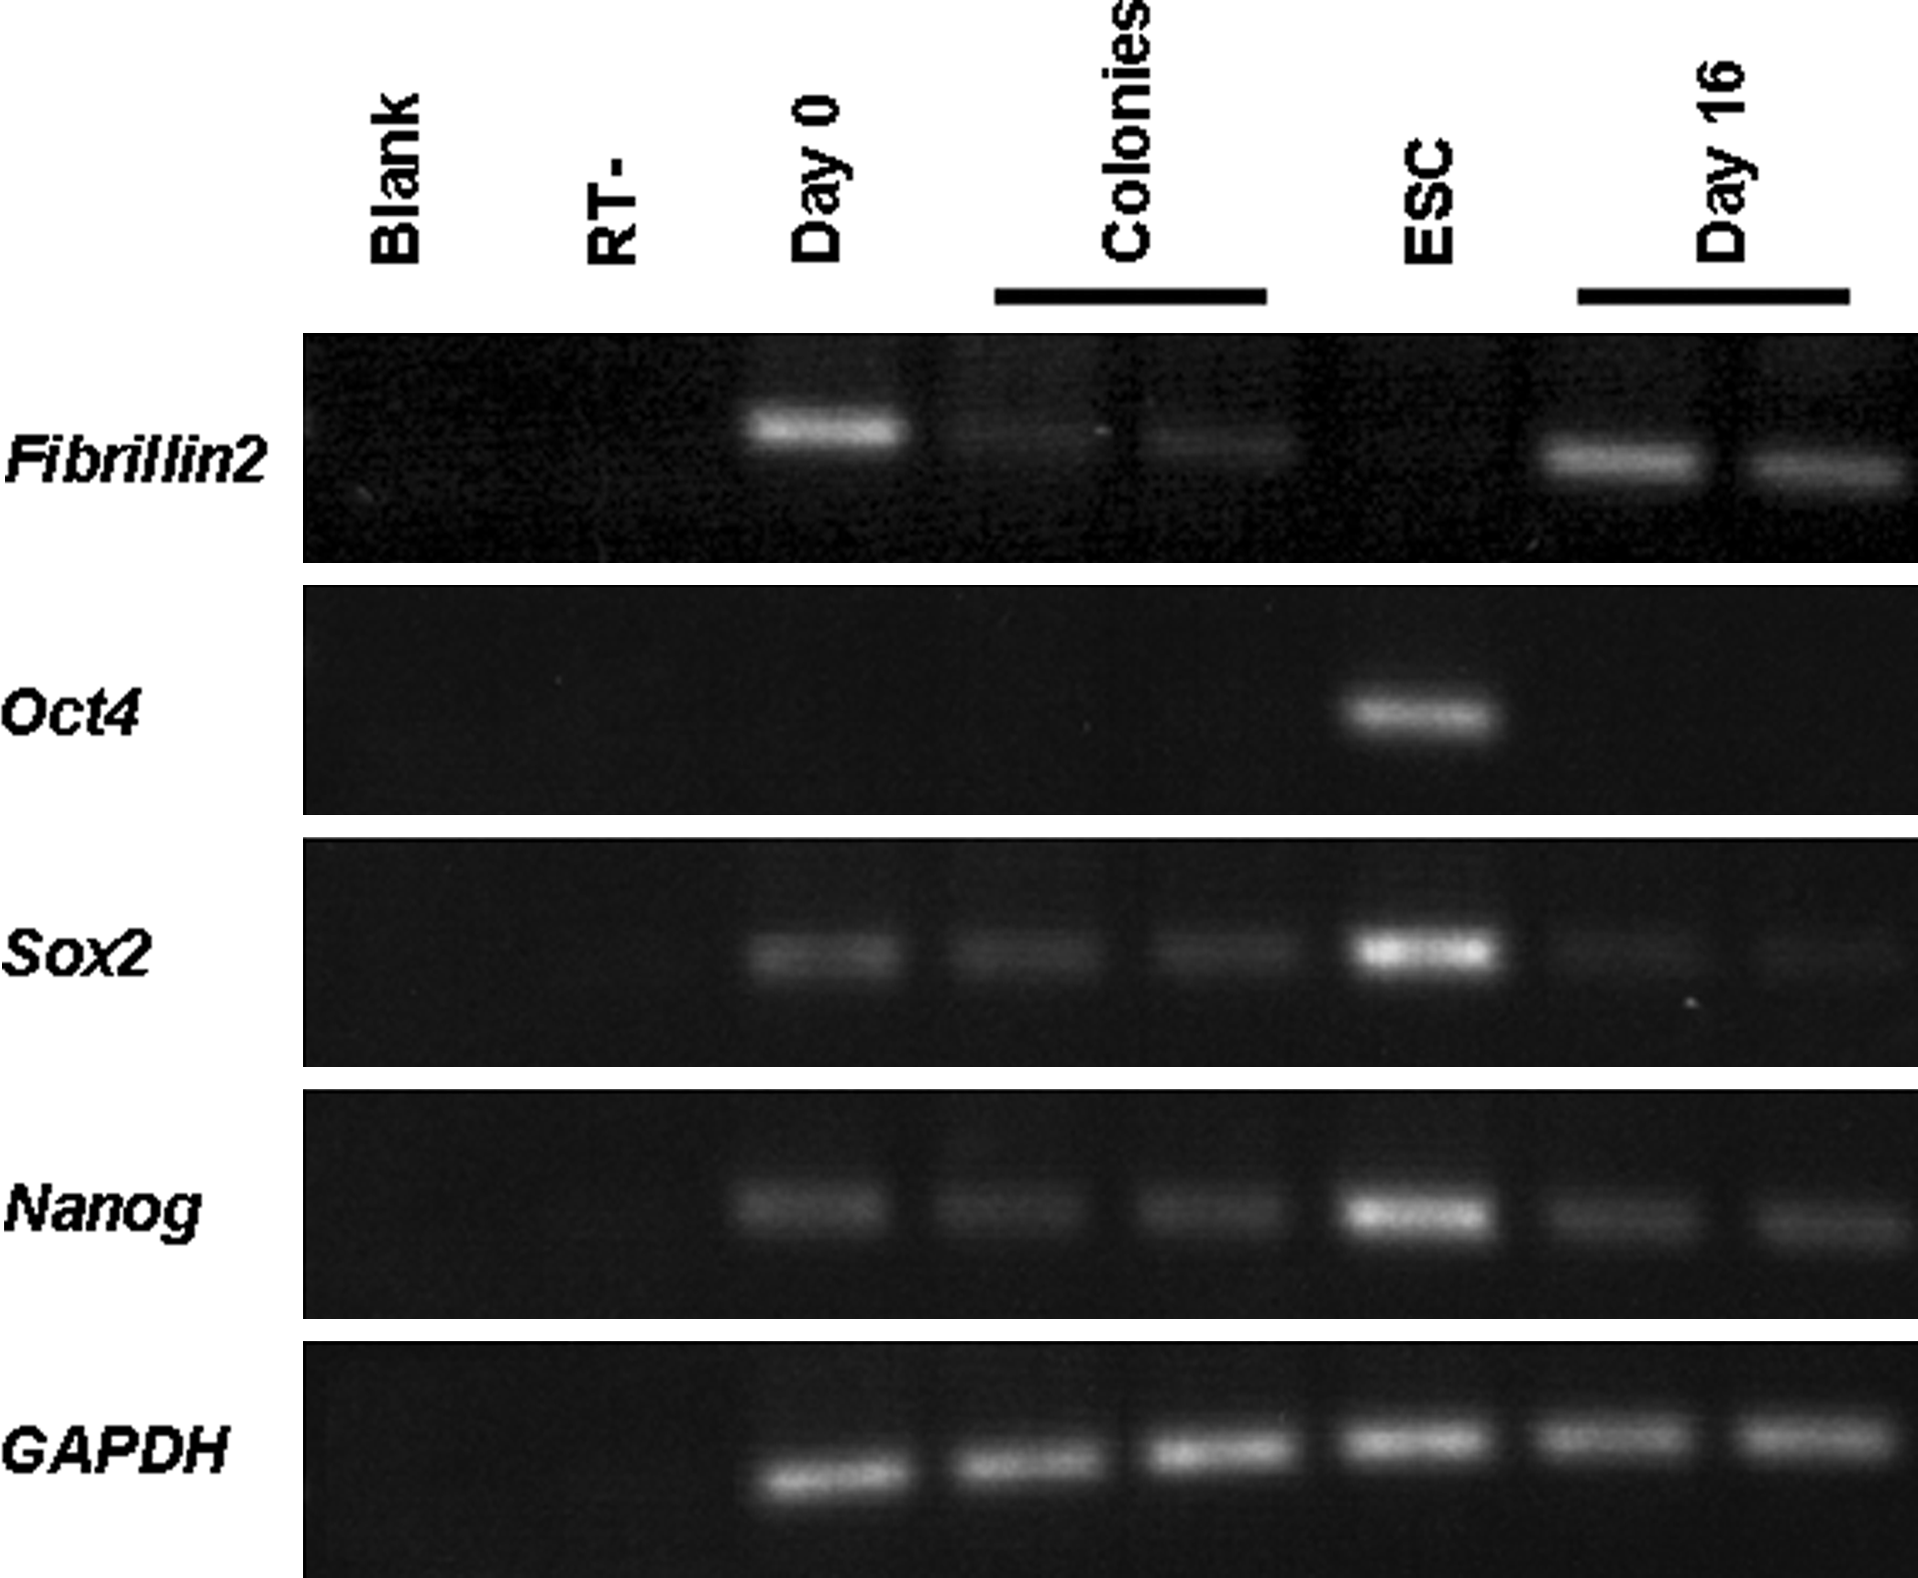
Semiquantitative analysis of somatic cell (Fibrillin2) and ESC marker (Oct4, Sox2, and Nanog) gene expression. MEF and ESC served as controls for the induced colonies and cells after 16 days of treatment. GAPDH: Internal control.
Global gene expression profiling demonstrated that the chemical cocktail increased the number of DE genes in a treatment-length-dependent manner compared to day 0 of treatment (Fig. 5A). At days 8 and 16 of treatment, 167 genes (0.7%) and 564 genes (2.3%) were differentially expressed compared to MEFs at day 0 of treatment, respectively. In the chemically induced colonies, 564 DE genes (2.4%) were found. In contrast, ESCs and iPSCs had 2,480 (10.5%) and 3,387 (14.3%) DE genes compared to MEFs at day 0 of treatment, respectively. Hierarchical clustering revealed that the chemically induced colonies were more similar to MEFs at day 0 to day 16 of treatment with the correlation coefficiency (r) = 0.825, and this cluster was separated from the ESCs and iPSCs cluster by r = 0.216. Functional annotation analysis of DE genes showed that “cell cycle,” “Wnt signaling pathway,” “p53,” and “chromatin modification” were upregulated, and “TGF-beta signaling pathway” was downregulated in ESCs and iPSCs (Fig. 5B). In contrast, MEFs at days 8 and 16 of treatment and chemically induced colonies had upregulated “apoptosis/p53” and “extracellular matrix (ECM),” and downregulated “mitosis/M phase.” Interestingly, active “neuromuscular lineage” was identified in the chemically induced colonies, implying that the chemically induced colonies were in an intermediate state between MEFs and ESCs. From the 564 differentially expressedgenes between the chemically induced colonies and MEFs at day 0 of treatment, 122 genes were identified as “ESC-enriched.” Based on these genes alone, chemically induced colonies were clustered with ESCs and iPSCs with r = 0.663, and was separated from MEFs at days 0 to 16 of treatment with r = 0.410 (Fig. 6). Information on the 36 upregulated and 86 downregulated ESC-enriched genes was listed in Table 2. Among them, somatic markers such as Procollagen type VI alpha 3 (Col6a3) and Thymus cell antigen 1 (Thy1) and early ES cell differentiation markers such as E26 avian leukemia oncogene 2 (Ets2), Sterol-C4-methyl oxidase-like (Sc4mol), and Vascular cell adhesion molecule (Vcam1) were featured in the downregulated genes. In contrast, genes involved in stem cell maintenance such as Cyclin D1 (Ccnd1) and Notch gene homolog 3 (Notch3) were found to be upregulated. In the embryo aggregation study, however, we could not succeed to aggregate the colonies with eight-cell stage embryos to get transferable blastocysts.
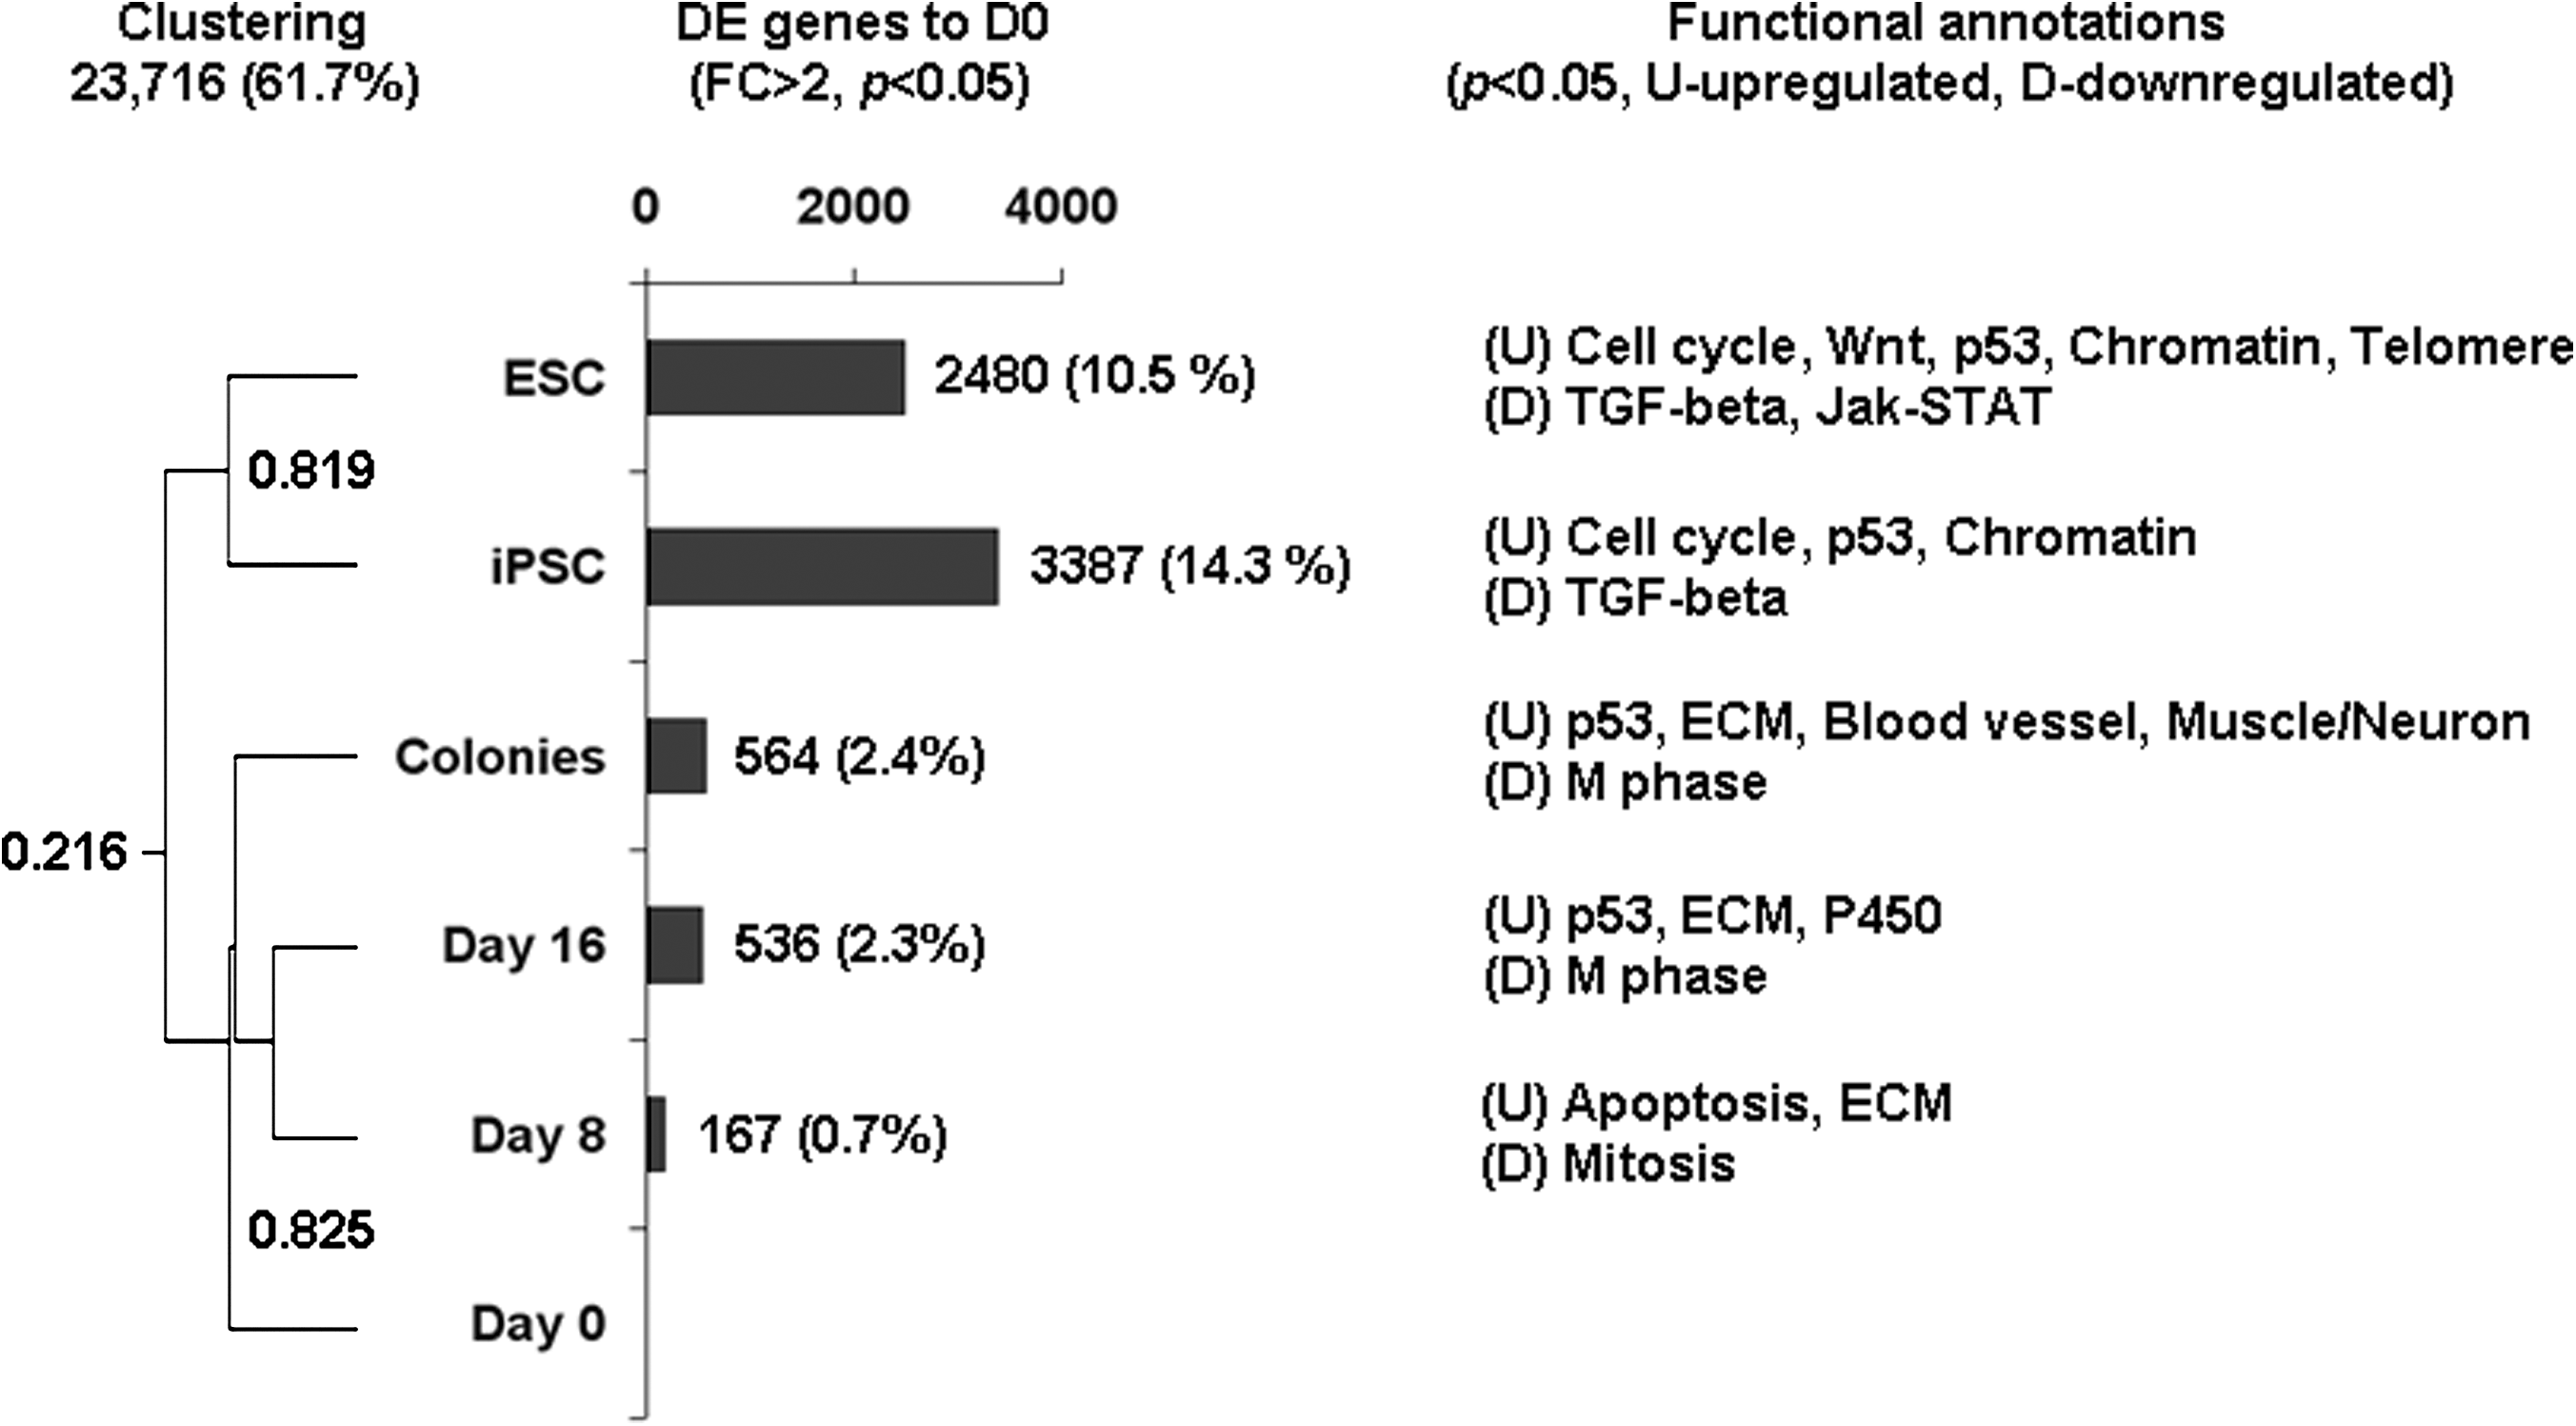
Global gene expression analysis of MEFs, MEFs after 8 and 16 days of chemical induction, iPSCs, and ESCs. Left panel: hierarchical clustering analysis of expression profiles based on 23,716 genes. Chemically treated MEFs clustered with untreated MEFs, whereas iPSCs clustered with ESC. Middle panel: numbers and percentages of differentially expressed genes in chemically treated MEFs, iPSCs, and ESCs compared to MEFs at day 0 of treatment (fold change >2, p < 0.05). MEFs showed a treatment-length related changes in the number of DE compared to untreated MEFs. Right panel: functional annotation of differentially expressed genes (p < 0.05). Dark indicates upregulated pathways, light indicates downregulated pathways.
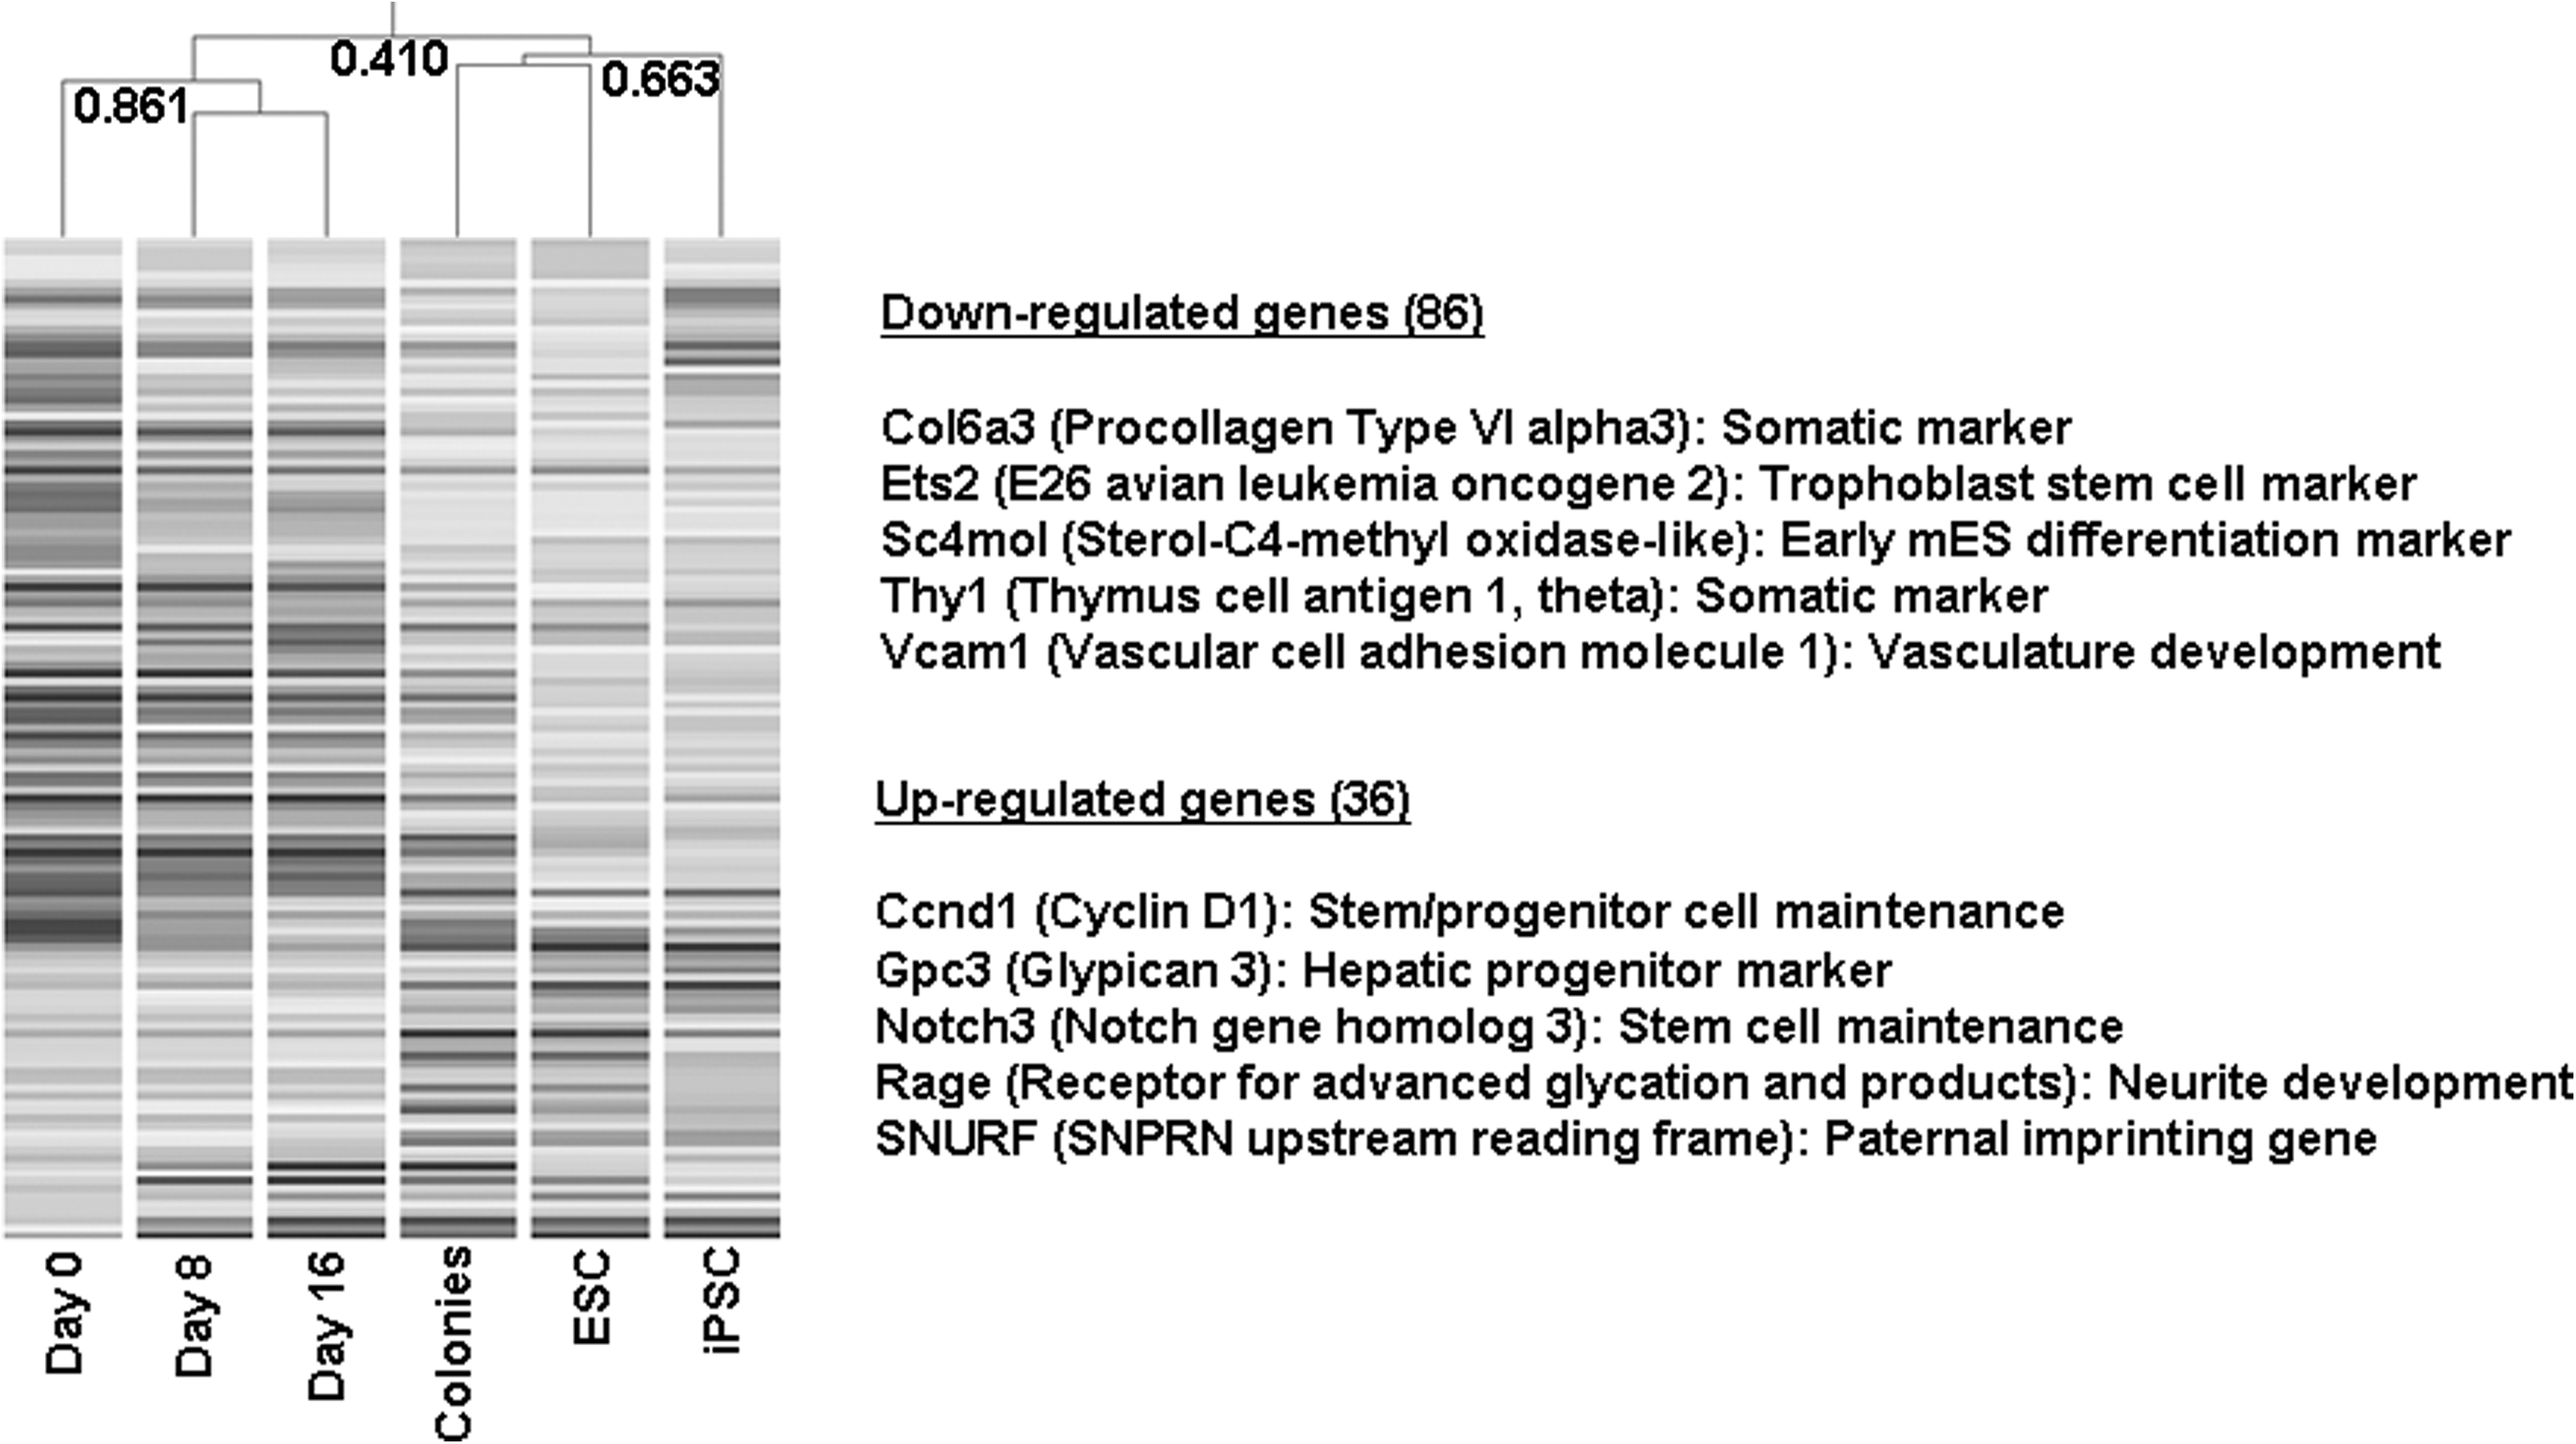
Differentially expressed genes in chemically induced colonies that are “ESC-enriched.” Left panel: hierarchical clustering of ESC-enriched genes. Using the 122 ESC-enriched genes chemically induced colonies clustered with ESCs, suggesting that these colonies were significantly similar to ESCs on the expression patterns of ESC-enriched genes. Right panel: representative gene lists up or down-regulated in chemically induced colonies.
Discussion
We used morphological criteria to calculate the induction efficiency and to pick up colonies. It has been reported that iPSC screening based upon morphological criteria alone is sufficient to isolate pluripotent cells (Meissner et al., 2007). Chemically induced colonies formed in our study dramatically altered their morphology from that of monolayer fibroblasts to multilayered colonies with embryonic stem cell characteristics. These transformations suggest that the selected chemicals induced dramatic biochemical changes inside the cells. Additionally, cells in these colonies exhibited early reprogramming markers such as AP and SSEA-1 at levels compatible to ESCs. Gene expression analysis also revealed that the colonies lost characteristics of somatic cells by reduced expression of Fib2 and increased expression of “stemness gene.” These observations demonstrated that chemical treatment alone could induce dedifferentiation of MEFs to an intermediate state by targeting core pluripotent genes and/or signaling pathways. This conclusion was further reinforced by the global gene expression analysis. The number of DE genes was linearly increased according to the treatment period. At day 8 of treatment, as there was no visible colony developed, only 167 genes were differentially expressed; however, 536 genes were differentially expressed after 16 days of treatment. Chemically induced colonies, had more than threefold more DE genes than MEFs at day 8 of treatment compared to MEFs before treatment. Furthermore, 16 upregulated genes in the colonies were functionally enriched in neuromuscular differentiation that included Myosin light polypeptide 9 (Myl9), brain-derived neurotrophic factor (BDNF), Kinesin family member 5C (Kif5C), nerve growth factor beta (NGFb), Notch gene homolog 3 (Notch3), and Transforming growth factor beta 2 (TGFb2). This finding implies that the colonies were specified into neuromuscular lineage, which consistently supported the intermediate characteristics of the chemically induced colonies. The most encouraging result of the study was perhaps that chemical treatments induced the expression of as many as 122 genes by the induced colonies that are ESC-enriched, including downregulated somatic markers and upregulated stem cell markers.
In this study, we used B6/129 MEFs for reprogramming by chemicals. MEFs are of the mesodermal lineage and are expected to have no detectable pluripotent gene activities. Interestingly, we observed basal levels of expression of Sox2 and Nanog in B6/129 MEFs by semi-qPCR. Several lines of evidence indicated that the starting cell type used in reprogramming studies could influence the end results because of endogenously expressed reprogramming genes (Page et al., 2009; Shi et al., 2008), albeit the extremely low expression levels compared to human ESCs. Likewise, we could observe Sox2 and Nanog expression in B6/129 MEFs, but the extent was much lower than mouse ESCs, for example, approximately 1300-fold lower in the case of Sox2. In contrast, no trace of Oct4 expression was found in B6/129 MEFs before or after chemical treatment. This could indicate that Sox2, Nanog, and Klf4 are sufficient to reprogram differentiated cells to an intermediate state, yet Oct4 may be the ultimate factor the brings cells to the complete dedifferentiated state. Interestingly, gene response against chemical treatment corresponded with basal level of expression. Sox2 was upregulated by PMA, CD, ETS, and CTC treatment and Klf4 by BIO, CD, ETS, BA, and TSA treatment. Therefore, even though silencing status of pluripotent genes in somatic cells are not fully understood, this result might indicate that Sox2, Klf4, and Nanog could have less stringent gene silencing controls than Oct4. Expanded knowledge on gene silencing of pluripotent genes will increases the possibility of identifying the active chemical substitutes of reprogramming factors.
The chemical treatment regimen used here induced colonies that were strongly resistant to enzymatic dissociation. This is likely due to the fact that MEFs after 16 days of treatment and the induced colonies had upregulated expression levels of Procollagen type VIII alpha 1 (Col8a1), Decorin (Dcn), Fibulin 1 and 2 (Fbln1 and Fbln2), tissue inhibitor of metalloproteinase 3 (Timp3) that enriched in the ECM. The resistance of cell dissociation of the colonies might contribute the successful aggregation between the colonies and the embryos. In addition, alcohol dehydrogenase 1 (Adh1), cytochrome P450 family 1 subfamily B (Cyp1b1), microsomal glutathione-s-transferase 1 (Mgst1), UDP glucuronosyltransferase 1 family polypeptide a6a (Ugt1a6a) and a7c (Ugta7c) were enriched in the “metabolism of xenobiotics by cytochrome P450.” These findings imply that even though we used extremely low dose levels for the chemical cocktail, cytotoxicity was synergistically increased unexpectedly. Taken together, an alternative approach for chemical reprogramming could be tested using a reduced number of chemicals with increased doses to reach the effective dose levels.
Finally, HTS is the most widely used technology in drug discovery from chemical libraries. However, the candidate compounds are not always applicable for medicinal chemistry and their in vivo activity cannot be assured before cell- or animal-based testing (Bleicher et al., 2003). Chemistry-oriented HTS also suffer from low efficiency (Chen et al., 2004a; Lyssiotis et al., 2009), implying that such screening should be complemented with biological criteria for enhanced identification of successful candidates. In this study, we used in silico HTS together with cocitation analysis using PubMatrix and identified 16 candidates that satisfied all screening criteria from the 426 compounds in cancer research. Cell-based gene expression analysis revealed that seven candidates increased pluripotency-related genes significantly (1.64% from inventory), and three of them increased the expression levels of target genes more than twofold (0.7%). Our overall screening efficiency of biology-based in silico HTS was at least 350-fold higher when compared to solely chemistry-based HTS, and more importantly, all of them have strong supporting data already published for a regulatory role on pluripotency-related genes or signaling pathways. This result indicated that reorientation approach with biological HTS could save resources and effort to synthesize new chemical compounds and increase screening efficiency.
In conclusion, biology-oriented in silico HTS may expand the avenue of finding new chemical candidates to substitute reprogramming factors in viral or protein forms. The chemical treatment regimen we developed here was able to reprogram terminally differentiated cells albeit to a transdifferentiated state, for example, neuromuscular lineage, within the mesodermal lineage.
Footnotes
Acknowledgments
The authors thank Sharon L. Kish for critical review of this manuscript. This work was supported by grant 1265-31000-091-02S from the United States Department of Agriculture Agricultural Research Service (USDA-ARS).
Author Disclosure Statement
The authors declare that no conflicting financial interests exist.