
Abstract
Abstract
Nuclear transfer efficiency in the pig is low and is thought to be caused by inadequate nuclear reprogramming. The objective of this study was to identify differentially represented transcripts in pig in vivo derived (BLIVV), in vitro fertilized (BLIVF), or nuclear transfer derived (NT, three different activation methods) blastocyst stage embryos and the donor cell line by microarray analysis, and to determine if treatment of reconstructed embryos with the histone deacetylase inhibitor, Scriptaid (NTS), for 14 h postactivation would correct gene expression in a subset of the identified aberrantly reprogrammed transcripts. There were 1481 differentially expressed transcripts when comparing all six treatment groups (p < 0.05). Transcripts that were different between BLIVV and NT (p < 0.20) and significantly different from donor cells (p < 0.05) were classified as being aberrantly reprogrammed (179 transcripts). Fourteen transcripts were chosen to determine the effect of Scriptaid treatment. After real-time PCR relative gene expression was compared among BLIVV, NT pool, cells, and NTS by the comparative Ct method, statistical analysis was performed in SAS 9.1 (p < 0.05). NTS embryos had three transcripts returning to the same level as BLIVV (H3F3A, CAPG, and SEPT7). Half of the transcripts (7/14) were not affected by NTS treatment, for example, SIRT1 and H1F0. Scriptaid treatment resulted high expression of COX5A and very low expression of GPD1L, EIF3E, and GSTA3. Scriptaid also reduced the number of 5-Methylcytidine-positive nuclei in blastocyst stage embryos (p < 0.0003). Scriptaid treatment significantly affected gene expression in 7 of the 14 transcripts evaluated and returned 3 genes to BLIVV levels.
Introduction
After activation, NT reconstructed zygotes can be exposed to MG132 (Z-Leu-Leu-Leucinal) to delay resumption of meiosis presumably by preventing proteasomal degradation of cyclin B (Josefsberg et al., 2000). Once the inhibitor is removed, oocyte meiosis is resumed and the oocyte can develop normally. MG132 has been used to prevent precocious meiotic resumption in rat NT because these oocytes spontaneous activate once removed from the oviduct (Zhou et al., 2003). Mice have been cloned from donor embryonic stem (ES) cells (that had been thought to be refractory to nuclear transfer) after treatment with 5 μM MG132 for 1 h postelectrofusion (Yu et al., 2005). During pig cloning, addition of MG132 immediately after nuclear transfer improves overall pregnancy rates (Whitworth et al., 2009), but did not have an observable effect on placental development at day 30 (Whitworth et al., 2010). Based on rat, mice, and pig studies, it was proposed that a transient exposure of reconstructed zygotes to MG132 after NT could be beneficial to nuclear remodeling and subsequent reprogramming.
Although the structure of the transferred nucleus is not always adequately modified by the oocyte cytoplasm (Moreira et al., 2003), treatment with HDACi can help facilitate that change. Members of the hydroxamic acid-containing class of HDACi such as trichostatin A (TSA) and 6-(1,3-dioxo-1H, 3H-benzo[de]isoquinolin-2-yl)-hexanoic acid hydroxyamide (Scriptaid) are potent HDACis. Inhibition of the deacetylases results in an increase in the global acetylation of histones. Increase acetylation results in a change in the chromatin structure such that proteins like RNA polymerases can gain access to the DNA and begin transcription (Van Thuan et al., 2009). TSA treatment improves development of cloned pig embryos to the blastocyst stage (Das et al., 2010; Li et al., 2008a), and in mice TSA improves both the nuclear remodeling (Maalouf et al., 2009) and development to term (Ding et al., 2008; Kishigami et al., 2006, 2007). Although TSA treatment has shown to improve cloning efficiency in mice, other groups reported neonatal death after the TSA treatment of rabbit (Meng et al., 2009) and pig embryos (Zhao et al., 2010). Treating cloned pig reconstructed zygotes (but not the donor cell) with Scriptaid (500 nM for 14 h), which has less cellular toxicity than TSA (Su et al., 2000), results in an increase of histone acetylation intensity (AcH4K8) in the one-cell stage NT embryo to a level that is similar to IVF embryos at the same stage (Zhao et al., 2010). Scriptaid treatment improved the production of cloned mice (Van Thuan et al., 2009) and pigs (Zhao et al., 2009, 2010). In a report cloning inbred National Institutes of Health miniature pigs, Scriptaid increased the cloning efficiency from 0 to 1.3%, which is an increase in live piglet number from 0 to 14. Scriptaid has also been used to improve cloning efficiency in the large white breed from 0.4 to 1.6% for fetal fibroblast donor cell lines and 0 to 3.7% for more difficult to clone adult ear fibroblasts (Zhao et al., 2009). It appears that increased acetylation after HDACi treatment allows for a more normal remodeling/reprogramming event.
The overall goal of this study was to identify aberrantly expressed transcripts in pig in vitro fertilized (BLIVF) and somatic cell NT blastocyst stage embryos compared to their in vivo (BLIVV) counterparts and the donor cell line (cells) by using a cDNA microarray. The secondary goal of this study was to determine if any commonly used activation methods post-NT result in a transcriptional profile that more closely mimics those arising from fertilization. The three activation/fusion methods tested included standard electrical activation/fusion (NT1) (Lai et al., 2002a; Park et al., 2001), electrical activation followed by a transient treatment with MG132 (NT2) (Sutovsky and Prather 2004; Zhou et al., 2003), and fusion in low Ca2+ medium followed by chemical activation with Thimerosal/DTT (Machaty et al., 1997, 1999). All three activation groups have been described in detail previously and have all produced live cloned piglets (Whitworth et al., 2009, 2010). Once the transcriptional profile was determined, the gene expression data was used to identify over- and underreprogrammed transcripts. Reconstructed zygotes were then treated with the HDACi, Scriptaid, to determine if gene expression of the identified under- and overreprogrammed transcripts returned to a level comparable to the BLIVV blastocyst stage embryos. Another interesting aspect of this study is that all embryo culture was performed in vivo. In other words, oocytes were matured to metaphase II (MII) in vitro and after manipulation (IVF or NT) embryos were transferred back into a recipient gilt and cultured to the blastocyst stage within the pig oviduct and uterus. This allows the identified gene expression differences to be the result of oocyte manipulation and not embryo culture to the blastocyst stage.
Materials and Methods
Ethical guidelines
All animal procedures were performed with an approved University of Missouri Animal Care and Use (ACUC) protocol. Recombinant DNA technologies were performed with an approved protocol from the Institutional Biosafety Committee.
MIAME compliance
The microarray data meets all the Minimum Information About a Microarray Experiment (MIAME) requirements. Raw data (.gpr) and normalized data are available at the following Website (http://animalsciences.missouri.edu/faculty/prather/), as well as a detailed description of the experimental design, sample annotation, microarray feature annotation and a detailed protocol.
Chemicals
All chemicals for embryo culture were purchased from Sigma-Aldrich Company (St. Louis, MO, USA) unless otherwise mentioned. MG132 was purchased from Enzo Life Sciences (Plymouth Meeting, PA, USA).
Animals, donor cell line, and oocytes
The gilts used in this study were all from the University of Missouri swine herd that consists of large white landrace crosses from Newsham Genetics (West Des Moines, IA, USA). The animals were also part of a larger data set where cloning efficiencies and pregnancy rates have been previously published (Whitworth et al., 2009, 2010). The same boar (139-5) was used as the source of semen for artificial insemination and in vitro fertilization; the boar was also the sire of the fetus used to create the fetal fibroblast donor cell line for nuclear transfer. The male donor cell line was transfected with a pCAGG–EGFP construct to ensure that all tissues in the NT group were from NT and not from parthenogenesis. The pCAGG–EGFP vector map is available in a previous article (Whitworth et al., 2009). Oocytes were purchased from Applied Reproductive Technologies (A.R.T., Madison, WI, USA). Both oocytes and the donor cell line were prepared as described previously (Lai et al., 2002a, 2002b).
Treatment group description: BLIVV, BLIVF, NT1, NT2, NT3, NTS
All treatments and corresponding fusion rates are described in detail in Whitworth et al. (2009). All embryos were developed to the blastocyst stage in vivo, that is, transferred back to the oviduct of a recipient gilt for 6 days before collection.
BLIVV
Gilts were artificially inseminated on days 0 and 1 of the estrous cycle.
BLIVF
Oocytes were in vitro fertilized as previously described (Abeydeera et al., 1998). After IVF, oocytes were washed three times and placed in culture in Porcine Zygote Medium (PZM3) (Lai and Prather 2003).
NT1
Reconstructed zygotes were placed between platinum wire electrodes 1.0 mm apart in fusion medium and subjected to 2 DC pulses (1-sec interval) of 1.2 kV/cm for 30 μsec from a BTX Electro-cell 200 (BTX, San Diego, CA, USA) (Lai et al., 2001). In NT1, both fusion and activation occurred at the same time. After the fusion/activation treatment, oocytes were washed three times and placed in culture in PZM3.
NT2
Reconstructed zygotes were fused and activated in the same method as NT1; however, after fusion and activation, oocytes were treated for 2 h with 10 μM MG132, a specific, reversible proteasomal inhibitor, in PZM3. After MG132 treatment, oocytes were washed three times and placed in culture in PZM3.
NT3
Reconstructed zygotes were fused with the same method as NT1; however, the fusion medium contained a lower concentration of Ca2+ (0.1 mM) to allow fusion to occur, but not to induce oocyte activation by an influx of external Ca2+. Oocytes were activated chemically by incubation in 200 μM thimerosal in TL HEPES for 10 min, followed by incubation in 8 mM DTT in TL HEPES for 30 min. After NT3 activation, oocytes were washed three times in TL HEPES and an additional three times in PZM3 before placing in PZM3 culture (Im et al., 2004; Machaty et al., 1997, 1999).
NTS
Reconstructed oocytes were fused with the same method as NT1; however, after fusion, oocytes were incubated in PZM3 with 500 nM Scriptaid (Sigma Cat# S7817) for 14 h. After treatment, embryos were removed from treatment and transferred to the recipient gilt within 1 h.
Embryo transfer
BLIVF and NT1, NT2, NT3, and NTS embryos were cultured overnight and transferred into recipient gilts the following morning at the one-cell stage. The recipient gilt was either in standing estrus on the day of NT (day 1) or the day of ET (day 0). The mean number of BLIVF, NT, and NTS embryos transferred was 89 (range: 40–100), 109 (range: 78–180), and 162 (range: 122–178), respectively. Surgical details have been previously reported (Whitworth et al., 2009).
Nuclear protein extraction and HDAC assay
Nuclear proteins from pools of 10 embryos from the NT1 and NTS groups, including four biological reps for each treatment, were extracted immediately by using EpiQuick Nuclear Extraction Kit I (Epigentek, Brooklyn, NY, USA) following the suspension cells protocol. After 14 h of culture either with or without Scriptaid, zonae pellucidae were removed from one-cell stage embryos with PBS pH 1.79 and embryos were washed in TL-HEPES. Nuclear extracts were then stored at −80°C until EpiQuick HDAC Activity Assay was performed following the manufacturer's protocol. After the fluorodeveloper was added, the reaction was incubated at room temperature for 18 min and reads were taken by using a Synergy-HT fluorescent plate reader (Biotek, Winooski, VT. USA) at 530 excitation and 590 emission filter settings every 3 min. Readings were then imported into SAS and compared by ANOVA; statistical differences were determined by using LSD (p < 0.05).
Quantification of global methylation in NT embryos
Differences in global methylation were determined by immunolocalization using antibodies directed against 5′ methyl cytosine (5-MeC) (mouse monoclonal anti 5-Methylcytidine-antibody, Cat #BI-MECY-0100, Eurogentec, Freemont, CA, USA). Immunolocalization was only performed on NT1 and NTS embryos to determine the effects of Scriptaid on global methylation after NT. Embryos were collected at the blastocyst stage (7 days post-NT). All embryos were cultured in PZM3 prior to collection at 39°C in 5% CO2 in air. The zona pellucida was removed from each embryo. Embryos were washed and fixed in 4% paraformaldehyde for 30 min and permeabilized in 0.1% Triton X-100 in PVS-treated PBS for 15 min and then treated with 2 M HCl for 30 min. Embryos were blocked for 16 h in the permeabilization solution above with the addition of 2% goat serum and 2% NFDM and then incubated with the primary antibody for 1 h at 39°C at a 1:500 dilution (excluded in negative control). Embryos were washed and incubated with secondary antibody (1:1000), goat antimouse IgG-TR (Santa Cruz Biotechnology, Inc. Cat # SC-2781, Santa Cruz, CA, USA) for 1 h at at 39°C. Embryos were washed, mounted on slides under a coverslip, and visualized by fluorescent microscopy with a Texas red filter with a 4-sec exposure for all acquired images. Intensity was determined by NIS Elements BR 3.0 Software (Nikon, Melville, NY, USA) under 20 × magnification. 5-MeC positive nuclei were counted for 9 NT, 15 NTS, and 14 negative control embryos. Images were compiled in Photoshop Contrast CS3 (Adobe) where brightness and contrast was adjusted equally across all images.
Sample collection for microarray and real-time PCR
The same blastocyst stage embryo pool was used for both microarrays and real-time PCR validation. Microarrays were performed on the five treatment groups (BLIVV, BLIVF, NT1, NT2, and NT3). The NTS group was only included in the real-time PCR analysis. BLIVV blastocyst stage embryos were collected from bred gilts on day 8 of gestation and BLIVF and NT blastocyst stage embryos were collected 6 days after embryo transfer resulting in an equal time postfertilization or activation for all treatment groups. Embryos were flushed from the uterus via midventral laparotomy (BLIVV) or euthanasia (BLIVF, NT, NTS) with PVA (0.1%) treated TL-HEPES medium. The BLIVF, NT, and NTS recipient pigs had undergone surgery to transfer the embryos and were therefore euthanized to collect the tissues because a second survival surgery was not within the limits of the approved ACUC protocol. Additionally, recipients that received transgenic NT or NTS embryos were incinerated postuterine collection so that transgenic or cells exposed to transgenic tissue did not enter the food chain in order to follow Food and Drug Administration guidelines. Embryos were searched in TL-HEPES and the zona pellucida was removed if present with 2% Pronase. Embryos that were positive for EGFP expression were snap frozen in liquid nitrogen for RNA analysis. Three pools of 10–15 embryos or 100 cells were collected for each treatment group.
RNA isolation and cDNA synthesis of the reference sample
Total RNA isolation for the reference sample has been described previously (Whitworth et al., 2005). Briefly, a SuperScript Indirect cDNA Labeling System (Invitrogen, Carlsbad, CA, USA) was used to convert 15 μg of total RNA to amino-allyl-labeled cDNA by incorporating amino-modified dUTP and dATP into the synthesized cDNA. The reference sample consisted of a large representation of nonreproductive and reproductive tissues across different stages of development including heart, kidney, liver, pituitary, hypothalamus, skeletal muscle, small intestine, spleen, corpus luteum, follicle, oviduct, endometrium, placenta, and fetus. It has also been shown that the reference sample produced a raw intensity of 50 (wavelength 532) on 96% of the spots on the microarray (Whitworth et al., 2005).
RNA isolation and amplification of the embryo and cells
Total RNA for the embryo samples was isolated using Trizol (Invitrogen) by following the manufacturer's instructions with the inclusion of phase lock tubes (Qiagen, Chatsworth, CA, USA) to separate the phases during extraction and the addition of pellet paint (EMB Chemicals, Gibbstown, NJ, USA) to help visualize the RNA pellet. The RNA amplification protocol has also been described previously (Whitworth et al., 2005). Fifty percent of the total RNA isolated was amplified with the Ovation nanosample RNA amplification system (NuGEN Technologies, Inc., San Carlos, CA, USA) following manufacturer's instructions. The Ribo-SPIA kit linearly amplified the limited amount of RNA in a three-step process and results in microgram amounts of double-stranded aminoallyl-labeled cDNA (acDNA).
Microarray reference design experiment
A reference design experiment was performed across the six treatment groups. The platform was a pig reproductive-tissue-specific 19,968 spot cDNA microarray that was created at the University of Missouri. The microarray method and annotation along with a detailed description of the reference sample is detailed in a previous published report (Whitworth et al., 2005) or at the following Website, (http://animalsciences.missouri.edu/faculty/prather/). The cDNAs present on the microarray were from a unigene set created from 27 EST libraries including ovarian follicles, corpora lutea, embryos, oocytes, oviducts, endometrium, conceptuses, and fetuses across different stages of the estrous cycle or pregnancy (Green et al., 2006; Jiang et al., 2001, 2004; Tuggle et al., 2003; Whitworth et al., 2004). There were six treatments with three biological replicates and each biological replicate was repeated on two microarrays (two technical replicates), resulting in a total of 36 measurements. The NTS samples are considered a follow up study and gene expression was not determined by microarray analysis.
Labeling efficiency
Labeling efficiency was determined spectrophotometricly by first measuring the total amount of synthesized nucleotides (total pmol nucleotides) and amount of dye (pmol Cy3 or Cy5). The number of nucleotides/dye molecule was then calculated.
Microarray analysis by Genespring 7.3.1
Results (.gpr) files were loaded into Genespring 7.3.1 (Agilent Technologies, Santa Clara, CA, USA) and Lowess normalization was performed. Results were filtered to remove bad spots and spots with low raw and control expression values (<100). Three comparisons were made with the analysis of variance tool using a parametric test with variance not assumed equal and a p-value cutoff of 0.05 with the Benjamimi and Hochberg False Discovery Rate multiple correction test. If a transcript was selected for real-time PCR validation, normalized expression values were then loaded into SAS 9.1 (Cary, NC, USA) and means were separated by Fisher's Least Significant Difference test (LSD, p-value cutoff of 0.05). The first analysis was performed on all six treatment groups comparing BLIVV, BLIVF, NT1, NT2, NT3, and cells. Subsequent analysis was performed comparing only the NT groups, NT1, NT2, and NT3. The third comparison was between BLIVV and all the NT groups (NT1, NT2, and NT3) pooled into a single treatment. The pooled comparison was performed in order to identify global differences between IVV and NT blastocyst stage embryos.
Identification of aberrantly reprogrammed transcripts
The microarray results were then used to identify aberrantly reprogrammed transcripts that had either over- and under-compensated gene expression after NT. The p-value cutoff for BLIVV and NT pool was increased from 0.05 to 0.20 in order to identify a broader range of potentially misregulated transcripts. This change in expression was later validated by real-time PCR to determine the soundness of using such a high p-value. Then, transcripts that were significantly different in the donor cell line when compared to either IVV or NT pool (p < 0.05) were identified. Transcripts that were different between BLIVV and NT pool and significantly different from the donor cell line were classified as aberrantly reprogrammed. If a transcript had higher normalized expression in NT pool than BLIVV it was classified as up-regulated. If a transcript had lower normalized expression in NT Pool it was classified at down-regulated. Transcripts were further classified as over- or under-compensated based on their expression level in the donor cell line. This is further explained with example gene expression patterns in Figure 1.

Protocol used to identify the 179 aberrantly reprogrammed transcripts after NT. Aberrantly reprogrammed transcripts were classified into one of four categories: (A) up-regulated and under-compensated expression, (B) down-regulated and under-compensated expression, (C) up-regulated and over-compensated expression, and (D) down-regulated and over-compensated expression. Four examples of each expression pattern are shown to the right including SEPT7 (A pattern), HIAT1 (B pattern), H1F0 (C pattern), and ANXA5 (D pattern).
Resequencing of ESTs from the 5′ direction
Some transcripts that were aberrantly reprogrammed were classified as unique or did not match a sequence from the RefSeq database, then the clone was resequenced from the 5′ direction to obtained further sequence information and reannotated using the NCBI RefSeq database following the same criteria as described previously. Sequencing was performed by the University of Missouri DNA Core.
Database for annotation, visualization, and integrated discovery (DAVID)
To determine which biological themes were affected by NT in the blastocyst-stage embryos, GenBank accessions for the up- and down-regulated genes identified in the BLIVV and NT pool comparison (P < 0.05) and the identified over- and under-compensated genes were uploaded into DAVID (Database for Annotation, Visualization and Integrated Discovery) Bioinformatics Resources (http://david.abcc.ncifcrf.gov/tools.jsp) (Dennis et al., 2003; Huang et al., 2009). This software provides an efficient means to extract biological features and meanings associated with large gene lists (Huang et al., 2009). The Homo sapiens genome was used as the background gene list, which allowed for identification of gene families that were enriched in the up- or down-regulated groups of genes and over- and under-compensated groups of genes (both up- and down-regulated). The enriched functional annotation terms were identified and listed according to their enrichment p-value (also known as EASE score) and fold enrichment score by DAVID.
Real-time PCR validation
Microarray expression patterns were then validated by real-time PCR with the remaining cDNA. Five transcripts were chosen for validation of the six treatment comparison (XIST, TFAM, RPL29, ALCAM, and HSPD1). Gene names, GenBank accessions, and functional annotation can be found in Table 1A. Fourteen transcripts were chosen to both validate the BLIVV and NT pool comparison and determine the effect of Scriptaid treatment. At least three transcripts from each expression pattern detailed in Figure 1 were selected; these included EIF3E, H3F3A, SEPT7 (Pattern A, up-regulated, under-compensated), ATP5A, HIAT1, GSTA3, NDUFB8 (Pattern B, down-regulated, under-compensated), COX5A, GPD1L, H1F0, SIRT1 (Pattern C, up-regulated, over-compensated), and CAPG, SRI, ANXA5 (Pattern D, down-regulated, over-compensated). Gene names and GenBank accessions can be found in Table 1B along with their functional annotation description. Oligonucleotides for each candidate gene were designed by using Primer Quest (IDT, Coralville, IA, USA) and ordered from IDT. Real-time PCR parameters have been described previously (Whitworth et al., 2005). Primer efficiency was performed on each primer set by using a serial dilution of cDNA from the reference sample. Real-time PCR was performed on a serial dilution of all seven treatments with the proposed housekeeping transcript, tyrosine 3-monooxygenase/tryptophan 5-monooxygenase activation protein, gamma polypeptide (YWHAG, NM_012479) (BLIVV, BLIVP, NT1, NT2, NT3, and cells) and Sus scrofa glyceraldehyde-3-phosphate dehydrogenase mRNA (GAPDH, DQ845173.1) (BLIVV, cells, NT pool, and NTS). The relative Ct (2−ΔΔCt) method was used to determine expression of candidate transcripts with the reference cDNA used as the calibrator sample. The BLIVV, BLIVF, NT1, NT2, NT3, cells, and the BLIVV, cells, NT pool, NTS validation was performed by using the Bio-Rad iQ SYBR Green Supermix following the recommended protocol from the manufacturer. A three-step protocol was used with a 60°C annealing temperature followed by a dissociation curve in the MyiQ single color real-time PCR detection system (Bio-Rad, Hercules, CA, USA). Each biological replicate was tested in triplicate resulting in nine Ct measurements/treatment. The statistical analysis on relative gene expression was performed by using Proc GLM procedure in SAS 9.1 and means were compared by using an LSD. Data were log transformed formed before statistical analysis if not normally distributed as evaluated by Proc Univariate in SAS.
Results
Pregnancy rates
The animal was considered pregnant if there was at least one blastocyst stage embryo present at the time of collection. Pregnancy rates for the day 6 NT collections were previously reported (Whitworth et al., 2009) and no significant differences were found between the activation groups (p > 0.05). Briefly, the average number of blastocyst stage embryos collected/pig for treatments BLIVV, BLIVF, NT1, NT2, NT3, and NTS was 9.0 (n = 15), 20.3 (n = 10), 8.2 (n = 11), 10.9 (n = 9), 8.6 (n = 11), and 6.6 (n = 5). The resulting pregnancy rates were 86.7, 100, 90.9, 100, 72.7, and 80% for BLIVV, BLIVF, NT1, NT2, NT3, and NTS.
Labeling efficiency
There was no difference in labeling efficiency between any of the treatment groups (p = 0.348) or between the blastocyst stage embryo and cells cDNAs (amplified cDNA) and reference cDNAs (unamplified cDNA) (p = 0.407). The mean labeling efficiencies for the amplified cDNA and the reference cDNA were 39.5 ± 6.3 and 45.5 ± 3.6 nucleotides/dye, respectively.
Microarray comparisons
The first comparison of BLIVV, BLIVF, NT1, NT2, NT3, and cells resulted in 1481 differentially expressed ESTs. Interestingly, 574 of the 1481 (38.8%) identified transcripts only aligned with other ESTs and were classified as unique. Annotation criteria were described previously (Whitworth et al., 2005) and were updated in 2009. Transcripts that were differentially represented between the six treatments are available in Supplementary File 1 (Supplementary Data are available online at http:ww.liebertonline.com/cell). Microarray expression data for the differentially expressed transcripts, HSPD1, XIST, TFAM, RPL29, and ALCAM are available in Table 2. A comparison between the three NT activations groups, NT1, NT2, and NT3 did not result in any differentially expressed transcripts; therefore, these groups were pooled to identify subsequent transcriptional changes. The BLIVV versus NT pool comparison (p < 0.05) resulted in 47 differentially expressed transcripts of which 20 were up-regulated and 27 were down-regulated relative to BLIVV and are available in Tables 3 and 4. Of the identified transcripts, 21 of the 47 only aligned with other ESTs and were classified as unique. To gain further information, unique clones that matched to the UMC EST were sequenced from the 5′ direction. Of the 77 transcripts that were resequenced, more useful annotations were obtained after sequencing from the 5′ direction. If an updated annotation was used for analysis this was noted in Tables 3 and 4.
Data are represented as mean ± standard error.
Superscript letters represent significant differences among treatments for the transcript present in the corresponding row (p < 0.05).
Genbank accessions and annotations that contain an * superscript have annotation that was obtained by sequencing the clone from the 5′ orientation. All other annotations were obtained by sequencing the clone from the 3′ orientation.
Genbank accessions and annotations that contain an * superscript have annotation that was obtained by sequencing the clone from the 5′ orientation. All other annotations were obtained by sequencing the clone from the 3′ orientation.
Identification of aberrantly reprogrammed transcripts
The BLIVV versus NT pool comparison (p < 0.20) resulted in 222 differentially expressed transcripts. The BLIVV versus cells and NT pool versus cells comparisons (p < 0.05) resulted in 1426 and 2367 differentially expressed transcripts, respectively. This resulted in 178 transcripts that were different between the BLIVV and NT pool comparison and also different between cells in either BLIVV and NT pool. The 178 transcripts are classified as aberrantly reprogrammed and are further categorized in Figure 1. The four expression patterns evaluated were (1) up-regulated in NT pool with under-compensated expression, (2) down-regulated in NT pool with under-compensated expression, (3) up-regulated in the NT pool with over-compensated expression, and (4) down-regulated in the NT pool with over-compensated expression. Identified transcripts and normalized expression values are available in Supplementary File 2.
Database for annotation, visualization, and integrated discovery (DAVID)
The significantly up-regulated themes in NT pool blastocyst stage embryos included chromatin packaging and remodeling, pre-mRNA processing, nucleoside, nucleotide, and nucleic acid metabolism, and cell cycle. The significantly down-regulated themes in the NT pool blastocyst stage embryos included protein metabolism and modification and protein biosynthesis. The significantly enriched themes identified in the over-compensated expression category (both up- and down-regulated) included chromatin packaging and remodeling and protein metabolism. The significantly enriched themes identified in the under-compensated expression category (both up- and down-regulated) included protein biosynthesis, protein metabolism, and modification and mRNA processing. Only one KEGG pathway was identified as being up-regulated, and that was the MAP kinase signaling pathway. The MAP kinase pathway was also identified as being over-compensated. Additionally, only one KEGG pathway was identified as being down-regulated and that was the oxidation phosphorylation pathway that was also identified as being as being under-compensated.
Real-time PCR validation
Microarray results were validated for the BLIVV–BLIVF–NT1–NT2–NT3–cells comparison and the BLIVV–Cells–NT pool comparison by real-time PCR. Statistical analysis showed that the housekeeping transcript YWHAG was significantly higher in the NTS treatment when compared to the six treatment treatments (p < 0.0001). However, GAPDH had consistent expression between NTS and the other treatments; therefore, YWHAG was used as the housekeeping transcripts for the BLIVV–BLIVF–NT1–NT2–NT3–cells comparison and GAPDH was used as the housekeeping transcript for the BLIVV–cells–NT pool comparison. Five differentially expressed transcripts were chosen for the IVV–IVF–NT1–NT2–NT3–cells comparison. Expression levels for both microarray and real-time PCR and p-values are summarized in Table 2. HSPD1 had significantly higher expression in the embryos when compared to the cells and this validated by real-time PCR. XIST expression was significantly higher in BLIVF when compared by both microarray and real-time PCR. TFAM had low expression in cells and this validated by real-time PCR; however, its higher expression in BLIVF did not validate. ALCAM had lower expression in BLIVV and higher expression in BLIVF, NT1, NT2, NT3, and Cells. ALCAM also validated by real-time PCR except for expression levels for NT1 were not significantly different than BLIVV. Last, RPL29 expression had high expression in cells when measured by microarray; however, this expression level was only numerically higher when measured by real-time PCR.
Interestingly, the BLIVV–Cells–NT pool comparison validated quite nicely even with the microarray p-value of 0.20. Of the 14 transcripts chosen between the BLIVV and NT pool comparison, 13 showed the same up- or down-regulated expression pattern by real-time PCR. Results are summarized in Figure 2. COX5A is the only transcript that did not significantly validate in the BLIVV–NT pool comparison; however, the p-value was 0.055. When comparing expression levels of the cells to BLIVV or NT pool, 9 of the 14 transcripts validated by real-time PCR. All five transcripts that did not validate had lower expression levels in the Cells when measured by real-time PCR when compared to microarray expression levels. These transcripts include EIF3E, SIRT1, CAPG, SRI, and ANXA5. Normalized and relative expression levels for both microarray and real-time PCR results and p-values are available in Supplementary Table 1.
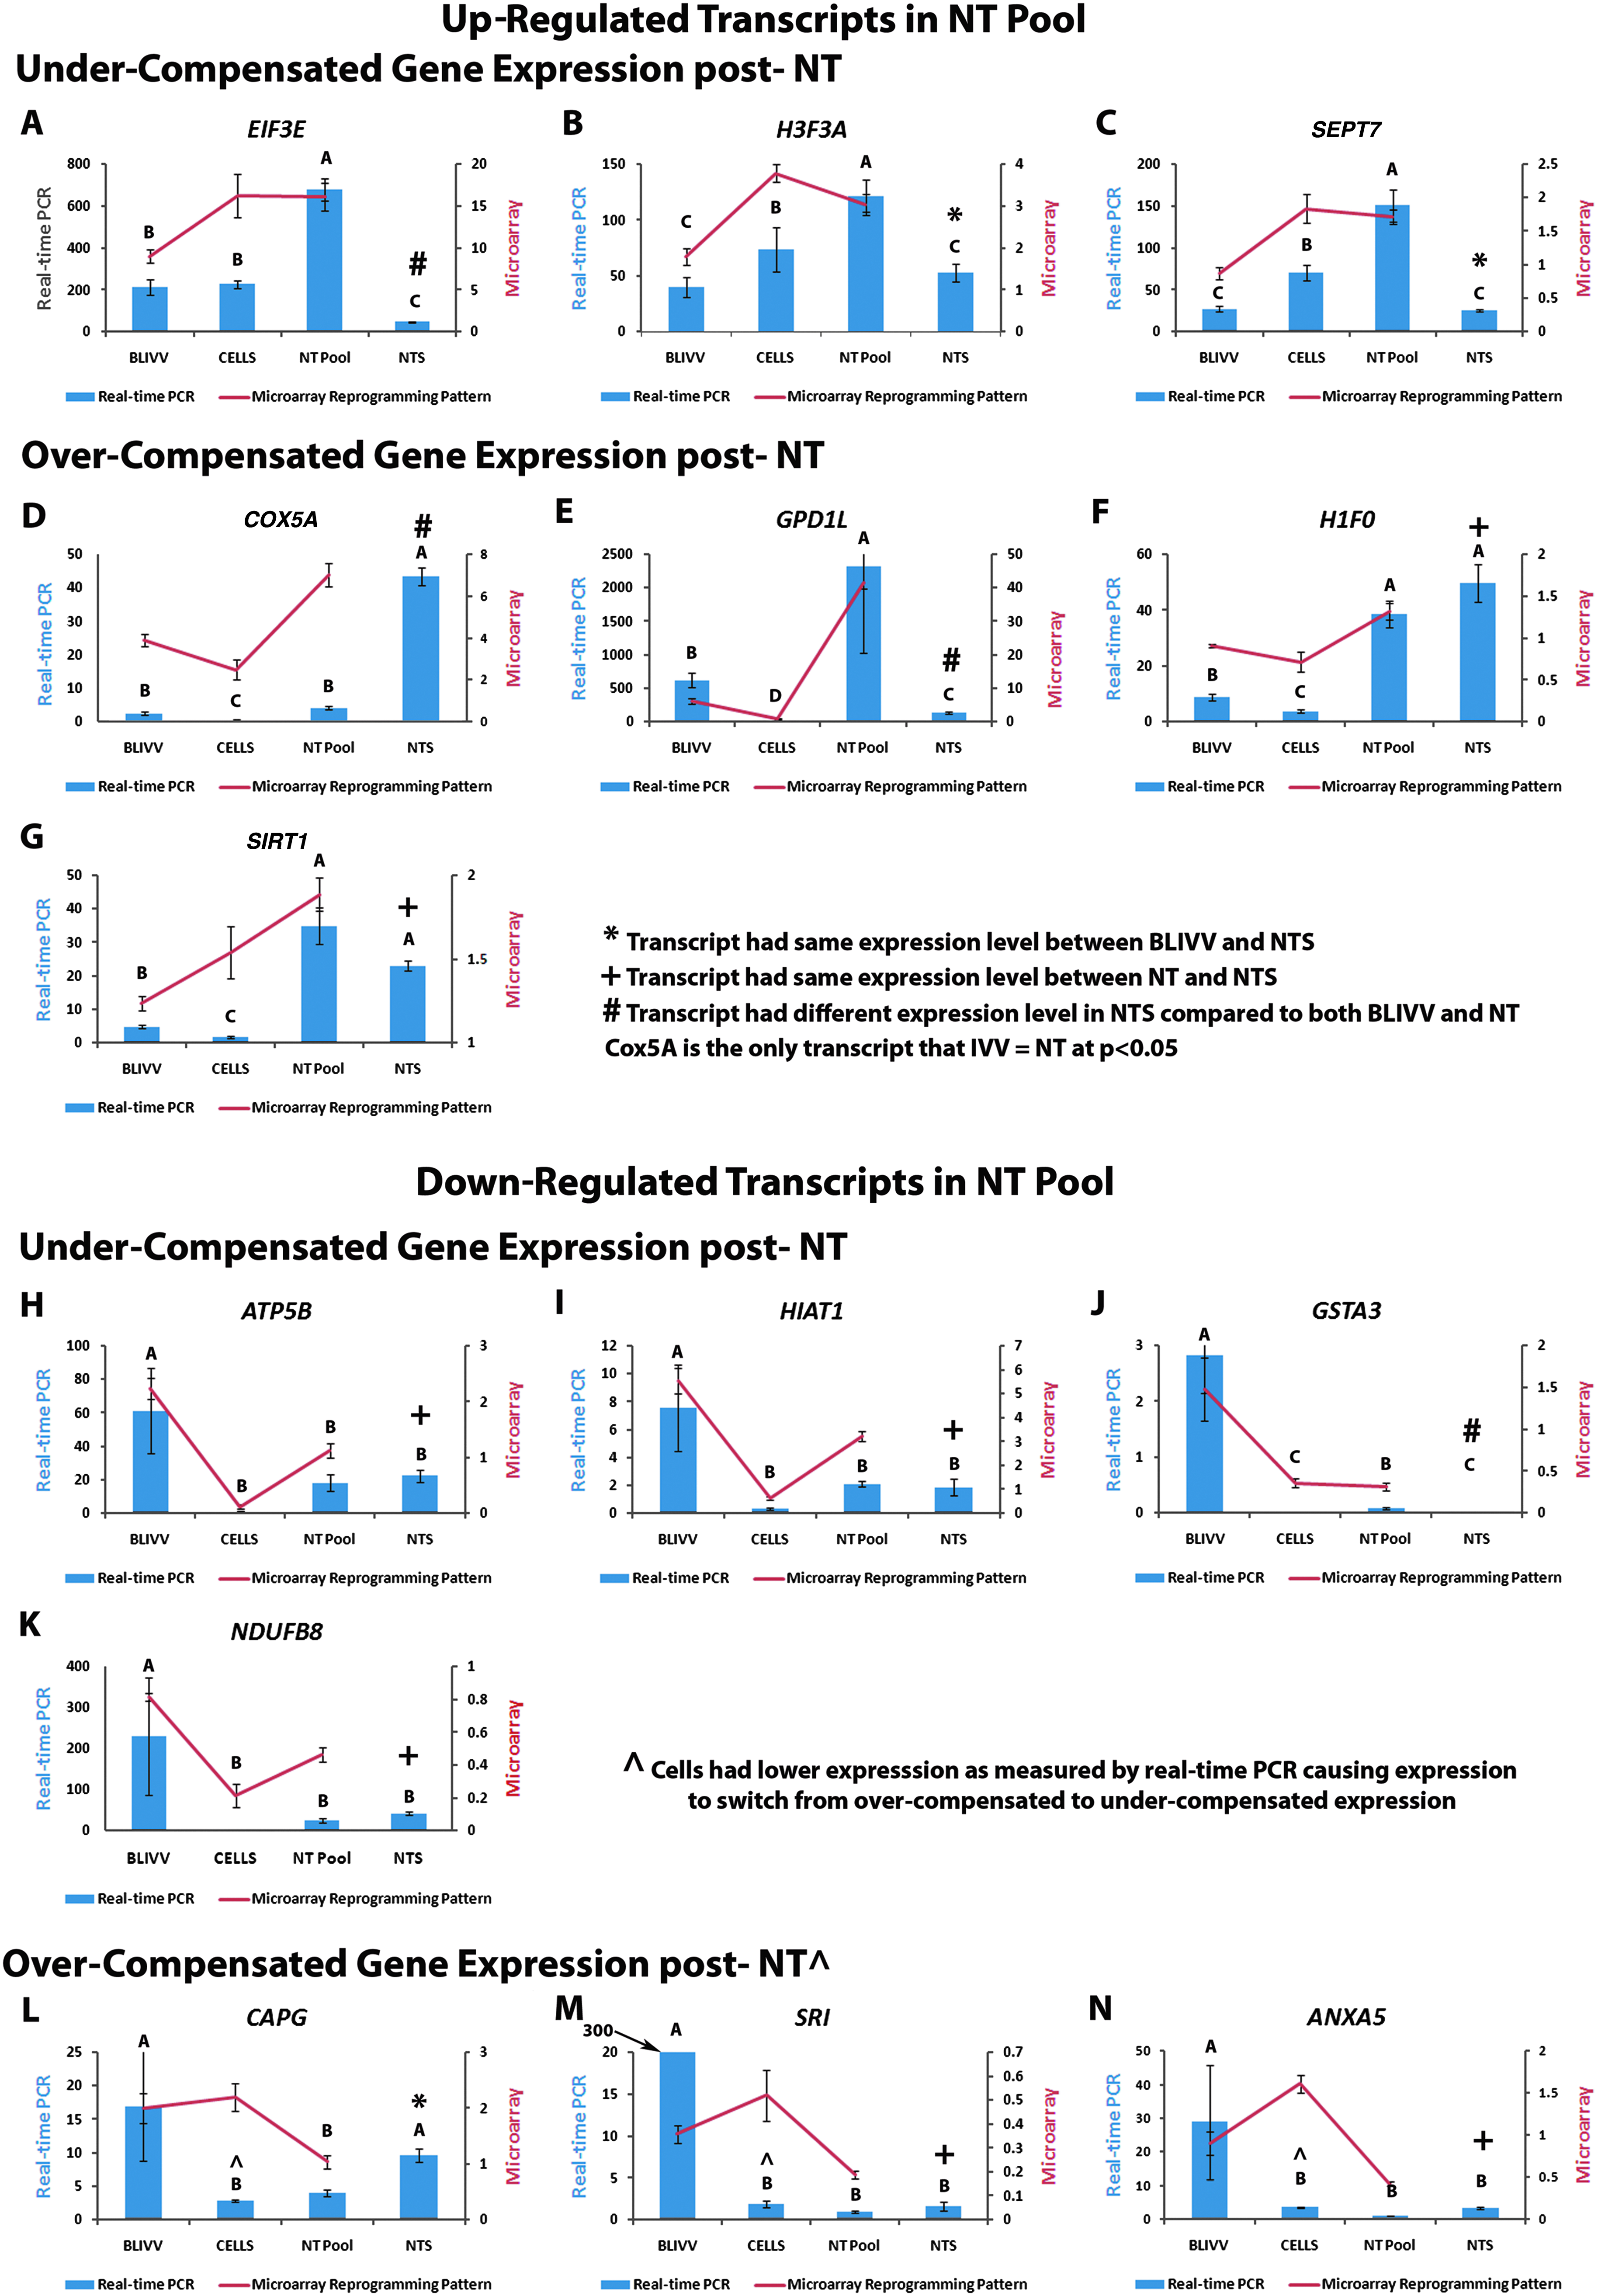
Microarray and real-time PCR expression patterns identified in aberrantly reprogrammed transcripts. The top of the figure lists the up-regulated transcripts identified in the NT pool by microarray. Real-time PCR expression is shown for BLIVV, CELLS, NT pool, and NTS. The transcripts are further characterized by under- and over-compensation as explained in Figure 1. The bottom of the figure lists the down-regulated transcripts identified in NT pool by microarray. Transcripts included on this figure include EIF3E (A), H3F3A (B), SEPT7 (C), COX5A (D), GPD1L (E), H1F0 (F), SIRT1 (G), ATP5B (H), HIAT1 (I), GSTA3 (J), NDUFB8 (K), CAPG (L), SRI (M), and ANX5A (N).
Inhibition of HDAC activity by Scriptaid
Scriptaid treatment for 14 h significantly reduced HDAC activity in nuclear extracts from NTS one-cell stage embryos compared to NT1 (non-Scriptaid-treated embryos) with mean HDAC levels of 3.54 ± 0.27 and 5.17 ± 0.66, respectively (p < 0.38). Scriptaid treatment was previously shown to be detrimental to development in BLIVF embryos and was therefore not measured in this assay (Zhao et al., 2010). Scriptaid treatment was not evaluated in NT2 and NT3 and was thus not reported.
Effect of Scriptaid on gene expression
In 50% (7/14) of the examined transcripts, relative gene expression was the same between the NT pool and NTS (p < 0.05) (Fig. 2). These transcripts included H1F0, SIRT1, ATP5B, HIAT1, NDUFB8, SRI, and ANXA5. Three transcripts had expression levels in NTS that were the same as BLIVV. In other words, Scriptaid treatment caused gene expression in these transcripts to return to levels that were the same as normal in vivo blastocyst stage embryos flushed directly from the pig and included H3F3A, SEPT7, and CAPG (p < 0.05) (Fig. 2). Four other transcripts had expression levels that were significantly different in NTS compared to both BLIVV and NT Pool including COX5A (p < 0.0001), which had very high expression in NTS and GPD1L, GSTA3 and EIF3E, which all had very low gene expression levels in NTS (p < 0.05) (Fig. 2). Message levels for both microarray and real-time PCR results and p-values are available in Supplementary Table 1.
Quantification of global methylation in NT embryos treated with Scriptaid
The 5-MeC mean intensity was not significantly different between the Scriptaid treated and nontreated blastocyst stage embryos (p < 0.37); however, it became quite apparent that the number of nuclei that stained positive were strikingly different between the treatments. The number of positively stained nuclei was then counted between the treatments and the non-Scriptaid treated blastocyst stage embryos did have more 5-MeC stained nuclei (15.0 vs. 5.3/embryo, p < 0.003; Fig. 3). The total cell numbers were not determined for these specific embryos; however, our lab has reported twice previously that Scriptaid did not affect cell number at the blastocyst stage (Zhao et al., 2009, 2010).

Evaluation of global DNA methylation in Scriptaid and nontreated blastocyst stage embryos by immunostaining with a mouse monoclonal anti 5′-Methylcytidine antibody. Blastocyst stage embryo from a reconstructed zygote that was not treated with Scriptaid postactivation (
Discussion
This study used microarray expression data to identify both differentially expressed transcripts between BLIVV, BLIVF, NT1, NT2, NT3, and the donor cell line and to determine which transcripts are either up- or down-regulated between BLIVV and the NT pool. Expression data from Cells was then added to this analysis to determine which transcripts had over- or under-compensated expression after NT. Last, it was determined that treatment with the HDACi, Scriptaid, did result in a small number of transcripts returning to the same expression level as BLIVV. Half of the examined transcripts had the same expression level in NT blastocysts regardless of Scriptaid treatment.
Although there have been reports that Scriptaid treatment improves cloning efficiency (Kishigami et al., 2006; Van Thuan et al., 2009; Zhao et al., 2009, 2010), there have been no reports of how Scriptaid affects gene expression after NT in the pig. One group examined changes in expression of imprinted genes (IGF2 and IGF2R), markers of pluripotency (CDX2, POU5F1, REX01, and NANOG), and HDAC2 after treating NT embryos with the HDACi, TSA (Cervera et al., 2009).TSA treatment only affected gene expression of NANOG by the blastocyst stage when compared to IVF embryos. Our study did not examine gene expression of these genes as they were not identified as being aberrantly reprogrammed by our microarray analysis.
There were significantly fewer 5-MeC positive nuclei in the Scriptaid-treated blastocyst stage NT embryos when compared to the nontreated embryos. Unfortunately, the acid treatment required for 5-MeC immunostaining in this experiment prevented two different DNA (Hoechst and DAPI; Sigma and Vector Laboratories, Burlingame, CA, respectively) specific dyes from functioning; therefore, total cell numbers for these specific embryos were not determined; however, previous studies (Zhao et al., 2009, 2010) in our lab showed that Scriptaid treatment did not affect total cell number at the blastocyst stage. TSA has been shown to decrease the expression of the DNA methylation enzyme, DNMT3B in mouse NT blastocyst stage embryos (Li et al., 2008b). DNMT expression has yet to be tested in the pig after TSA or Scriptaid treatment. TSA also increases methylation of the core histones, H3-K4, and H3-K9 in mouse one-cell and two-cell stage embryos; however, how histone methylation is modified by an HDACi treated is still not understood (Bui et al., 2010). The decrease in 5-MeC positive nuclei in Scriptaid treated embryos is an interesting observation and will require subsequent analysis to identify a mechanism.
DAVID analysis identified chromatin packaging and remodeling as an up-regulated biological theme in NT pool. After NT, the nucleus from the donor cell should be remodeled to be like that of a zygote so that it can recapitulate the same pattern of development observed in a normally fertilized embryo. There is both structural remodeling resulting in formation of the pronucleus and nuclear remodeling resulting in changes in chromatin structure (Whitworth and Prather, 2010). It is interesting that the chromatin packaging and remodeling theme is still up-regulated even at the blastocyst stage. In our study, four transcripts were up-regulated from this theme including two histones, H1F0 and H3F3A, as well as the histone deacetylase, SIRT1, and the nucleosome assembly protein, SET translocation (myeloid leukemia-associated) (SET, also called SET nuclear oncogene, NM_003011). H1F0 and H3F3A are part of a class of histones called replacement histones that are replication or cell-cycle independent and their corresponding mRNAs are also polyadenylated. The amplification kit used in this study relied on oligo dT priming of the mRNA, which may explain why only replacement histones were identified as being aberrantly reprogrammed. In mouse embryos, SIRT1 has been shown to play an important role in DNA damage response and helping maintain proper chromatin structure and formation of DNA damage repair foci (Wang et al., 2008). Of the transcripts identified as being part of the up-regulated chromatin structure pathway, only expression of H3F3A returned to normal BLIVV levels after Scriptaid treatment. H1F0 and SIRT1 remained up-regulated and SET was not evaluated by real-time PCR. The upregulation of the chromatin structure and remodeling theme in NT blastocyst stage embryos suggests that even after 6 days of development in the pig uterus, there is still aberrant nuclear remodeling.
The oxidative phosphorylation KEGG pathway was also identified as being significantly down-regulated in NT Pool and two of the transcripts were further classified as having under-compensated expression (Fig. 2H and K). ATP is generated in preimplantation embryos via mitochondrial oxidative phosphorylation (reviewed extensively by Van Blerkom, 2009). Three nuclear encoded transcripts that function along the mitochondrial respiratory chain were identified as being down-regulated in the NT pool and included ATP5B, NDFU8, and ATP6V1E1 (ATPase, H + transporting, lysosomal 31kDa, V1 subunit E1, X76228). The total number of mitochondria per embryo remains constant during preimplantation development as mitochondrial duplication does not begin until after implantation (El Shourbagy et al., 2006; Harvey et al., 2007; Shoubridge and Wai 2007). During the NT process, the oocytes are enucleated, thus removing not only the metaphase II plate, but also the associated cytoplasm containing mitochondria; therefore, the enucleation process is likely causing a decrease in total mitochondria, but the identified down-regulated oxidative phosphorylation transcripts are all nuclear encoded; therefore, enucleation would not be causing this decrease in transcript abundance. Interestingly, the terminal enzyme of the mitochondrial respiratory chain, COX5A (Capaldi 1990), was up-regulated in NT pool at a nearly significant level (p < 0.055), perhaps compensating for the decreased amount of available ATP; however, this would need to be further evaluated. Scriptaid treatment did not influence the abundance of ATP5B or NDUFB8 (ATP6V1E1 was not evaluated); however, Scriptaid treatment increased COX5A expression to a level that was significantly higher than both BLIVV and NT pool. Comparing ATP levels between NT embryos and normal embryos would make an interesting follow-up experiment to help clarify the observed downregulation of the oxidative phosphorylation KEGG pathway.
Expression of two aberrantly reprogrammed transcripts involved in blastocyst structural integrity was corrected by Scriptaid treatment, CAPG (down-regulated) and SEPT7 (up-regulated). CAPG is a member of the gelsolin/villin family of actin-regulatory proteins that caps the barbed ends of actin filaments in a Ca2+-dependent manner (Mishra et al., 1994; Witke et al., 2001). CAPG knockout mice have normal sized litters indicating a decrease in CAPG does not prevent embryo development. However, these mice have dysfunctional actin-based motility of their macrophages (Witke et al., 2001) resulting in a net filament depolymerization. The authors also conclude the loss of CAPG would block the ability of second messengers to regulate actin filament capping. There is an overlap of capping proteins present that could be compensating for decreased CAPG activity in the NT embryos including CAPZA. Another study examining day 30 placenta cDNAs from the same treatments showed that CAPZA1 was down-regulated in NT illustrating an actin-filament capping defect persists throughout development of NT conceptus (Whitworth et al., 2010). In contrast, SEPT7 was up-regulated in NT pool. Septins are GTP/GDP binding proteins that assemble into filamentous cytoskeletal polymers (Sirajuddin et al., 2007). Knocking down expression of SEPT7 showed that it is required for normal organization of the actin cytoskeleton and actin dependent processes (Kremer et al., 2005, 2007), but there is no available data on the effect of increased SEPT7 expression. Gene expression of both of these cytoskeletal factors was corrected after treatment with Scriptaid perhaps resulting in a structural morphology that more closely resembles a normal in vivo-derived embryo.
Transcriptional profiling identified differentially expressed transcripts between BLIVV, BLIVF, NT, and the donor cell line. A variety of different patterns were discovered including genes that were correctly reprogrammed as well as those that were over- or under-compensated. Treatment with Scriptaid has been shown to improve the development of NT embryos and could correct the expression pattern of some, but not all transcripts. Although these studies shed light on the affects of Scriptaid on the NT embryo, it is clear that additional steps need to be taken to improve the remodeling and reprogramming that occurs to a nucleus after NT (Whitworth and Prather, 2010).
Footnotes
Acknowledgments
This project was supported by National Research Initiative Competitive Grant No. 2005-3502-15549 from the USDA Cooperative State Research, Education, and Extension Service and Food for the 21st Century at the University of Missouri. The authors acknowledge Dr. Bill Spollen for updating the microarray annotation in 2009. Sample collections were assisted by Bethany Bauer, Melissa Samuel, Dr. Eric Walters, Dr. Jeffrey J. Whyte, Dr. S. Clay Isom, August Rieke, and Lonnie Dowell. Embryo transfers were performed by Dr. Clifton Murphy. Nuclear transfers for the 5′ methyl cytosine analysis were performed by Dr. Juide Mao, Lisa Tracy, and Jennifer Teson.
Author Disclosure Statement
The authors declare that no conflicting financial interests exist.
References
Supplementary Material
Please find the following supplemental material available below.
For Open Access articles published under a Creative Commons License, all supplemental material carries the same license as the article it is associated with.
For non-Open Access articles published, all supplemental material carries a non-exclusive license, and permission requests for re-use of supplemental material or any part of supplemental material shall be sent directly to the copyright owner as specified in the copyright notice associated with the article.