
Abstract
Abstract
To date, the genome-wide DNA methylation status of cloned pigs has not been investigated. Due to the relatively low success rate of pig cloning by somatic cell nuclear transfer, a better understanding of the epigenetic reprogramming and the global methylation patterns associated with development in cloned pigs is required. In this study we applied methylation-specific digital karyotyping tag sequencing by Solexa technology and investigated the genome-wide DNA methylation profiles of peripheral blood cells in cloned pigs with normal phenotypes in comparison with their naturally bred controls. In the result, we found that globally there was no significant difference of DNA methylation patterns between the two groups. Locus-specifically, some genes involved in embryonic development presented a generally increased level of methylation. Our findings suggest that in cloned pigs with normal phenotypes, the DNA methylation pattern is quite normal, and that DNA methylation changes in some genomic regions are compatible with normal development.
Background
In most mammalian species used for cloning, including the pig, the survival rate to birth for a cloned blastocyst is only about 1 to 5%. Most of the cloned embryos die during postimplantation development, and the few embryos that develop to term are frequently weak or even malformed. Many defects have been described in conceptuses and neonates derived from SCNT (Farin et al., 2006). Most of the observed defects involve abnormal placentation (Cibelli et al., 2002). Interestingly, cloned animals with abnormal phenotypes can in many cases be naturally bred or recloned with the resulting offspring having normal phenotypes (Cho et al., 2007). This indicates that defects resulting from cloning are not genetic but epigenetic due to inefficient nuclear remodeling as a consequence of the SCNT procedure. Thus, epigenetic regulatory factors are interesting candidates in the search for improvements of the SCNT success rate.
DNA methylation in mammals is one of the most studied epigenetic regulatory mechanisms. DNA methylation involves transfer of a methyl group to cytosine in the CpG dinucleotide by the family of DNA methyl transferases that establish and maintain methylation patterns (Bird, 1992; Klose and Bird, 2006). DNA methylation can regulate many different genomic properties and can be maintained through mitosis and meiosis. In the process of establishing the global DNA methylation pattern, the mammalian genome undergoes a precise spatial and temporal remodeling of DNA methylation during early embryonic development, which possibly continues during life (Reik et al., 2001). One key role of DNA methylation is to control gene expression by repressing transcription of methylated sequences. Often such regulatory methylation is located in promoter CpG islands (CGIs). DNA methylation is essential for normal development as, for example, the absence of de novo methylation causes death during early mouse embryonic development. Moreover, the loss of correct DNA methylation leads to apoptosis in normal cells and even in cancer cell lines (Feinberg, 2007).
To date, only a limited number of studies have addressed DNA methylation in cloned pigs. One study reported that the methylation status of cloned pig embryos, by examining centromeric satellite and PRE-1 methylation, was relative normal (Kang et al., 2001). Another study reported that the methylation patterns of many CpGs were differing between cloned pig embryos and normal controls (Bonk et al., 2008). Moreover, a study examined the methylation pattern of the IFG2-H19 differentially methylated regions (DMRs) and found that the CTCF3 and DMR2 loci of the IGF2 gene showed abnormal methylation in cloned fetuses (Han et al., 2008). One unsolved question is whether such aberrations in DNA methylation persist throughout the life of cloned pigs, and to date, genome-wide DNA methylation pattern analysis for full-term cloned pigs has not been described. Thus, it is of great interest to evaluate the DNA methylation status in genome of cloned pigs with normal phynotypes.
To compare the genome-wide DNA methylation status of phenotypically normal cloned pigs and naturally bred controls, we here used a recently developed technique involving methylation-sensitive enzyme-based production of DNA tags from unmethylated sites followed by massively parallel sequencing of the tags (Li et al., 2009). We found a general similarity in the DNA methylation profiles between the two groups, although some genomic regions showed differences. This result suggests that phenotypically normal cloned pigs have obtained quite a normal pattern of DNA methylation and that minor changes are compatible with normal development.
Materials and Methods
Pig samples
Cloned pigs and naturally bred control pigs were obtained from the Faculty of Agricultural Sciences, Aarhus University. Blood samples were collected from one litter of cloned pigs and one litter of control pigs. The cloned litter consisted of four male pigs, which were obtained by the HMC procedure from the cell line LW1-2 as described previously (Du et al., 2007). The LW1-2 cell line originates from ear cell fibroblasts of an offspring of a sow, which is a hybrid of Landrace and Yorkshire and a Duroc boar. After birth, microsatellite DNA analysis confirmed that the cloned litter of pigs was genetically identical to the original LW1-2 cell line. The control litter of four male pigs was naturally bred and genetically comparable to the clones, that is, a hybrid of Landrace, Yorkshire, and Duroc. The pigs were raised in adjacent identical pens and given continuous access to a standard commercial feed ration and water. All blood samples were collected at 6 weeks after birth.
Genomic DNA isolation, tag library construction, and Solexa sequencing
DNA was isolated from blood samples using DNeasy® Blood & Tissue Kit (Qiagen, Chatsworth, CA) according to the manufacturer's protocol. The construction of methylation specific digital karyotyping (MSDK) tag libraries followed the protocol described previously (Li et al., 2009). Briefly, for each sample, we digested 4 μg genomic DNA with methylation-sensitive mapping enzyme MluI (New England Biolabs, Beverely, MA), ligated DNA to a biotinylated linker, and finally fragmented the DNA by NlaIII (New England BioLabs). As MluI only cuts unmethylated regions, we captured DNA fragments ligated with biotinylated linkers by streptavidin-conjugated beads to separate unmethylated and methylated fragments. Controls for unspecific binding of fragments without biotinylated linker were included. The isolated DNA fragments were ligated with a linker (N) containing a Type IIS restriction enzyme (tagging enzyme) MmeI (New England Biolabs) recognition site and after MmeI digestion short sequence tags (17 bp) were generated. The tags were ligated with a P7 linker and amplified by polymerase chain reaction (PCR) using Phusion polymerase (Finnzymes) and primers N and P7. The sequences of the linkers, primers, and PCR procedure are available in the Supplementary data (see online supplementary data at www.liebertonline.cell/com). PCR products were purified using a QIAquick MiniElute kit (Qiagen) and stored as a library for each sample.
Before Solexa sequencing, conventional clone sequencing by the Sanger method was performed to verify the library quality. PCR products from the pig samples and the bead controls were ligated with T-easy vector (Promega, Madison, WI), and transformed into competent DH5α bacteria (Takara, Japan). Plasmid DNA was purified from 5 to 10 clones of each PCR reaction and analyzed by conventional sequencing. After quality validation of the libraries, massively parallel sequencing-by-synthesis (SBS) was performed using illumina cluster generation (Illumina, San Diego, CA) and the 1G Genome Analyzer (Illumina) according to the manufacturer's instructions. All reagents were purchased from Illumina Inc.
Data analysis and statistics
The final build (Sscrofa10) of the pig genome was downloaded from Ensembl database (ftp://ftp.sanger.ac.uk/pub/S_scrofa/assemblies/PreEnsembl_Sscrofa10) and annotated by blasting to human genome in RefSeq database (http://www.ncbi.nlm.nih.gov/refseq). In order to avoid ambiguous mapping we simulated MluI enzyme digestion of the pig genome on the basis of the pig genome sequences and constructed a virtual MluI tag library. Briefly, we located the predicted MluI sites, identified the nearest NlaIII sites in both directions, and took the derived DNA fragments as the reference for mapping. We also removed all virtual tags that were not unique in the genome to ensure unambiguous mapping.
We extracted the 17-bp tags from all reads of each individual sample of the 1G Genome Analyzer with Solexa pipeline and applied the MAQ (mapping and assembly with qualities) algorithm (Li et al., 2008) to map all tags back to the virtual library to determine chromosomal position. We defined two types of mapping quality scores according to the description in the MAQ manual: the low-confidence type with a mapping quality score more than zero (MQ0), and the high-confidence type with a mapping quality score more than 20 (MQ20). As described in the MAQ manual, if a read can be mapped to several equally best positions, MAQ will randomly choose one position and give the alignment a zero mapping quality. But a tag with MQ20 should have 1% error rate in principle. SNPs and sequencing errors are considered in calculating this score. We used MQ0 as a low-confidence criterion for addressing whether a tag can be mapped back to the genome, and MQ20 as a criterion for collecting high-confidence tags used for data analysis.
The tag sites were also divided into repeat sequences according to Repeatmasker (Smit et al., n.d.) and nonrepeat sequences. The tag sites located in repeat sequences were classified into different repeat categories and analyzed according to the counts of MQ0 tags by the Wilcoxon rank-sum test (Wilcoxon, 1945). Tag sites located in unique sequences were filtered by two standards: generally, we filtered out the tag sites that have a mean tag count among all libraries less than 5 and kept the rest; however, we also kept the tag sites which, among all libraries, have a mean tag count less than 5 but have a standard deviation equal or greater than 5, thus reflecting the great variation among samples for certain tag sites. After filtering, the remaining tags were normalized for their MQ20 tag numbers by dividing the tag count of each MluI site in a library with the total tag numbers in the library and clustered by “pvclust” package (Suzuki and Shimodaira, 2006) from publicly available software R (www.r-project.org, Vienna, Austria) to group samples. The p-value of a cluster is a value between 0 and 1, and indicates how well the cluster is supported by data. Pvclust provides two types of p-values (%) on the edge of the cluster: AU (approximately unbiased) p-value and BP (bootstrap probability) p-value. AU p-values are computed by multiscale bootstrap resampling, and BP p-values are computed by normal bootstrap resampling. Clusters with AU p-values larger than 95% are strongly supported by the data.
A Poisson-based significance analysis algorithm (SA) (Cai et al., 2004) was used to perform chi-square tests for checking the variance within cloned pigs and their controls and pair wise comparison of methylation status for individual genomic loci between cloned pigs and their controls. The p-values were calculated from raw tag counts and adjusted by false discovery rate (FDR) (Benjamini et al., 2001) to correct for multiple comparisons. We identified the genes neighboring interesting tag sites and analyzed their potential functional involvement in molecular networks using Ingenuity Pathway Analysis (Ingenuity Systems, www.ingenuity.com, Redwood City, CA). Each network was given a score defined as −log (right-tailed Fisher's Exact Test p-value).
Results
Tag sequencing and mapping
We constructed a virtual MluI tag library for tag mapping. In silico analyses showed that there are 17,683 recognition sites for the MluI restriction enzyme in the available pig genome sequence. We obtained 35,121 virtual fragments by simulating the digestion with MluI and the fragmenting enzyme NlaIII of the pig genome under the hypothesis that all cytosines are unmethylated. Only 122 MluI fragments lack internal NlaIII recognition sites. The majority of virtual MluI/NlaIII fragments are shorter than 1000 bp, and the length distribution of fragments is presented in Supplementary File 1. We found 1501 MluI recognition sites (8.5% of all sites) to be located in CGIs when defining CGIs by the following three criteria; GC content >50%, ratio of the observed CpGs to the expected CpGs >0.6, length >400 bp. A total of 3267 MluI recognition sites (18.5% of all sites) are located within repeat sequences according to Repeatmasker (Smitet al., n.d.).
Conventional sequencing showed that correct tag inserts were found in the vast majority of sample clones, whereas none of the bead controls presented correct tag inserts (data not shown). After Solexa sequencing, we applied MAQ software to map the tags back to the genome. We obtained 6,503,679 tags in average according to the MQ0 criterion, and 1,400,745 tags in average according to the MQ20 criterion (see Materials and Methods). On average, 81.50% of the tags obtained from the samples could be mapped back to the virtual MluI tag library (Supplementary File 1). Among 17,683 MluI recognition sites, there were only 247 “empty” sites to which no tags could be mapped back. Thus, 98.6% of the sites are mappable. Among the 3267 sites located in repeat sequences and the 1501 sites located in CGIs, only 67 and 11 “empty” sites were found, giving us 97.8% and 99.3% mappable sites, respectively. Detailed information about the libraries is available in Supplementary File 2.
Overview of DNA methylation patterns
For the analysis of genomic repeat families, we isolated tags located in genomic repeat sequences and analyzed them according to MQ0 tag counts, considering that all tags mapped back to the genome with a tolerance of low-confidence mapping based on the MAQ manual (Supplementary File 2). The summery of collected tags information is presented in Figure 1, including the distribution of MluI recognition sites in different categories of repeat sequences and the result of a Wilcoxon rank-sum test comparison of the methylomes of cloned pigs and controls. The p-values were adjusted by FDR to correct for multiple comparisons. Notably, none of the repeat categories showed significant differences in the methylation level between the two groups (FDR p < 0.05).
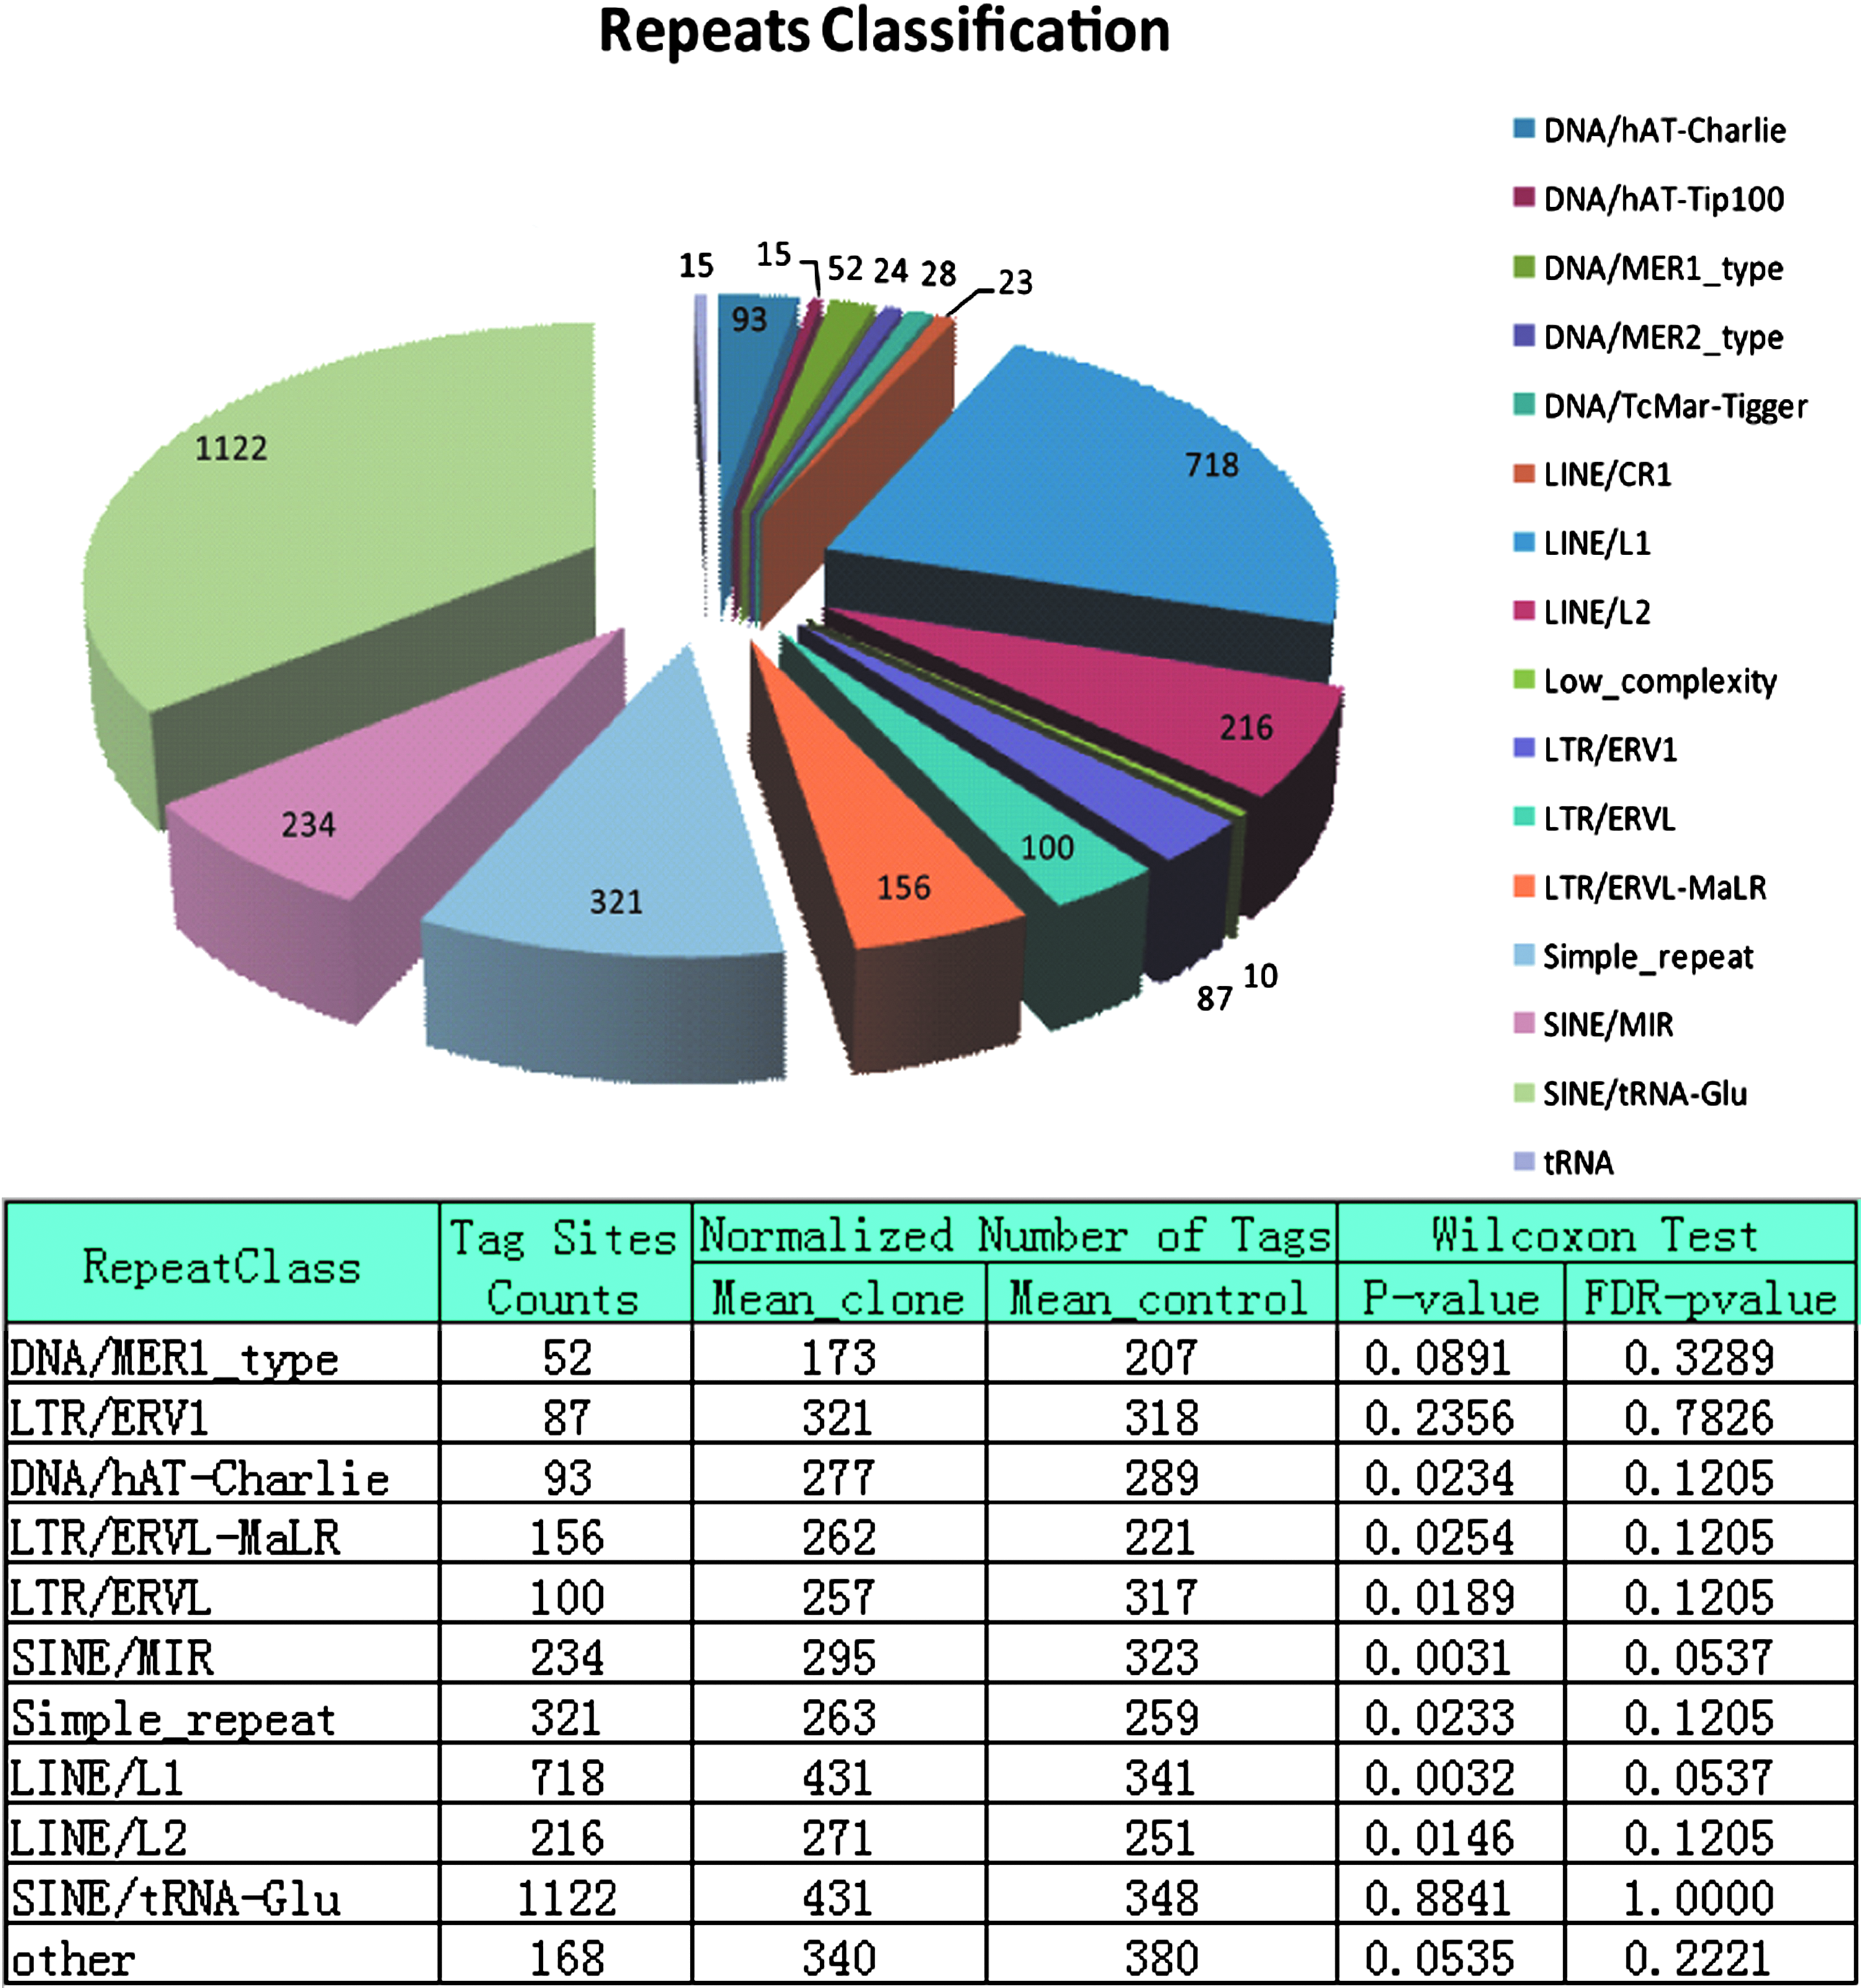
Distribution of MluI sites and summary of tag information obtained for repeat sequences. The distribution of MluI recognition sites in different classes of repeat sequences is presented in the top pie chart, and the bottom table summarizes the statistics of the counting results using Wilcoxon rank-sum test for the tags representing different classes of repeat sequences in cloned pigs and in vivo controls. A stringent FDR-adjusted p-value of 0.05 is used to identify significantly different loci.
For unique sequences, we used the MQ20 tag counts for analysis. After filtering out 6146 tag sites, we normalized the tag counts of the remaining 10,424 tag sites and performed hierarchical clustering with an algorithm, “pvclust,” (Suzuki and Shimodaira, 2006) based on Pearson's correlation coefficient. This analysis groups samples by measuring the similarity between two DNA methylation patterns represented by tag position and counts. Pvclust calculates p-values for hierarchical clustering via multiscale bootstrap resampling. Figure 2 provides an overview of the hierarchical clustering of DNA methylation patterns for the cloned and control samples. In the tree presentation, the whole sample set was clustered into two main branches, one with clone 3, and the other with the other seven samples. This branch was further divided into two groups and a subgroup. As indicated by the highlighted rectangle, the cluster with AU p-value of larger than 95% was strongly supported by data. In summary, the cluster analysis indicated that cloned and control samples tended to be mixed rather than to belong to distinct groups, indicating that these two sets of samples do not have principally different patterns of DNA methylation.
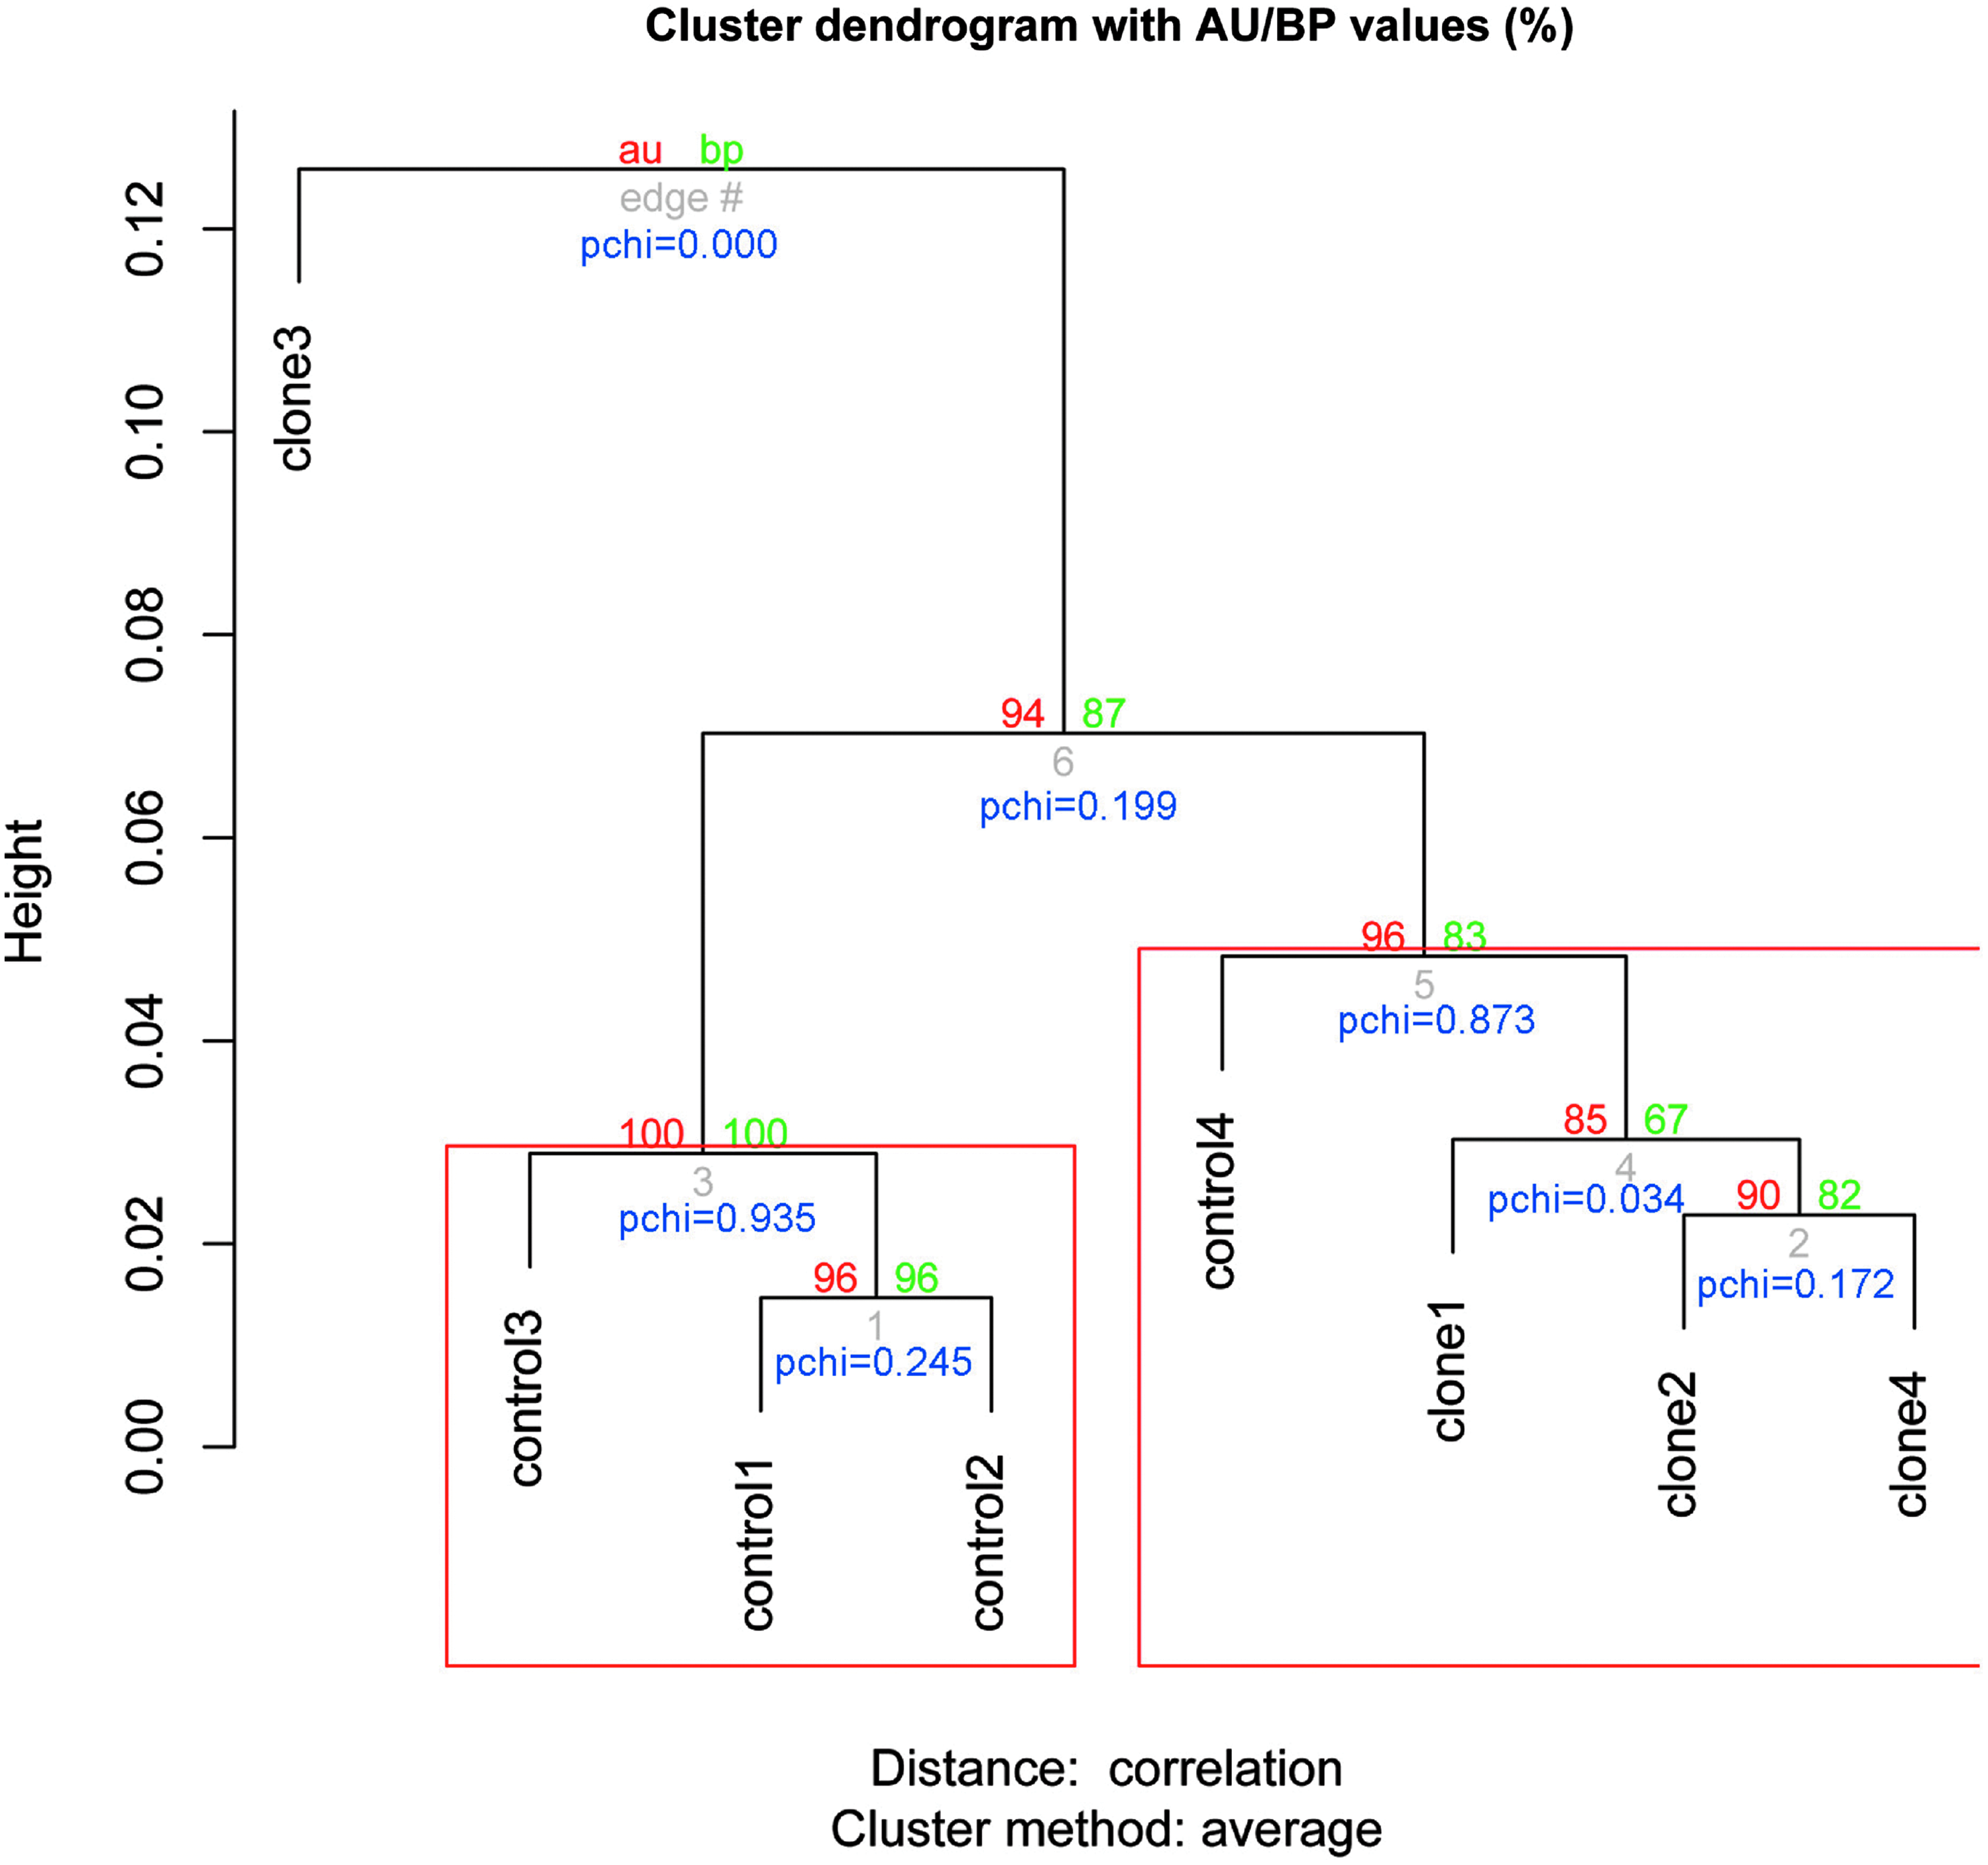
Hierarchical clustering of DNA methylation profiles for all cloned and control pigs. Depicted is the hierarchical clustering of DNA methylation data for all eight pig samples. The p-value of a cluster is a value between 0 and 1, which indicates how well the cluster is supported by data. Pvclust provides two types of p-values (%) on the edge of the cluster: AU (approximately unbiased) p-value and BP (bootstrap probability) p-value. AU p-values, shown in red, are computed by multiscale bootstrap resampling, and are better approximations to unbiased p-values than the BP value, shown in green, computed by normal bootstrap resampling. Clusters with AU larger than 95% are highlighted by rectangles and are strongly supported by the data. A p-value of a chi-square test based on asymptotic theory marked as “pchi” is provided below the edge of the cluster.
Pairwise comparison of methylation at individual genomic loci
To further check the variance within the four cloned pigs and the four control pigs, we used a Poisson-based SA algorithm with chi-square test to simultaneously calculate p-values (FDR adjusted) for raw tag counts of each tag site over libraries. Figure 3 present the cumulative curves for the generated p-values. The analysis indicated that there was more variance within the group of cloned pigs than in the group of control pigs.
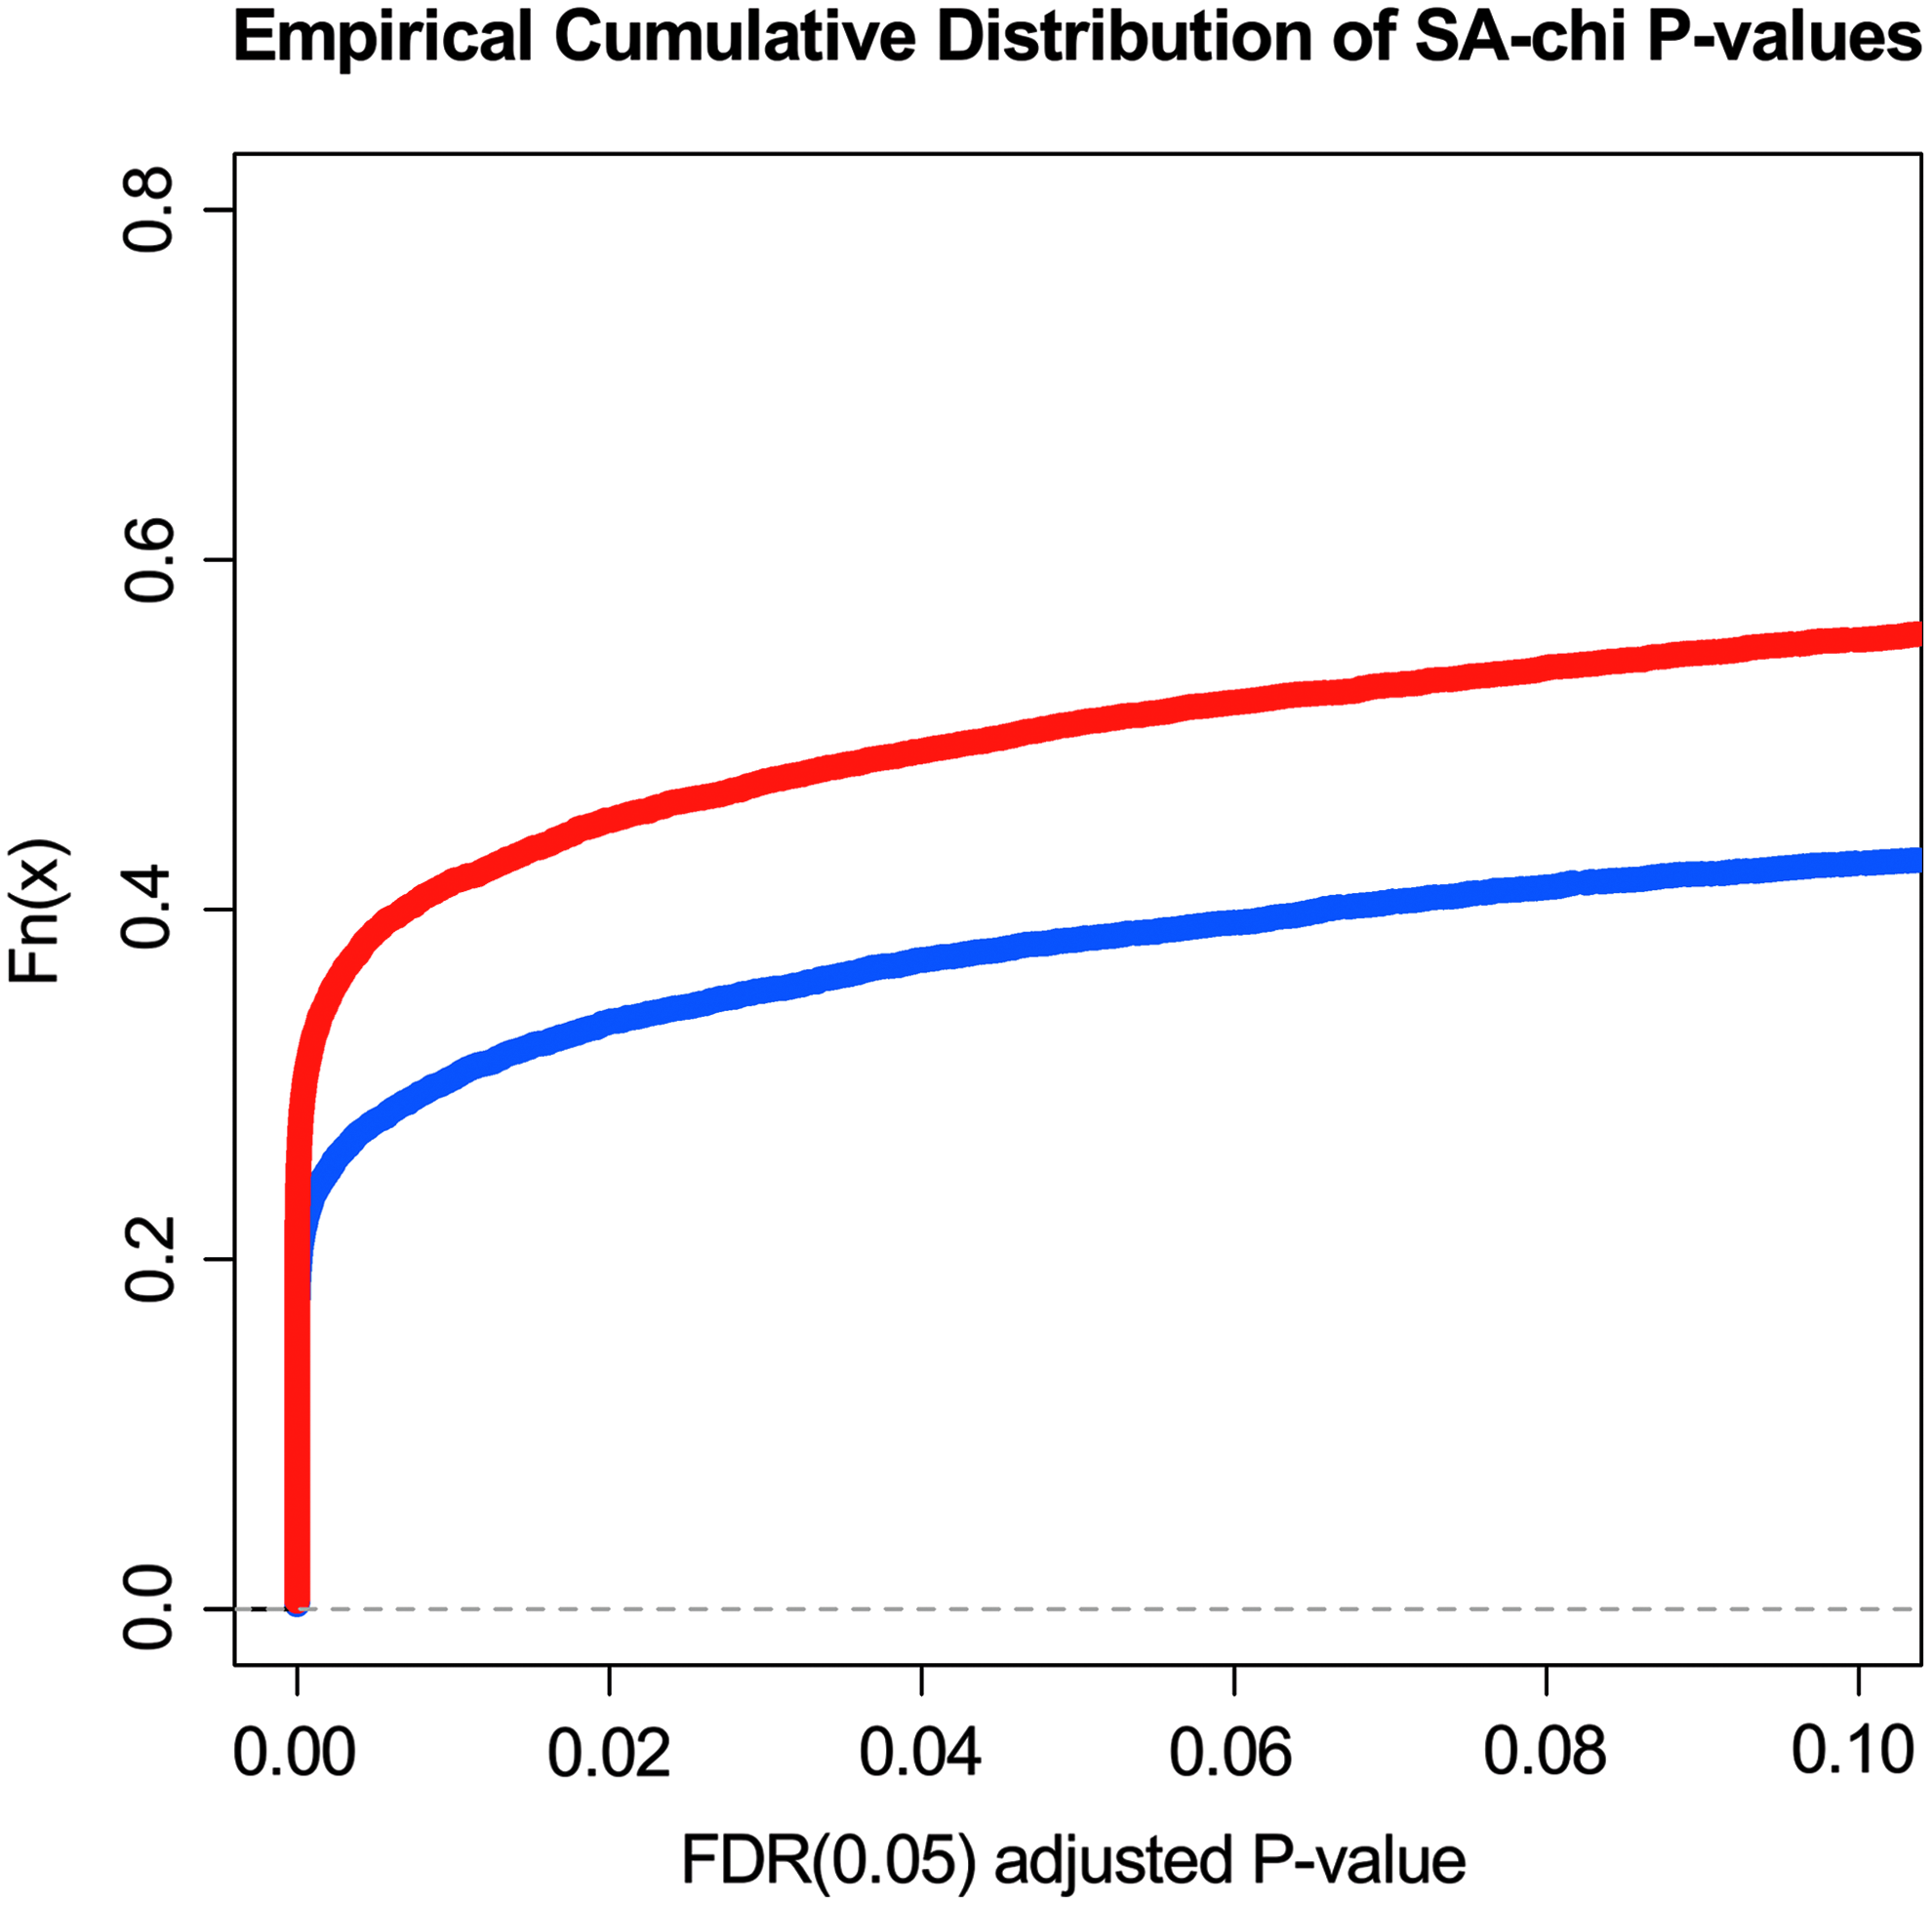
Cumulative curves of SA-chi p-values for cloned pigs and control pigs. This figure shows the cumulative curves of SA-chi P values for cloned pigs and control pigs. The curve for control samples is marked with blue color; the curve for cloned samples is marked with red color.
We also used the Poisson-based SA algorithm to perform pairwise comparisons between the methylation-specific tag libraries of the cloned pigs and their controls to identify individual genomic loci having significantly different DNA methylation status. We identified 854 significantly different tag sites out of 10,424 (FDR p < 0.05), giving a percentage of 8.2%. Among these 854 tags, 138 tags were located in CGIs. Figure 4 shows the general distribution of the data for these tag sites, indicating heavier average methylation for cloned pigs than for controls. Detailed information on the pair wise comparison of specific genomic loci is included in Supplementary File 3.
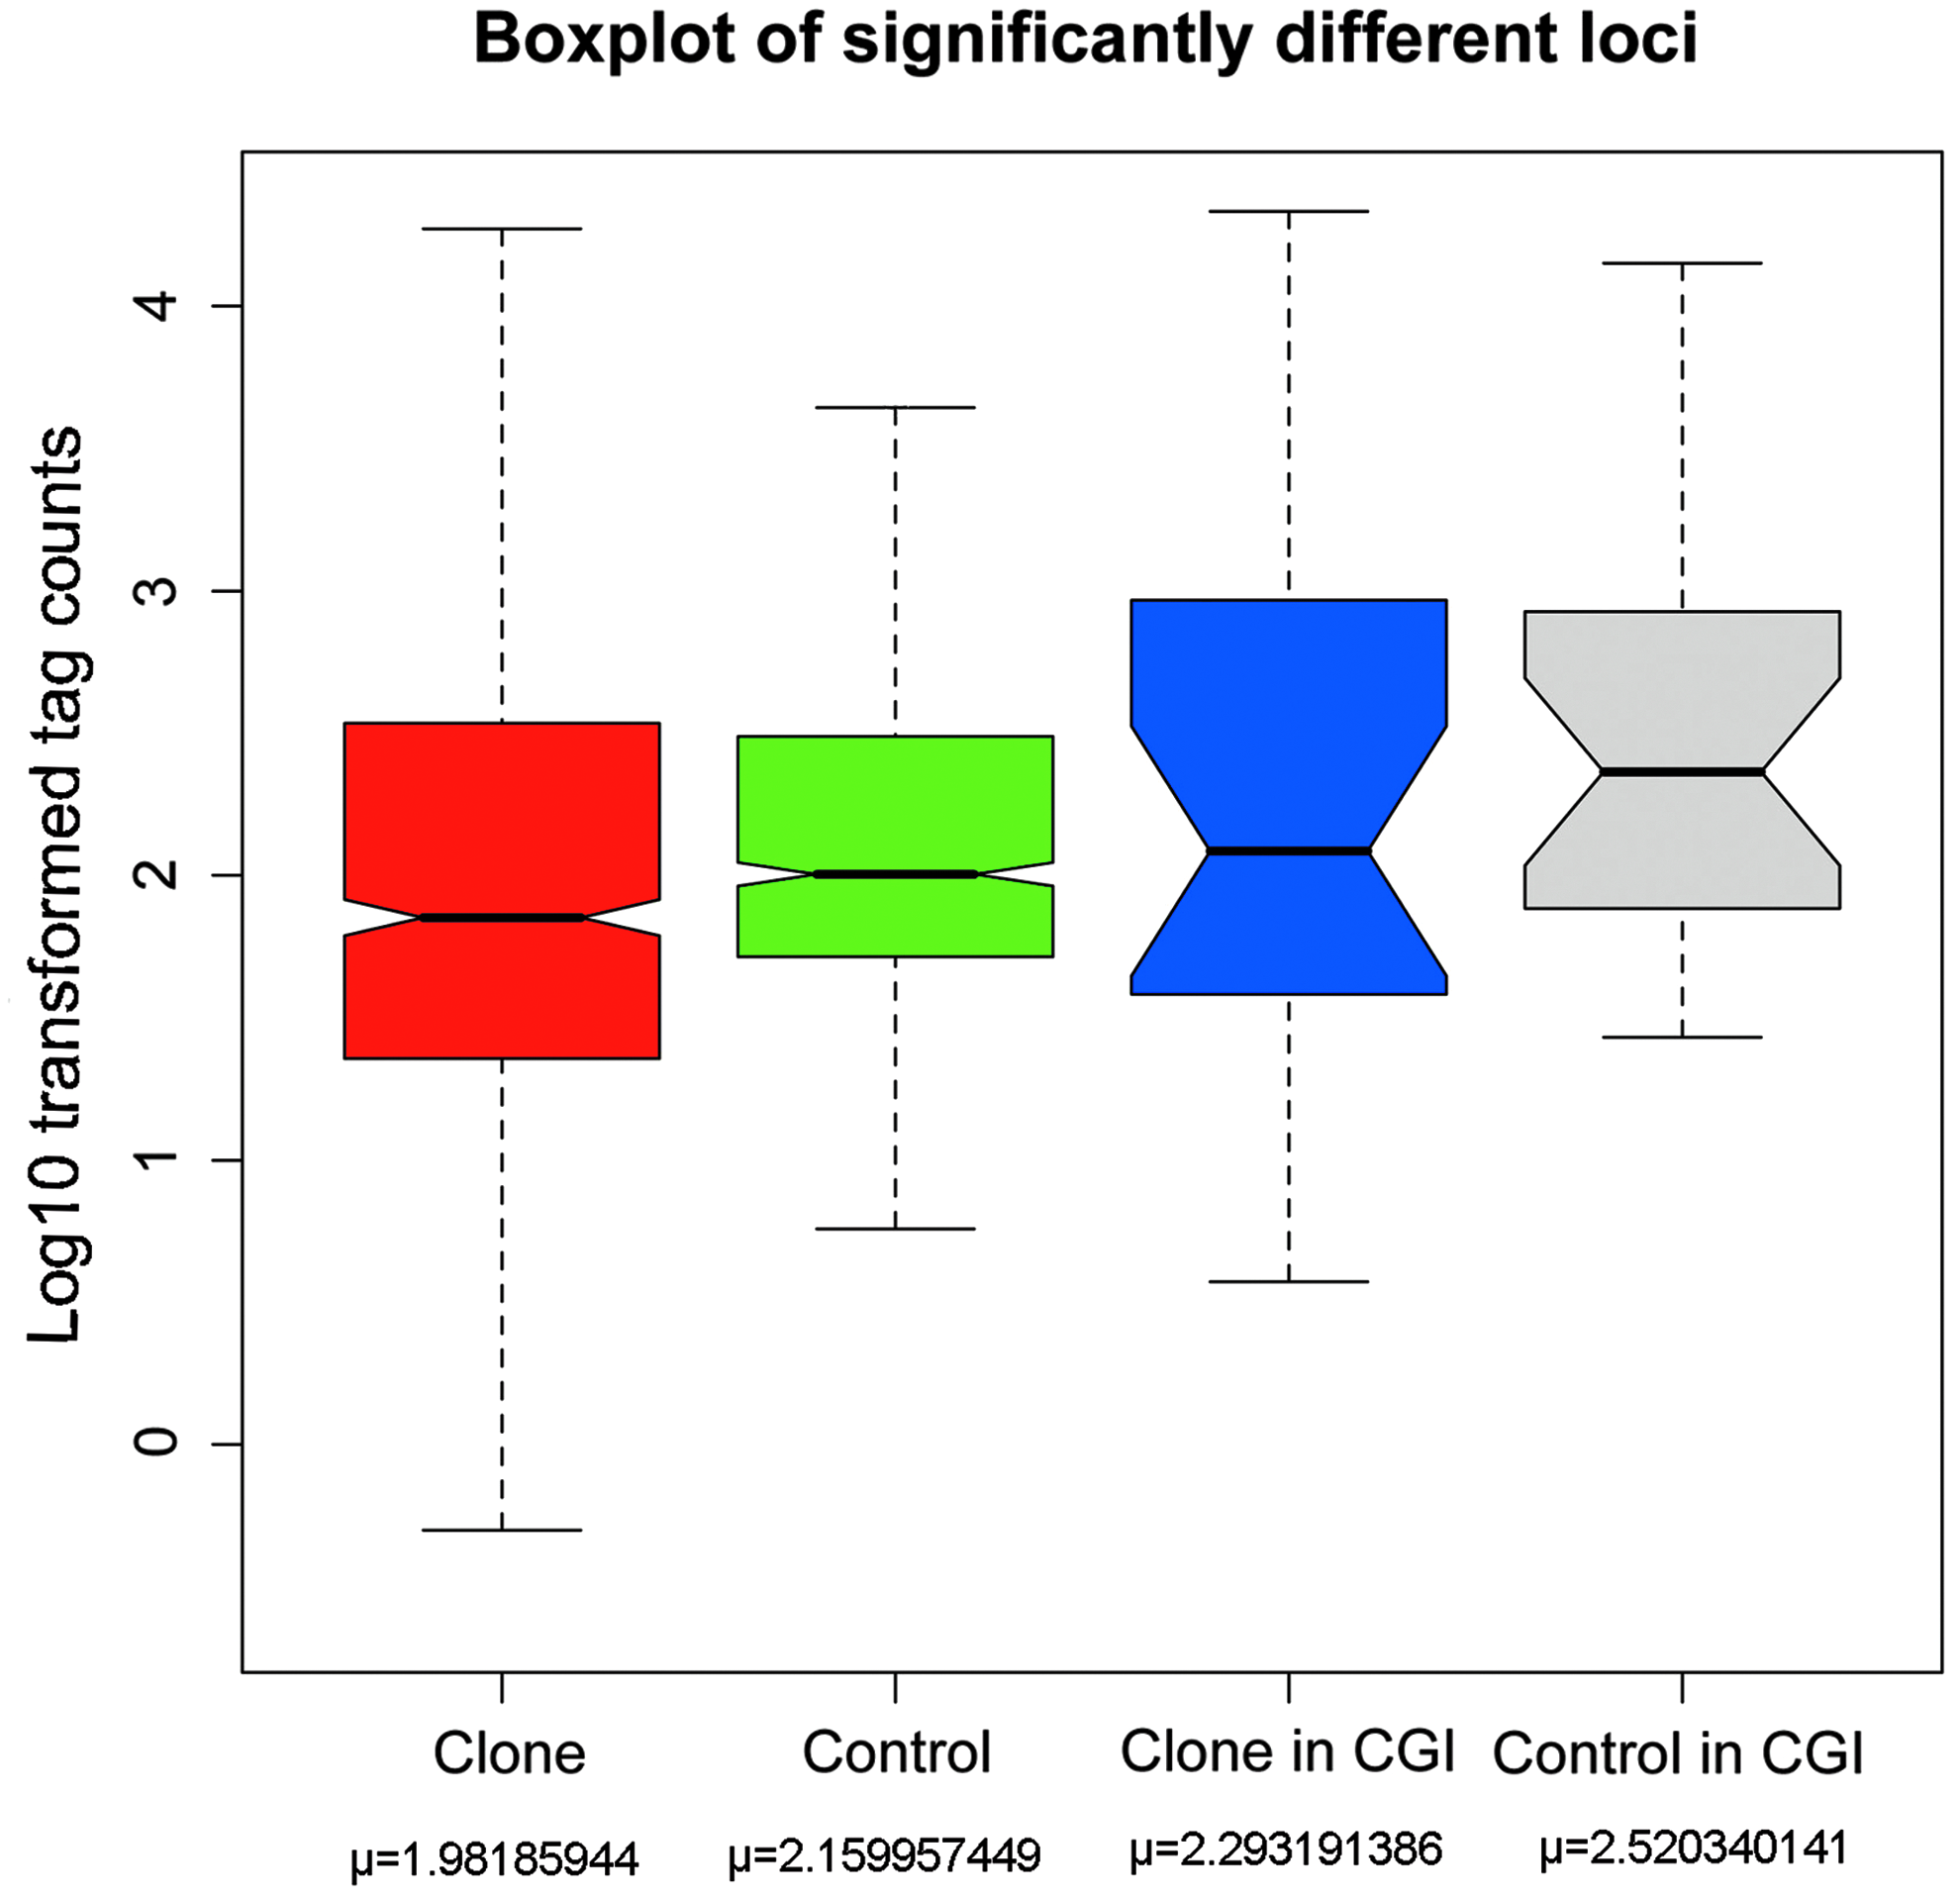
Boxplot of the tag count distribution for significantly different tag loci in cloned and control samples. This figure shows the boxplot of the tag count distribution of significantly different tag loci in cloned and control samples. The extreme upper and lower horizontal lines represent 1.5 times the box width. The upper, middle, and lower horizontal lines of the boxes represent the first quartile (x.25), median (x.50), and third quartile (x.75) of the dataset, respectively. The means of the datasets are noted below. All data are log(10)-transformed. Red and green boxes represent all 854 significantly different tag loci of clone and controls, respectively. Blue and grey boxes similarly represent 138 significantly different tag loci in CGIs, respectively. Lower numbers mean higher methylation levels as all tags represent unmethylated MluI sites.
To study the potential influence that this aberrant methylation could impose on the genomic function, we tried to identify genes closely neighboring these 854 tag sites. However, due to limited annotation data, we could only identify 144 loci with gene annotation, and 25 loci of them were located in CGIs. Out of these 25 loci, 24 were in the promoter region of the corresponding 24 genes. CGIs represent potential cis-regulatory sequences and most housekeeping genes and more than half of the tissue-specific genes are under the control of CpG island promoters (Mohn and Schubeler, 2009). We used the Ingenuity Pathway Analysis (www.ingenuity.com) tool to perform molecular network analysis on the identified 24 genes. Eighteen out of the 24 genes were eligible for molecular network analysis, and notably 15 out of these 18 genes were categorized to a molecular network (score = 36) for tissue development, embryonic development, and cell cycle. Figure 5 shows the relationship of the 15 genes in this network with a cellular background. Information for all identified molecular networks is listed in Supplementary File 4.

The most-scored molecular network in IPA analysis. This figure shows the relations of the genes in the molecular network of tissue development, embryonic development, and cell cycle, which shows the highest score in Ingenuity Pathways Analysis. Fifteen genes that have significantly different status between cloned and control pigs are marked by yellow color.
Discussion
In this study we addressed the methylation status of phenotypically normal cloned and naturally bred pigs to evaluate epigenetic remodeling during SCNT-based embryonic development. We used a global analysis to examine the DNA methylation status in blood from 6-weeks-old pigs. We constructed methylation-specific tag libraries for each individual pig sample and used tag position and count information from the libraries to obtain the methylation pattern for each sample genome. For data analysis of unique sequences, we first used a hierarchical clustering algorithm to inspect the global patterns of DNA methylation among all examined samples. This analysis allowed an overall inspection of the whole data set and grouped together samples according to the similarity in methylation patterns. We found that samples, independent of their origin as clones or controls, tended to be mixed. Also considering our study of repeat families, which showed that all repeat categories had similar DNA methylation status in cloned and control samples, the results suggested that the overall DNA methylation patterns in cloned pigs were quite normal. Still, a Poisson-based SA identified 8.2% of the nonrepeat tag sites (10,424 sites) as having significantly different methylation status (FDR p < 0.05) in cloned and control samples, and cloned pigs tended to have a higher degree of DNA methylation in these loci than the control pigs. Earlier studies on cloned embryos have indicated that the somatic genome used in SCNT does not respond readily to the demethylation activity present in the oocyte (Han et al., 2003; Kang et al., 2001, 2002). Thus, it has been observed that the degree of DNA methylation in most of the cloned embryos was much higher than that of the controls, and that the methylation state in the cloned embryos was more reminiscent of the methylation status present in somatic cells. Using a DNA methylation hybridization microarray approach, Bonk et al. (2008) also reported that the methylation patterns of many CpG islands differed between in vivo generated and cloned pig embryos. However, as most of the studies focused on the DNA methylation of embryos and were technologically limited, it is still unknown whether aberrations in DNA methylation persist throughout the development and life of cloned animals and to what degree. Our results concerning methylation patterns in neonatal pigs were consistent with previous findings in the sense that, despite of the global similarity of DNA methylation patterns, the hypermethylation present in some genomic loci of cloned animals could represent error in the process of epigenetic remodeling persisting after birth. It should be noted that all cloned pigs used for our analysis have normal phenotypes, and accordingly, there is probably a strong selection against large methylation errors. Recently, an interesting study showed that aberrations in DNA methylation patterns in cloned mice are reduced with aging, suggesting potential corrective or selective mechanism for DNA methylation errors (Senda et al., 2007). The same mechanism might operate in pigs and partly explain the similarities in methylation patterns that we observe.
Several reports have indicated a significant variation in the degree of methylation and gene expression among individual cloned blastocysts and fetuses (Kohda et al., 2005; Lee et al., 2004). In our study of four cloned pigs, hierarchical cluster and chi-square tests based on the Poisson model also showed more variance in the DNA methylation pattern among cloned individuals than observed within the group of control pigs. The reason for this variability could be due to some degree of independent and random methylation remodeling of individuals after SCNT. The methylation sites that were found to be differently methylated between the two groups of pigs were in some cases located in CGIs within the promoter regions of genes functionally associated with different steps in development. Still, these differences are clearly compatible with normal development. However, we expect that much more aberrant methylation in cloned animals with abnormal phenotypes or in aborted fetuses could exist. Such aberrant methylation could make a significant contribution to the relative low success rate using SCNT to establish cloned animals. Further experimental efforts are required to validate the link between aberrant methylation and the success rate of SCNT.
Footnotes
Acknowledgments
We thank Jakob Giehm Mikkelsen and Mikkel H. Schierup for experimental and statistical consultation, Bodil Schmidt for experimental help, and Peter M. Kragh and Henrik Callesen for the samples. This study was supported by grants from the Danish “Højteknologifonden” (HTF), NooNordisk Foundation and the Danish Research Council FSS.
Authors' Contributions
F.G. collected samples, designed and performed the experiments, performed statistical analysis, and drafted the manuscript. S.L. performed bioinformatic analysis for Solexa sequencing data mining, MAQ analysis, and genome annotation. X.Z. helped in Solexa sequencing. L.L. and Y.L. helped in DNA isolation and manuscript modification. J.L. helped in data analysis. A.L.N. helped in sample collection, experiment design, data analysis, and modified the manuscript. L.B. organized the collaboration, joined the discussion, and helped in modification of manuscript. All authors read and approved the final manuscript.
Author Disclosure Statement
The authors have declared no conflict of interest.
References
Supplementary Material
Please find the following supplemental material available below.
For Open Access articles published under a Creative Commons License, all supplemental material carries the same license as the article it is associated with.
For non-Open Access articles published, all supplemental material carries a non-exclusive license, and permission requests for re-use of supplemental material or any part of supplemental material shall be sent directly to the copyright owner as specified in the copyright notice associated with the article.