
Abstract
Abstract
Cell fusion is one approach that has been used to demonstrate nuclear reprogramming of somatic cells to a pluripotent-like state and is a useful tool for screening factors involved in reprogramming. Recent cell fusion studies reported that the overexpression of Nanog and SalI could improve the efficiency of reprogramming, whereas AID was shown to be essential for DNA demethylation and initiation of reprogramming. The aim of this study was to investigate factors affecting the reprogramming efficiency following cell fusion. We conducted fusions of mouse embryonic stem cells (ESCs) with somatic cells carrying a GFP transgene under control of the Oct4 promoter (Oct4-GFP), which is normally repressed in nonpluripotent cells. The effect of somatic cell type on the reprogramming efficiency was investigated using Oct4-GFP expression as an indicator. Different somatic cell types were tested including mesenchymal stem cells (MSCs), adipose tissue-derived cells (ADCs), neural stem cells (NSCs), and these were compared with the mouse embryonic fibroblast (mEF) standard. The reprogramming efficiencies differed greatly, with mEFs (0.477 ± 0.003%) and MSCs (0.313 ± 0.003%) showing highest efficiencies while NSCs (0.023 ± 0.014%), and ADCs (0.006 ± 0.006%) had significantly lower reprogramming efficiencies (p < 0.05). The differences in the reprogramming efficiencies observed could be in part explained by the in vitro age of the somatic cells used. We demonstrated that the reprogramming efficiency of early passage mEFs was significantly higher compared with late passage mEFs (0.330 ± 0.166% vs. 0.021 ± 0.011%, p < 0.05), suggesting that senescence can affect reprogramming potential. In summary, this study shows that different somatic cell types do not have equivalent potential to be reprogrammed following fusion with ESCs. Furthermore, the in vitro age of somatic cells can also affect the reprogrammability of somatic cells. These findings constitute an important consideration for reprogramming studies.
Introduction
The two most frequently examined methods of cell fusion are polyethylene glycol (PEG) fusion or electrical current mediated fusion (commonly referred to as electrofusion). PEG was first reported to induce cell fusion by Pontecorvo (1975) and Davidson and Gerald (1976). Since then, numerous studies have been dedicated to optimizing conditions for PEG fusion; however, results have varied due to the use of different cell types and molecular weight PEGs (Anders et al., 1978; Davidson and Gerald, 1977; Lane et al., 1984). PEG-mediated fusion reprogramming studies have examined fusion of mouse ESCs/iPS with neurospheres, cumulus cells, splenocytes, mesenchymal stem cells (MSCs), and mouse embryonic fibroblasts (mEFs) as somatic cell donors (Do and Scholer, 2005; Matveeva et al., 1998; Sumer et al., 2009; Wong et al., 2008), while human ESCs have been PEG-fused to fibroblasts and myeloid precursors (Cowan et al., 2005; Hasegawa et al., 2010; Yu et al., 2006). Electrofusion has only been employed for fusing mouse ESCs with mEFs or mouse thymocytes as somatic cell donors (Sullivan et al., 2006a; Tada et al., 2001). However, it is unclear whether one fusion method is advantageous over the other or whether the different methods affect reprogramming outcomes. Therefore, we first sought to optimize each fusion method and compare the two for differences in reprogramming efficiency. The more efficient fusion method was used for subsequent experiments.
Although mEFs are the most commonly used somatic cell type in fusion studies, Do and Scholer (2005) were the first to directly compare the reprogramming efficiencies of different somatic cell types. This report showed that there were no differences in reprogramming efficiency between neurospheres and cumulus cells. Interestingly, a different study showed that overexpression of Nanog in ESCs significantly increased the number of reprogrammed hybrid colonies when fused to neural stem cells (NSCs); however, when either thymocytes or mEFs were used as somatic cell partners, the number of reprogrammed hybrid colonies also increased but to a lesser extent than for NSCs (Silva et al., 2006). This highlighted a potential difference in reprogrammability between different somatic cell types. Moreover, this study showed that over expression of Nanog alone in NSCs was insufficient to induce reprogramming but when the cells were subsequently fused to normal ESCs, it also led to an increased number of reprogrammed hybrid colonies (Silva et al., 2006). These results suggest that Nanog plays an important role in cell fusion-based reprogramming but requires the cooperation of other ESC factors. Therefore, the endogenous expression of key pluripotency genes by somatic cells may act as a determinant of a cell's ability to be reprogrammed more efficiently. Therefore, one aim of this study was to compare the reprogramming efficiencies of various somatic cell types compared with the mEF standard. We hypothesize that the endogenous expression of key pluripotency genes would be a good indicator of efficient reprogramming. Further, based on this assumption of the different somatic cell types examined, mEFs, MSCs, NSCs and adipose tissue-derived cells (ADCs), NSCs will be most efficiently reprogrammed due to the endogenous expression of Sox2, one of the genes that play a key role in the pluripotency network.
Another factor that may affect reprogramming outcomes after cell fusion is the in vitro “age” of the somatic cells. The effect of using donor somatic cells at different passage numbers has been found to have a significant influence on reprogramming outcomes in somatic cell nuclear transfer (SCNT) studies. In the equine and bovine, rates of cleavage and blastocyst formation respectively were found to be significantly affected by the age of donor cells used (Li et al., 2003; Roh et al., 2000). Roh et al. (2000) reported a significant reduction (p < 0.05) in bovine SCNT blastocyst formation rates when late passage (between 17 and 32) bovine fetal fibroblasts were used as nuclear donors compared with early passage cells (between 8 and 16) (Roh et al., 2000). Further, Li et al. (2003) found that rates of first embryonic division of horse SCNT embryos decreased with the use of later passage (between 11 and 15) horse fibroblast cells (both fetal and adult) when compared with early passage (between 3 and 10) fibroblasts. These observations prompted an investigation into the influence of using early-passage versus late-passage somatic cells on the reprogramming efficiency.
All somatic cells used in this study were isolated from OG2 mice, which possess a transgene containing green fluorescent protein (GFP) under the control of the Oct4 promoter (Szabo et al., 2002; Yeom et al., 1996). Oct4 is a key pluripotency gene that is expressed in ESCs and germ cells but is repressed in somatic cells, such as mEFs (Tokuzawa et al., 2003). We and others have reported that activation of the Oct4–GFP transgene is a good indicator of an activated endogenous Oct4 gene (Han et al., 2008; Tat et al., 2010). In our study, the expression of this Oct4–GFP transgene was used to identify and select for reprogramming events. However, more stringent characterizations of hybrid cell lines were also undertaken to verify the extent of reprogramming.
Materials and Methods
All experiments involving animals were conducted in accordance with the Monash Medical Centre Animal Ethics Committee. All materials were sourced from Invitrogen, Australia, unless otherwise stated. All cells were cultured at 37°C in a humidified incubator containing 5% CO2/95% air.
Cell culture
ESCs were from the D3 line (129/J strain) (Pralong et al., 2005), and were routinely grown in feeder-free conditions on tissue culture plates in ESC medium consisting of high glucose Dulbecco's modified essential medium (DMEM) supplemented with 15% fetal bovine serum (FBS) (JRH Biosciences, Australia), 1 × nonessential amino acids, 1 × GlutaMAX, 1 × penicillin–streptomycin, 0.1 mM β-mercaptoethanol, and 1000 U/mL ESGRO LIF (Chemicon, Australia).
mEFs were derived from OG2 (Yeom et al., 1996) homozygous transgenic foetuses (Bl6 strain) and maintained in MEF medium consisting of high glucose DMEM supplemented with 10% FBS, 1 × nonessential amino acids, 1 × GlutaMAX, and 1 × penicillin–streptomycin. Passaging was performed using TrypLE (stable trypsin-like enzyme).
MSCs were derived from 6- to 8-week-old OG2 homozygous males as described previously in Sumer et al. (2009).
ADCs and NSCs were obtained from adult OG2 homozygous males or females as described previously in Tat et al. (2010). ADCs are CD44 and Sca-1 positive, while being negative for CD117, CD45, and CD34. NSCs are Sox2 and Nestin positive.
PEG fusion
ESCs (0.5 × 10⁶) were plated into one well of a four-well Nunc plate (Nunclon, Denmark). Approximately 24 h after ESC plating, 1 × 10⁶ mEFs were added to each well and the Nunc plate was centrifuged for 10 min at 400 × g using a Sorvall® RC-6™ centrifuge fitted with a SH-3000 rotor and microplate carrier. The medium was aspirated and cells were incubated for either 1 or 2 min at room temperature with 500 μL of either PEG 8000 (Amersco, Framingham, MA), PEG 6000 (BDH, San Jose, CA), or PEG 1500 (Merck, Rahway, NJ) at 50, 45, or 40% (w/v) in 150 mM HEPES, pH 7.5, prewarmed to 37°C. PEG was aspirated and cells were then washed three times with calcium and magnesium-free PBS (PBS−). Following PEG treatment, cells were returned to the incubator in ESC medium. Within 3 h of fusion, cells were trypsinised and either analyzed by flow cytometry (if cells were stained see fusion efficiency methods) or plated in two 60-mm tissue culture plates (BD Falcon, Australia) (for unstained cells).
Electrofusion
The following electrofusion procedure was adapted from Sullivan et al. (2006b). ESCs (2 × 10⁶) were mixed with 1 × 10⁶ mEFs and washed twice with PBS−. Cells were resuspended in 400 μL of mannitol solution (0.3 M D-mannitol, 0.1 mM CaCl2 · H2O, 0.35 mM MgSO4 · H2O, 0.01% Polyvinyl alcohol diluted in Milli-Q water and corrected to 280 mOsm) and transferred to a 2-mm cuvette (Sullivan et al., 2006b). The cuvette was centrifuged at 200 × g for 10 min and then electroshocked with 300 V/25 μF generated by a BioRad Gene Pulser II. Electrofused cells were left undisturbed in the cuvette for 20 min and then plated in two 60-mm tissue culture plates in complete ESC medium. Cells that were analyzed by flow cytometry were allowed to recover for 3 h in the incubator in ESC medium.
Determination of reprogramming events
Nonstained, fused cells were plated on 60 mm tissue culture dishes and were screened for GFP positive (+) colonies by epifluorescence microscopy using an Olympus 1 × 70 microscope at 72 h postfusion. Phase contrast and epifluorescence images were captured with an Olympus DP50 digital camera. For further characterization, five GFP+ colonies from each fusion experiment were picked and expanded. This was done by scraping away the cells surrounding the GFP+ colonies using a 0.5I-U gauge insulin needle (Thermo, Pittsburgh, PA) under UV exposure. Next, using a 200-μL sterile pipette tip with the pipette volume adjusted to 5 μL, individual GFP+ colonies were picked, transferred to a 24-well plate containing ESC media and allowed to attach overnight. The following day cells were washed once with Dulbecco's PBS and cells disaggregated using TrypLE. The colony was disaggregated into single cells and ESC media was added back to the well. Once cells reached confluency, they were trypsinized and replated into appropriate sized dishes (Falcon). After greater than 106 cells were obtained, GFP+ cells were enriched using fluorescence activated cell sorting, FACS, or further subcloned by repicking GFP+ colonies as described above. Once a homogenously GFP+ population was obtained, they were used for further analyses.
Determination of cell fusion efficiency by flow cytometry
Experiments for measuring the fusion efficiency (stained cells) were conducted in parallel with experiments measuring reprogramming events (unstained cells). For the former, ESCs were stained with 1.25 μM carboxyfluorescein diacetate succinimidyl ester (CFSE) for 10 min at 37°C, 24 h prior to fusion, mEFs were stained with 15-μM carboxylic acid, acetate, succinimidyl ester (SNARF-1) for 30 min at 37°C, 1 h prior to fusion. CFSE and SNARF-1 stain intracellular proteins and stain diminishes as the cells divide. Treated cells were harvested by treatment with TrypLE, resuspended in ESC medium, and passed through a 40-μm nylon cell strainer (BD Falcon) to obtain a single cell suspension prior to flow cytometry. Viable cells were identified and gated using a forward scatter/side scatter (FSC/SSC) dot plot. The gated cells were analyzed using an FL-1 versus FL-3 (i.e., CFSE versus SNARF-1) dot plot and statistical quadrants were set based on CFSE and SNARF-1 only controls. The “nonfused” control group, which contained the two stained cell populations mixed together without fusion treatment was used to measure false-positive cells (events falling in the quadrant representative of cells positive for both CFSE and SNARF). The fusion efficiency of PEG and electrofused cells was calculated as follows.
where % of false-positive cells is the % of double-positive cells (CFSE and SNARF) obtained from the no-fusion control flow cytometric profiles.
Determining the reprogramming efficiency
A reprogramming efficiency was calculated to estimate the frequency of reprogramming events while taking into account differences between experiments that may arise due to the fusion efficiency. Given the heterogeneous nature of fusion experiments, averages of experiments (n = 5) were used to calculate this. This calculation assumed that each GFP+ colony is clonally derived from a single cell.
where number of heterokaryons = (% of heterokaryons) × 106 (starting number of somatic cells for fusion experiments), and
Note that the number of CFSE and SNARF stained events (cells) were obtained through flow cytometric counts.
Statistical analysis
Differences in the fusion efficiency, the number of GFP+ colonies observed, and the reprogramming efficiency among the experimental groups were analyzed by one-way analysis of variance (ANOVA) or Student's t-test (with Mann-Whitney assumptions) using the GraphPad Prism version 4.03 software. A p-value of <0.05 was considered to represent a statistically significant difference.
Determination of ploidy by flow cytometry
Cells (2 × 10⁶) were disaggregated to a single cell suspension using TrypLE, fixed in 70% ethanol, and stored at −20°C until analyzed. On the day of analysis, fixed cells were washed three times with ice-cold PBS− with 1% fetal calf serum (JRH Biosciences, Australia) and then resuspended in room temperature PBS−. Propidium iodide (PI) was added at a concentration of 100 μg/mL and RNase A added at 10 μg/mL. Cells were then covered and left on a rocking platform at room temperature for 30 min and then maintained at 4°C for 1 h before flow cytometry analysis.
Chromosome counts
Actively dividing cells (minimum cell number of 2 × 10⁶) were treated overnight with BrdU and then arrested with colcemid for 4 h. Cells were recovered by trypsinization and treated with 0.56% KCl solution for 15 min at 37°C. A fixative of methanol and acetic acid (3:1) was added to the cell suspension through four consecutive washes. On the final wash, the supernatant was aspirated and the pellet resuspended in a small amount of fixative. Two to three drops of the resuspended cells were dropped onto clean glass microscope slides. Cell spreads were allowed to air dry for at least 30 min and then stained with Leishmann's stain for 10–15 min. Coverslips were mounted on the dried slides using Histomount® (National Diagnostics, Atlanta, GA). Chromosome spreads were photographed under a 100 × oil immersion lens and 20 spreads were counted per sample.
RT-PCR and microsatellite analysis
RNA and genomic DNA were isolated from cells using the RNeasy and DNeasy tissue extraction kits, respectively, as per manufacturer's instructions. RNA and DNA quality and concentrations were measured using the NanoDrop ND-1000 (NanoDrop Technologies, Australia). cDNA was generated from RNA using the Superscript III kit (Invitrogen) as per manufacturers instructions. The RT-PCR and microsatellite PCR conditions have been previously described in Sumer et al. (2009).
Immunostaining
Hybrid clones and ESCs were grown feeder free, but for immunostaining they were grown on an OG2 mEF feeder layer in four-well glass culture slides (BD Falcon). This feeder layer acted as a negative control and allowed better attachment of hybrids and ESCs to the glass culture slides. Immunostaining procedures for SSEA-1 (Chemicon) and alkaline phosphatase, have been previously described by Tat et al. (2010).
SNP analysis
PCR reactions were carried out using the Oct4 primers and RT-PCR conditions. Half of this reaction was then digested with the BamH1 (Promega, Australia) restriction enzyme overnight at 37°C. BamH1 digests the Oct4 transcript produced by ESD3 ESCs. The Oct4 transcript produced by cells of OG2 background has a single nucleotide polymorphism at position 49, which results in disruption of the BamH1 site. Both digested and undigested PCR products were run on a 2% agarose gel at 80–100 V for 4 h. Undigested Oct4 bands were excised and DNA extracted using the QIAEXII kit following the manufacturer's instructions. A total of 25 ng of the extracted PCR products were sequenced using 3.2 pmol of the Oct4 primer (forward only). Sequencing was performed by The Gandel Charitable Trust Sequencing Centre, Clayton Australia (Applied Biosystems ABIPRISM™ 377 DNA Sequencer).
Bisulfite analysis
Bisulfite conversion of genomic DNA was performed using MethylEasy Xceed™ (Human Genetic Signatures, NSW Australia) according to the manufacturer's instructions. The Oct4 promoter region was amplified using nested primers and both rounds of PCR performed as follows: 4 min at 95°C; 30 cycles of 30 sec at 95°C; 1.5 min at 57°C; 2 min at 95°C; and 10 min at 72°C. The Nanog promoter region was amplified using nested primers and both rounds of PCR performed as follows: 5 min at 94°C; 35 cycles of 30 sec at 94°C; 45 sec at 59°C; 3 min at 72°C; and 10 min at 72°C. The Oct4 bisulfite primers were designed by Dr. Kyle Upton and the Nanog bisulfite primers have been described elsewhere (see Table 1 for primer sequences) (Zhao et al., 2009). The nested PCR products were run on a 2% agarose gel for 2 h at 100 V and resulting bands were excised using the MinElute kit (Qiagen, Chatsworth, CA) according to manufacturer's instructions. The PCR products were ligated overnight to pGEM®-T easy vector (Promega). Each ligated sample was transformed into DH10B competent cells by electroshocking cells at 1.8 kV, 25 μF, and 200 Ohm generated by a Bio-Rad Gene Pulser II (Bio-Rad Laboratories, Inc., Hercules, CA). Transformed cells were allowed to recover in SOC medium at 37°C for 1 h and were then plated onto LB agar plates containing 100 μg/mL of ampicillin (Sigma-Aldrich, St. Louis, MO), 0.1 M IPTG (Dioxane-Free isopropyl-β-D-thiogalactopyranoside, Promega, Madison, WI), and X-Gal solution (50 mg/mL, Promega). Plates were left growing overnight at 37°C. The plasmid DNA of eight white colonies from each transformant were amplified immediately using the Illustra™TempliPhi amplification kit (GE Healthcare, Piscataway, NY) according to manufacturer's instructions. Clones were individually sequenced by the Gandel Charitable Sequencing Trust using SP6 primers (Monash Health Research Precinct, Clayton, Australia). Sequencing data was analysed using BiQ analyser version 2.0 (Max-Planck-Institute for Informatics and Saarland University, Germany).
Tetraploid aggregation of embryos
Zygotes were collected from prepubertal C57/Bl6 × CBA (F1) mice superovulated with 5IU PMSG and HCG injected at 48 and 0 h prior to setting up mating, respectively, and cultured in KSOMaa (Chemicon) at 37°C. When embryos reached the two-cell stage, they were washed twice in 0.3 M mannitol drops and then transferred to a fusion chamber with 0.1-cm parallel electrodes containing mannitol. Embryos were fused using a BTX100 machine with an AC alignment pulse of 10 V and a single 20 μsec DC pulse of 130–135 V. Electropulsed embryos were washed twice and then returned to the incubator in KSOMaa. After 45 min, electropulsed embryos were monitored for fusion and all unfused two-cell embryos were discarded. Once 4 N embryos reached greater than eight-cell stage, the zona pellucida was digested using acid tyrodes (Sigma, Australia) and individual zona-free embryos transferred to wells containing KSOMaa (well depressions were made using a darning needle) (Nagy et al., 2003). GFP+ hybrid clones were harvested with care taken not to generate a single cell suspension, and resuspended in ESC media. Clumps of 10–15 GFP+ hybrid cells were transferred into each well containing a zona-free embryo. Embryos were monitored for aggregation and development and at the blastocyst stage.
In vitro differentiation via embryoid body formation
ESCs (106) and GFP+ hybrid cells were harvested and resuspended in 10 mL of ESC media without Lif. The cell suspension was transferred to Petri dishes (Falcon) and incubated at 37°C. Day 7 embryoid bodies were collected for RT-PCR analysis of differentiation markers representative of the three germ layers (see Table 1 for primer sequences).
In vivo differentiation via teratoma formation
ES (2 × 10⁶) cells or GFP+ hybrid cells were injected into the hind leg muscle of severe combined immunodeficient (SCID) mouse. Mice were sacrificed and teratomas excised between 5 and 6 weeks postinjection and fixed in HistoChoice® (Amresco, Solon, OH). Tumors were sectioned and stained with haematoxylin and eosin (H&E). Histology was performed by the Monash Institute of Medical Research Histology facility, Clayton Australia.
Results
Optimization and comparison of the PEG and electrofusion methods
To measure fusion efficiency, two-color flow cytometric analysis was conducted to distinguish heterokaryons (ESC-mEF) from single cells and homokaryons (ESC–ESC or mEF–mEF). Three replicate PEG fusion efficiency experiments were conducted for each different PEG condition (results not shown). A treatment time of 2 min with PEG 1500 50% (w/v) was chosen for further studies as it gave the highest fusion efficiency. We compared the fusion and reprogramming efficiencies of the electrofusion technique with the optimized PEG fusion method. Five replicate experiments were conducted for each fusion method using OG2 mEFs (passage 2). Electrofusion resulted in a significantly (p < 0.05) higher fusion efficiency (average 14.14 ± SD 3.22%) than PEG fusion (1.45 ± 0.60%). The number of GFP+ colonies seen was also found to be significantly higher (electrofusion 748.8 ± 240 colonies versus PEG 70 ± 14.67 colonies, p < 0.05, see Table 2). However, the overall reprogramming efficiency was not significantly different between the two methods (0.31 ± 0.19% electrofusion versus 0.28 ± 0.0% PEG fusion, p > 0.05). One difficulty encountered with electrofusion was that the fusion efficiency; hence, the yield of GFP+ colonies, varied considerably between experiments. Electrofusion has been reported to be more susceptible to variations in biophysical factors such as cell charge, cell size, and cell membrane kinetics (Radomska and Eckhardt, 1995; Zimmermann, 1982). Such variation in biophysical factors appears to be less important for PEG fusion. Thus for reproducibility, we chose PEG fusion for subsequent experiments.
Mean values are considered significant (p < 0.05) as determined by Student's t-test with Mann-Whitney assumptions.
No. of fused mEF are obtained from the flow cytometry profiles by multiplying the % of mEF forming heterokaryons with 1 × 10⁶, starting number of mEFs used in fusions (see Materials and Methods for calculation details).
Comparison of fusion and reprogramming efficiencies of different somatic cell types
The fusion efficiencies of the different somatic cell types were compared using the optimized PEG fusion method (see Fig. 1 for flow cytometry profiles). Five replicate experiments were conducted for each somatic cell type. The fusion efficiencies were not significantly different between the different cell types (p > 0.05) except when comparing MSCs and NSCs (p < 0.01) (see Table 3). The number of GFP+ colonies observed was found to be significantly higher for mEFs and MSCs, with 69 ± 25.13 and 90.20 ± 16.81 colonies observed, respectively, compared with NSCs and ADCs with 7 ± 3.39 and 3.80 ± 2.59 colonies, respectively (p < 0.05; see Table 3). To account for differences in the fusion efficiencies, the reprogramming efficiency was calculated and showed that the reprogramming efficiencies of mEFs (0.477 ± 0.003%) and MSCs (0.313 ± 0.003%) were significantly higher than NSCs (0.023 ± 0.014%) and ADCs (0.006 ± 0.006%) (p < 0.05). There was no significant difference between the reprogramming efficiency of MSCs and mEFs and between NSCs and ADCs.
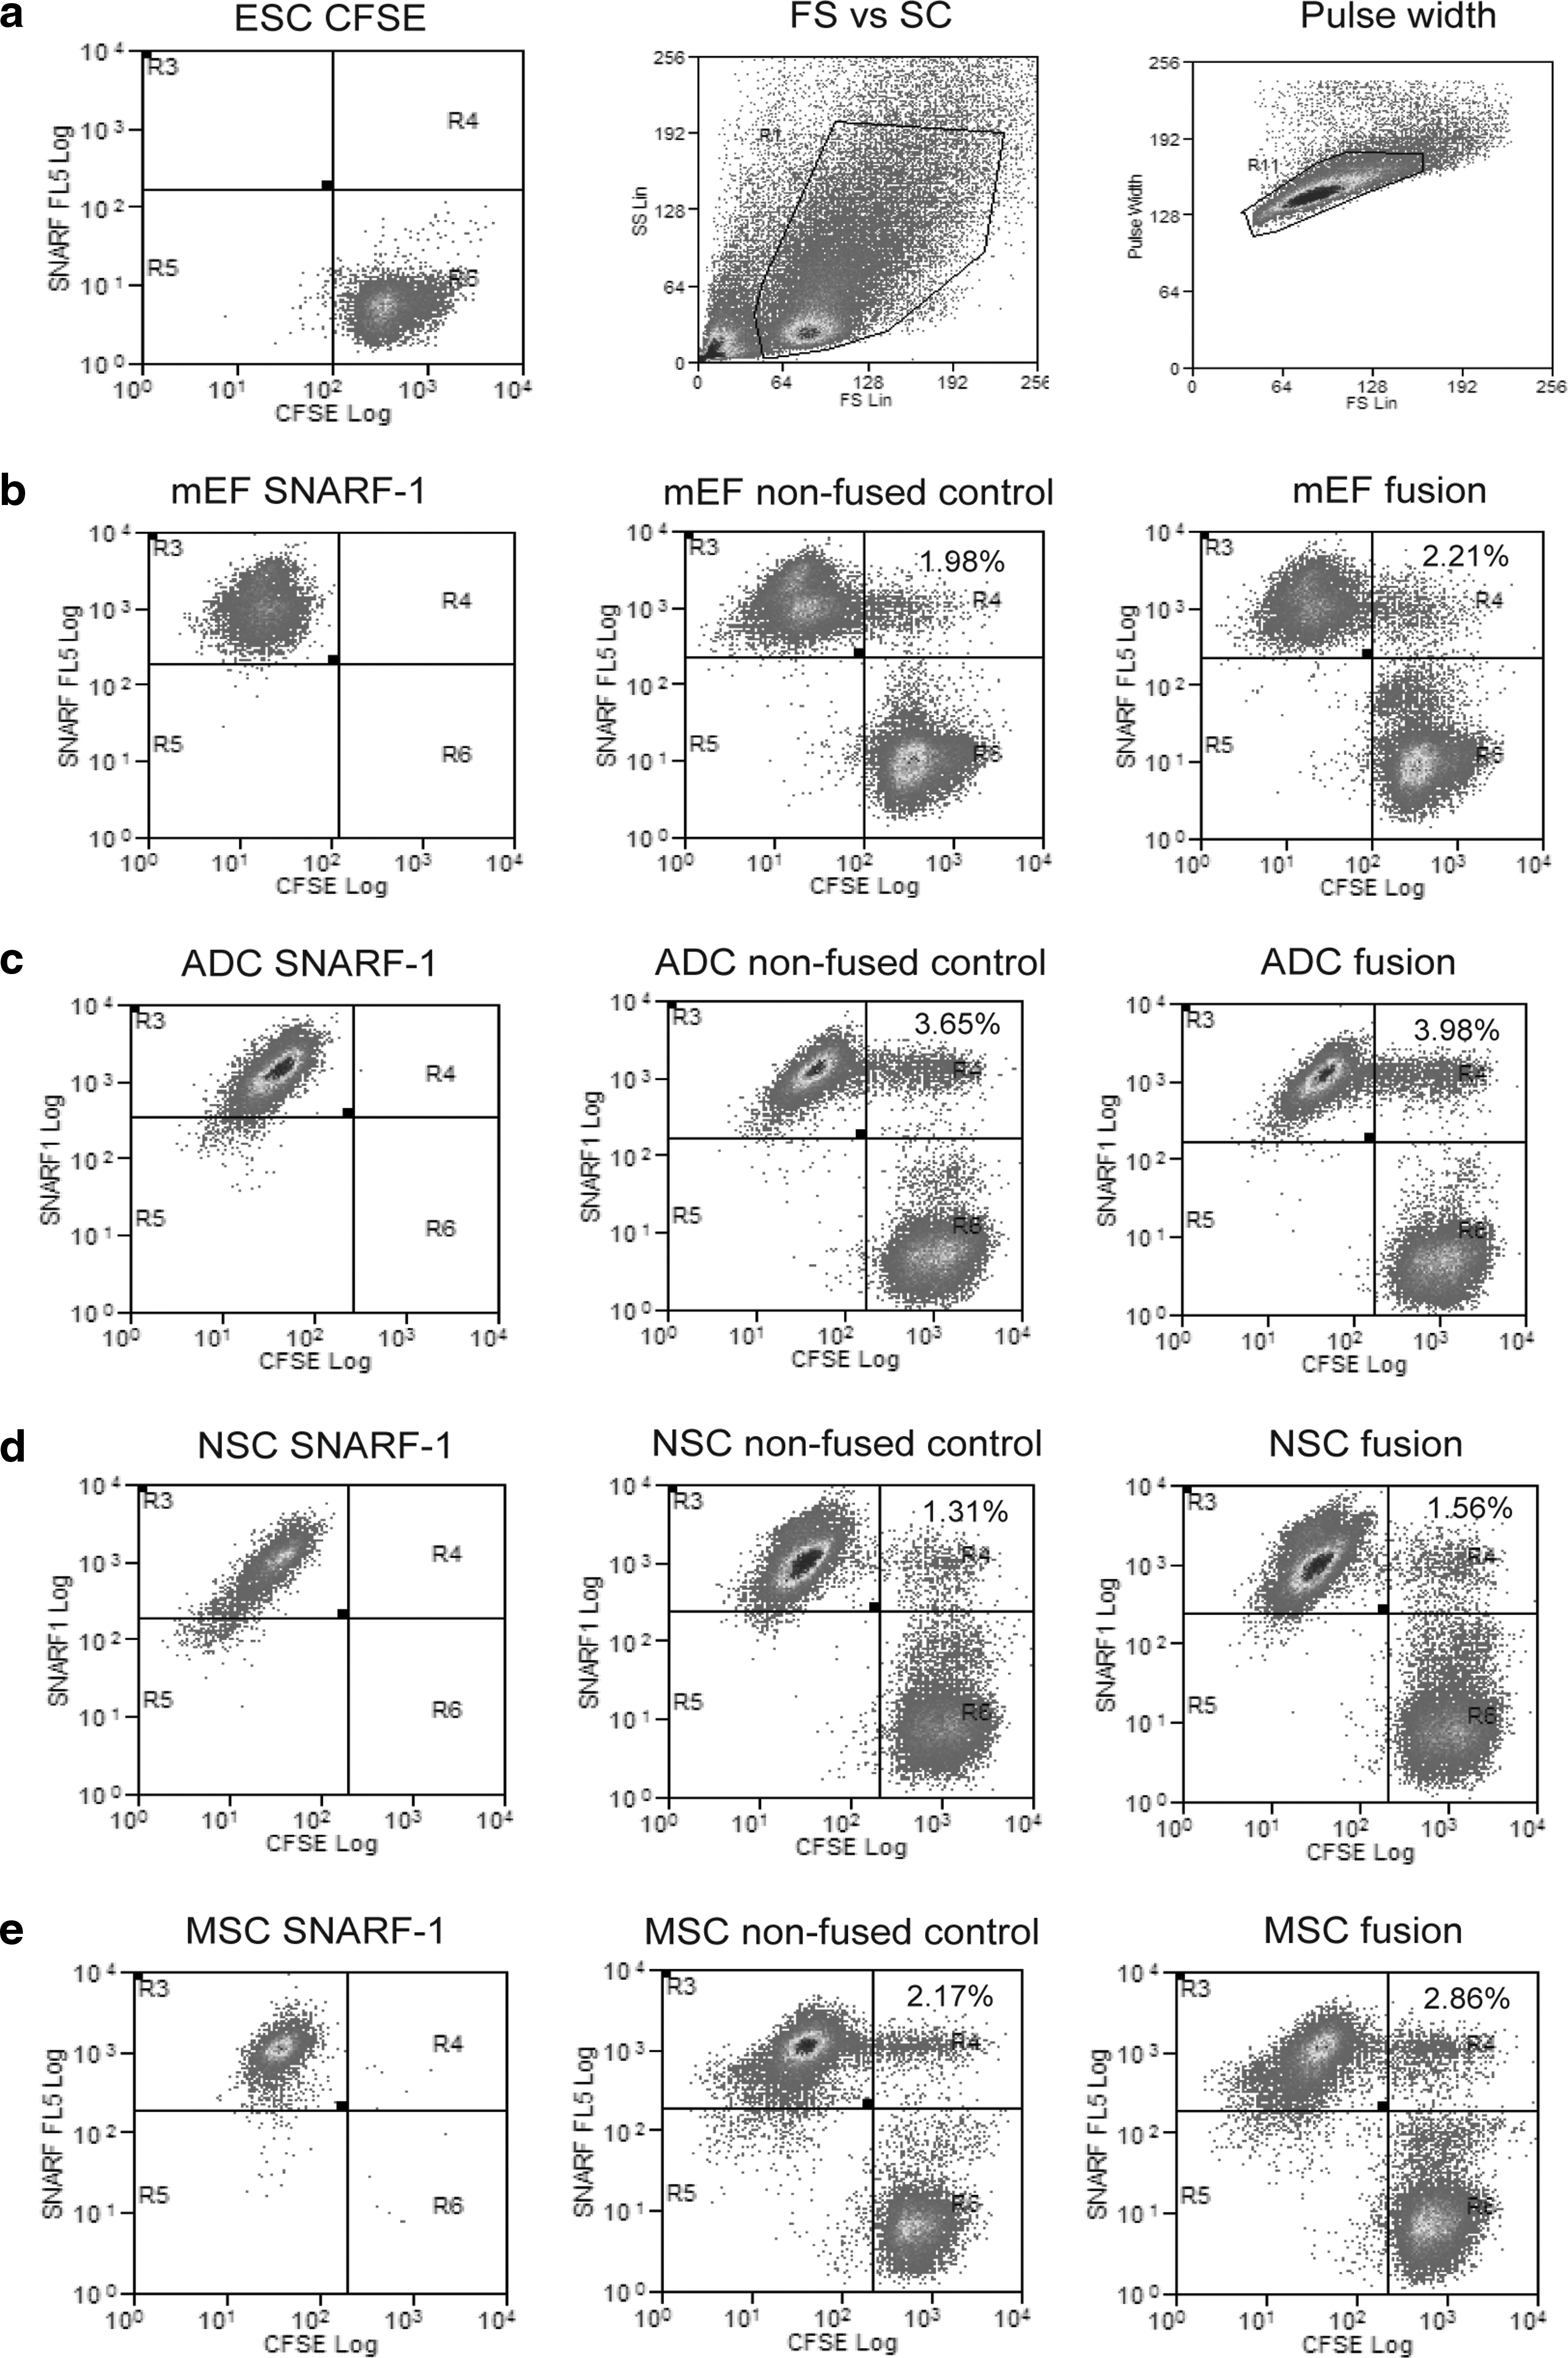
Fusion efficiency of somatic cells. Stained cells were analyzed by flow cytometry and the results were used to calculate the fusion efficiency. The x-axis shows CFSE stained cells and the y-axis shows SNARF-1 stained cells. R4 denotes percentage of CFSE and SNARF1 double-positive cells. (
Values are mean ± SD.
Values are significant as determined by one-way ANOVA (p < 0.05). Bonferroni's multiple comparison test shows significance between the reprogramming efficiencies of mEF versus NSC, mEF versus ADC, MSC versus NSC, and MSC versus ADC.
Characterization of hybrids
GFP+ colonies picked and expanded from each fusion experiment were used for characterization. The morphology of established cell lines is shown in Figure 2a. To confirm the hybrid nature of GFP+ colonies, ploidy analysis was performed. All hybrid cell lines analyzed showed near tetraploid chromosome complement. Figure 2b shows a representative chromosome spread of the mEF hybrid cell line. Microsatellite analyses demonstrated that both ESC and somatic cell DNA had contributed to the 4 N genome of hybrid cells (Fig. 2c). This confirms that tetraploid hybrids were generated by fusion of the parental cells. All somatic cells and hybrids were fixed and treated with PI. The peaks on the PI flow cytometric profiles correspond with stages of the cell cycle (see Fig. 2d). The gates set on mEF control sample shows that the R3 gate corresponds with the G0/G1 phase, whereas R4 corresponds with S phase and R5 corresponds with G2/M phase. A high proportion of somatic cells are at G0/G1 stage with few cells at S and G2/M phases, with the exception of ADCs, which appear to have a slightly higher proportion of cells at G2/M phase. In comparison, hybrid cell lines have higher S and G2/M peaks than all the somatic cells indicating that a greater number of hybrid cells are cycling. This suggests that hybrid cells have adopted growth characteristics of ESCs.

Ploidy and cell cycle analysis of hybrid cell lines. (
In addition to ESC morphology and growth characteristics, hybrid clones were shown to express the pluripotent markers, alkaline phosphatase and SSEA-1 (Fig. 3a and b). Furthermore, SSEA-1 correctly localized to the cell surface. RT-PCR analysis showed that all hybrid clones expressed the pluripotent markers Sox2, Rex-1, and Nanog, whereas expression of somatic cell specific markers Col1A and Nestin were not detected (Fig. 3c). MSCs also showed expression of Rex-1 and Nanog, although at a lower level than ESCs and hybrids. NSCs were found to express Sox2, whereas low levels of Nanog were also detected.
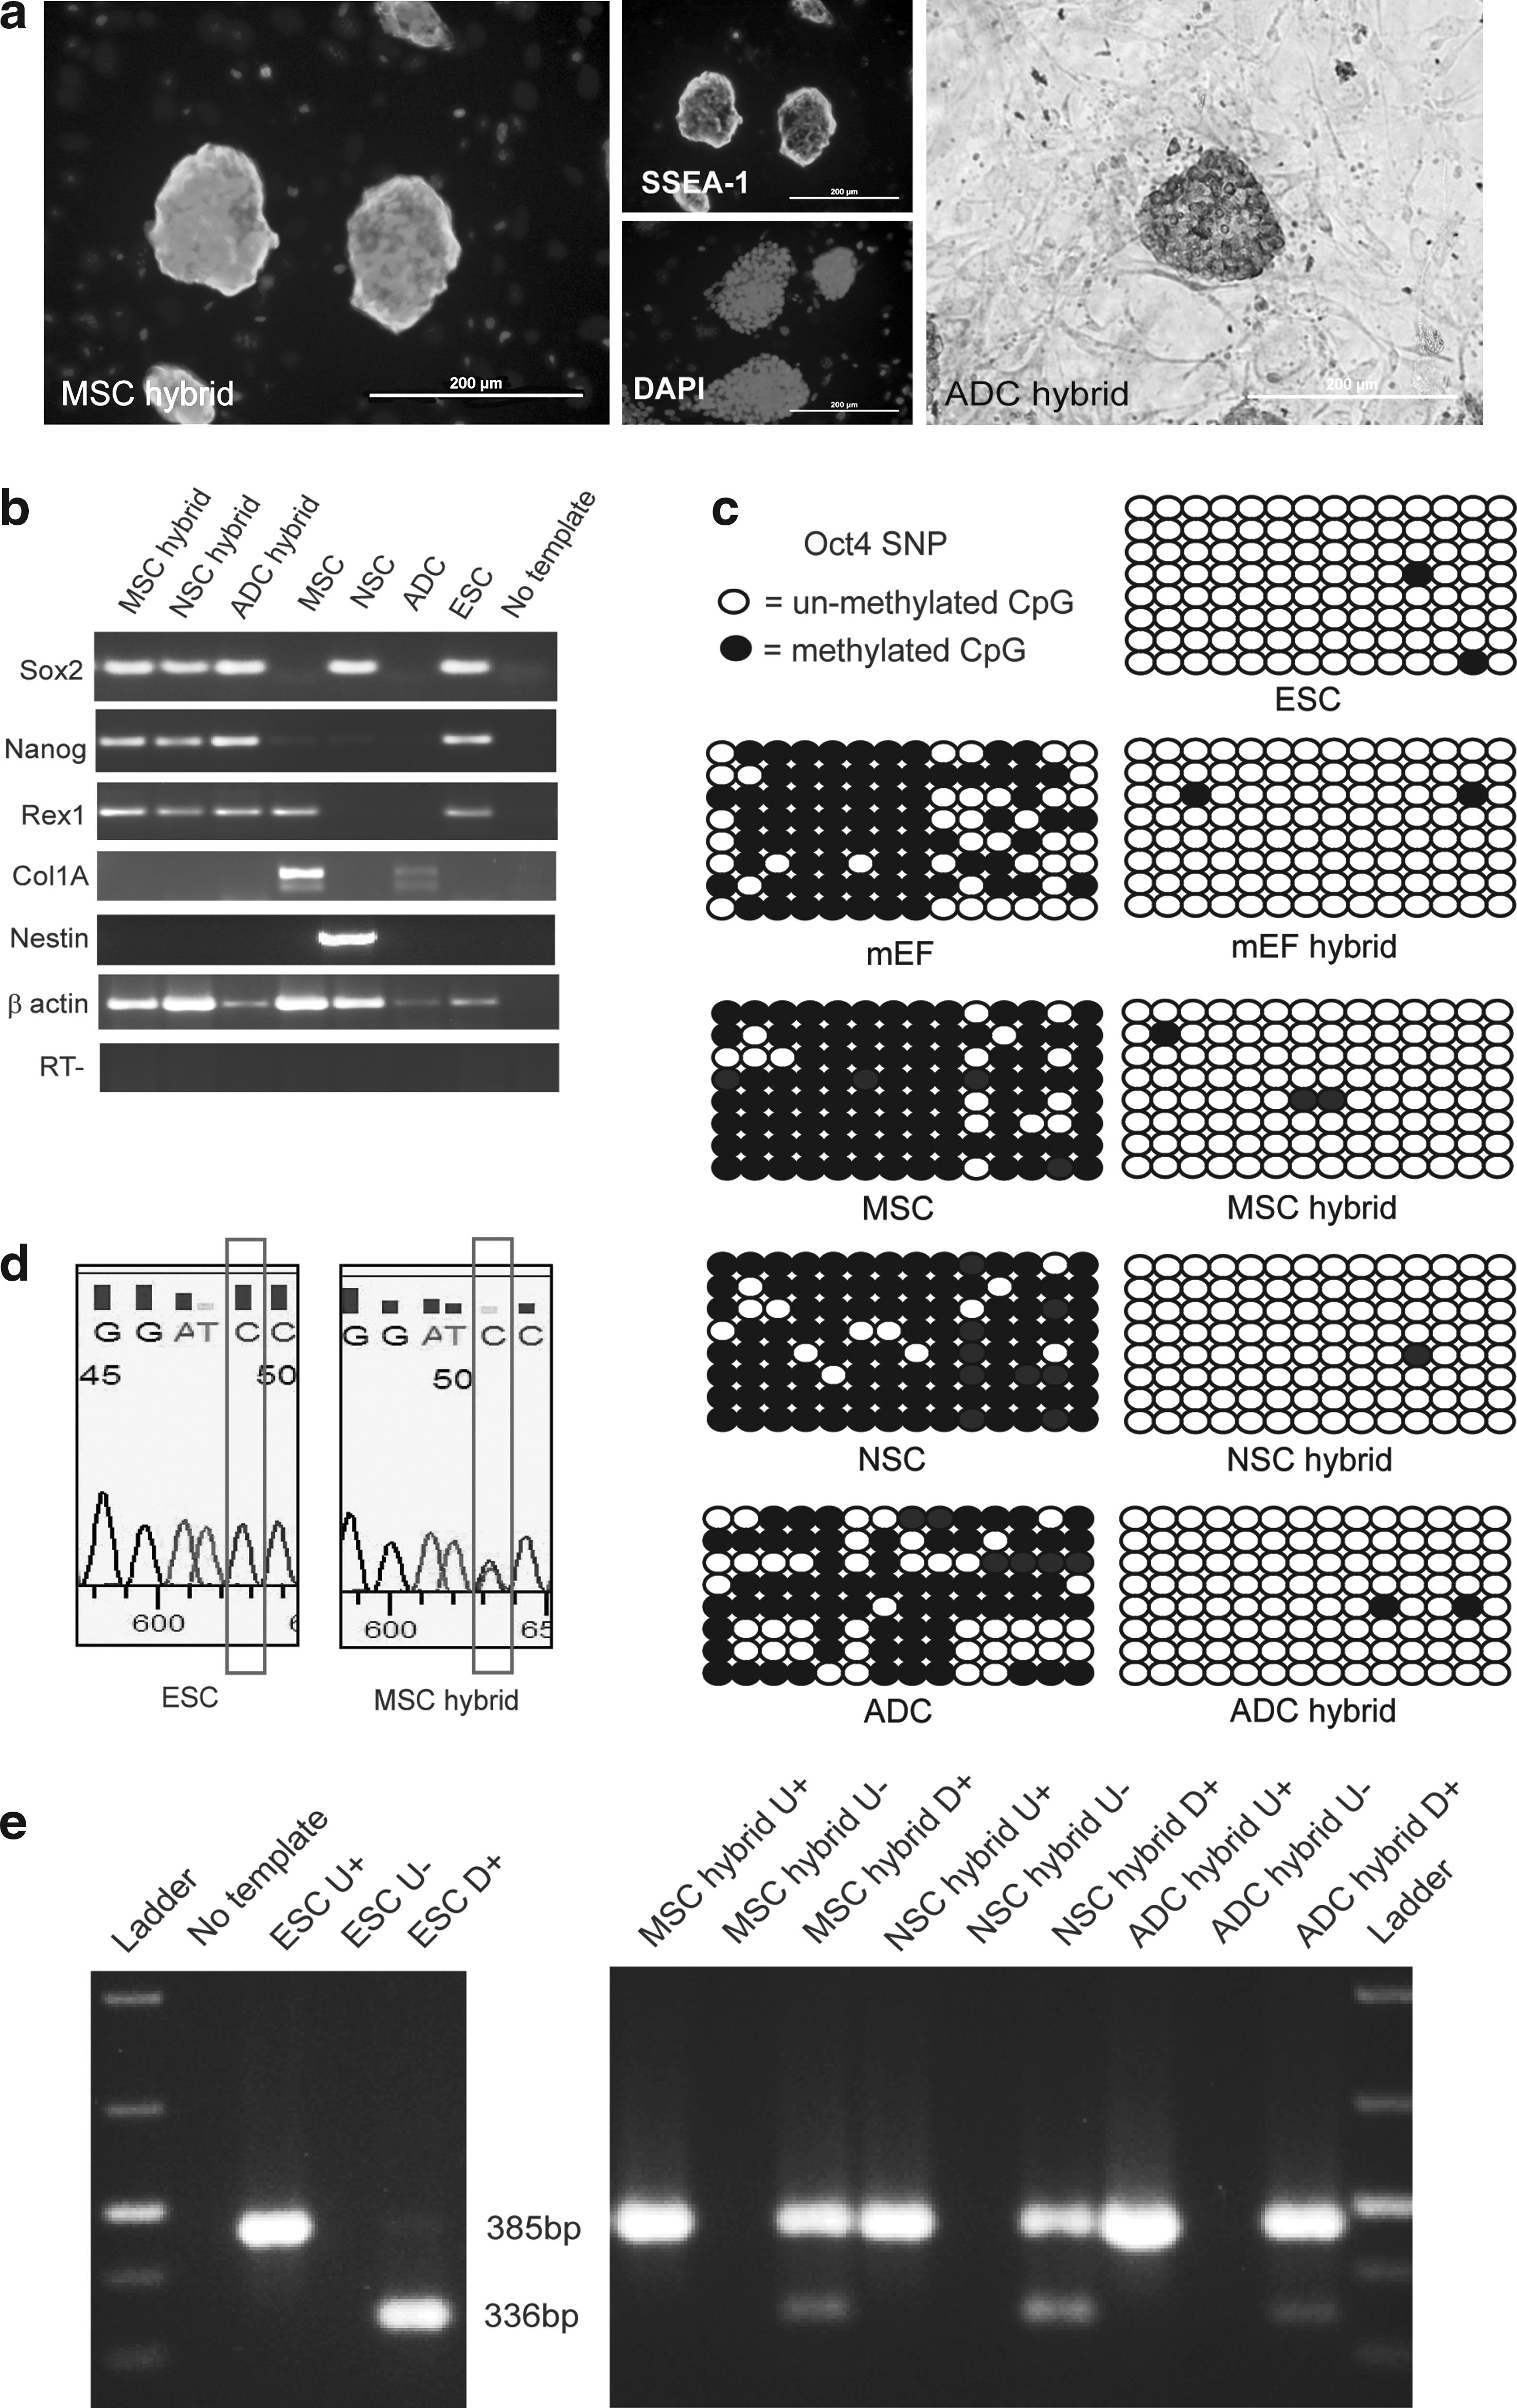
Characterization of hybrids. (
Although expression of the Oct4–GFP transgene in hybrid clones is an indicator of reprogramming, it does not directly indicate reprogramming of the somatic Oct4 gene. The Oct4 transcript of D3 ESCs contains a BamH1 restriction enzyme site; however, this cut site is disrupted in the OG2 somatic cell Oct4 transcript due to the presence of a SNP. Utilizing this SNP approach, the origin of the Oct4 transcripts in hybrid cells could be identified. All hybrid clones analyzed expressed endogenous Oct4 from both the D3 ESC and the OG2 somatic cell genomes as indicated by the presence of both the BamH1 digested (ESC) and undigested (OG2) bands (Fig. 3f). Due to the possibility of incomplete BamH1 digestion of the ESC Oct4, both bands were sequenced to confirm the presence of the SNP (Fig. 3e). To further verify transcriptional reprogramming of the endogenous somatic cell Oct4 promoter in hybrid cells, Oct4 SNP primers were used for bisulfite sequencing analysis. Bisulfite sequencing revealed that somatic cells were highly methylated at the endogenous Oct4 promoter prior to cell fusion (Fig. 3d). However, after fusion, the somatic cell endogenous Oct4 promoter of hybrid cells became demethylated.
To test the pluripotency of hybrid cells, tetraploid (4 N) aggregation, in vitro and in vivo differentiation were performed. Despite being 4 N, all hybrid clones contributed to the inner cell mass of blastocysts, suggesting that have pluripotent abilities (Fig. 4a). Furthermore, hybrid clones could also be used to obtain embryoid bodies which expressed key differentiation markers representative of the three germ layers (nestin, ectoderm; Foxa2, endoderm, and; brachyury, mesoderm; see Fig. 4b and c). Upon injection into SCID mice, the hybrid clones were capable of forming teratomas, which contained tissue derivatives of the three germ layers (see Fig. 4d). Taken together, these results indicate that the hybrid cell lines generated are pluripotent.
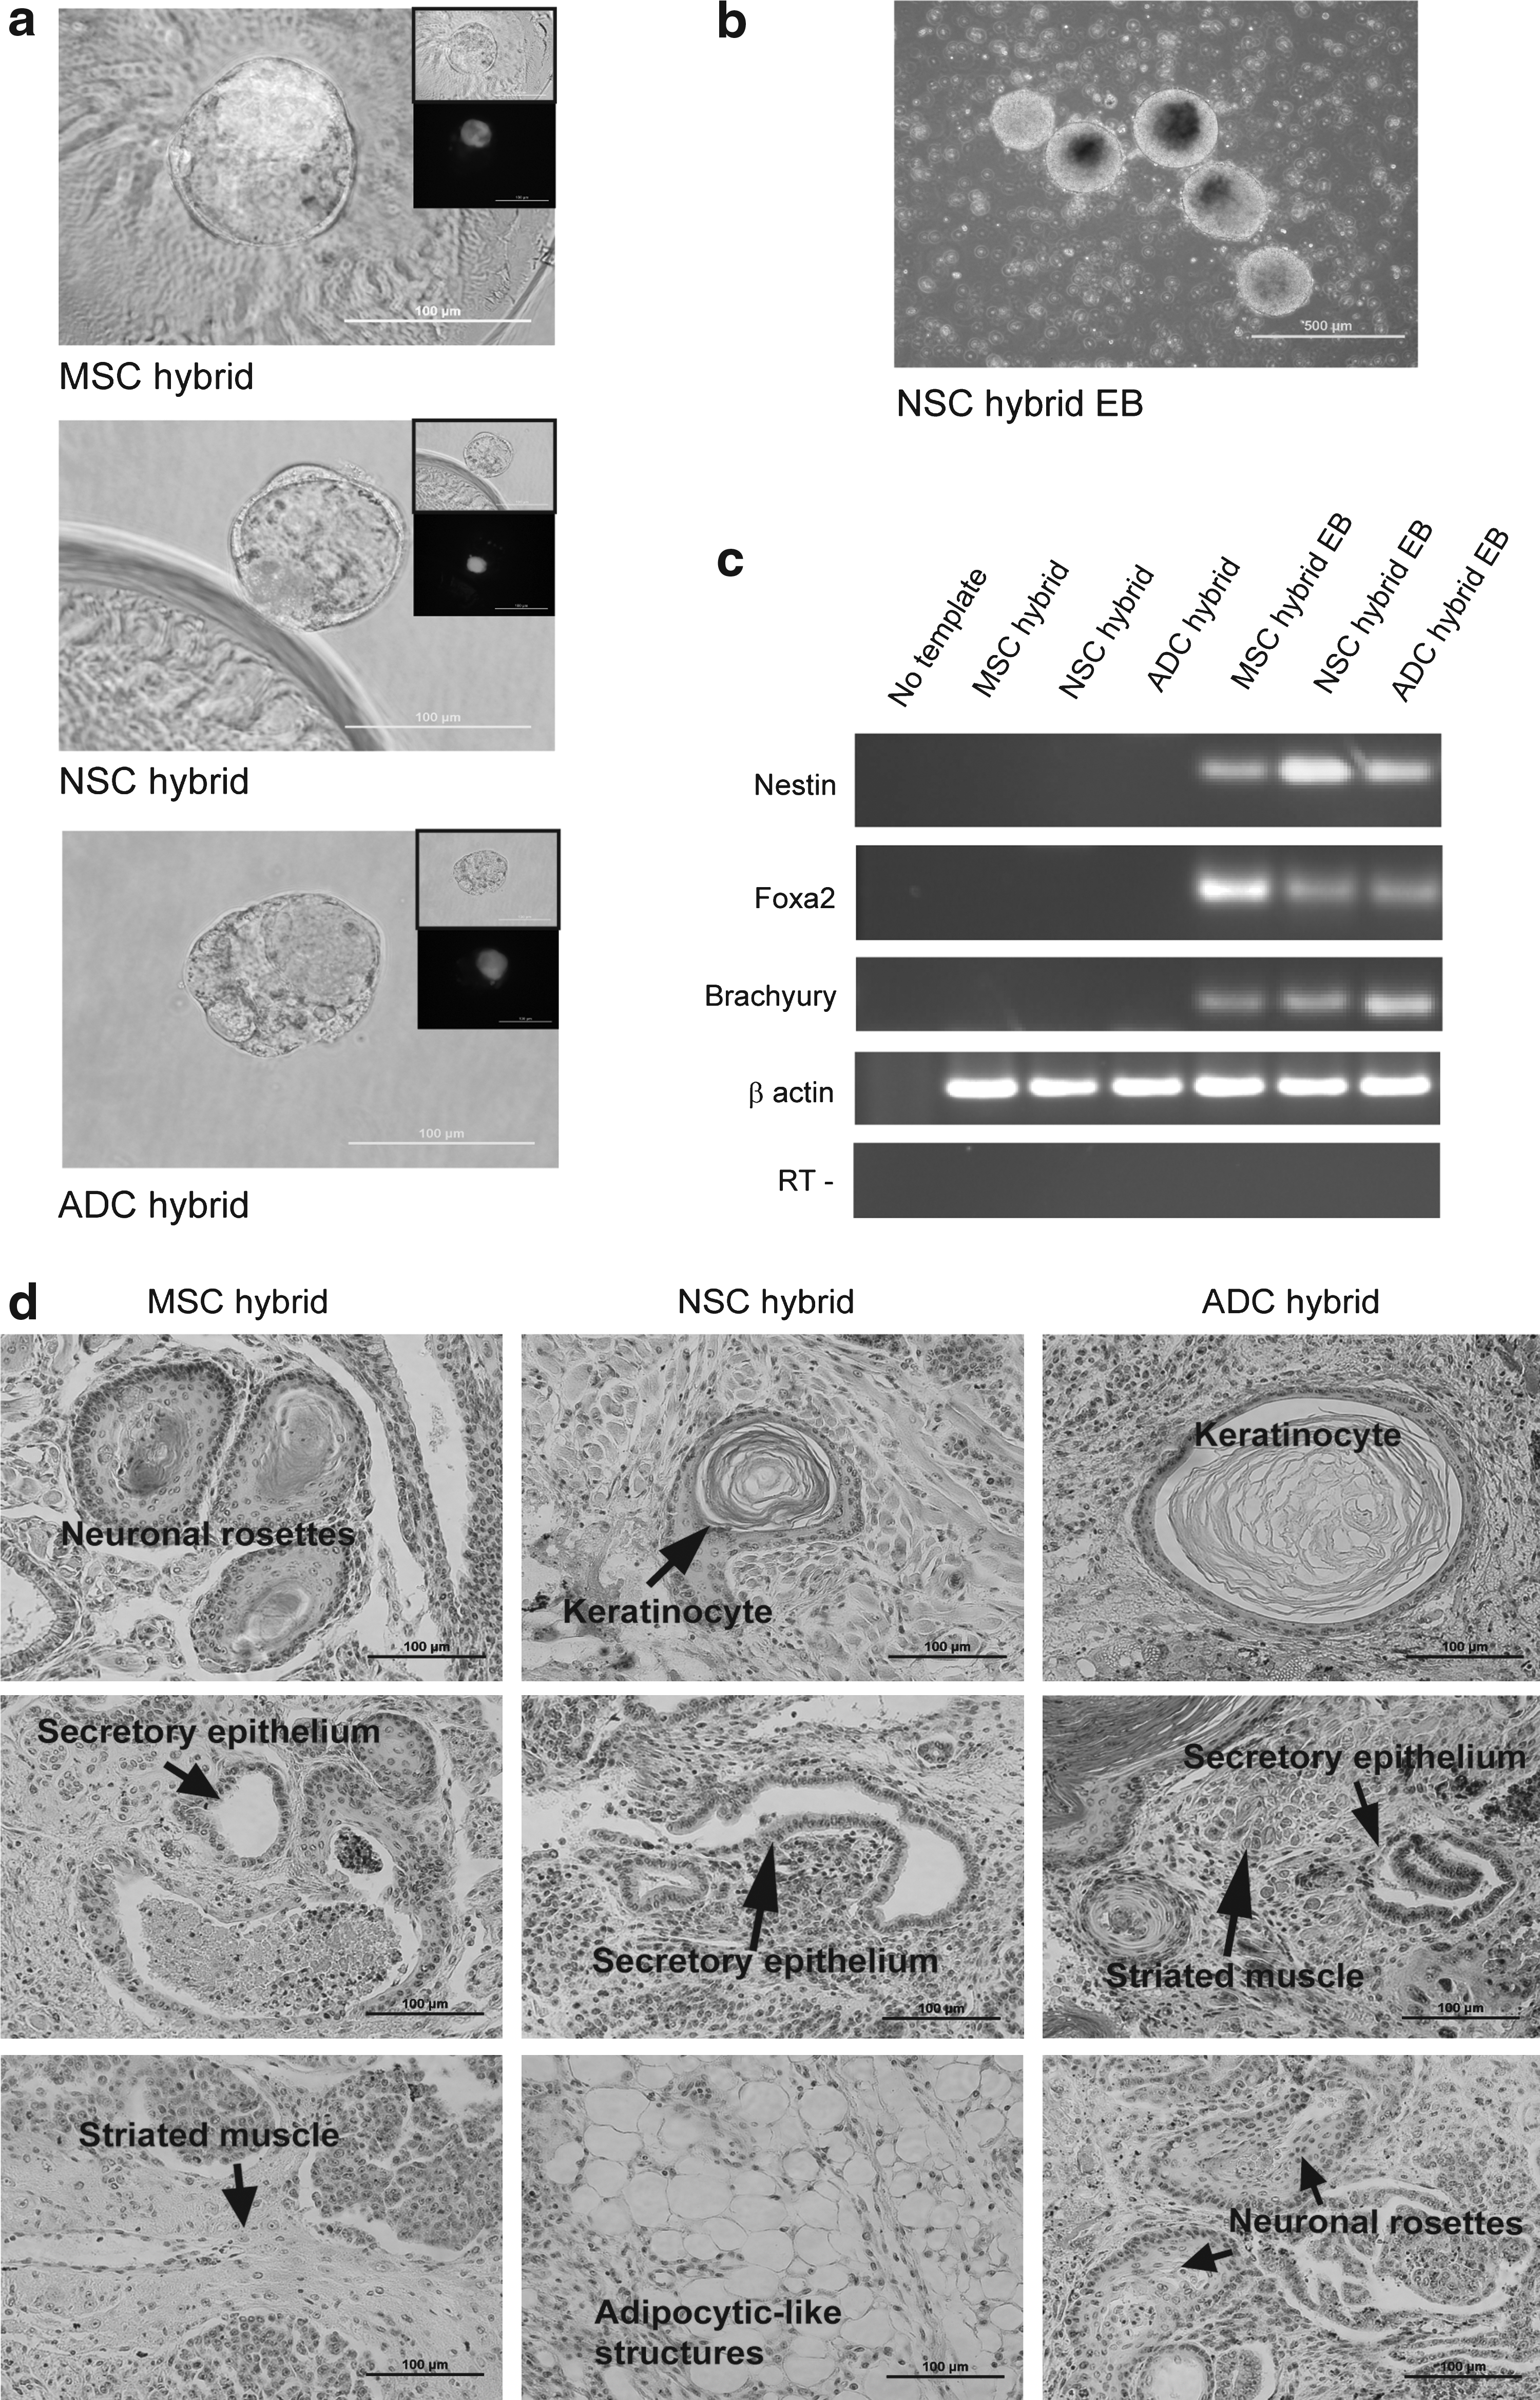
Pluripotency of hybrid cells. (
Comparing the fusion and reprogramming efficiencies of early and late passage mEFs
A comparison of the reprogramming efficiency between mEFs at early passage (passage 2) and mEFs at late passage (passage 6) was made using the optimized PEG fusion method. Note that mEF passaging usually occurred every 4–5 days. The mEFs at different passages were fused to ESCs at passage 19. The fusion efficiency using early- or late-passage mEFs was not significantly different (Table 4). However, the number of observed GFP+ colonies (90.20 ± 16.81 early vs. 17.60 ± 10.09 late GFP+ colonies, p < 0.05) and thus the calculated reprogramming efficiency was significantly higher for early-passage mEFs (0.33 ± 0.16% early vs. 0.02 ± 0.01% late, n = 5, p < 0.01; see Table 4).
Mean values ± SD are considered significant (p < 0.05) as determined by Student's t-test with Mann-Whitney assumptions.
Discussion
Although many somatic cell types have been previously investigated in cell fusion, the limiting factor of most studies was the use of somatic cells from different genetic backgrounds (Skelley et al., 2008). In this study, all somatic cell lines were derived from the same mice to eliminate genotype effects. The number of Oct4–GFP+ colonies observed and the reprogramming efficiency when using mEFs and MSCs was found to be significantly higher compared with NSC and ADC fusions (p < 0.05). The lower reprogramming efficiency seen in NSCs may be due to the high passage number used in the study. It was not possible to obtain sufficient NSC numbers at early passage, as the derivation efficiency of neurospheres from adult SVZ is low and primary neurosphere cultures contain many cellular aggregates and debris that can only be eliminated after serial passaging (Deleyrolle and Reynolds, 2009). It is difficult to understand why NSCs would be approximately 20 times less efficient at being reprogrammed than mEFs, especially given the high reprogramming efficiencies obtained in SCNT (Blelloch et al., 2006; Mizutani et al., 2006; Yamazaki et al., 2001) and iPS studies (Kim et al., 2008; Tat et al., 2010). However, because NSCs are difficult to propagate and manipulate compared with fibroblast-type cells, it is also possible that the PEG treatment may have led to the increased cell death of fragile cells and subsequently eliminated most of the reprogrammed cells. Indeed, a significantly lower proportion of NSCs are detected as fused events, which correlate with the idea that a majority of NSCs may die during PEG fusion. Furthermore, the addition of serum to NSCs following fusion treatment may cause NSCs to begin differentiating. NSCs are usually cultured serum free in the presence of EGF, which is not present in mouse ESC media. Because fusion-based reprogramming appears to be only complete after 48 h (Silva et al., 2006; Tada et al., 2001), fused NSCs were cultured in conditions that would were not favorable to their growth, thereby potentially resulting in greater cell death. On the other hand, mEFs, MSCs, and ADC based media contain serum and all these cells can grow optimally in mouse ESC media.
Interestingly, ADCs also resulted in a significantly lower reprogramming efficiency. The effect of using somatic cells at different passage numbers is negligible because they were also used at the same passage as mEFs and MSCs. ADCs also share some common markers with MSCs and are from the same mesodermal germ lineage, so the significant differences seen in reprogramming ability were surprising. One difference observed between mEFs, MSCs, and ADCs in this study was the higher proportion of ADCs at the G2/M phase. One study previously showed that when mEFs were serum starved and thus arrested at the G0 phase, an increase in hybrid colony formation was seen (Sullivan et al., 2006a). Because less ADCs are at the G0 phase compared with mEFs and MSCs, this cell cycle difference may account for the low reprogramming efficiency seen with ADCs. Another reason may be that the MSCs used in this study contained more mesenchymal progenitors, whereas ADCs may have contained more differentiated cells. Given that progenitor type cells of certain lineages have been shown to be more easily reprogrammed by SCNT, this may explain a higher reprogramming efficiency for MSCs.
Expression of the Oct4–GFP transgene is a first indicator that potentially reprogrammed ESC-somatic cell heterokaryons have been generated, because the transgene would not be expressed by somatic–somatic homokaryons, whereas ESC–ESC homokaryons do not possess the transgene. However, we and others have shown that expression of Oct4–GFP does not necessarily equate with full reprogramming or activation of the endogenous Oct4 (Han et al., 2008; Sumer et al., 2009). In fact, it has been reported that there is an asynchronous timing of activation between the Oct4–GFP transgene and endogenous Oct4 (Han et al., 2008). Therefore, full characterization was undertaken, to ensure complete reprogramming between the hybrid lines generated. Demethylation of the endogenous Oct4 and Nanog promoters is known to occur within 24 h of fusion and it has been shown that complete reprogramming requires 48 h (Han et al., 2008; Tada et al., 2001). Additionally, nuclear fusion occurs at 72 h postfusion; therefore, we chose to screen for initial reprogramming events at this time point (Pereira et al., 2008). However, a recent study showed that complete demethylation of the somatic endogenous Oct4 promoter of hybrids requires at least 4 days to reach equivalence to the ES cell Oct4 promoter (Gridina and Serov, 2010). Thus, we picked clones and expanded the hybrid cell lines for many passages prior to characterization to ensure that sufficient time was allowed for completion of reprogramming.
All hybrid cell lines were found to be near tetraploid containing genomic DNA from both parental cells thus confirming that the GFP+ cells picked were hybrid cells. The PI flow cytometry profiles also showed that a high proportion of hybrid cells were in the S phase of the cell cycle, suggesting that the hybrid cell lines are highly proliferative akin to ESCs. All hybrid cells showed ESC morphology and expression of the pluripotent markers. On the contrary, somatic cell specific markers were not detected, suggesting that the somatic cells had been reprogrammed. Transcriptional reprogramming of the somatic cell genome was confirmed both by the mRNA expression and the demethylation of the endogenous Oct4 and Nanog loci. All hybrid cell lines were capable of contributing to the ICM of blastocysts and could differentiate into cell types of the three germ layers upon spontaneous in vitro and in vivo differentiation. These results confirm that the Oct4–GFP+ hybrid cell lines were indeed extensively reprogrammed with no obvious differences observed between hybrid lines derived from the different somatic cell types. However, more stringent directed differentiation assays may reveal subtle differences between the various hybrid lines. It would be very interesting to see if hybrid cell lines generated using different somatic cell types, like different human ESC lines have the propensity to differentiate preferentially toward specific lineages. It has been reported that iPS cell lines derived from different somatic cells differed in their ability to be differentiated toward the neural lineages (Miura et al., 2009). The so-called retention of an epigenetic memory by somatic cells has captured the attention of the reprogramming field. Interestingly, a recent study showed that the epigenetic memory of somatic cells was retained in early passage iPS cells and thus influenced their in vitro differentiation capacities; however, these differences were overcome with continued long-term passaging (Polo et al., 2010). This finding suggests that our different hybrid lines may not have been reprogrammed equally at the early stages but because we characterized them at late passages, these differences would have been masked. Future studies could involve the analysis of early reprogramming events occurring at the heterokaryon stage prior to nuclear fusion.
Given that the use of NSCs at a different passage could have influenced our outcomes, we investigated the question of whether early passage somatic cells were more amenable to reprogramming than later passage somatic cells. It was found that early passage (passage 2) mEFs showed significantly higher numbers of GFP+ colonies than late passage (passage 6) mEFs (71 vs. 17, p < 0.01). Because the fusion efficiency was not significantly different when using early- or late-passage mEFs, this indicates that expression of the Oct4–GFP transgene was occurring more frequently in fusions involving early passage mEFs. As previously mentioned, this seems to differ from findings by the Sullivan et al. (2006a) study where a 50-fold increase in hybridization frequency was observed when mEFs were serum starved and therefore quiescent prior to fusion with mouse ESCs. Differences in our findings could be due to the different ages of cells used. Also, there may be inherent gene expression differences between early-passage somatic cells induced to enter quiescence by serum starvation and naturally aging late-passage somatic cells. Indeed, in adult stem cell populations, such as MSCs, aging has been linked to a lower differentiation potential indicating a change in epigenotype (reviewed in Roobrouck et al., 2008). This might suggest that a senescent epigenotype is prohibitive to reprogramming through ESC fusion. Therefore, we postulate that aged somatic cells may acquire unique epigenetic modifications in long-term culture making them less amenable to cell fusion-based reprogramming. This supports SCNT studies where it has been found that somatic cell nuclei derived from aged mice require a second round of NT or the generation of intermediate chimeric mice to deliver robust cloning outcomes (Mizutani et al., 2008). Furthermore, recent iPS studies have shown that senescence, and hence, the loss of replicative potential in mEFs is a barrier to reprogramming via induced pluripotency (Banito et al., 2009; Li et al., 2009; Utikal et al., 2009). These studies showed that down regulation or deletion of the Ink4a/Arf locus, which encodes tumor suppressors critical for activating the two antiproliferative pathways: Rb and p53, can yield iPS colonies faster and at a higher efficiency. Furthermore, iPS protocols advise that mEFs should not be used later than passage 3, suggesting that the efficiency of iPS induction may be reduced with aged cells (Takahashi et al., 2007). More in-depth analyses are needed to determine the exact mechanisms of cell aging and how this affects a cell's epigenotype.
In summary, we have shown that the ability to reprogram somatic cells is unaffected by the method of cell fusion. However, the ability of cells to be reprogrammed is greatly influenced by their age and time in culture, and therefore, caution should be taken when drawing conclusions from varied studies where cells at different aged states are employed. We have also shown that a variety of somatic cells can be reprogrammed by mouse ESCs and used to generate hybrid cell lines albeit with different reprogramming efficiencies. The results here conflict with the previous conclusion that all somatic cell types have the same cell fusion reprogramming potential (Do and Scholer, 2005). Nevertheless, our findings do suggest that the endogeneous expression of Sox2 is a poor indicator of a cell's reprogramming potential thus disproving our initial assumptions. However, as yet unidentified factors could still significantly influence reprogramming. The low efficiency reprogramming of NSCs observed in this study also contradicts previous iPS cells reports using NSCs as starting cells (Kim et al., 2008). Furthermore, our group previously reported the high efficiency generation of mouse iPS cells from ADCs, which was 38-fold greater than when using mEFs (Tat et al., 2010). This may highlight a different mechanism of reprogramming for each reprogramming technique. Cell fusion leads to rapid reprogramming of the somatic cell genome, as the Oct4–GFP transgene is reactivated within 24 h of fusion, whereas induced pluripotency can take 7–12 days in mice (Do and Scholer, 2004; Hasegawa et al., 2010; Okita et al., 2007). This suggests that different pathways of pluripotency may be activated in each technique. This supports the notion that the mechanisms behind cell fusion-based reprogramming differ from induced pluripotency-based reprogramming and warrant further investigation.
Footnotes
Acknowledgments
We thank Dr. Paul Hutchinson for help in analyzing flow cytometry data, Dr. Ben Rollo for designing the PCR primers, Dr. Kyle Upton for designing the bisulfite primers, and Dr. Mark Williamson for histology advice. P.A. Tat was supported by an Australian Stem Cell Centre (ASCC) postgraduate research bursary. This work was supported by the Victorian Government's Operational Infrastructure Support Program.
Author Disclosure Statement
The authors declare that no conflicting financial interests exist.