
Abstract
Abstract
The success rate of bovine somatic cell nuclear transfer (SCNT) embryos to full term has been reported to be higher with G1 cells than with G0 cells. To better understand the reason for this, we analyzed the kinetics of luminescence activity in bovine SCNT embryos from G0 and G1 cells carrying a luciferase gene under the control of the β-actin promoter during early embryonic development. At 60-h postfusion, when bovine embryonic gene activation (EGA) begins, the luminescence activity was higher in G1-SCNT embryos than G0-SCNT embryos. Moreover, half of the G1-SCNT embryos exhibited homogeneous luminescence among the blastomeres, whereas more than half of the G0-SCNT embryos exhibited mosaic luminescence. To characterize the differential luminescence pattern in SCNT embryos, the expressions of several endogenous genes and the level of DNA methylation were determined in all blastomeres of SCNT embryos with or without luminescence. The expressions of several development-related genes (H2AFZ, GJA1, and BAX) and level of DNA methylation of the SCNT embryos with luminescence were the same as those of normal embryos produced by in vitro fertilization. A higher success rate in G1-SCNT embryos is thought to contribute to homogeneous expression among all blastomeres at EGA.
Introduction
To obtain healthy offspring from SCNT embryos, the nuclei of somatic cells transferred into enucleated oocytes need to be subjected to epigenetic reprogramming including DNA methylation and histone modification. Reprogramming on an epigenetic level has been shown to be incomplete in SCNT embryos from the one-cell to the blastocyst stage (Bourc'his et al., 2001; Dean et al., 2001; Kang et al., 2001; Santos et al., 2003; Wee et al., 2006). The expression patterns of several genes important for pre- and postimplantation in SCNT embryos were different from IVF embryos (Daniels et al., 2000; Inoue et al., 2010; Wrenzycki et al., 2001). Even in a single SCNT embryo, mosaic gene expression has been found in blastomeres of SCNT embryos (Chung et al., 2003; Kasamatsu et al., 2007; Park et al., 2002).
In embryonic development, activation of the embryonic genome is critical for the onset of transcription (Meirelles et al., 2004; Memili and First, 2000). In cattle, major genomic activation occurs in 4- to 16-cell embryos (Barnes and First, 1991; Frei et al., 1989). We previously showed that among SCNT embryos from G0 cells carrying the firefly luciferase gene under the control of the β-actin promoter (β-act/luc+), those with uniform gene expression had a greater ability to develop to the blastocyst stage (Kasamatsu et al., 2007).
In this study, to investigate relationship between kinetics of gene expression in SCNT embryos with high developmental competence and their subsequent development, we analyzed bioluminescence patterns in the SCNT embryos from bovine fibroblasts at the G0 and G1 phases carrying the β-act/luc+ gene. In addition, we examined the expressions of several development-related endogenous genes and genome-wide methylation in all blastomeres of SCNT embryos with or without luminescence.
Materials and Methods
All chemicals were purchased from Sigma-Aldrich (St. Louis, MO, USA) unless indicated otherwise.
Gene transfection and preparation of donor cells for nuclear transfer
We used bovine transfected fibroblasts carrying an improved firefly luciferase (luc+) gene under the control of a chicken β-actin promoter as a nuclear donor (Kasamatsu et al., 2007). A β-actin promoter was bound to the upstream of the luciferase gene and internal ribosome entry site (IRES) sequence and an enhanced green fluorescent protein (EGFP) gene were added to the downstream of the luciferase gene, followed by a neomycin resistance cassette [pβ-act/luc+/IRES/EGFP/(neor)]. The pβ-act/luc+/IRES/EGFP/(neor) was transfected into the fibroblasts using a transfection reagent (GeneJammer; Stratagene, La Jolla, CA, USA). Forty-eight hours after transfection, the culture medium was replaced with Dulbecco's Modified Eagle's Medium (DMEM; Nissui Pharmaceutical, Tokyo, Japan) supplemented with 20% fetal bovine serum (FBS; BioWest, Paris, France) and 600 μg/ml G-418 (Geneticin; Invitrogen Corp, Carlsbad, CA, USA), and then the cells were cultured in the medium for 15–20 days for selection of neomycin resistant cells. The surviving cell colonies were further selected by their EGFP fluorescence under UV light to obtain stably transfected cells. We obtained two stably transfected cell lines. Because the characteristics of luminescence pattern of SCNT embryos throughout preimplantation development were similar in these cell lines (Kasamatsu et al., 2007), we used a single line throughout this study.
Methods of synchronization at the G0 or G1 phase of transfected fibroblasts for nuclear transfer are described as follows. Cells at the G0 phase were prepared by serum starvation (0.4% FBS-DMEM) for 7 days. Cells at the G1 phase were prepared by the method previously reported by Urakawa et al. (Urakawa et al., 2004) with some modifications. Briefly, the growing cells were cultured in α-minimum essential medium supplemented with 20% FBS (FBS-α-MEM) with 1 μM 2-methoxyestradiol (2-ME), an inhibitor of cell division at metaphase, for 30 min, to obtain mitotic cells at metaphase. The culture dish was shaken for 1 min. Then, the medium was changed to 10% FBS-α-MEM with 1 μM 2-ME. The cells having a diameter of approximately 20 μm were collected from the cell population of the supernatant after having been shaken three times. The collected cells were placed in a droplet (20 μL) of 10% FBS-α-MEM and cultured for 2 h at 37°C in 5% CO2 in air with high humidity to allow for division of the cells. The daughter cells that had been divided within 2 h were used as G1 cells for nuclear transfer. Only EGFP-positive cells were used for SCNT.
In vitro maturation of oocytes
Bovine oocytes were matured according to a procedure reported previously (Saeki et al., 1998). Briefly, bovine ovaries were obtained from a local slaughterhouse and were transported in saline at 20–25°C. Cumulus–oocyte complexes (COCs) were aspirated from the ovaries, collected, and washed with 25 mM HEPES-buffered TCM199 with Hanks' salts (H199-H, Gibco, Invitrogen Life Technologies, Tokyo, Japan) supplemented with 5% (v/v) FBS and 25 μL/mL gentamicin (FBS-H199-H). The washed COCs were matured for 18–21 h in 50 μL of 25 mM HEPES-buffered TCM199 with Earle's salts (H199-E; Gibco) supplemented with 5% FBS, 0.5 mM sodium pyruvate, 25 μg/mL gentamicin, 0.02 AU/mL FSH (Antrin; Kawasaki Seiyaku, Tokyo, Japan), and 1 μg/mL estradiol-17β under paraffin oil at 39°C in 5% CO2 in air with high humidity (10 COCs/droplet).
Production of SCNT embryos
Somatic cell nuclear transfer was carried out as described previously (Hoshino et al., 2009; Hoshino and Saeki, 2010; Kasamatsu et al., 2007). The surrounding cumulus cells were removed by pipetting COCs at 18–21 h postmaturation in FBS-H199-H containing 0.25% (w/v) hyaluronidase. The zonae pellucidae of oocytes with first polar body was slit using a fine glass needle. A small volume of cytoplasm and the polar body was moved by the pressing the oocyte with the needle. Enucleation was confirmed by visualizing the karyoplast under UV light after staining a small amount of cytoplasm with 20 μg/mL Hoechst 33342. Donor cells that were synchronized at the G0 or G1 phase were inserted into the perivitelline space of the enucleated oocytes. These couplets were held by two needle electrodes (Mitani et al., 1993) and were electrically fused by two direct current pulses of 2.72 kV/cm for 11 μsec each using an Electro Cell Manipulator (ECM-200; BTX, San Diego, CA, USA) in Zimmerman fusion medium (Robl et al., 1987). Fused couplets were activated with 5 μM ionomycin for 5 min and then treated with 10 μg/mL cycloheximide in modified synthetic oviduct fluid medium (mSOFM) (Saeki et al., 1998) without KH2PO4 until 6 h postfusion (hpf) at 39°C in 5% CO2, 5% O2, and 90% N2 with high humidity. Following activation, the SCNT embryos were cultured in 50 μL mSOFM covered with paraffin oil until luminescence was detected at 39°C in 5% CO2, 5% O2, and 90% N2 with high humidity (20–30 embryos/droplet).
In vitro fertilization
In vitro fertilization was carried out as described previously (Saeki et al., 1998). Briefly, frozen–thawed spermatozoa were washed with a discontinuous gradient Percoll solution (Amersham Biosciences, Uppsala, Sweden) (Saeki et al., 1991). Matured COCs cultured 21 h in the maturation medium were inseminated with Percoll washed spermatozoa in a defined medium (Brackett and Oliphant, 1975) modified by excluding glucose and supplemented with heparin (yielding final concentrations of 2×10⁶ sperm and 10 μg heparin/mL). Oocytes and spermatozoa were coincubated for 18 h under 5% CO2 in air at 39°C with high humidity (10 COCs/100 μL). Following fertilization, the surrounded cumulus cells were removed from the oocytes and the oocytes were cultured under the same conditions as the SCNT embryos.
Determination of LUC+ activity in SCNT embryos
Luciferase activity was detected in SCNT embryos as described previously (Kasamatsu et al., 2007). Briefly, the luminescence of the embryos was detected in a medium containing 500 μM D-luciferin using an imaging photon counter (ARGAS 50, Hamamatsu Photonics, Shizuoka, Japan). The activity of luminescent embryos was recorded for detection time. The mean LUC+ activity of each embryo was calculated from the total photon count accumulated in the 10-min period and was displayed in relative light units (RLUs). To determine the luminescence of each blastomere in the embryos, the zonae pellucidae were removed by treating with 0.5% (w/v) pronase (Roche Diagnostics, Basel, Switzerland). The luminescence was quantitatively determined for 10 min.
mRNA extraction and cDNA synthesis
Ten embryos derived from SCNT or IVF at four- to eight-cell stage were pooled in 10 μL of diethylpyrocarbonate-distilled water. They were frozen immediately after collection using liquid nitrogen and stored at −80°C until total RNA isolation. Poly(A) mRNAs were extracted using a QuickPrep micro mRNA purification kit (GE Healthcare, Piscataway, NJ. USA) following the manufacturer's instructions. The extracted mRNA and the total RNA solution in each sample were incubated with DNase at 37°C for 30 min to remove genomic DNA. cDNA was synthesized from the total RNA using a SuperScript III First Strand Synthesis Kit with random hexamer (Invitrogen). The total volume of the solution of each cDNA sample was adjusted to 10 μL using TE. The cDNA samples (cDNAs of a single embryo per 1μL) were stored at −20°C until use for real-time polymerase chain reaction (PCR).
Real-time RT-PCR
Quantitative PCR was performed by 7300 Real-Time PCR System (Applied Biosystems, Foster City, CA, USA) using SYBR Green I (SYBR Green Premix Ex Taq; Takara, Otsu, Japan), a double-stranded DNA-specific fluorescence dye. Briefly, we purchased solutions that contained the probes and primers designed to detect the transcripts of bovine ACTB as an index of endogenous expression, and H2AFZ (H2A histone family, member Z), GJA1 (gap junction protein, alpha 1, 43 kDa) and BAX (BCL2-associated X protein) as an index of embryo viability at embryonic gene activation (Dode et al., 2006; Gutierrez-Adan et al., 2004; Meirelles et al., 2004; Misirlioglu et al., 2006).
Information for primers used is listed in Table 1. One microliter of cDNA sample, which corresponded to a single embryo, was added to each reaction tube. The amplification profiles of the target DNA sequences in each reaction tube were checked by measuring the intensity of the fluorescence of the probe in each tube. The intensity increases with amplification of target DNA. To quantify the amount of the target DNA sequence in each tube, Ct (threshold cycle), which is defined as the cycle number at which the increase in fluorescence started, was determined for each tube. To transform Ct into the amount of transcripts of each gene, the Cts of the solutions that contained 106, 105, 104, 103, and 102 copies/μL of DNA fragments of ACTB, H2AFZ, GJA1, and BAX were measured. Ct of each concentration of cDNA fragment prepared for each gene was plotted on a logarithmic scale against log2 of each cDNA fragment concentration. The curve obtained represents the standard curve. To measure the concentration of the transcripts of each gene in embryos, the Ct of each gene in each cDNA sample of SCNT or IVF embryos was measured by real-time PCR and was applied to the corresponding standard curve that was prepared for each gene.
F, forward; R, revcerse.
Immunostaining with anti-5-methylcytosine antibody in embryos
We previously found lower levels of methylation in IVF embryos than in SCNT embryos and lower methylation levels in G1-SCNT embryos than in G0-SCNT embryos (Iwamoto et al., 2007). In this study, 10 embryos derived from SCNT or IVF were washed in PBS containing 0.1% (w/v) polyvinyl alcohol (PBS-PVA) and fixed for 10 min in 4% (w/v) paraformaldehyde. After permeabilization with 0.5% Triton X-100, the embryos were subjected to 2 N HCl for 1 h and then neutralized for 10 min in 100 mM Tris-HCl buffer (pH 8.5). Embryos were blocked for 1 h in PBS containing 0.1% (v/v) Tween-20 and 2% BSA (w/v). Anti 5-methylcytosine antibodies (Calbiochem, San Diego, CA, USA) were detected with a secondary antibody coupled with Alexa 488 (Invitrogen, Molecular Probes, Carlsbad, CA, USA). The DNA was stained with propidium iodide (PI) following a ribonuclease A (RNase A; Roche) treatment at 37°C. Stained embryos were observed under confocal microscopy (TCS NT, Leica, Tokyo, Japan). For an analysis of levels of global DNA methylation, the quantity of the fluorescent image was determined using an image analyzer system (Aqua Cosmos, Hamamatsu, Japan), by the rates of 5-MeC to PI DNA signals.
Experimental Design
Experiment 1: Profiles of expression of luc+gene in SCNT embryos from G0 and G1 cells.
Profiles of luciferase activity in the SCNT embryos from G0 and G1 cells were examined by determining the luminescence at 0, 12, 24, 36, 48, 60, 72, 96, 120, 144, and 168 hpf. At each of these time points, the corresponding numbers of G0-SCNT embryos were 84, 75, 58, 77, 9, 53, 55, 54, 45, 40, and 26, respectively, and the corresponding numbers of G1-SCNT embryos were 63, 46, 43, 33, 33, 61, 62, 63, 57, 54, and 37, respectively. The experiments were repeated three times.
Experiment 2: Relationship of expression pattern of luc+ gene in SCNT embryos to their subsequent development to the blastocyst stage
The expression pattern of a luc+ gene in each blastomere of the SCNT embryos using G0 and G1 cells was examined by the method as described by Kasamatsu et al. (2007). In the present study, the cleavage rates to the four- to eight-cell stages of SCNT embryos from either G0 or G1 cells at 60 hpf were examined with stereomicroscopy (×60). The zonae pellucidae of the SCNT embryos were removed and luminescence was then determined in each blastomere of the embryos by an imaging photon counter. The embryos were classified into three groups depending on whether all, some, or no blastomeres were luminescent as being whole-LUC+, mosaic-LUC+, or non-LUC+, respectively. Somatic cell nuclear transfer embryos showed three luminescence patterns: all blastomeres were luminescent (whole-LUC+), some blastomeres were luminescent (mosaic-LUC+) and no blastomeres were luminescent (non-LUC+). Moreover, mosaic-LUC+ embryos were classified into four groups depending on the rate of luminescent blastomeres within single embryos as being three-quarters or more, one-half to three-quarters, one-quarter to one-half, or less than one-quarter. Also, luciferase activity in the SCNT embryos was examined by determining the level of luminescence using these images. The zona-free embryos were individually cultured in microwells (Nagy et al., 1993) made by pressing a darning needle in mSOFM at up to 168 hpf to allow the subsequent development to the blastocyst stage.
Experiment 3: Expression of endogenous genes in SCNT embryos
To examine the relationship between the expression of the luc+ gene and endogenous genes concerned with embryonic development in SCNT embryos, transcripts for the endogenous genes for ACTB, H2AFZ, GJA1, and BAX in whole-LUC+, or non-LUC+ (nonluminescent) SCNT embryos from G0 and G1 cells were examined by quantitative RT-PCR.
Experiment 4: Detection of DNA methylation in nuclei of SCNT embryos
To examine the relationship between the expression patterns of the luc+ gene and the DNA methylation in nuclei of SCNT embryos, we detected the DNA methylation status in nuclei of whole-LUC+ or non-LUC+ SCNT embryos by immunostaining with an antibody against 5-methylcytosine, and compared the levels of DNA methylation in the nuclei of IVF embryos.
Statistical analysis
Experiments were replicated more than three times. Data were analyzed using Stat View software (Abacus Concepts, Stat View, version J-4.11, Abacus Concepts, Berkeley, CA, USA). The data obtained from Experiment 2 was analyzed with Fisher's protected least significant difference (PLSD) tests following ANOVA. Differences of p<0.05 were considered to be significant. The data obtained from luminescence activity and Experiments 1, 3, and 4 were analyzed with Tukey-Kramer post hoc tests for multiple comparisons following ANOVA. Differences of p<0.05 were considered to be significant.
Results
Experiment 1: Profiles of expression of luc+ gene in SCNT embryos from G0 and G1 cells
To evaluate the profiles of embryonic gene expression during in vitro development, kinetics of luciferase activity was determined in SCNT embryos from G0 and G1 cells from cell fusion to the blastocyst stage (Fig. 1). The levels of the activity of SCNT embryos from both G0 and G1 cells were detectable but very weak until 48 hpf. At 60 hpf, the level increased, and then reached a plateau at 96 hpf. The levels decreased from 120 until 168 hpf. The level of G1-SCNT embryos at 0, 12, 24, 36, 60, and 72 hpf was higher than that of G0-SCNT embryos (p<0.05).
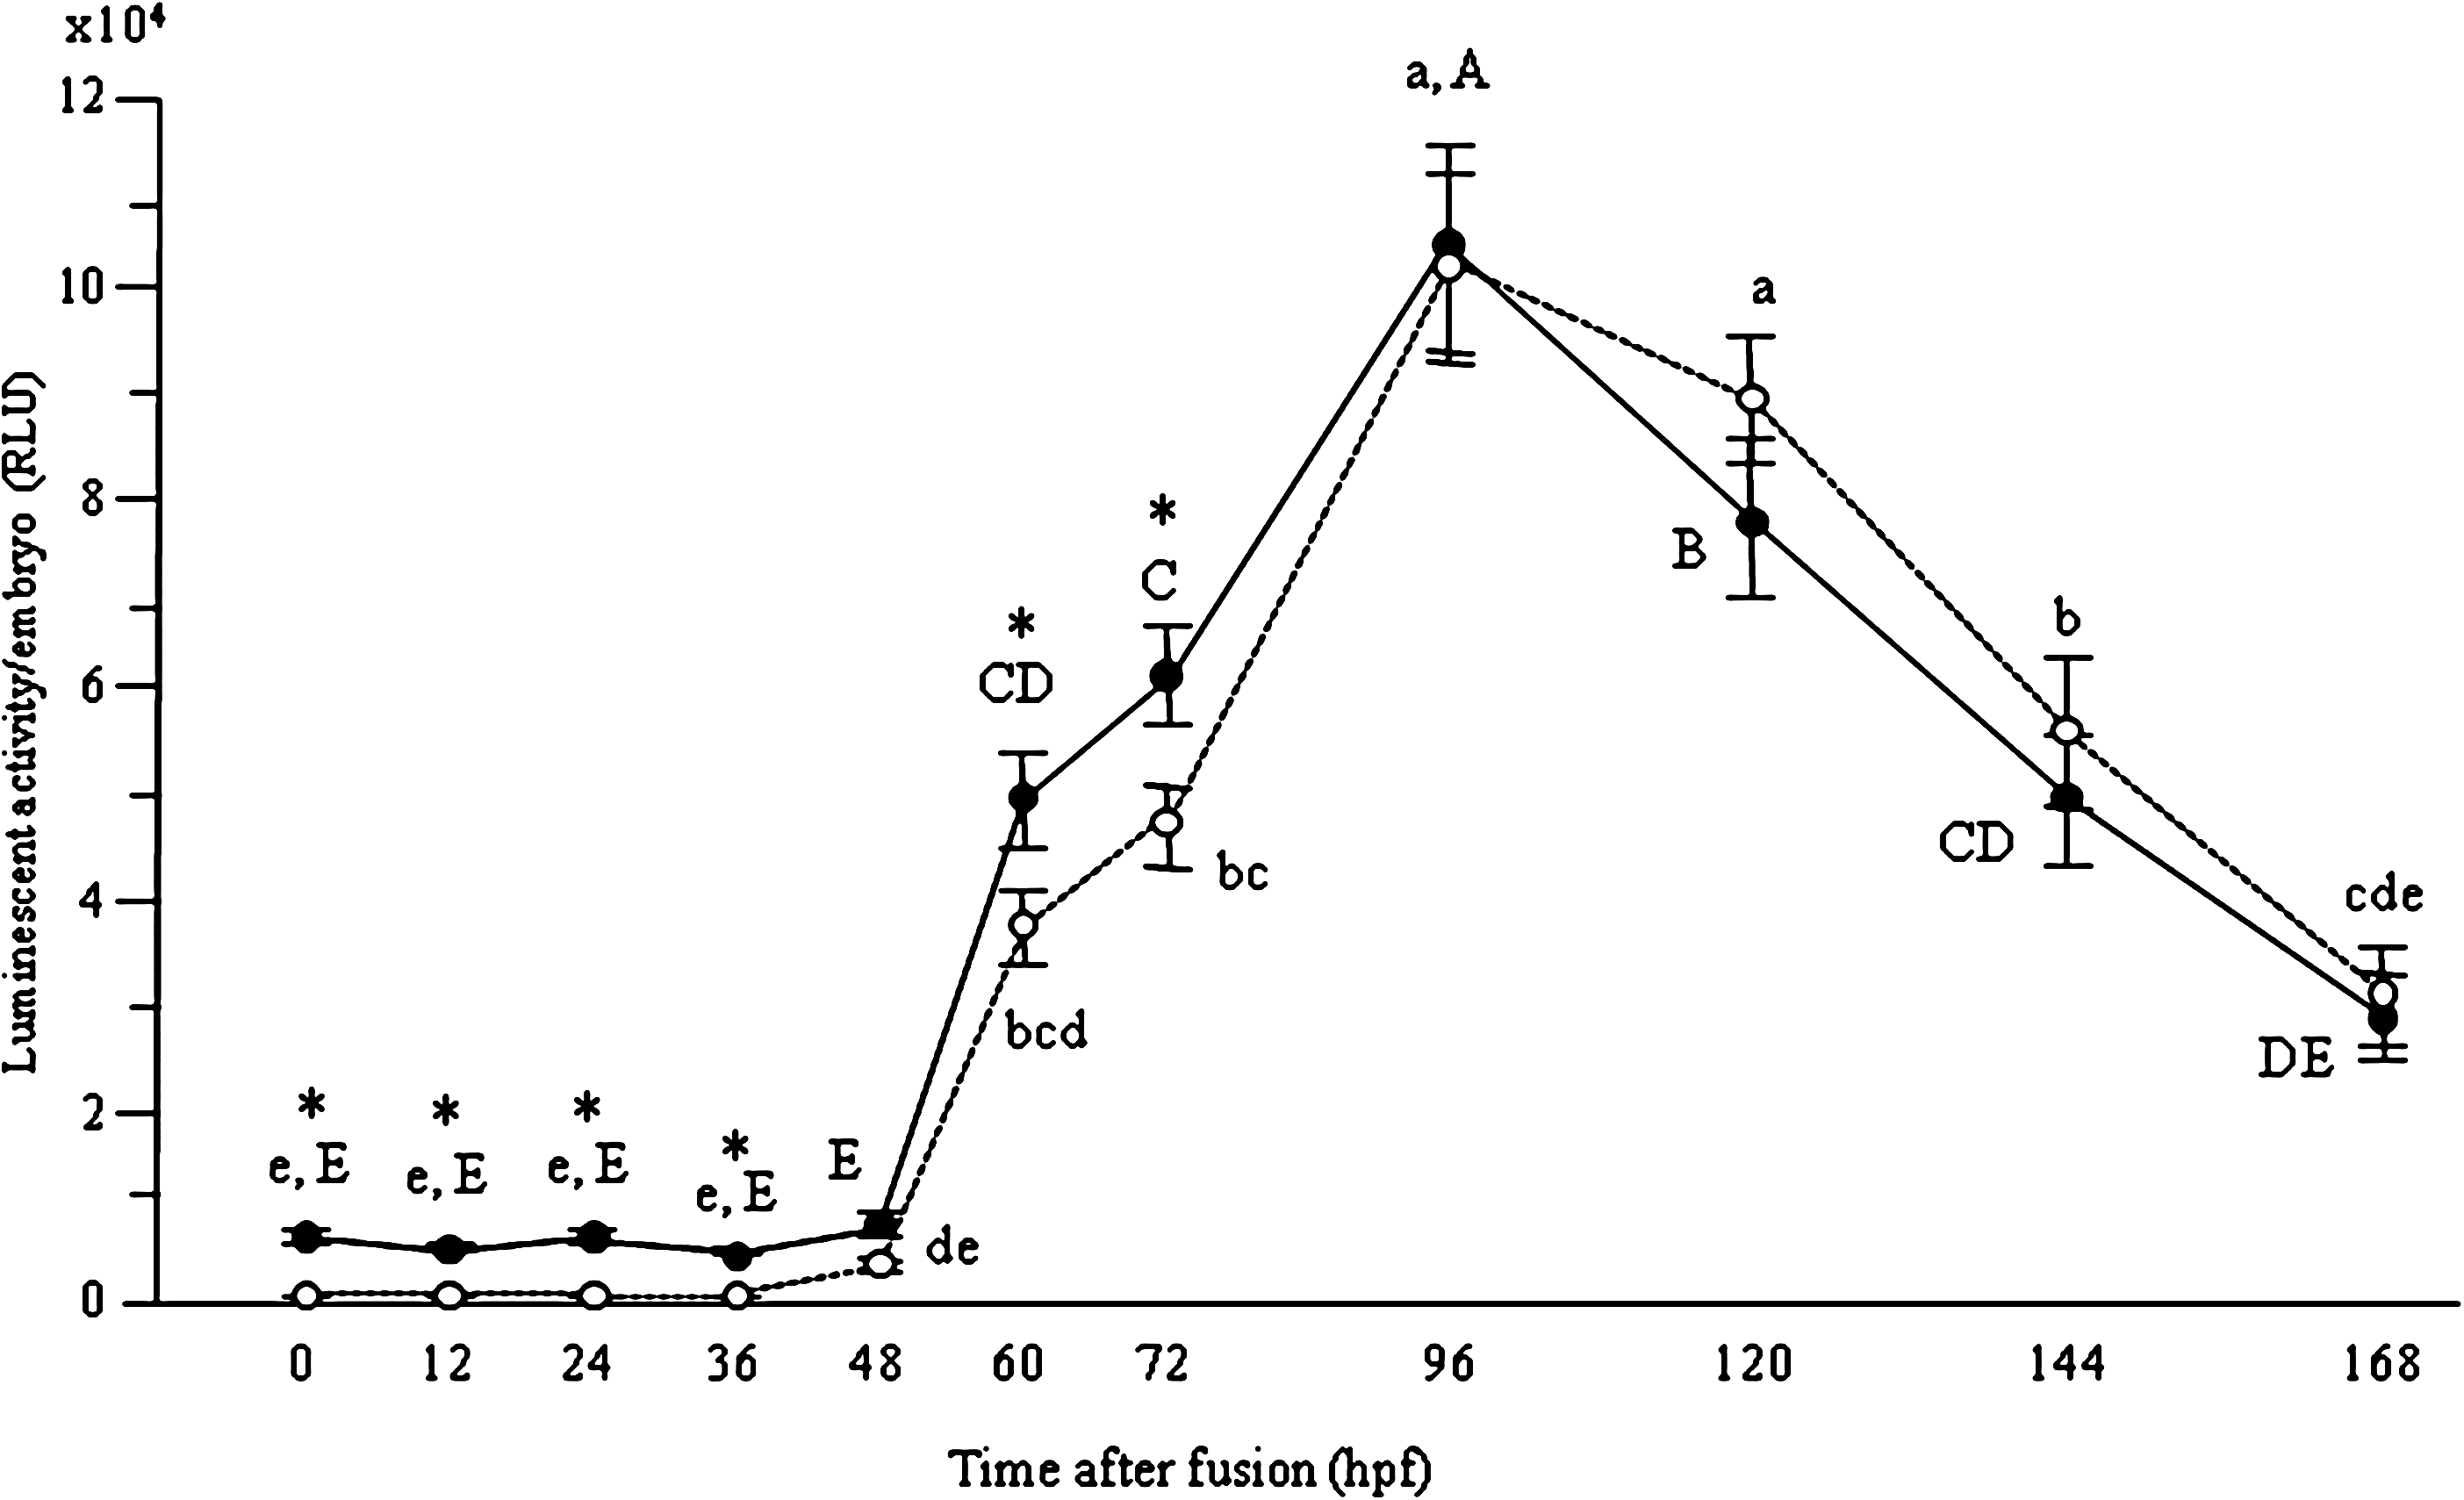
Profiles of luciferase activity in bovine SCNT embryos during in vitro development. Luciferase activity in bovine SCNT embryos from G0 (broken line) and G1 (solid line) cells was measured at 0, 12, 36, 48, 60, 72, 96, 120, 144, and 168 h postfusion. a–e and A–E superscripts were denote significant differences between G0-SCNT and G1-SCNT embryos, respectively (p<0.05). Asterisks were denote significant differences in the each time after fusion (p<0.05).
Experiment 2: Relationship of expression pattern of luc+ gene in SCNT embryos from G0 and G1 cells to their subsequent development to the blastocyst stage
The cleavage rates of SCNT embryos to four- to eight-cell stages from G1 cells were significantly higher than those from G0 cells (Table 2; p<0.05). Although morphology of SCNT embryos at four- to eight-cell stages was similar under stereo microscope, three luminescence patterns were observed (Fig. 2). The percentages of whole-LUC+ SCNT embryos form G1 cells were higher than those from G0 cells (Table 2; p<0.05).

Morphology and luminescence patterns in bovine SCNT embryos developed to four- to eight-cell stages at 60 hpf. Morphological images of whole-LUC+ (
Superscripts in the each column denote significant differences (p<0.05).
The SCNT embryos were further cultured to examine whether the classification of SCNT embryos by the LUC+-luminescence affects the subsequent development to the blastocyst stage. As shown in Table 2, we obtained blastocysts from whole-LUC+ and mosaic-LUC+ SCNT embryos that exhibited luminescence in three-quarters or more within single embryos. The blastocyst rate of mosaic-LUC+ SCNT embryos from G0 cells was lower than the other groups (p<0.05). On the other hand, no blastocyst was obtained in other groups (non-LUC+ or mosaic-LUC+ SCNT embryos exhibiting luminescence in less than three-quarters within single embryos). Total blastocyst rate of G1-SCNT embryos was higher than that of G0-SCNT embryos (G1 vs. G0, 32% vs. 10%).
To examine the relationship between luciferase activity and developmental capacity, luciferase activity was determined in the SCNT embryos at the four- to eight-cell stages at 60 hpf. Luciferase activity increased in correlation with the increasing percentage of luminescence in SCNT embryos. The activity of non- and mosaic-LUC+ SCNT embryos that exhibited luminescence in less than three-quarters within single embryos was approximately half that of whole-LUC+ SCNT embryos (Fig. 3).
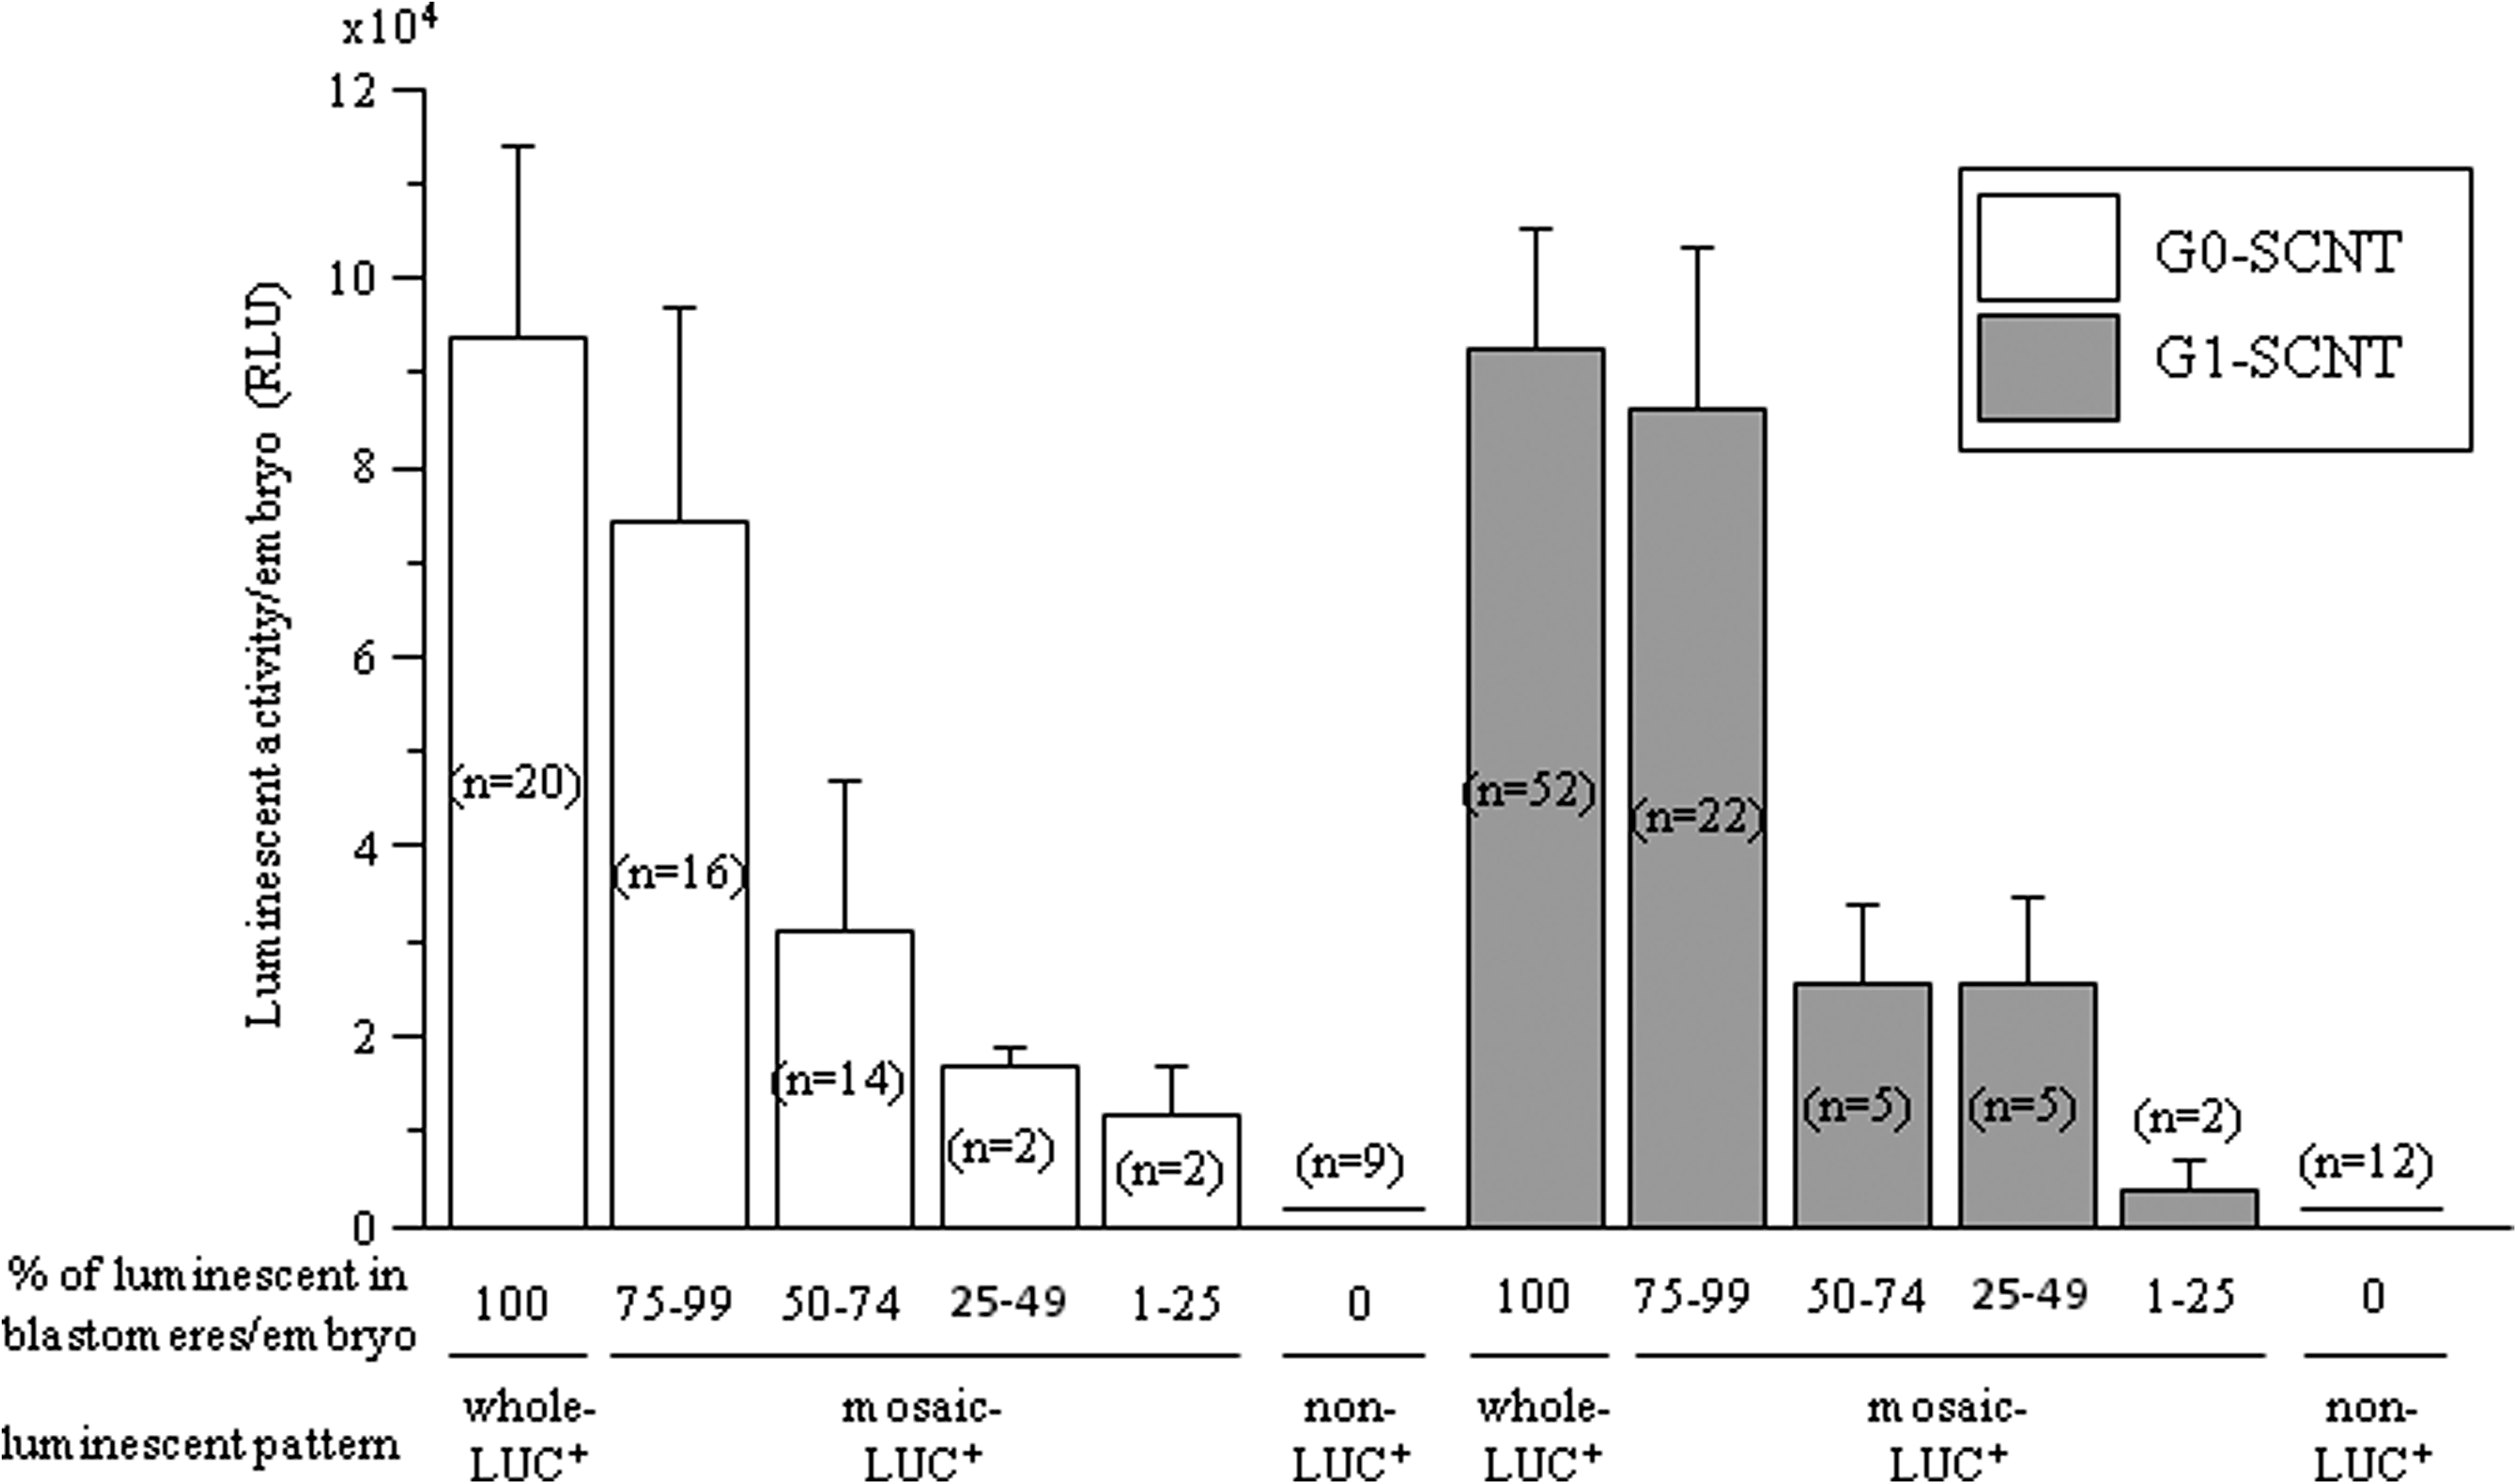
Luciferase activity of bovine SCNT embryos developed to four- to eight-cell stages at 60 hpf. The SCNT embryos from G0 (white bars) and G1 (gray bars) cells were categorized into five groups depending on the percentage of luminescent blastomeres (percentage of luminescence in embryo is 100%, 75–99%, 50–74%, 25–49% 1–25%, and 0%. Luciferase activity by measuring luminescence using obtained photon images. The number of SCNT embryos is indicated in parentheses in each bar.
Experiment 3: Relationship between luminescence and expression endogenous genes
We examined the expression level of endogenous β-act gene because expression of the LUC+ gene in SCNT embryos is controlled by the β-act promoter. The amount of ACTB mRNA in whole-LUC+ SCNT embryos from G0 cells was at the same level as that in IVF embryos (p>0.05), but the amount of ACTB mRNA in non-LUC+ SCNT embryos from G0 cells was lower than the amounts in whole-LUC+ SCNT and IVF embryos (Fig. 4; p<0.05). The amount of ACTB mRNA in SCNT embryos from G1 cells, whether with or without luminescence was lower than those in IVF embryos (Fig. 4; p<0.05). The amounts of H2AFZ and GJA1 mRNA in whole-LUC+ SCNT embryos was significantly higher than those in non-LUC+ SCNT embryos (Fig. 4; p<0.05). In contrast, the amount of BAX mRNA in whole-LUC+ SCNT embryos was lower than that in non-LUC+ SCNT embryos (Fig. 4; p>0.05). These results indicate that the presence or absence of luminescence is associated with the expression level of several endogenous genes related to embryonic development.
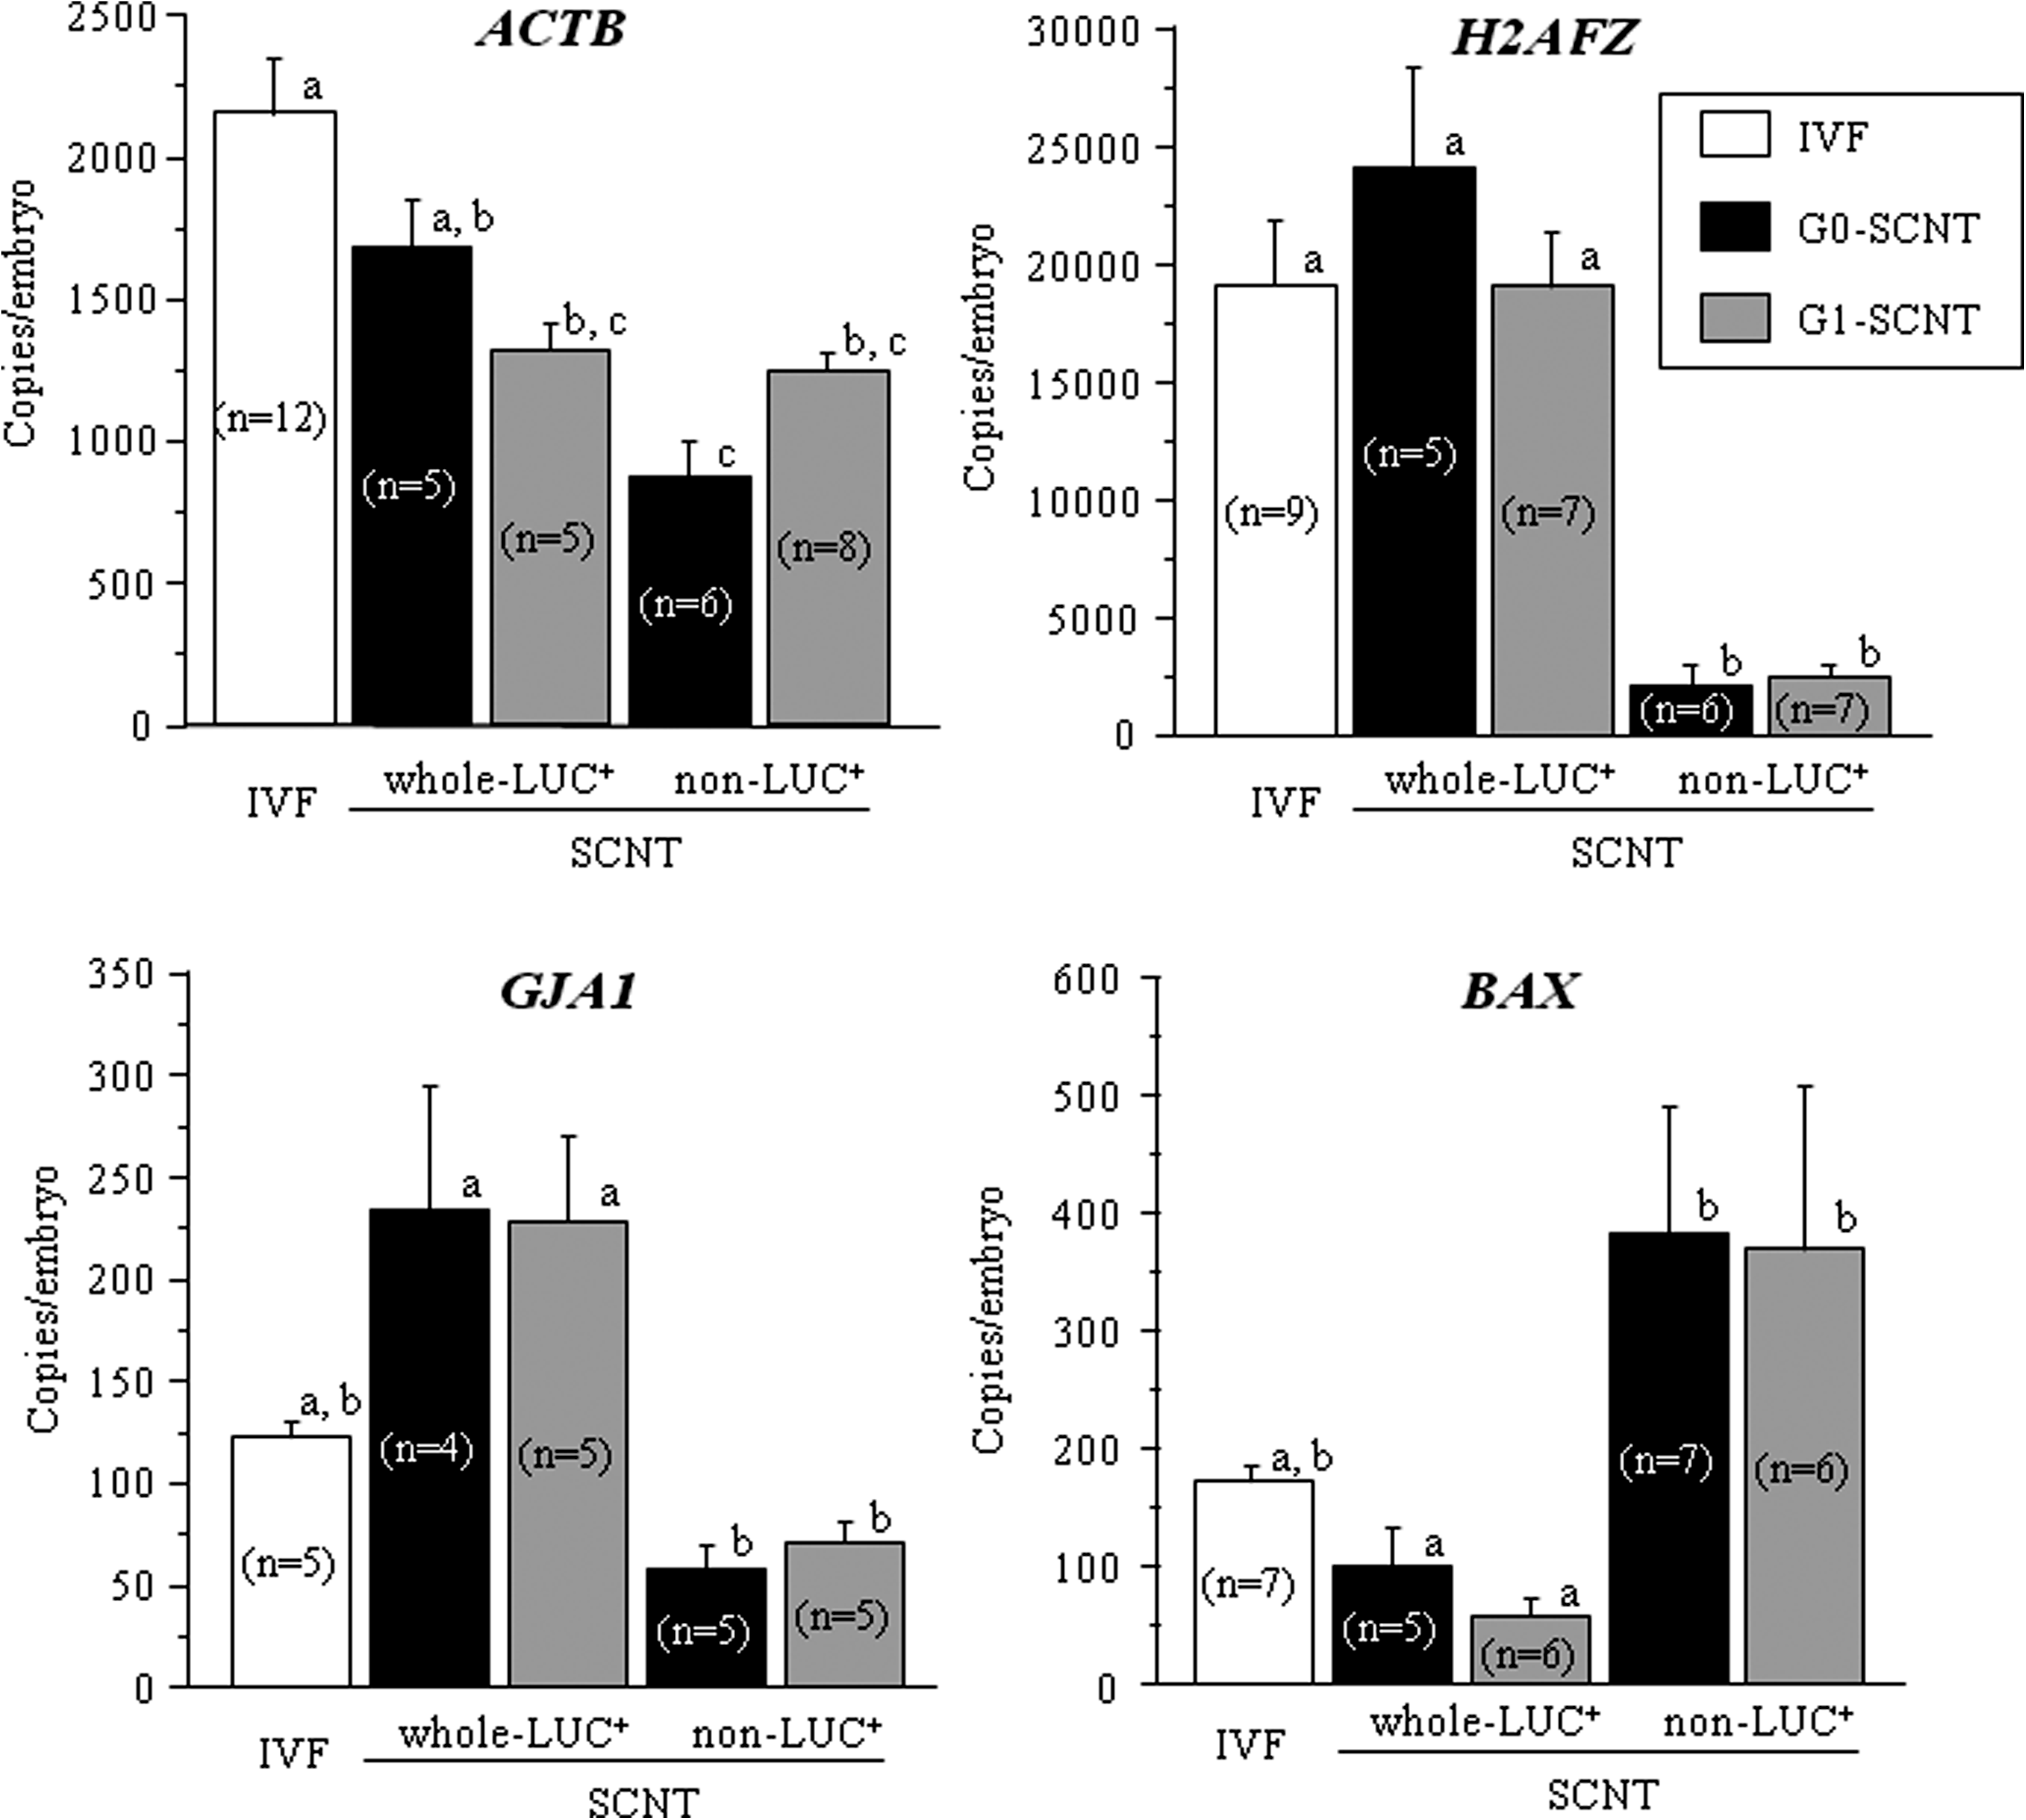
Expression of endogenous genes from IVF and whole-LUC+ and non-LUC+ SCNT embryos from G0 and G1 cells. Amount of ACTB (β-actin), H2AFZ (H2A histone family, member Z), GJA1 (gap junction protein, alpha 1, 43 kDa), and BAX (BCL2-associated X protein) transcripts in bovine IVF (white bars), whole-LUC+, and non-LUC+ SCNT embryos from G0 (black bars) and G1 cells (gray bars). a–c superscripts denote significant differences between IVF, whole-LUC+, and non-LUC+ SCNT embryos from G0 and G1 cells (p<0.05). The number of repetitive experiments is indicated in parentheses in each bar.
Experiment 4: Relationship between luminescence and DNA methylation
The DNA methylation status in SCNT embryos was examined by immunodetection of 5-MeC in whole-LUC+ and non-LUC+ SCNT embryos at 60 hpf (four- to eight-cell stages). Relative levels of DNA methylation in whole-LUC+ SCNT embryos were significantly lower than those in non-LUC+ SCNT embryos (p<0.05) and were the same as those in IVF embryos (Fig. 5B;} p>0.05). These results indicate that nuclei in whole-LUC+ SCNT embryos were demethylated at the same level as that in IVF embryos.
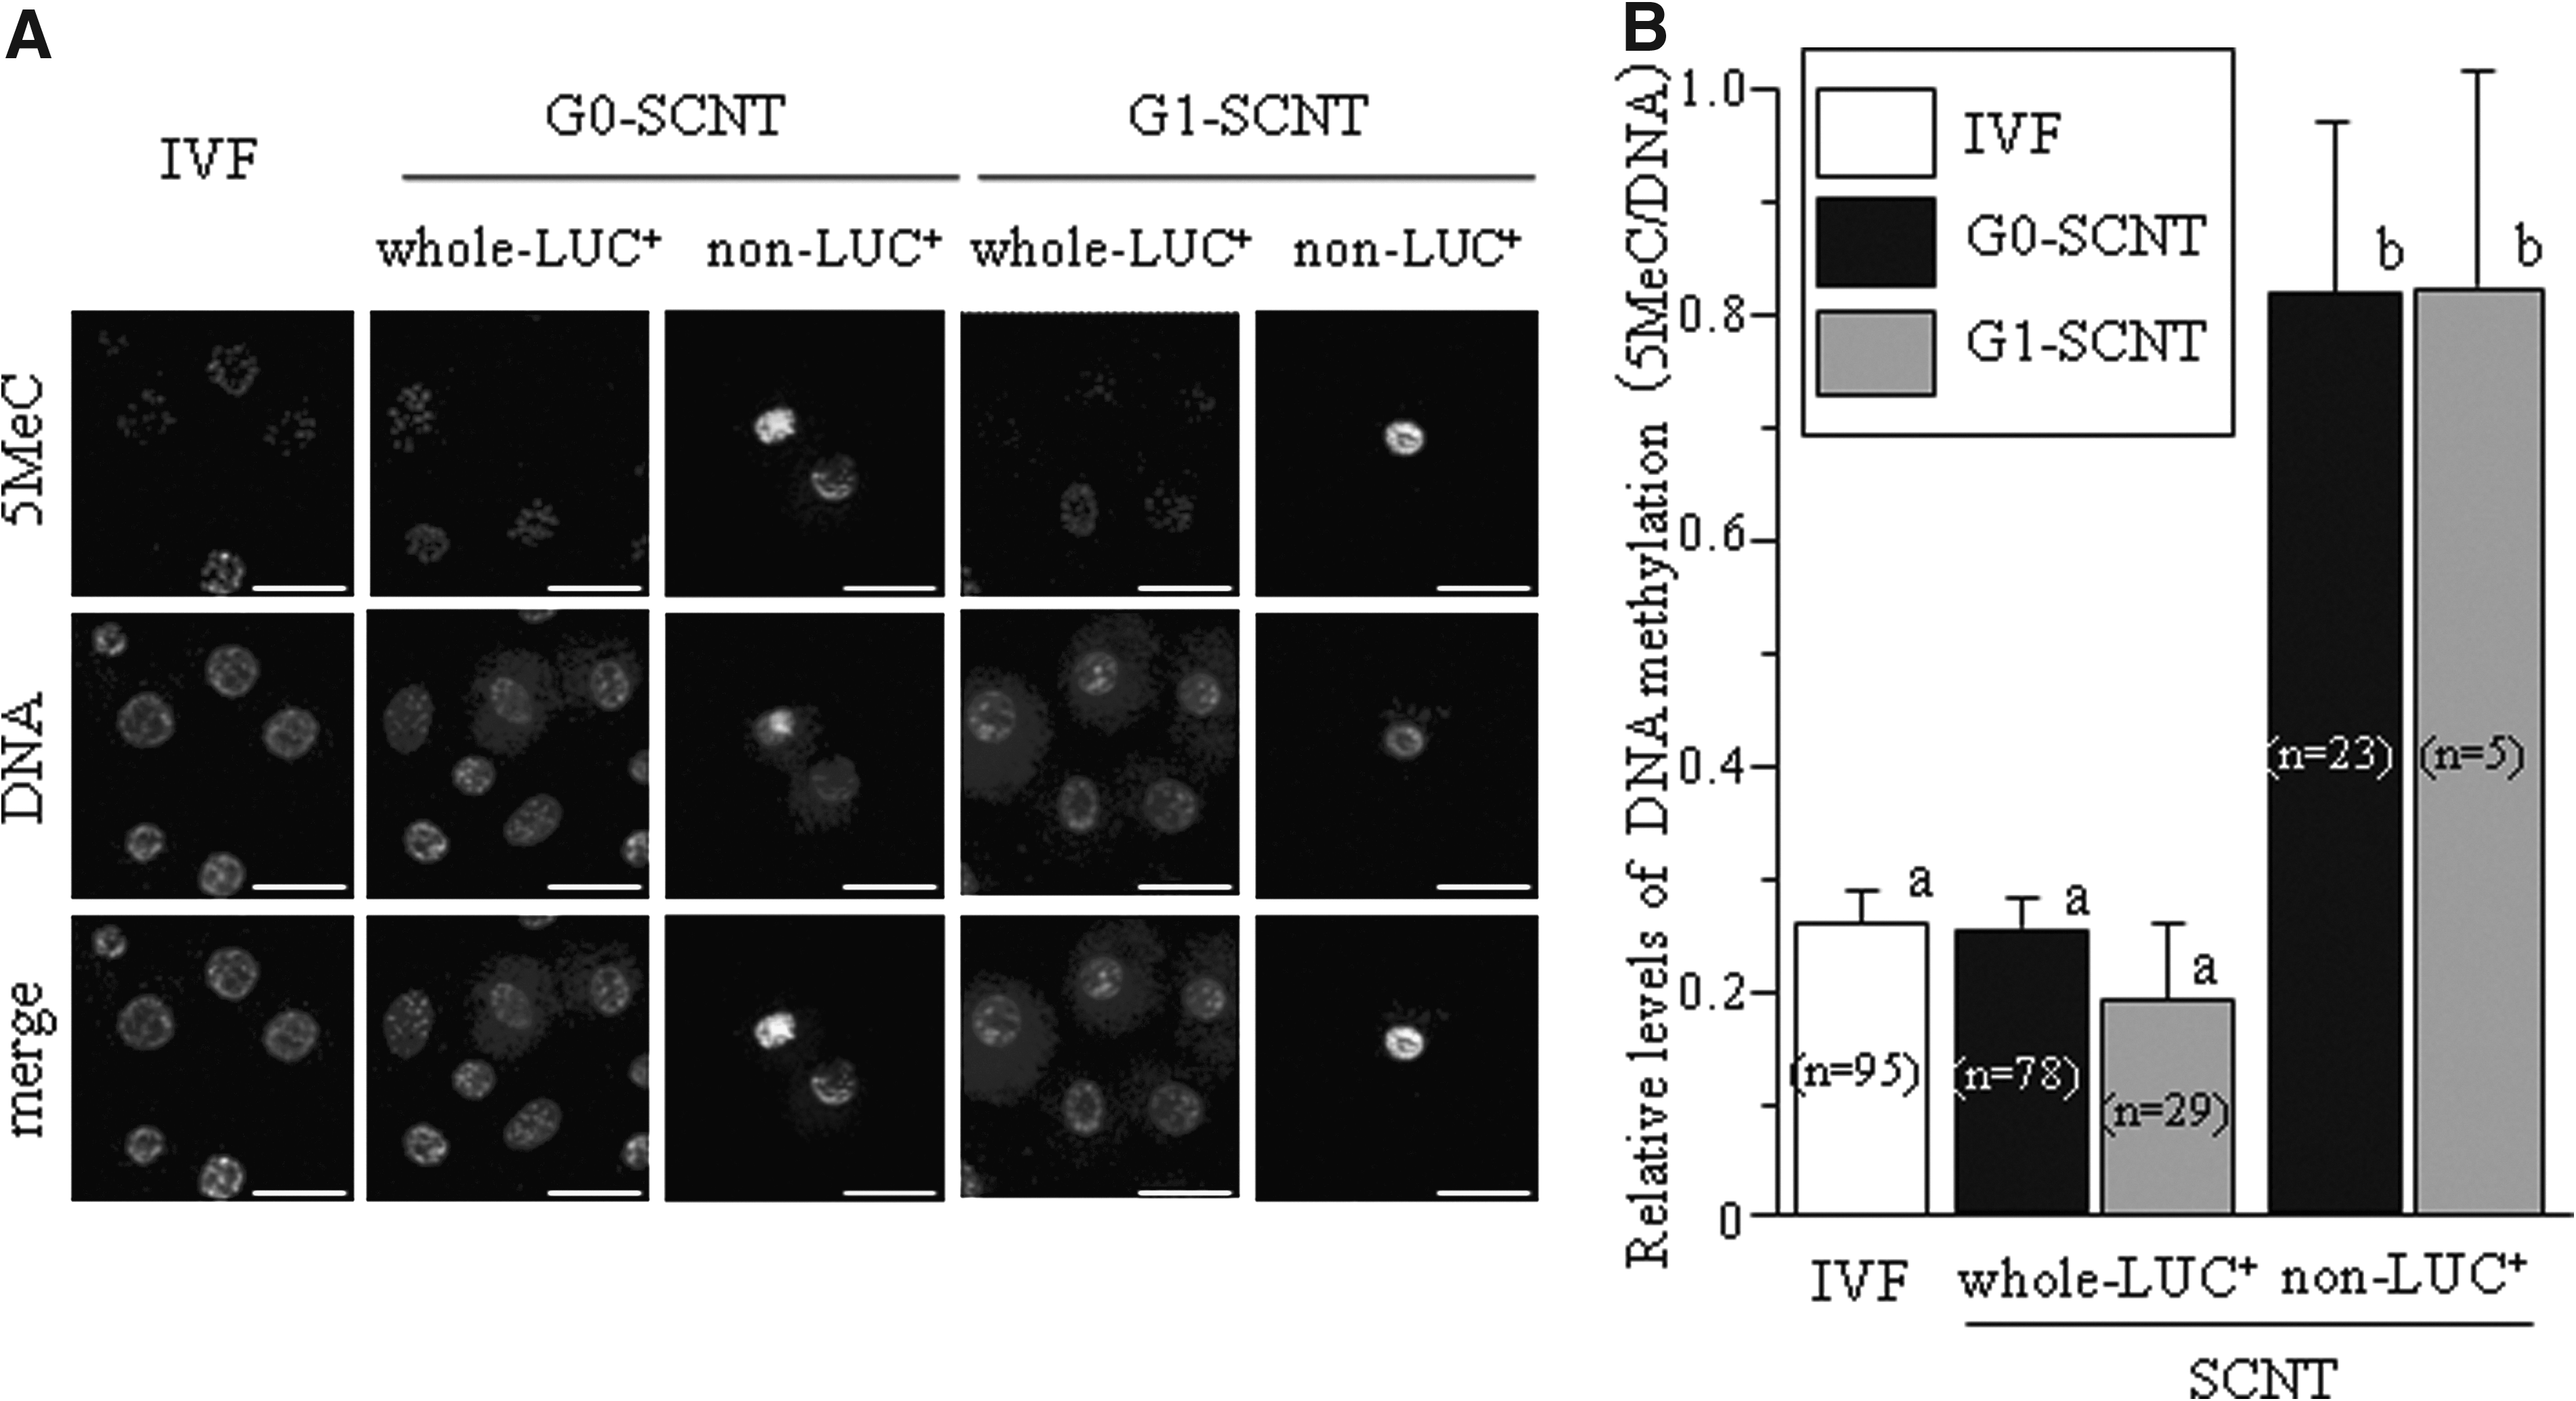
Methylation analysis in single nuclei from IVF and whole-LUC+ and non-LUC+ SCNT embryos from G0 and G1 cells. The blastomeres of these embryos at 60 hpf (four- to 8-cell stages) were stained with Aleza 488 conjugated secondary antibody for 5-methylcytosine (5 MeC; upper panels) and with propidium iodide for DNA (middle panels).
Discussion
In this study, we showed by luminescence analysis that homogeneous expression among all blastomeres at four- to eight-cell stage SCNT embryos crucial for their further development to the blastocyst stage.
In the first experiment, expression of the luciferase gene in G0- and G1-SCNT embryos began at 60 hpf (Fig. 1). Similarly, Lelievre et al. (2010) found increased luminescence in IVF and SCNT embryos carrying a luciferase gene under the control of the promoter of HSP 70.1, an EGA marker gene. Therefore, increased luciferase gene activity at 60 hpf may mimic EGA of bovine embryos.
To clarify why luciferase activity was higher in G1-SCNT embryos than in G0-SCNT embryos (Fig. 1), we examined the luminescence patterns among blastomeres within SCNT embryos. Half of the G1-SCNT embryos exhibited homogeneous luminescence among blastomeres, whereas more than half of the G0-SCNT embryos exhibited mosaic luminescence (Table 2). Several previous reports have shown that gene expression in each blastomere of single SCNT embryos is not uniform, even though the blastomeres in the SCNT embryo are derived from a single cell (Chung et al., 2003; Kasamatsu et al., 2007; Park et al., 2002). G0-SCNT embryos were found to progress into the first S phase later than G1-SCNT embryos (Miyamoto et al., 2007). The G0 cells are at a quiescent state, and take time to reenter the cell cycle (Kues et al., 2000; Zetterberg et al., 1995). Thus, the delay in the cell cycle may influence subsequent gene expression and blastocyst development. In this study, we did not examine the relationship between the cell cycle of donor cells and postimplantation development. However, in our previous study, morphologies of day 14 embryos (Ideta et al., 2007) and day 50 fetuses (Ideta et al., 2010) from G1-SCNT embryos were similar to IVF and AI embryos. Furthermore, we reported that the efficiency of full-term development of G1-SCNT embryos was higher than of G0-SCNT embryos (Urakawa et al., 2004).
In the present study, only whole-LUC+ and mosaic-LUC+ SCNT embryos that exhibited luminescence of three-quarters or more blastomeres within embryos developed into blastocysts (Table 2). Also, the luminescence activity in these SCNT embryos was more than twice that in mosaic-LUC+ SCNT embryos (Fig. 3). These results are in accordance with our previous observations (Kasamatsu et al., 2007). Our luminescence results show that homogeneous and strong activation of embryonic gene among the all blastomeres is crucial for development to blastocysts.
Our finding that the amounts of ACTB transcripts between whole- and non-LUC+ SCNT embryos were different in G0-SCNT embryos, whereas not different in G1-SCNT embryos (Fig. 4), and the finding that the amounts of ACTB transcript in early cleaving embryos that had low and high developmental competence were not different (Dode et al., 2006) suggest that expression of endogenous ACTB gene is not related to expression of the LUC+ gene. It is for this reason that not only de novo mRNA, but also the maternal mRNA might be detected. In this study, the amounts of H2AFZ and GJA1 transcripts in whole-LUC+ SCNT embryos were similar to those in IVF embryos and higher than those in non-LUC+ SCNT embryos (Fig. 4). On the other hand, BAX transcripts were less abundant in the whole-LUC+ SCNT embryos than those in non-LUC+ SCNT embryos (Fig. 4). Our results indicate that expression of development-related genes is related to expression of the LUC+ gene, even though morphology of non-LUC+ SCNT embryos at the four- to eight-cell stages was similar to that in whole-LUC+ SCNT embryos under stereo microscope.
DNA methylation dramatically changes during early embryonic development and higher levels of DNA methylation have been shown in cloned embryos than in normal embryos at the eight-cell stage (Bourc'his et al., 2001; Dean et al., 2001). Our finding that whole-LUC+ SCNT embryos with higher developmental capacity were hypomethylated, and non-LUC+ SCNT embryos with lower developmental capacity were hypermethylated (Fig. 5), taken together with our gene expression analysis (Fig. 4), suggest that hypermethylation in SCNT embryos leads to disruption of gene expression, resulting in failure to develop to the blastocyst stage.
In conclusion, we showed that the level of embryonic gene activation was higher and the expression pattern was more homogeneous in the blastomeres in G1-SCNT embryos than in G0-SCNT embryos. Furthermore, the expressions of several endogenous genes and the level of DNA methylation in SCNT embryos exhibiting homogeneous luminescence in all blastomeres resemble those in IVF embryos. Our results indicate that embryonic gene expression is stronger and more homogeneous expression in blastomeres of G1-SCNT embryos at EGA, which is crucial for the subsequent development to the blastocyst stage.
Footnotes
Acknowledgments
We are grateful to Mr. Tomohiro Tamari and Mr. Atsuhiro Tatemizo for their technical assistance and Ms. Naomi Backes Kamimura and Ms. Julia Walhelm-Kimura for English editing. This study was supported by a grant from the Wakayama Prefecture CREATE Project of the Japan Science and Technology Agency.
Author Disclosure Statement
The authors declare that no conflicting financial interests exist.