
Abstract
Abstract
In a mouse model nuclear transfer embryo-derived embryonic stem cell lines (ntESCs) of various genetic backgrounds and donor cell types were compared with reference ESCs and analyzed comprehensively at molecular level as a second part of a larger study. Expression profiles of ntESCs established by different NT-methods (piezoelectric microinjection or zona-free) were indistinguishable. However, expression profiling analyses identified differentially regulated genes between reference ESCs and ntESCs from different genetic backgrounds. A number of pluripotency and stemness marker genes significantly differed at the mRNA level between the cell lines. However, cluster and lineage analyses revealed that such differences had no effect on cell differentiation and cell fate. Regardless of the donor cell type, gene expression profiles of ntESCs were more similar to each other than to their counterpart fertilized embryo-derived ESCs of the same genotype. Overall, the results indicated that expression profile differences may be related to the genotype rather than to technical variations.
Introduction
Although, the production of cloned embryos then ntESCs or cloned offspring by the previously published experiments were successful (for detailed review, see Part I), most studies revealed that this procedure is highly variable according to both the epigenetic and genetic status of the original genomes (Inoue et al., 2007; Oback and Wells, 2007; Wakayama, 2007). The success rate for producing live offspring by cloning is highly affected by the mouse genotype, however, could be further enhanced by using histone deacetylase inhibitor, trichostatin A (TSA) treatment (Kishigami et al., 2006; Rybouchkin et al., 2006).
Previous studies have reported that murine ntESCs possess the same characteristics for self-renewal and differentiation as ESCs derived from natural (i.e., fertilized) blastocysts. In addition, molecular biology studies have detected almost identical transcriptional-, DNA methylation-, and DNA microarray profiles of mouse ntESCs compared to fertilized embryo-derived ESCs (Brambrink et al., 2006; Wakayama et al., 2006). Moreover, posttranscriptional profiles of ntESCs showed highly similar microRNAs (miRNAs) and protein expression profiles compared to fertilized embryo-derived counterparts (Ding et al., 2009).
Recently it was shown that rhesus monkey ntESCs were transcriptionally closer to the control fertilized embryo-derived ESCs than the rhesus-induced pluripotent stem cells (iPSCs), both by global transcriptional cluster analysis and stem cell-specific gene expression analysis (Byrne, 2011).
Although it is known that the used NT methodology (e.g., activation protocol, quiescent or nonquiescent donor cells and passage number of donor cells) has an effect on the mRNA expression pattern of NT embryos (Wrenzycki et al., 2001), little is known about whether this effect could be detected in ntESCs, as well.
In this part of the study, we focused on the comprehensive molecular evaluation of ntESCs derived from different donor cell types. We evaluated if any critical factors or differences could be detected between ESCs and their ntESC counterparts of the same nuclear donor origin by comparative expression profiling analysis. The effects of the nuclear donor cell source and the different genetic backgrounds were also investigated. Hierarchical cluster analysis (HLC) was used to compare the gene expression patterns across ESC lines. Furthermore, the functional classification of the regulated genes and their role in different biological pathways was also analyzed.
Materials and Methods
Materials for embryo culture and manipulation, unless specified otherwise, were purchased from Sigma-Aldrich Chemicals, Inc. (St. Louis, MO, USA; http://www.sigmaaldrich.com). All other materials, unless specified otherwise, were purchased from Invitrogen (Carlsbad, CA, USA; http://www.invitrogen.com).
Nuclear transfer and ESC establishment
Nuclear transfer and cell line establishment was performed as described in the first part of the study and as published previously (Kobolak et al., 2010). The attributes of cell lines used are summarized in the first part of the study (Table 1 of Part I).
cDNA microarrays
Glass cDNA-chips were produced as recently described (Horsch et al., 2008). A full description of the approximate 21,000 probes on the microarray is available in the GEO database (GPL3697). The expression data of the 13 different ESC comparisons of 7 ESC lines have been submitted to the GEO database (GSE8424).
Total cellular RNA of each ESC line was obtained according to the manufacturer's protocols using RNeasy Midi Kits (Qiagen, Düsseldorf, Germany; http://www.qiagen.com). The RNA concentration was calculated from OD260/280 readings and 1-μg RNA aliquots were run on formaldehyde agarose gels to check for RNA integrity. Four independent dual color hybridizations including two dye swap experiments were performed for each of the 13 RNA sample comparisons (in total, n=52). All experiments were done according to a modified TIGR protocol (Hegde et al., 2000; Horsch et al., 2008). Slides were scanned with a GenePix 4000A microarray scanner and the images analyzed with the GenePix Pro 6.1 image processing software (Molecular Devices, Sunnyvale, CA, USA; http://www.moleculardevices.com).
Statistical analysis of microarray data
Statistical analysis were performed using the TIGR Microarray Data Analysis System including MIDAS (Quackenbush, 2002) for normalization and SAM (Tusher et al., 2001) for identification of genes with significant differential regulation. Cluster analysis was employed using HCL (Eisen et al., 1998). Expression data were processed (MIDAS) applying a total intensity normalization as recently described (Horsch et al., 2008). First, a one-class analysis for the identification of significantly regulated genes was performed for each of the 13 sample comparisons. Second, for the detection of differentially expressed genes across the multiple cell line comparison a multiclass SAM analysis was performed. Therefore, 13 groups of experiments were specified: four chip hybridizations of each sample comparisons built a separate group. Genes were considered as significant if they were differentially regulated in at least two of the 13 specified groups. The percentage of genes identified by chance is the false discovery rate (FDR), which was estimated by the calculation of 1000 permutations. For HCL of those genes identified by the multiclass analysis, the average-linkage method was applied and as distance metric, the Euclidean Distance was chosen.
In silico pathway analysis
For in silico analysis of differentially expressed genes, EASE, a module of the DAVID database (Dennis et al., 2003) assigning genes to Gene Ontology (GO) functional categories, was employed. EASE analysis including a Bonferroni multiplicity correlation evaluated the set of differentially expressed genes for overrepresentation of biological processes.
Validation of the differentially expressed genes
To validate microarray identified differentially regulated genes from the various hybridization groups, two approaches were used. The TaqMan array where 14 differentially expressed genes from the microarray analysis were also subsets of the 96 genes of the Mouse Stem cells Pluripotency array panel (Applied Biosystems Inc, Foster City, CA, USA; www.appliedbiosystems.com), and a quantitative real-time PCR for an additional randomly selected nine individual genes from the differentially regulated genes list.
TaqMan assay
The TaqMan Mouse Stem cells pluripotency array panel consists of 96 genes in total, of which 40 genes related to stemness and pluripotency, 50 differentiation marker genes, and 6 controls (for gene list see Supplementary File 1; see online supplementary data at www.liebertonline.com/cell). Total RNA was isolated from the ESC lysates using RNeasy Midi kit (Qiagen) with an on-column DNase digestion step, following the manufacturer's procedure. The total RNA concentration and the quality of all samples were evaluated using a NanoDrop (Thermo Fisher Scientific Inc., Wilmington, DE, USA; http://www.nanodrop.com) and a Bioanalyzer (Agilent, Santa Clara, CA, USA; http://www.agilent.com). One microgram of total RNA from each of the ESCs were reverse transcribed simultaneously.
The TaqMan arrays used the Applied Biosystems microfluidics technology (Applied Biosystems), in which eight sample loading ports were used to simultaneously analyze gene expression levels by quantitative PCR. After loading the panel, the samples were run on an Applied Biosystems 7900 HT Fast Real-Time PCR system (Applied Biosystems), and the data were analyzed.
Quantitative real-time PCR (qPCR) analysis
In addition to the TaqMan array, nine randomly selected genes and two internal reference genes were quantified by real-time PCR. All the procedures of real-time PCR were as described in our earlier studies (Mamo et al., 2007, 2008), and the samples for the real-time PCR assay were prepared as described above for the TaqMan array.
During quantification of the transcripts, the assay for each gene consisted of samples from each ESC type, in five replicates, together with negative controls. All quantifications for the different genes were performed consecutively without interruption. Each sample in a run consisted of a 50-ng equivalent cDNA template, 200–500 nM of each primer (see details in Supplementary Table S2), and 50% SYBR® Green JumpStart™ Taq ReadyMix™ in 15-μL reaction volume. The reaction conditions were of template denaturation and polymerase activation at 95°C for 2 min, followed by 45 cycles of 95°C denaturation for 15 sec, 56°C to 60°C annealing, and extension for 45 sec. All reactions were carried out using the Rotor-Gene™ 3000 real-time PCR machine (Corbett Research, Mortlake, Australia; http://www.corbettlifescience.com), and the results were analyzed with the integrated Rotor-Gene software (version 6.1). At the end of the PCR reactions, melt curve analyses were performed for all the genes.
Comparison of published microarray data
The list of 171 genes, identified as significantly regulated across all ESC comparisons with SAM multiclass analysis (see the list of genes in the first datasheet of Supplementary File 2) was compared with the data of previously published microarray results. Our significantly regulated gene list was compared with the differentially expressed gene lists generated from mouse ntESC lines from the following publications: Wakayama et al., 2006, and Bambrink et al., 2006; mouse NT embryos: Fukuda et al., 2010, and Jincho et al, 2010; bovine NT embryos: Aston et al., 2009, Pfister-Genskow et al., 2005, Rodriguez-Osorio et al., 2009, Smith et al., 2005, and Somers et al., 2006; pig NT embryos: Tian et al., 2009; and rhesus monkey ntESCs: Byrne 2011. Data were compared based on the GeneBank codes and gene names to ensure the accurate comparison of different species and platforms. When not available, the array IDs were transformed into Gene Bank codes. Due to the high variations in the format of the differentially expressed gene data published, a manual comparison was performed between the known genes.
Results
Description of the cell lines analyzed
Details of NT, ntESC establishment, and primary characterization of the established cell lines were published recently (Kobolak et al., 2010) and furthermore are summarized in Part I of the study (Table 1 of Part I).
TaqMan® Array Mouse Stem Cell Pluripotency Panel
The TaqMan® Mouse Stem Cell Pluripotency Array, containing pluripotency, stemness (Ramalho-Santos et al., 2002) and early differentiation markers, was performed to analyze the competence of the cell lines using the HM1 cell line as reference (value 1.0). Gene expression differences were considered significant reaching a fold change of at least 2.5 (see details in Supplementary File 1).
First, we analyzed the mRNA expression patterns of genes that were studied previously at the protein level in our flow cytometry and immunocytochemistry (ICC) experiments (Pou5f1, Nanog, Fgf4, and Sox2), as reported in Part I of the study. Additionally, several other important marker genes, expressed mainly in undifferentiated cells (including Tdgf1, Dnmt3b, Gabrb3, Gdf3, Utf1, and Zfp42) were investigated. Our analysis identified significant differences (p<0.05) in the expression of Gabrb3 and Dnmt3b. High expression levels of Gabrb3 were observed in all B6D2 genotype cell lines compared to the HM1 ESC (Fig. 1 and Supplementary File 1). Similarly, the expression of Dnmt3b was significantly increased in the B6D2 and B6D2 CUM NT cell lines (2.93 and 3.23, respectively). Pou5f1, Nanog, Utf1, and Gdf3 were not significantly different (p<0.05) at the gene expression level compared to the HM1 control. The relative gene expression levels of Zfp42 were significantly lower (p<0.05) in B6D2 genotype ESCs, both in the control and the ntESCs, compared to the HM1 (Fig. 1 and Supplementary File 1). In all cell lines, Sox2 mRNA levels were relatively low (ranging between 0.92 and 0.24) compared to the HM1, reaching significance only for the B6D2 (0.24). The expression of Fgf4 was significantly downregulated (p<0.05) in the B6D2 cell line (0.2). When the HM1 and the HM1 NT ESCs were compared, no significant difference (p<0.05) was observed for this group of genes (Fig. 1 and Supplementary File 1).
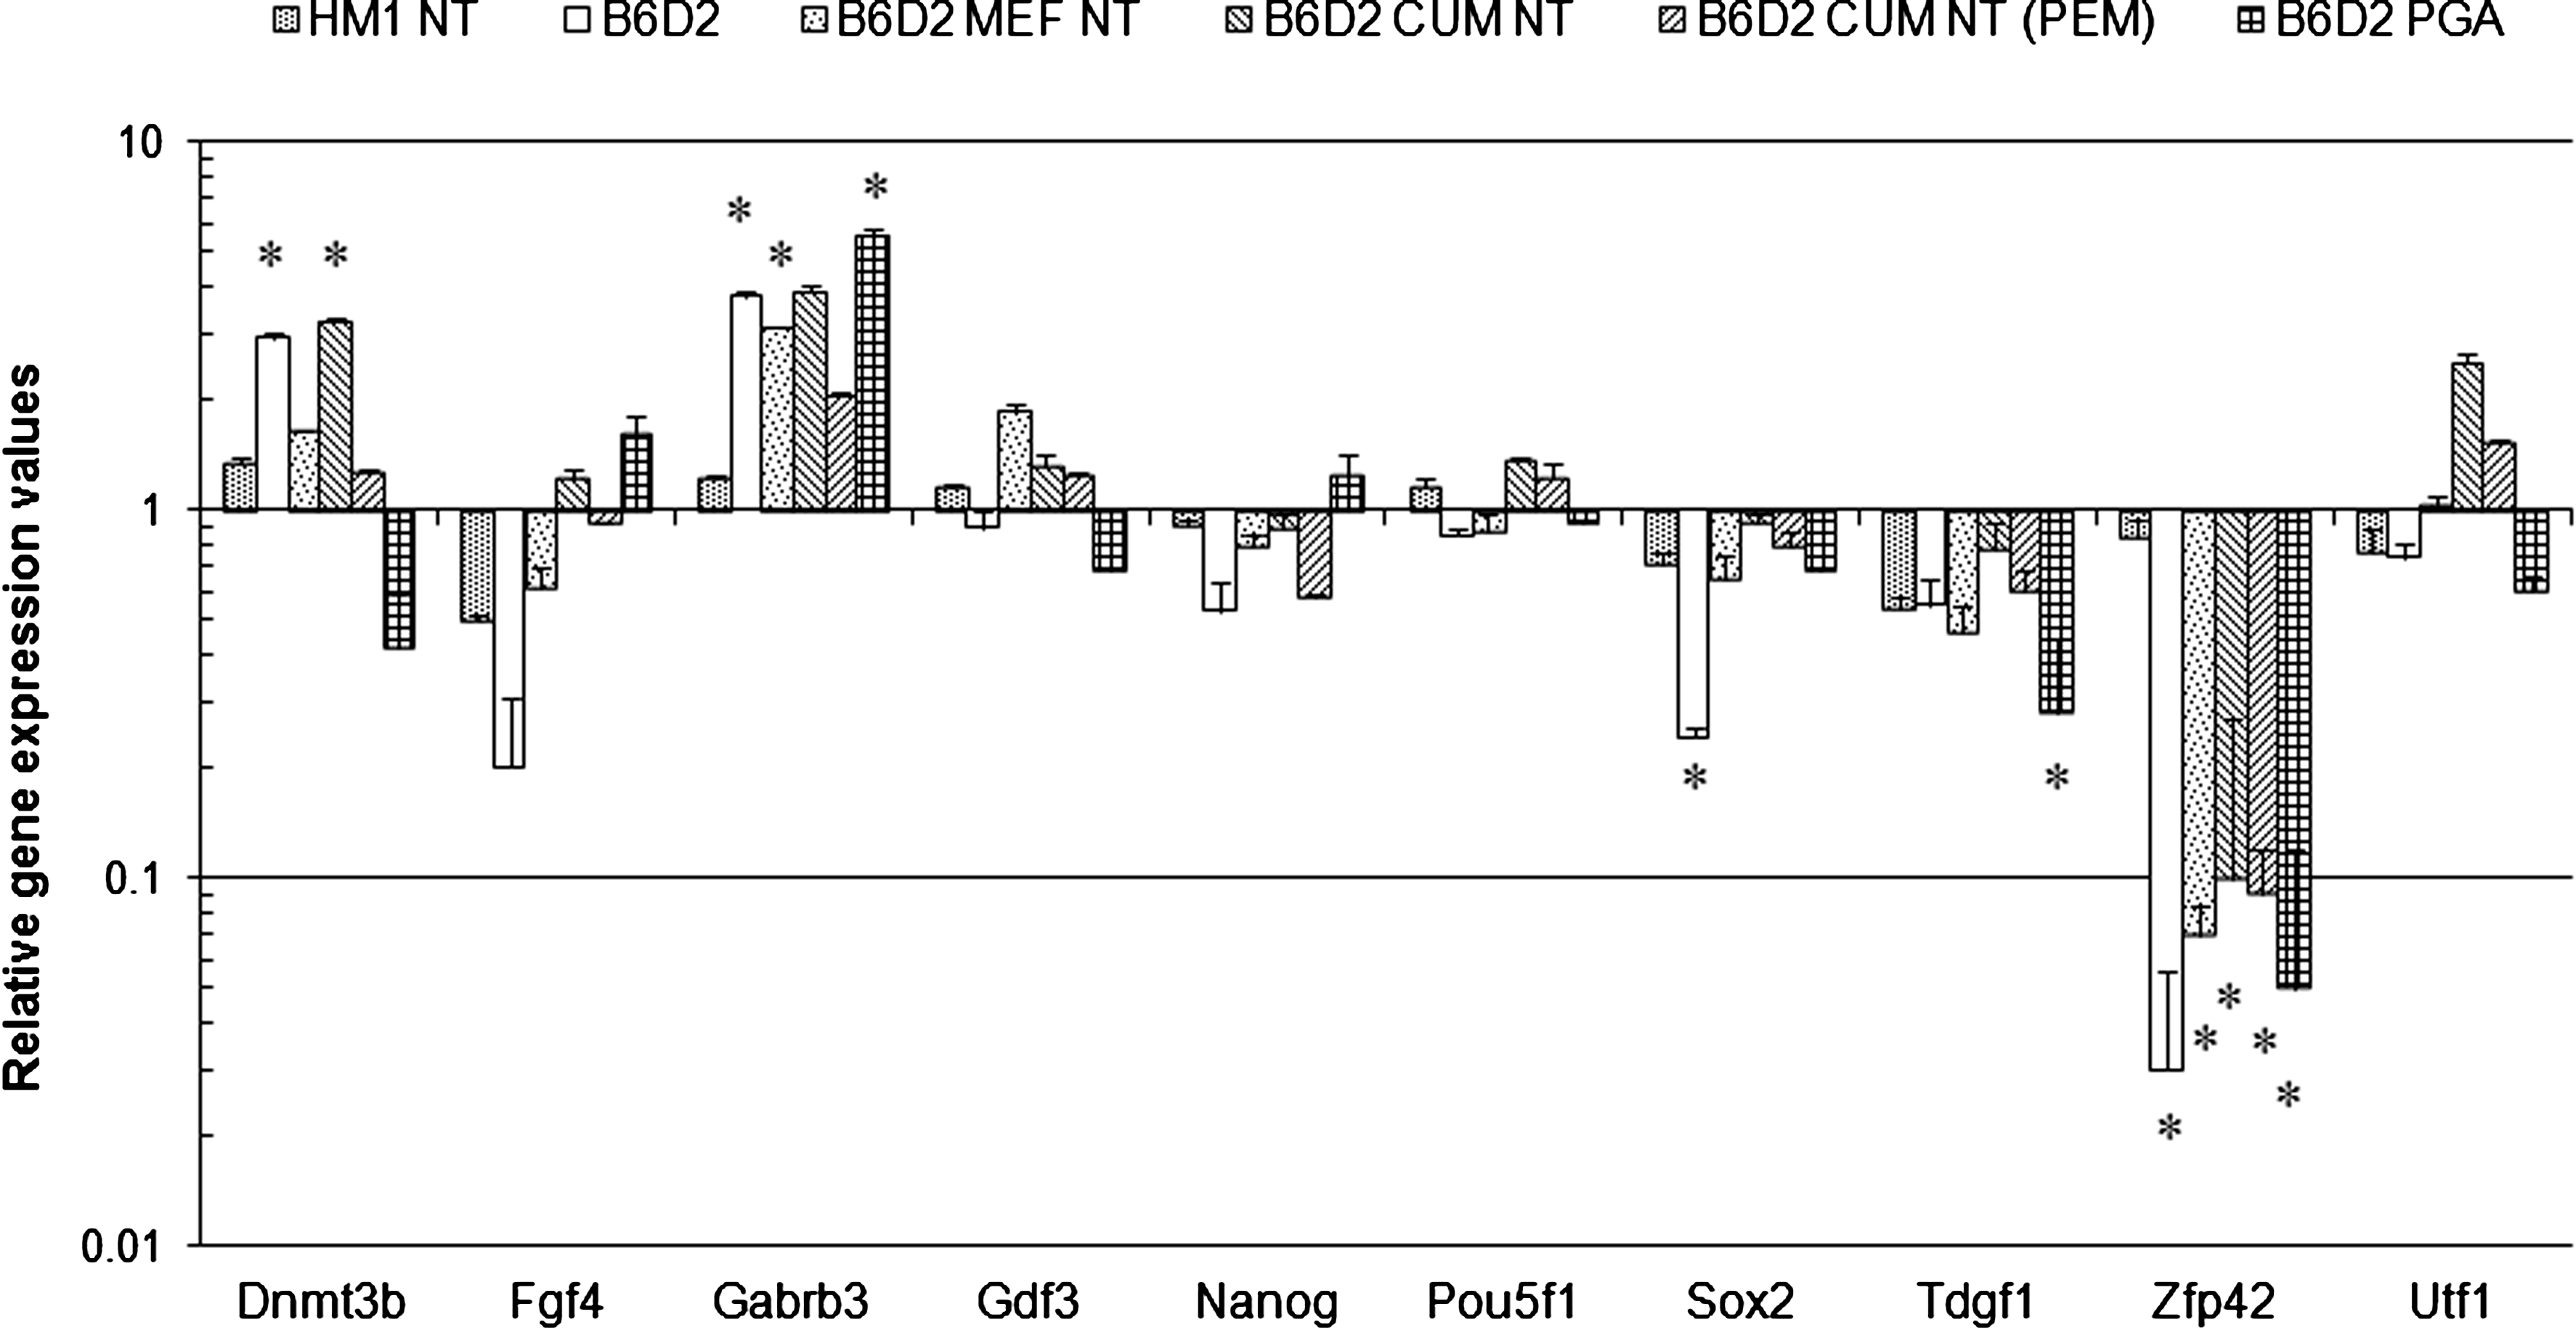
Relative gene expression levels of pluripotency mediating genes. Diagram represents the relative gene expression values of pluripotency genes. The gene expression levels of the HM1 as a standard was postulated to 1.0; thus, the relative expression values of further cell lines refer to the HM1. Gene expression differences were considered as significant at 2.5-fold change, labeled with an asterisk. +SD values are indicated on each column.
When pluripotency-related genes were analyzed, 86% of the signals varied more than threefold (both up- and downregulated genes), compared to the HM1 standard. The relative expression levels of Xist and Sema3a transcripts were significantly (p<0.05) increased in all cell lines, when compared to the levels of the HM1. Similarly, the relative expression levels of Gal, Fgf5, Gbx2, Commd3, and Crabp2 for some cell lines were also significantly (p<0.05) different, compared to HM1. Lefty1 and Lefty2 showed significantly lower expression in two samples, B6D2 PGA and B6D2 CUM NT (PEM), when compared to the expression level of the HM1.
When the differentiation-related markers were compared, 76% of the genes varied more than threefold compared to the HM1 expression. Significant differences (p<0.05) were observed in the relative expression of Col2a1, Col1a1, Cdx2, Flt1, Ins2, Nppa, Olig2, and Runx2. Similarly, the relative levels of Afp, Cd34, Eomes, Gcm1, Hbz, Iapp, Nes, T, and Wt1 were significantly different for some cell lines (see Supplementary File 1). In summary, the TaqMan array did reveal significant differences among the cell lines of the same genotype (e.g., B6D2 cell lines); however, significant differences were even more prominent between the different genotypes (129/SV and B6D2).
Gene expression analysis
A genome-wide expression profiling approach was applied to analyze the differences in gene expression levels between NT embryo- and control embryo-derived ESC lines. SAM one-class analysis detected significantly differentially expressed genes in 11 of the total 13 sample comparisons (Fig. 2, see also Supplementary File 2). Significance was assigned using an FDR <10% in conjunction with a fold change threshold of >1.5. Changes in the gene expression levels were identified among cloned and noncloned cell lines of both genetic backgrounds (Fig. 2: HM1 NT vs. HM1 and B6D2 MEF NT vs. B6D2). Additionally, the parthenogenetic embryo-derived (B6D2 PGA), as well as cumulus-derived ESCs [B6D2 CUM NT and B6D2 CUM NT (PEM)] showed large numbers of regulated genes, compared to the noncloned controls (Fig. 2 and Supplementary File 2). However, significant changes were not observed between the cumulus cells from the B6D2 strain cloned with the piezoelectric drilling [B6D2 CUM NT (PEM)] or the zona-free (B6D2 CUM NT) method.
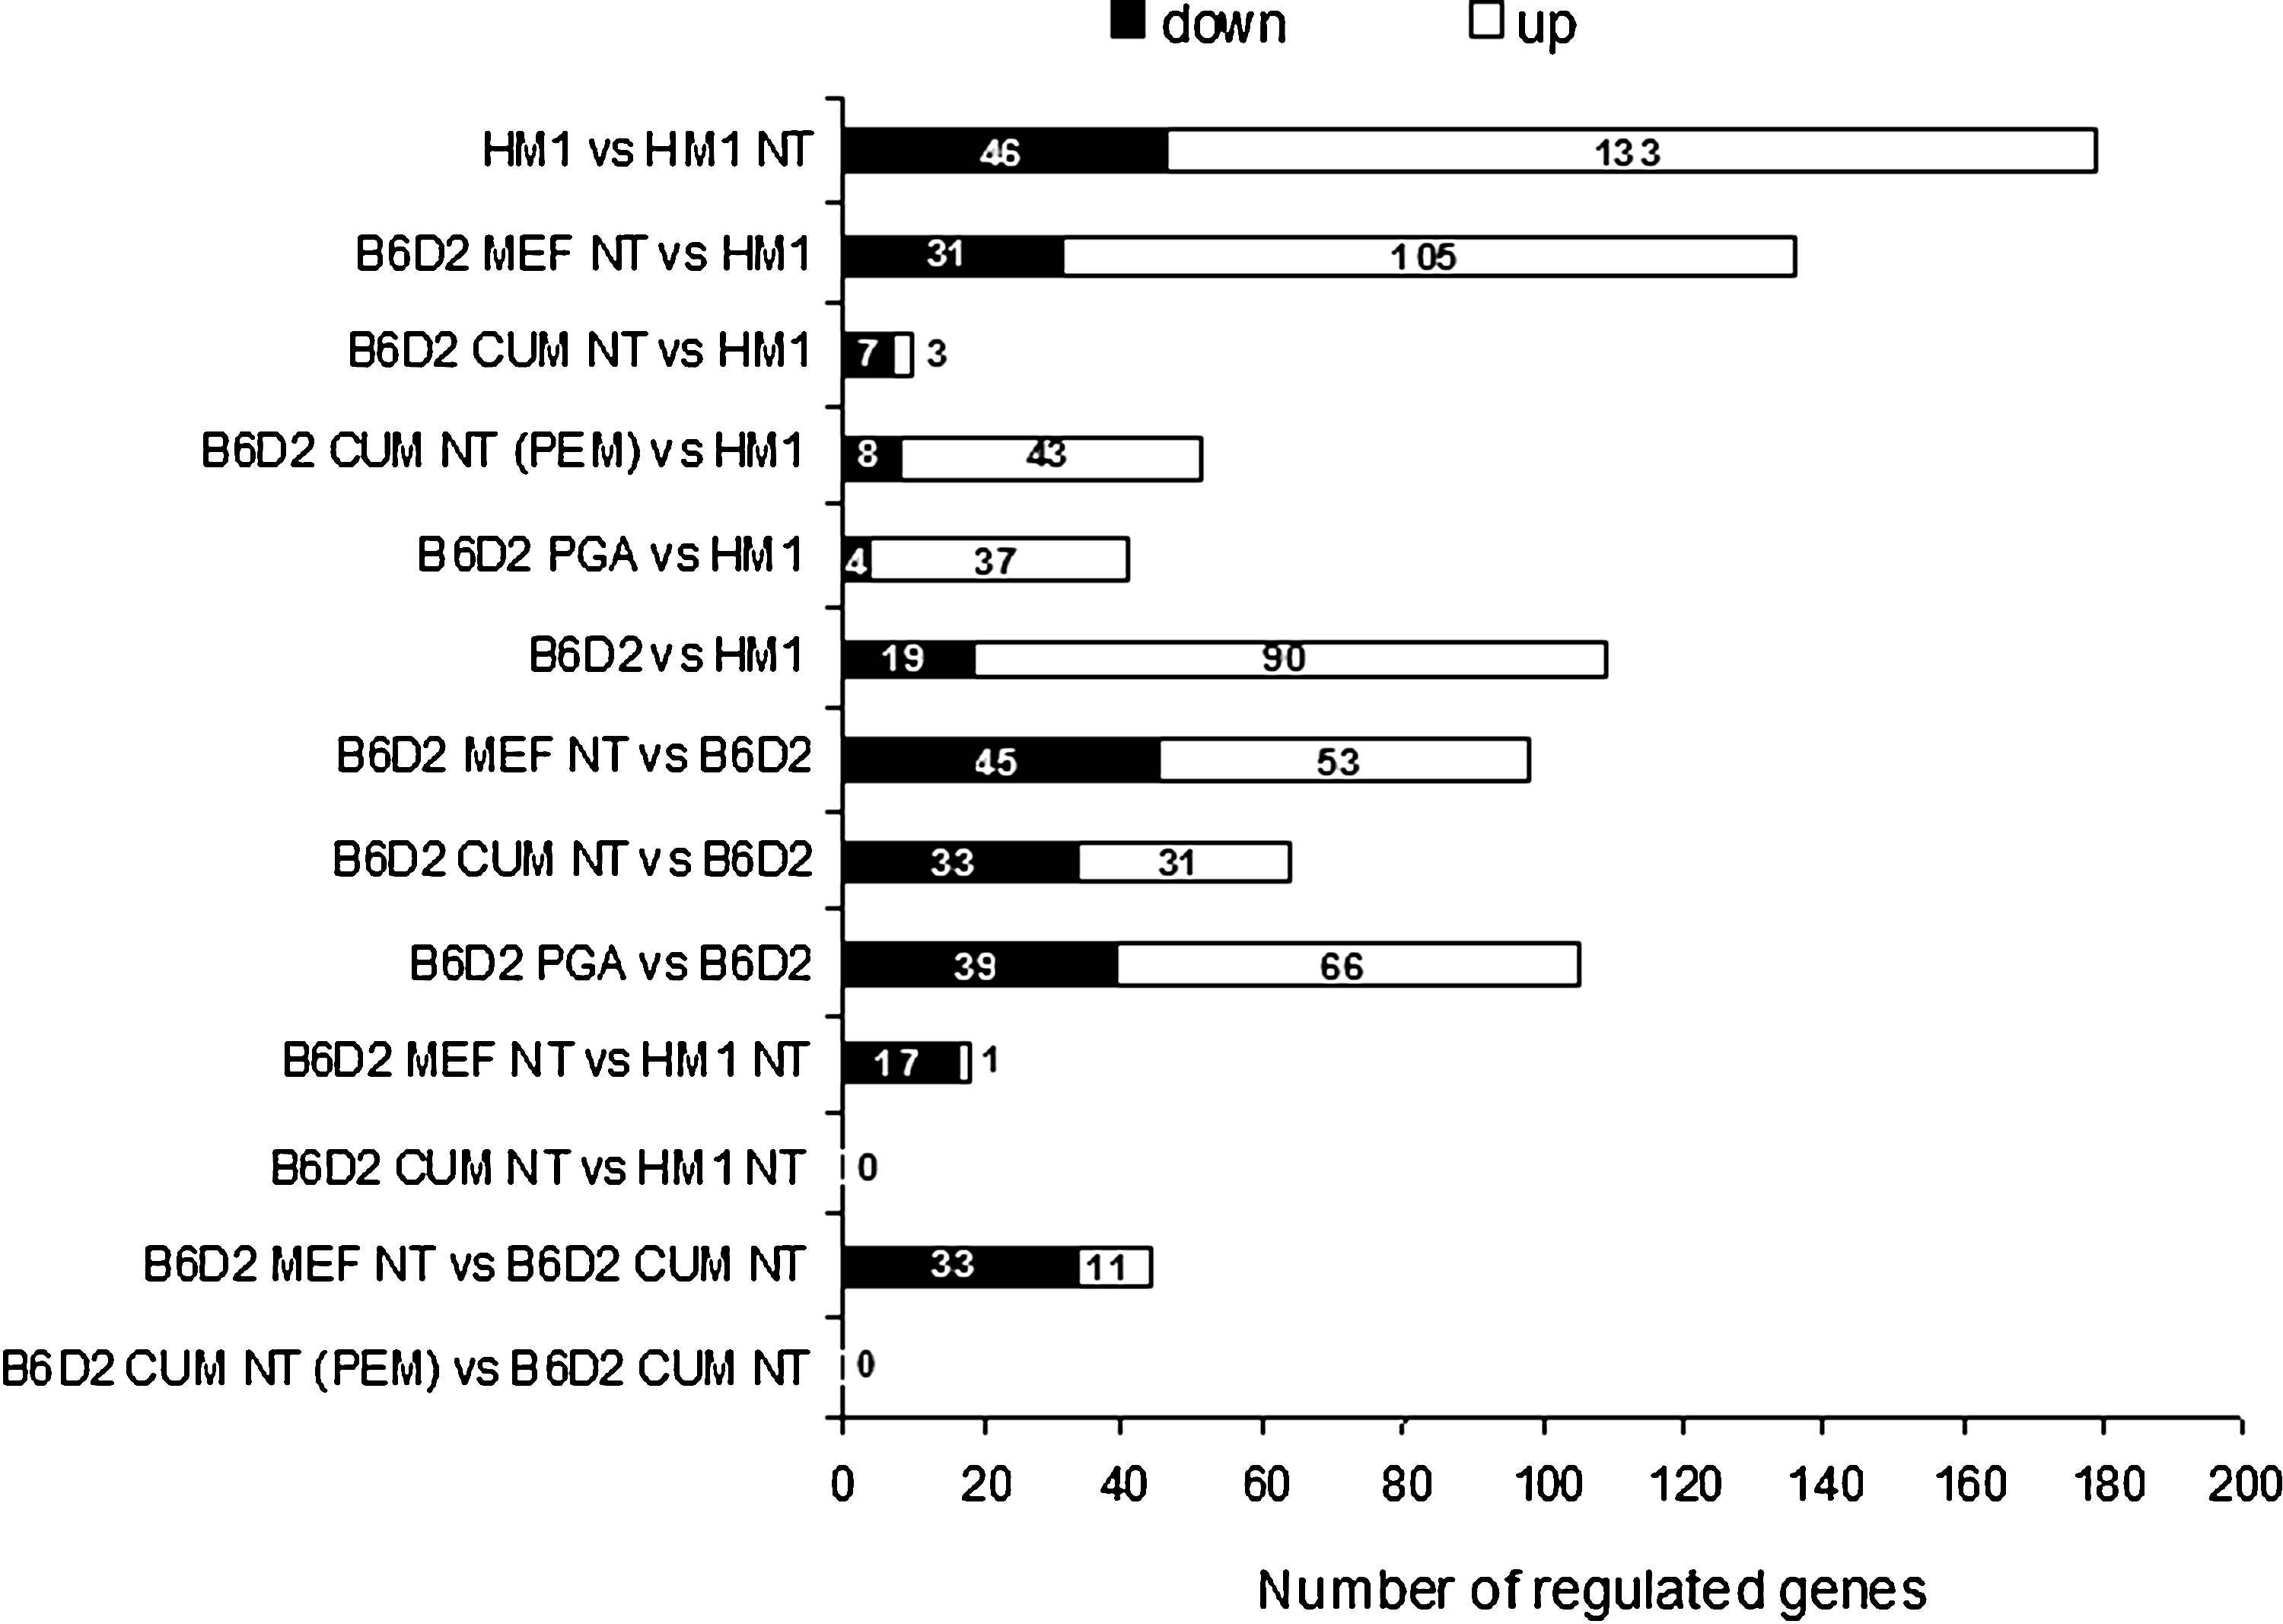
Number of regulated genes in distinct ESC line comparisons. Expression patterns of seven ESCs were analyzed in 13 sample comparisons. Numbers of significantly regulated genes between the different ESCs identified by a SAM one-class analyses. Significance was assigned using a FDR <10% in conjunction with a fold change threshold of >1.5.
As expected, the comparison of control embryo-derived ESCs of different genetic backgrounds (HM1 and B6D2) revealed a large number (109) of significantly regulated genes (p<0.05) (Fig. 2). Furthermore, prominent changes were found among gene expression patterns of the cloned B6D2 MEF NT and the control HM1 cells (136). However, these differences were reduced following NT of cells from both genetic backgrounds (B6D2 MEF NT vs. HM1 NT and B6D2 CUM NT versus HM1 NT) (Fig. 2). Genes that were differentially expressed in more than one cell line compared to the reference cell line HM1 are represented in Venn diagrams (Fig. 3).
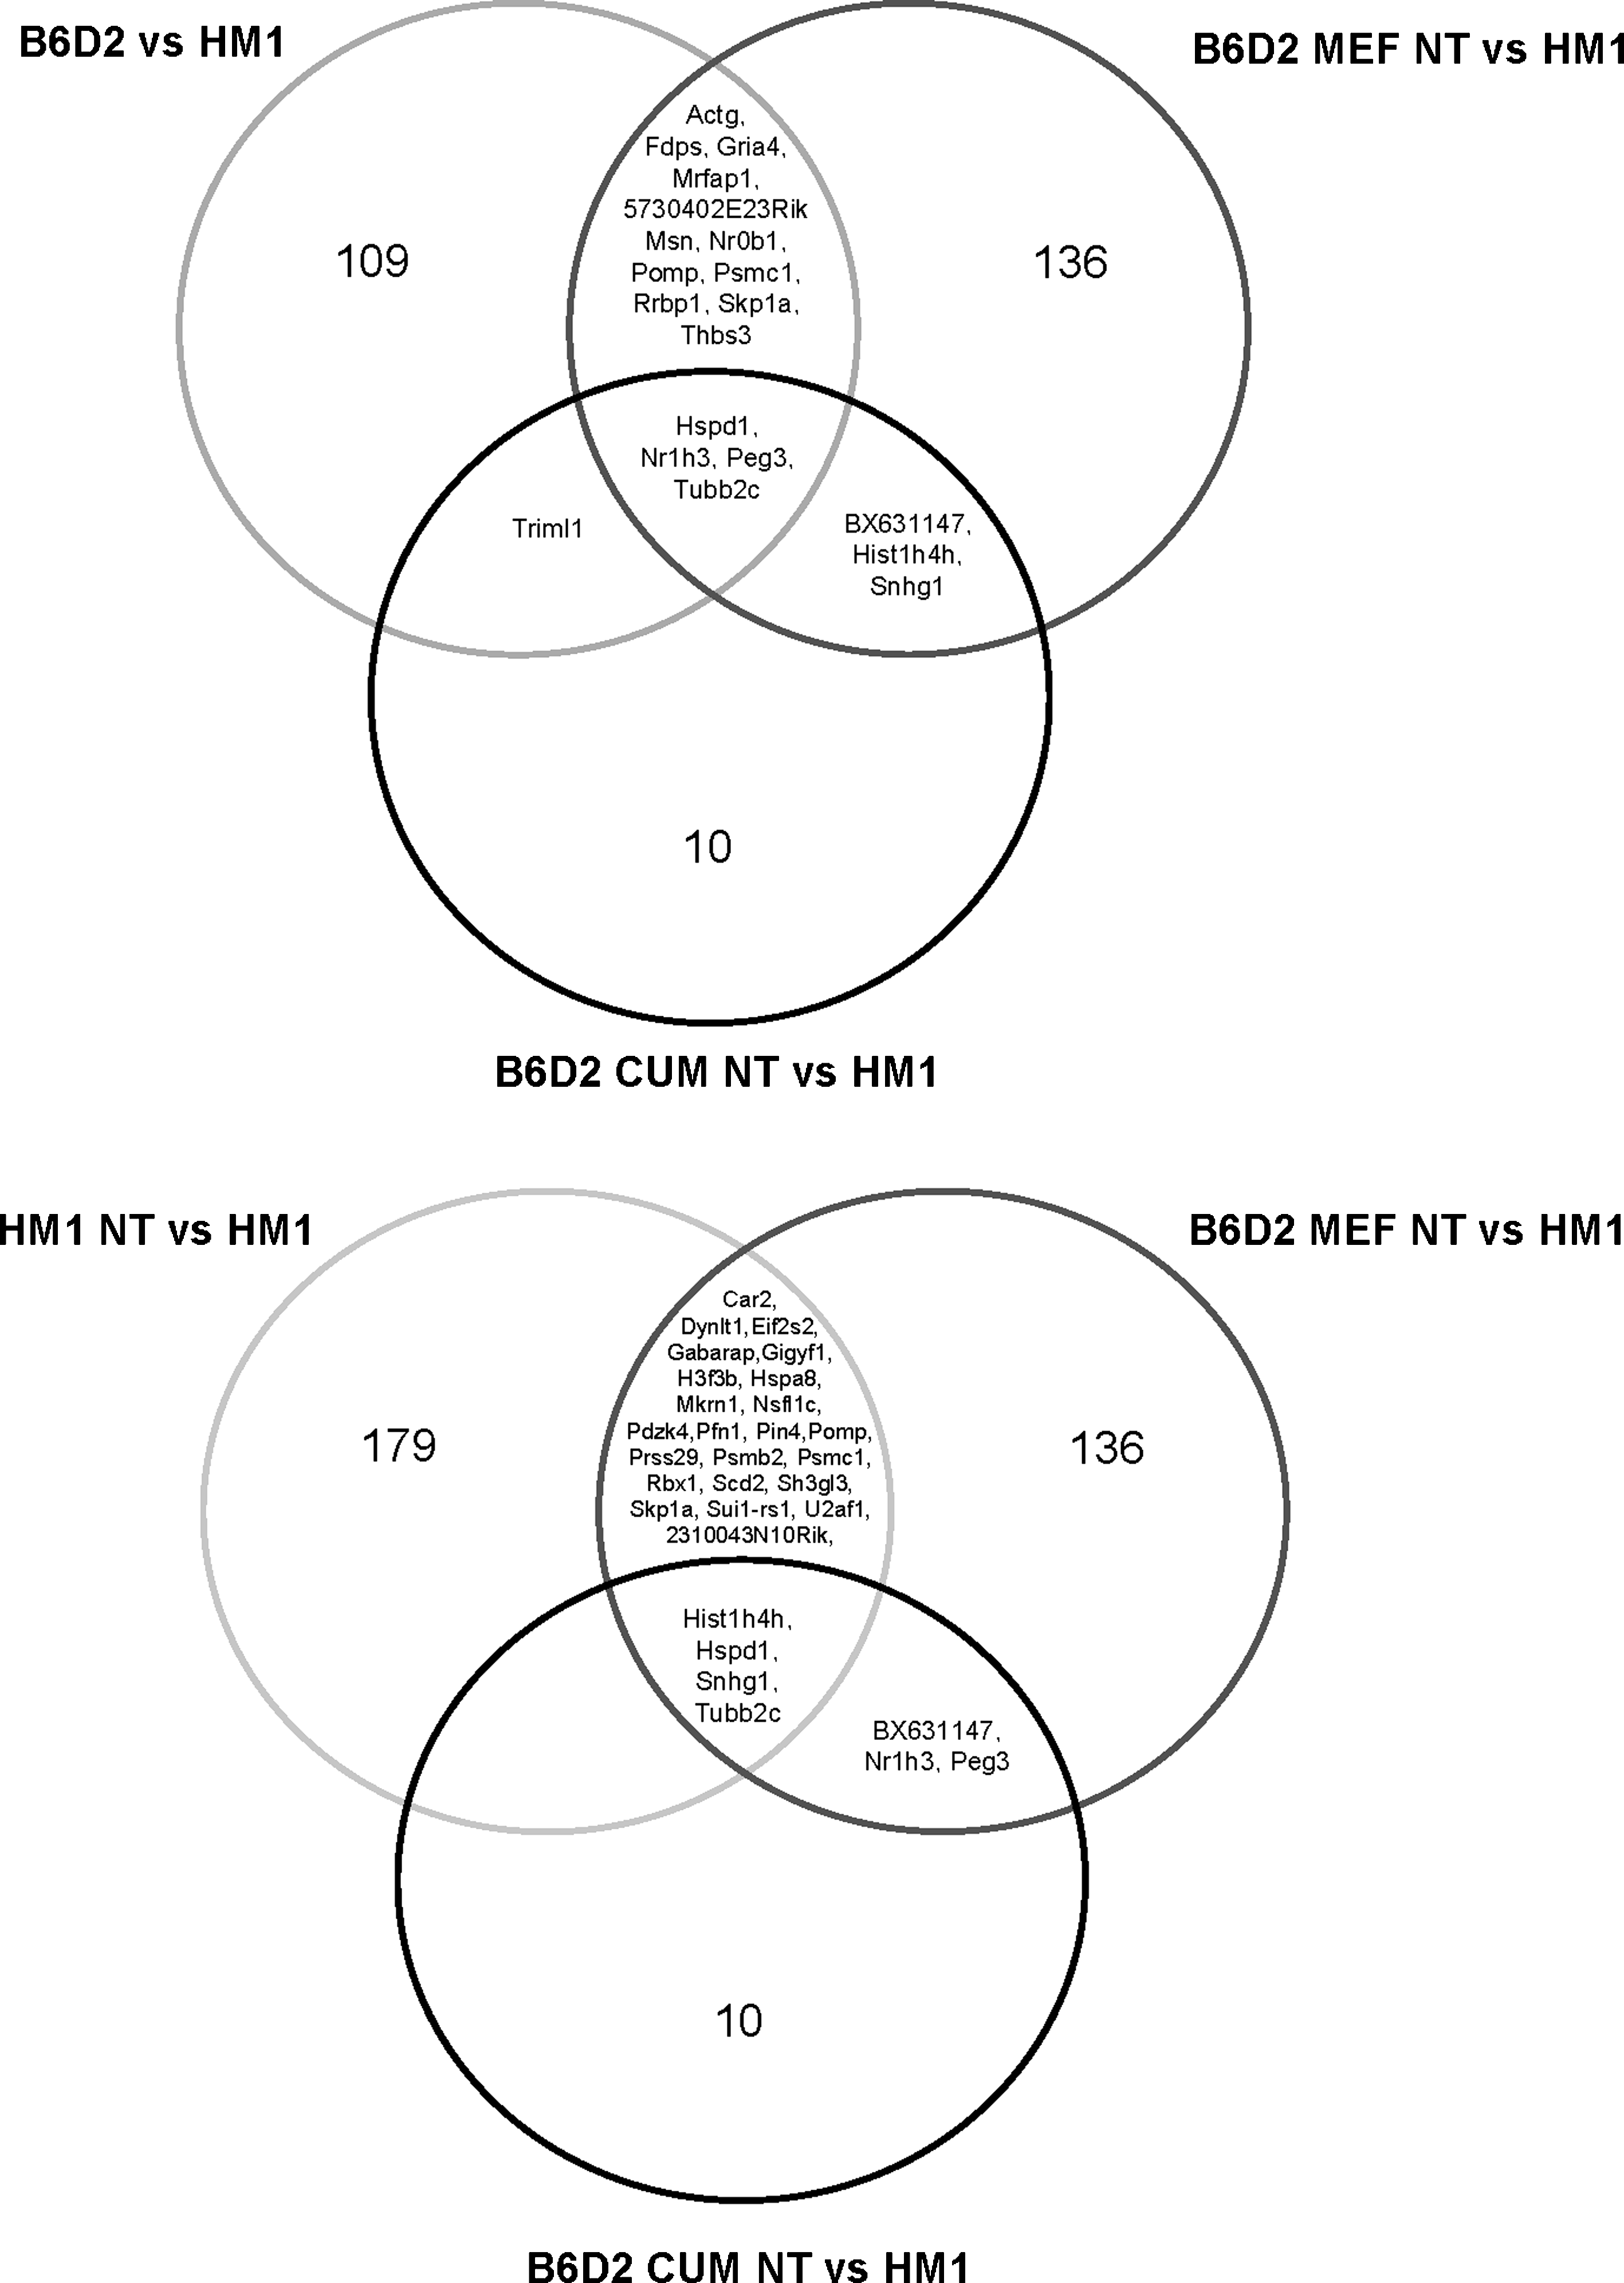
Venn diagrams of ESC line comparisons. Venn diagrams indicate the overlap of differentially expressed genes across the sample comparisons, where HM1 ESC was used as reference.
Hierarchical cluster analysis of gene expression profiles
To identify genes significantly regulated across all ESC comparisons, a SAM multiclass analysis was performed. Significance was again assigned using an FDR threshold <10% in conjunction with a fold change threshold >1.5. A set of 171 genes were identified as significantly differentially expressed in at least 2 out of 13 sample comparisons. We detected no single gene significantly regulated in all cell line comparisons. Nevertheless, based on similarities in gene expression patterns across the sample comparisons, the 171 regulated genes were classified using hierarchical cluster (HCL) analysis (see Supplementary File 3). Additionally, all sample comparisons were clustered for the identification of similarities between the cell lines (Fig. 4 and Supplementary File 3). As expected, sample comparisons with the same genetic background were more similar in their expression patterns (Fig. 4, indicated as “A”) than those comparisons of different genetic background (Fig. 4, indicated as “B” and “C”) in comparison to the noncloned ESCs. In group A and B the parthenogenetic embryo-derived ESC lines showed the largest difference compared to the other samples. The cluster analysis also revealed that the expression pattern of the control ESCs of both genetic backgrounds is closest to that of the HM1 NT versus HM1 comparison (Fig. 4, indicated as “C”). The samples in group D represents the comparisons with unaffected gene expression levels (Fig. 4, indicated as “D”). Furthermore, a principal component analysis (PCA) was performed using (1) the whole dataset including all 13 sample comparisons; (2) those experiments compared to HM1 as reference, and (3) those experiments compared to B6D2 as reference. The PCA analysis revealed the same four clusters as the HLC analysis did (data not shown). In conclusion, the cluster analysis revealed no similarities in the expression patterns between the cloned and noncloned cell line comparisons of the different genetic backgrounds.

Hierarchical clustering of ESC line comparison. The dendrogram reflects the process of clustering microarray samples according to the similarity of their gene expression profiles as measured by the Pearson correlation coefficient. Distances between array sample clusters are approximated. ESC line comparisons clustered by genetic background (octagons) and by the type of donor blastocysts (squares). NT, nuclear transfer; NC, noncloned; MEF, mouse embryonic fibroblast; CUM, cumulus; PEM, piezoelectric micromanipulation; PGA, parthenogenetic activation.
Validation of the results with quantitative real-time PCR (qPCR)
To verify the microarray results, nine selected genes (Tagln, Gas5, Ktn1, S100a6, S100a10, Sparc, Peg3, Femlb, and Dppa5) were validated using quantitative real-time PCR. The individual qPCR results can be found in Supplementary Table S1.
Additionally, several regulated genes (up- or downregulated in pairwise comparisons) identified by the microarray experiments (e.g., Actc1, Cd34, Cdh5, Cdx2, Col1a1, Crabp2, Flt1, Gabrb3, etc) were also differentially expressed in the TaqMan assay (Fig. 1, Supplementary File 1 and 2). Furthermore, five of them (Lefty2, Lin28, Nanog, Utf1, and Zfp42) were among the 171 differentially expressing genes across the ESC lines identified in the microarray, were also present on the TaqMan array and showed the same tendency of expression changes. In conclusion, the tendencies of gene regulation identified in the microarray experiments were confirmed by two independent techniques.
Despite the similarities of results in the tendencies of expression (trend and patterns) among the different transcript analysis techniques, a closer observation to the fold change values of some genes revealed slight ratio variations between the methods. The existence of inherent variations in the sensitivity of these techniques affecting their dynamic range is considered to cause such ratio variations, as reported by our earlier study (Mamo et al., 2006) and several other studies (Bae et al., 2003; Carter et al., 2003; Liu et al., 2004; Palmqvist et al., 2005).
Functional classification of differentially regulated genes
In order to analyze whether specific functional annotations were overrepresented among the 171 regulated genes across the distinct sample comparisons, Expression Analysis Systematic Explorer (EASE) was used and the genes were classify based on the molecular functions and biological processes.
Generally, 15 biological processes, including cell growth and communication, development, neurogenesis, DNA methylation as well as metabolism of proteins, alcohol, lipids, steroids, or nucleotides were overrepresented (Table 1). Several of the genes annotated with the same Gene Onthology (GO) term either shared similar expression patterns across the sample comparisons (e.g., Anxa1, App, Col1a2, Cd5, and Igfbp3 associated with cell communication), or had distinct expression patterns (e.g., Dnmt3a, Dnmt3l, and Fos annotated with DNA methylation; see Supplementary File 3).
In molecular functions nucleic acid binding, cytoskeletal proteins, and transcription factors were overrepresented most among the sample comparisons; however, about one-third of the differentially regulated genes were classified as “miscellaneous” or “unclassified” (see Supplementary File 3). Little overlap was found at the functional level: concerning the 129/Ola genetic background, the cellular processes of differentially regulated genes includes apoptosis, neurogenesis, and immune response, whereas the differentially regulated genes of the B6D2 background consists of different signalling pathways (e.g., integrin and dopamine). In summary, a wide range of biological processes was affected by gene regulation changes in ntESCs, whereas no specific functional group could be correlated with the nuclear transfer.
Imprinted genes were selected and their expression patterns represented in a heat map (see Supplementary Fig. S1) in order to determine if gene expression changes might be attributed to the process of NT. Three of the imprinted genes, namely, Dcn (Decorin), Nnat (Neuronatin), and Peg3 (Paternally expressed 3) were detected among the regulated group of genes. These three genes were upregulated in several B6D2 genotype cell lines (both in NT and control ESCs) compared to HM1 (see Supplementary Fig. S1). In total, the expression patterns of the imprinted genes that were present on the array are heterogeneous and revealed no common gene regulation between the sample comparisons.
Those genes analyzed in the in vitro differentiation studies by RT-PCR were also present on the microarray but without differential regulation in the undifferentiated states of all cell lines (see Supplementary Fig. S2).
Comparison with previously published microarray data sets
We compared the group of differentially regulated genes (171 genes) of our study to available data sets from previous studies in mouse ntESC lines (Brambrink et al., 2006; Wakayama et al., 2006), mouse NT embryos (Aston et al., 2009; Fukuda et al., 2010; Jincho et al., 2008), bovine NT embryos (Pfister-Genskow et al., 2005; Rodriguez-Osorio et al., 2009; Smith et al., 2005; Somers et al., 2006), pig NT embryos (Tian et al., 2009), and recently on rhesus monkey ntESC (Byrne, 2011). A comparison of the published data sets of mouse ntESCs (Brambrink et al., 2006; Wakayama et al., 2006), revealed only an overlap of three genes Krt8 (keratin 8), Myl6 (Myosin light polypeptide, 6), and Zfp42 (formerly Rex1, Zinc-finger protein 42) with our data. Another four genes (App, Dnmt3a, Eif2s2, and Ube2a) were identified when comparing our data set with a list of previously published genes observed to be differentially expressed in mouse NT embryos (Fukuda et al., 2010; Jincho et al., 2008).
Interspecies comparison of our data with the recently published data set of rhesus monkey ntESCs (Byrne, 2011) identified three overlapping genes Crabp1, Lin28, and Nanog, as differentially expressing in both species. Interestingly, in this group Dnmt3b but not Dnmt3a was also differentially expressed in rhesus ntESCs (Byrne, 2011).
Further interspecies comparisons of bovine (Aston et al., 2009; Pfister-Genskow et al., 2005; Rodriguez-Osorio et al., 2009; Smith et al., 2005; Somers et al., 2006) and pig (Tian et al., 2009) NT embryos identified a common set of genes regulated differentially, included: genes associated with binding proteins, extracellular matrix proteins ABC-transporters, translation initiators, Slc-transporters, ribosomal proteins, pro-collagens, some heat-shock protein genes, and cytokeratins. At the transcript level, an overlap of 21 genes in at least two studies was found (Actb, Anxa1, App, Cald1, Cd81, Cdc42, Dnmt3a, Dnmt3L, Eif2s2, Igf2r, Krt2-8, Mapre1, Myl6, Nid2, Prps1, Ptgs2, Set, Tmsb4x, Tsr2, Ube2a, Vim, and Zfp42) (Aston et al., 2009; Pfister-Genskow et al., 2005; Rodriguez-Osorio et al., 2009; Smith et al., 2005; Somers et al., 2006; Tian et al., 2009). In comparison with our ntESC dataset, 13 genes of the previous list overlap (Anxa1, App, Cald1, Dnmt3a, Dnmt3L, Eif2s2, Krt2-8, Myl6, Tmsb4x, Tsr2, Ube2a, Vim, and Zfp42). Overall, there was a small overlap between the differentially regulated genes from our data and genes identified as differentially regulated either in mouse ntESC or mouse NT embryos in other data sets, despite the variations among the experimental designs. There was greater similarity between the lists of regulated genes of NT embryos within or among species and the numbers of affected genes were higher.
Discussion
Recently, we have successfully established ntESCs derived from different nuclear donor cell types using either zona-free (ZF) or piezoelectric microinjection (PEM) technology (Kobolak et al., 2010). In this study we demonstrated that the efficiency of ntESC derivation was not related to the NT method used. Furthermore, the zona-free NT technique resulted in cell lines with the same potential as ntESCs produced from PEM.
Although several studies reported the efficient establishment and characterization of ntESCs in different species only two studies (Brambrink et al., 2006; Wakayama et al., 2006) focused on the representative and thorough comparison of ntESCs and fertilized embryo-derived counterpart ESCs. Therefore, a very limited data is available about (1) the relevance of the used NT technique, (2) the used nuclear donor cell type, or (3) its genetic background. The current study aimed to define the differences between ntESCs and control ESC lines at molecular level by their transcriptional expression levels compliment well the previous study based on comparative work at cellular levels.
The accurate and time-specific expression of the pluripotent transcriptional regulatory system is fundamental for the maintenance of ESC cell renewal and for their differentiation potential. Nearby the most important in vitro pluripotency markers (such as Pou5f1, Nanog, and Sox2) (Niwa et al., 2000), a number of other important factors (such as Tdgf1, Dnmt3b, Gabrb3, Gdf3, Utf1, and Zfp42) are expressed in undifferentiated ESCs, and have been widely studied, although their role in maintaining pluripotency and self-renewal is still ambiguous (Ivanova et al., 2002; Ramalho-Santos et al., 2002; Tanaka et al., 2002).
In the first part of the work, the most important in vitro pluripotency markers were analyzed at cellular level by immunocytochemistry and flow cytometry. The results of these experiments indicated that the observed alterations may be more correlated with the genetic background (B6D2 or 129) of the ntESC than the type of the nuclear donor cell used (see details in Part I).
The only exception found was the HM1 ESC-derived ntESC line, where a strong correlation was observed between the parental HM1 ESC and its NT derivative: no significant differences were detected in any of the examined pluripotency markers at the protein level. In addition, expression profiling analyses identified no differences in genes associated with cell pluripotency between these two cell lines. These observations might indicate that nuclear reprogramming occurs in an organized manner in ECS nuclear donor cells, which could be due to their more plastic genome, and their “open” chromatin structure (Azuara et al., 2006).
A comparison of the two NT methods, using cumulus nuclear donor origin cell lines, revealed very similar results in flow cytometry and immunocytochemistry experiments (see details in Part I) and showed no differences in the gene expression patterns. Based on this data, we conclude that differences between the cumulus-derived ntESC lines were smaller compared to the MEF NT or B6D2 genotype control. Cumulus-specific genes were successfully reprogrammed and silenced immediately following SCNT (Tong et al., 2007). Thus, the developmental competence of cumulus cell-derived NT embryos depends on the restoration of embryonic gene expression, rather than the failure to silence the somatic genes (Tong et al., 2006, 2007). This phenomenon could probably explain the live offspring and ntESC derivation rates of cumulus-derived NT embryos (Tong et al., 2007).
Transcription profiling identified differences in gene expression levels between the ntESCs and the reference ESC (HM1). As recently described (Brambrink et al., 2006; Wakayama et al., 2006), the results of our expression profiling analysis indicated more prominent differences between distinct genetic backgrounds than due to the NT process (PEM or ZF-NT). In addition, when comparing conventional, fertilized embryo-derived stem cell lines, the differences between pluripotent lines derived from different sources (ESC vs. EGC) were smaller than differences between cell lines derived from different mouse strains (129 vs. C57BL/6) (Sharova et al., 2007). Thus, these conclusions are in accordance with our own results. However, we observed a decrease in the number of differentially expressed genes between the two genotypes (HM1 and B6D2) following the NT process from both genetic backgrounds (B6D2 MEF NT vs. HM1 NT and B6D2 CUM NT vs. HM1 NT). In the absence of published data, this observation should be analyzed more comprehensively, for example, by comparing several ntESCs of one nuclear donor cell and genetic background (e.g., 129/SV fibroblast nuclear donor cell-derived ntESCs). In addition, these experiments need to be repeated using several different donor cells and different genetic background-derived ntESCs. Indeed, efforts are ongoing in our laboratory to compare the same nuclear cell type-derived ntESCs from mice of different genetic backgrounds, to obtain a more detailed picture about this effect.
Transcriptional profiling has been used to determine the difference between ntESCs and fertilized embryo derived ESCs. A comparison of significantly regulated genes in our analysis with previously published studies of mouse ntESC lines (Brambrink et al., 2006; Wakayama et al., 2006) indicated that only three genes overlapped with our 171 genes. Further interspecies comparison with rhesus monkey ntESCs (Byrne, 2011) revealed another three genes that were differentially expressed in both species. However, the lack of published ntESC microarray data makes it difficult to further analyze or compare our results. Therefore, we decided to widen the basis of the analysis: first, by comparing our ntESC differentially expressed genes with published datasets on mouse NT embryos (Fukuda et al., 2010; Jincho et al., 2008), bovine (Aston et al., 2009; Pfister-Genskow et al., 2005; Rodriguez-Osorio et al., 2009; Smith et al., 2005; Somers et al., 2006), and pig (Tian et al., 2009) NT embryos. In the case of interspecies differences, the comparison of our differentially regulated genes and those of different species, revealed a more diverse picture. Similar genes were detectable between our gene set and the genes found from the NT embryos of other species. A common set of genes were identified in the interspecies comparisons that showed the importance of binding proteins, translation initiators, and ribosomal proteins in cell regulation and pluripotency, which could be altered during NT (Laurincik and Maddox-Hyttel, 2007; Sanges and Cosma, 2011). Herein, we noticed that nuclear transfer protocols (Wrenzycki et al., 2001) genetic background differences as well as the microarray approaches, influenced the outcome of the gene expression studies. This fact makes it particularly difficult to provide a precise list of differentially regulated NT-specific genes from interspecies comparisons. Previously published studies indicated that the NT procedure can result in the differential expression of a large number of genes in NT embryos (Aston et al., 2009; Fukuda et al., 2010; Jincho et al., 2008; Pfister-Genskow et al., 2005; Rodriguez-Osorio et al., 2009; Smith et al., 2005; Somers et al., 2006), however, this seems to be reduced in NT-embryo-derived ESCs (Brambrink et al., 2006; Byrne, 2011; Wakayama et al., 2006), which we also concluded in our study. The profoundly altered gene-expression profile of mouse cloned embryos appears to be dependent on the donor cell-type used (Gao et al., 2003; Smith et al., 2005), which is observed in ntESCs when compared with their nuclear donor cell type (Smith et al., 2005). This phenomenon demonstrates that ntESCs have undergone complete nuclear reprogramming, and the variation may be reduced or may even disappear when comparisons are performed between ntESCs and their fertilized embryo-derived counterparts. Furthermore, DNA microarray profiles and HiCEP experiments have shown that this “distance” is more prominent between fertilized embryo-derived ESCs, than in other ntESCs (Brambrink et al., 2006; Smith et al., 2005; Wakayama et al., 2006). In contrast, gene expression profiling has revealed subtle differences between human ESC lines and iPS cells despite the ability of both cell types to self-renew and contribute to all three germ layers during teratoma formation (Chin et al., 2009). Furthermore, in rhesus monkey ntESCs were transcriptionally closer to fertilized embryo-derived ECSs than iPS cells (Byrne, 2011). These observations suggest that ntESCs are derived from NT embryos in which nuclear reprogramming was perhaps more successful (Brambrink et al., 2006; Byrne, 2011; Wakayama et al., 2006). In other words, it may be that only the most developmentally competent NT embryos that have undergone complete nuclear reprogramming may be permissive for ESC establishment.
The only gene exceptions found among the list of differentially expressing genes published earlier include DNA methyltransferase 3a (Dnmt3a) and its regulatory factor, DNA methyltranferase 3-like protein (Dnmt3L). Both these genes are required for de novo DNA methylation of imprinted genes during early embryonic development (Hu et al., 2008) and to initiate differentiation in ESCs (Jackson et al., 2004). These two genes are often reported as differentially expressed in NT embryos of different species (Chung et al., 2003; Giraldo et al., 2008; Ju et al., 2010; Kumar et al., 2007; Wrenzycki et al., 2001). In our study, both genes were upregulated in B6D2 ntESC samples, compared to 129SV genotype ESCs or the B6D2 control in the microarray expression profiling experiments. It has also been reported that DNA methylation patterns of imprinted genes are variable in ESCs (Chang et al., 2009; Humpherys et al., 2001). Imprinted genes were also present among the differentially expressed genes identified in our study (Dcn, Nnat, and Peg3). The low number of differentially expressing imprinted genes might be a sign of successful reprogramming in the donor NT embryos of ntESCs. These observations confirm our previous assumption that complete reprogramming of NT embryos is necessary for ESC derivation.
The ESC lines were differentiated in vitro either spontaneously or by directed differentiation into cardiac and neural cell lineages. Although, expression profiling analysis identified a number of differentially expressed genes across the analyzed ESC lines, including genes associated with the developing heart (Col1a3, Col1a2, Tpm1, and Tbx3) or the neural system (Dhcr7, Gria4, App, Casp9, Nnat, and Crabp1), the directed in vitro differentiation studies revealed no major differences among the ntESC lines, which were analyzed by immunostaining (see details in Part I) and RT-PCR. Previous in vitro differentiation studies (Munsie et al., 2000) on ntESC support our findings concerning lack of differences observed in either neural or cardiac differentiation. In contrast, at the gene expression level we identified differences in expression of a small number of genes associated with cardiac and neuronal differentiation. These observed differences appeared to be related to differences in the genotype of the examined cell lines.
In conclusion, expression profiling analysis of seven cloned and noncloned ESC lines identified (1) differences between nuclear transfer- and fertilized embryo-derived ESCs, (2) genetic background related differences, (3) small differences caused by different nuclear donor sources, and (4) no differences due to the cloning methods used. Pluripotency marker analysis at the protein level revealed significant differences among the analyzed ntESCs and their control counterparts, although the observed differences had no effect on their in vitro cardiac and neural lineage differentiation potential.
Footnotes
Acknowledgments
The authors thank Dr. Melinda Pirity for the critical reading and discussion of the manuscript. We are grateful to Mrs. Hajnalka Csákány Tolnainé and Györgyi Kungl for their excellent technical assistance during the experiment. Supporting grants: Wellcome Trust (Grant No. 070246), EU FP6 (“TEAMOHOLIC” MEXT-CT-2003-509582; “MEDRAT” LSHG-CT-2006-518240; “CLONET” MRTN-CT-2006-035468), EU FP7 (“PLURISYS” HEALTH-2007-B-223485; PartnErS, PIAP-GA-2008-218205; EpiHealth FP7-HEALTH-2011-278418) and NKFP_07_1-ES2HEART-HU; BONUS HU_08/2-2009-0008.
Author Disclosure Statement
The authors declare that they have no competing interests.
References
Supplementary Material
Please find the following supplemental material available below.
For Open Access articles published under a Creative Commons License, all supplemental material carries the same license as the article it is associated with.
For non-Open Access articles published, all supplemental material carries a non-exclusive license, and permission requests for re-use of supplemental material or any part of supplemental material shall be sent directly to the copyright owner as specified in the copyright notice associated with the article.