
Abstract
Abstract
Genetic modification of stem cells, prior to transplantation, can enhance their survival and can improve their function in cell therapy settings. Mesenchymal stem cells (MSC) are considered one of the most promising tools for cell-based gene therapy, due to their multipotency, ease of isolation, as well as their high ex vivo expansion potential. Neural stem cells (NSC) may also present an ideal route for gene therapy and have been considered for use in cell replacement therapies in various neurodegenerative diseases. Gene therapy-based applications require the transfer of genetic material, either by viral or nonviral gene delivery methods, although the latter has been associated with low efficiencies, especially within hard to transfect cells as stem cells. Herein, we present results on the influence of plasmid size in gene delivery to human MSC and mouse NSC. We used minimized plasmids encoding a fluorescent protein but lacking the antibiotic resistance gene. This work shows that (1) for smaller plasmids the intracellular plasmid copy number can be up to 2.6-fold higher, and (2) the number of cells presenting fluorescence can be twice the number obtained for larger plasmids. Furthermore, by using plasmid constructs containing different polyA signals, we also demonstrated that differences between the plasmids depend largely on the transgene mRNA level. Based on our data we demonstrate that plasmid size severely affects the efficiency of nuclear uptake and we propose that it can also affect the rate of heterochromatin associated gene silencing in stem cells.
Introduction
Mesenchymal stem cells (MSCs) can be isolated from bone marrow, umbilical cord matrix, and fat tissue (Kern et al., 2006). The versatility of MSCs make them suitable for tissue engineering, cellular therapy, and gene therapeutic applications (Clements et al., 2007). In addition, MSCs have the ability to home to sites of injury, the potential for multiple cell lineage differentiation, and display low immunogeneticity (McMahon et al., 1998). Neural stem cells (NSCs) may also present an ideal route for gene therapy (Falk et al., 2002). These cells are a self-renewing population able to generate the neurons and glia cells of the developing brain. They can be isolated, expanded, genetically manipulated, and differentiated in vitro and reintroduced into a developing adult or with pathologically altered central nervous system. NSCs have been considered in cell replacement therapies for the treatment of various neurodegenerative diseases (Brown et al., 2003; Fujiwara et al., 2004; Müller et al., 2006).
As reported previously, plasmid DNA (pDNA) size is a potent modulator of gene transfer efficiency (Kreiss et al., 1999). DNA diffusion in the cytoplasm is strongly size dependent, with little or no diffusion for pDNAs>2000 bp (Lukacs et al., 2000). Therefore, the size of the transfected plasmids should have a strong effect on the transfection efficiency. The influence of pDNA size on gene expression levels was already demonstrated for minicircles in vitro and in vivo (Argyros et al., 2011; Bigger et al., 2001; Chen et al. 2003; Vaysse et al. 2006). However, to date, only few studies reported the effect of plasmid size on gene delivery to stem cells (Hsu and Uludag, 2008; McLenachan et al., 2007).
In the present study, we generated minimized reporter plasmids that lack the antibiotic-resistance gene (pVAX/MINI) with a size reduction of approximately 35% (Mairhofer and Grabherr, 2008), and that constitute a “middle way” approach with simplified vector production compared to the currently existing minicircle technology. The used Escherichia coli strain JM108murselect allows stable maintainance of plasmids devoid of any marker genes because the transcription of an essential gene in JM108murselect is controlled by an RNA–RNA antisense interaction that is dependent on the presence of RNAI. RNAI is an intrinsic part of the copy number regulation of ColE1-like plasmids (pUC, pET, pMB1, pBR322), and therefore transcribed from common plasmids used for gene therapeutic applications. This system is scalable and the production of marker-free plasmid in the Gram-scale has been reported recently (Mairhofer et al., 2010).
Using human MSC and mouse NSC as model systems, we analyzed the influence of the size reduction in the number of cells presenting fluorescence, fluorescence intensity, and respective decay over time, and also the intracellular plasmid copy number. In addition to size reduction, we further analysed vectors containing different polyadenylation signal sequences that have already been characterized by us (Azzoni et al., 2007; Ribeiro et al., 2004) within a different context.
Materials and Methods
Preparation of plasmid DNA
pVAX-GFP (3697 bp) plasmid contains the enhanced Green Fluorescent Protein (eGFP) gene. The details of the construction are described elsewhere (Azzoni et al., 2007). Marker-free pVAX/MINI–EGFP vectors were produced according to (Mairhofer et al., 2008), using PCR and the primers pVAXori-back (5′-CCGTAGAAAAGATCAAAGGATC-3′) and pVAXSV40-for (5′-CATAAAACCGCGGATCGATC-3′) or pVAXSINT-for (5′-CGCTTGCTGTCCATAAAACC-3′), respectively. The PCR product was circularized by ligation using T4 DNA ligase (New England Biolabs, Beverly, MA, USA) and electroporated according to the following protocol: fresh colonies of JM108murselect were taken from a master plate containing anhydro-tetracycline (aTc) to suppress the background levels of tetR and were grown overnight on 37°C in 5 mL LB that was again supplemented with aTc. The next day the culture was diluted 1:100 in LB + aTc and grown to an OD600 of 0.4–0.6 and washed three times with ice-cold water. Electroporation with pVAX/MINI–EGFP vectors was performed using a Bio-Rad gene pulser at 12.5 kV/cm, 1000 Ω and 25 μF. After transformation, cells were resuspended in 900 μL of SOC-medium and allowed to recover for 1 h at 37°C. Afterward, cultures were diluted and plated on LB plates. Conventional pVAX-EGFP variants were selected using kanamycin (50 μg/mL). pDNA was purified using the NucleoBond Maxi Plus EF Kit (Machery-Nagel, Germany). pDNA quality was assessed by the following criteria: an optical density ratio 260:280 nm >1.8 and 260:230 nm >2.0 and by subsequent restriction analysis and agarose gel electrophoresis.
Mouse neural stem cell line expansion
The mouse neural stem cell (mNSC) line CGR8-NS, was derived from the mouse embryonic stem cell line CGR8 at the laboratory of Professor Austin Smith, Wellcome Trust Centre for Stem Cell Research, United Kingdom. CGR8-NS cells were plated at a initial cell density of 104 cells/cm2 and expanded under static conditions on uncoated tissue culture (TC) plates or T-flasks (BD Falcon, Bedford, MA, USA) using RHB-A medium (Stem Cell Sciences, Canada) supplemented with 15 ng/mL FGF-2 and EGF (Peprotech, Rocky Hills, NJ, USA), 1% penicillin (10,000 U/mL)/streptomycin (10,000 g/mL) (Gibco, Grand Island, NY, USA). Cells were cultured at 37°C in a 5% CO2 humidified atmosphere. Cells were harvested and replated after 3 days of culture using Accutase (Sigma-Aldrich, St. Louis, MO, USA). At each passage, viable and dead cells were counted using the Trypan Blue dye exclusion test (Gibco). Viabilities were always above 90%. Cells used for the transfection experiments (80–90% confluence) were between passage 22 and 27 and varied between 1 week in culture or 3 weeks in culture.
Human mesenchymal stem cells isolation and expansion
Bone marrow (BM) aspirates were obtained from volunteer donors, after informed consent at Instituto Português de Oncologia de Lisboa Francisco Gentil, and human mesenchymal stem cells (hMSC) were isolated and cultured as described elsewhere (Dos Santos et al., 2010). Upon isolation, hMSC were expanded for two to four passages and then kept frozen in liquid nitrogen. When needed, cells were thawed and expanded on 75 cm2 T-flasks using an initial density of 3000–6000 cells/cm2 in DMEM–10% FBS, 1% penicillin (10,000 U/mL)/streptomycin (10,000 g/mL), and 0.1% (v/v) Fungizone (Gibco) at 37°C in a humidified atmosphere containing 5% CO2. The medium was changed every 3–4 days. The cell number and cell viability were determined using the Trypan Blue dye exclusion test. Viabilities were always above 90%. hMSC used for the transfection experiments were between passage 3 and 11 and cells were transfected at 80–90% confluence. Cells of different passage number have been used in order to test cells with different proliferation potential.
Microporation
Microporation was performed using a microporator instrument (MP100) purchased from Digital Bio Technology (Seoul, South Korea), currently supplied by Invitrogen (Neon). Cells (150×106 or 200×106cell/mL) were resuspended in a sucrose-based buffer (250 mM sucrose and 1 mM MgCl2 in PBS) and incubated with a specific amount of plasmid DNA. To compare the transfection efficiencies between different size plasmid variants the DNA mass was adjusted in order to have the same number of molecules (4.8×10¹¹ molecules). The plasmid mass used was between 1.3 and 2 μg per 10 μL of cell suspension.
In the case of mNSC the microporation conditions were 1400 V, 20 msec, and 1 pulse. Each 200,000 microporated cells were added to 190 μL of prewarmed DMEM/10% FBS medium, without antibiotics and equally split into two or three wells of a 12- or 24-well culture plates containing culture medium under the same conditions. For hMSC the microporation conditions used were 1200 or 1300 V, 30 msec, and 1 pulse, and the 150,000 cells were split into two wells of a 24-well culture plate. MSC or NSC cells were then incubated at 37°C in a 5% CO2-humidified atmosphere, harvested after 24 h, and analyzed. Three and four independent transfection experiments were performed respectively using mNSC and hMSC.
Flow cytometry analysis
The number of GFP-positive cells (GFP+ Cells) was monitored by flow cytometry using a FACSCalibur equipment and the CellQuest software (BD Biosciences, San Jose, CA, USA). Briefly, cells were harvested by enzymatic treatment and the cell suspension was collected into a conical tube and centrifuged. After discarding the supernatant, the cells were resuspended in 1-mL PBS. Thereafter, 500 μL of this cell suspension were collected into flow cytometry tubes for GFP expression analysis and the other 500 μL were used to determine the cell number and cell viability as previously described. Finally, the remaining cells were centrifuged, the supernatant was discharged, and pellets stored at −80°C for subsequent real-time PCR analysis.
Real-time PCR for determination of plasmid content
Quantitative real-time PCR was performed in a Roche LightCycler™ detection system using the FastStart DNA Master SYBR Green I kit (Roche Diagnostics, CH), as described previously (Ribeiro et al., 2010).
Results
The main goal of this work was to study the effect of smaller plasmids, lacking a selection marker, on the gene delivery efficiency to two different stem cell types: hMSC and mNSC. The marker free plasmids were produced using a previously described plasmid addiction system, based on RNA–RNA interference (Mairhofer et al., 2008). Compared to other approaches for the marker-free production of plasmids (e.g., minicircles) this methodology allows the production of large quantities of plasmid DNA in an easy and straightforward manner (Maihofer et al., 2010). Microporation was used as the nonviral gene delivery technique and the number of plasmids inside the cells was determined by real-time PCR. Both the number of transfected cells and the level of reporter protein expression were assessed by flow cytometry analysis. The results are divided into three parts as follows.
Number of GFP+ cells upon microporation
Using microporation, hMSC or mNSC cells were transfected with different variants of pVAX–EGFP reporter vector. An overview of the different pVAX–EGFP vector variants can be found in Table 1. The pVAX/MINI–EGFP vectors lack the kanamycin resistance gene and are 33–35% reduced in size compared to their parental plasmids. A comparison on the different hMSC and mNSC transfection efficiencies assessed by the number of GFP+ cells obtained with pVAX–EGFP and pVAX/MINI–EGFP variants can be seen in Figures 1 and 2. Twenty-four hours posttransfection, the differences between the larger and smaller plasmids were small (up to 5%), except for plasmids containing the synthetic polyA signal (–SINT) with differences between 10 and 16%. These differences were verified both for hMSC and mNSC. However, 3 days posttransfection we observed a twofold increase in GFP expression for hMSC, with pVAX/MINI variants containing the BGH and SV40 polyadenylation signal (Fig. 1A and B). This increase was observed both for low passage (passage 3) and higher passage numbers (passage 7). Interestingly, we have never observed an increase in the number of GFP+ cells during the first 3 days for –SINT variants. In the case of mNSC, the number of GFP+ cells were always higher on day 1 post-transfection and then declined for all the variants analyzed (Fig. 2A and B).

Overview on GFP+ cell counts of hMSC transfected with plasmids differing in size (pVAX-EGFP and pVAX/MINI-EGFP) and polyA-signal (-BGH, -SV40, -SINT). (
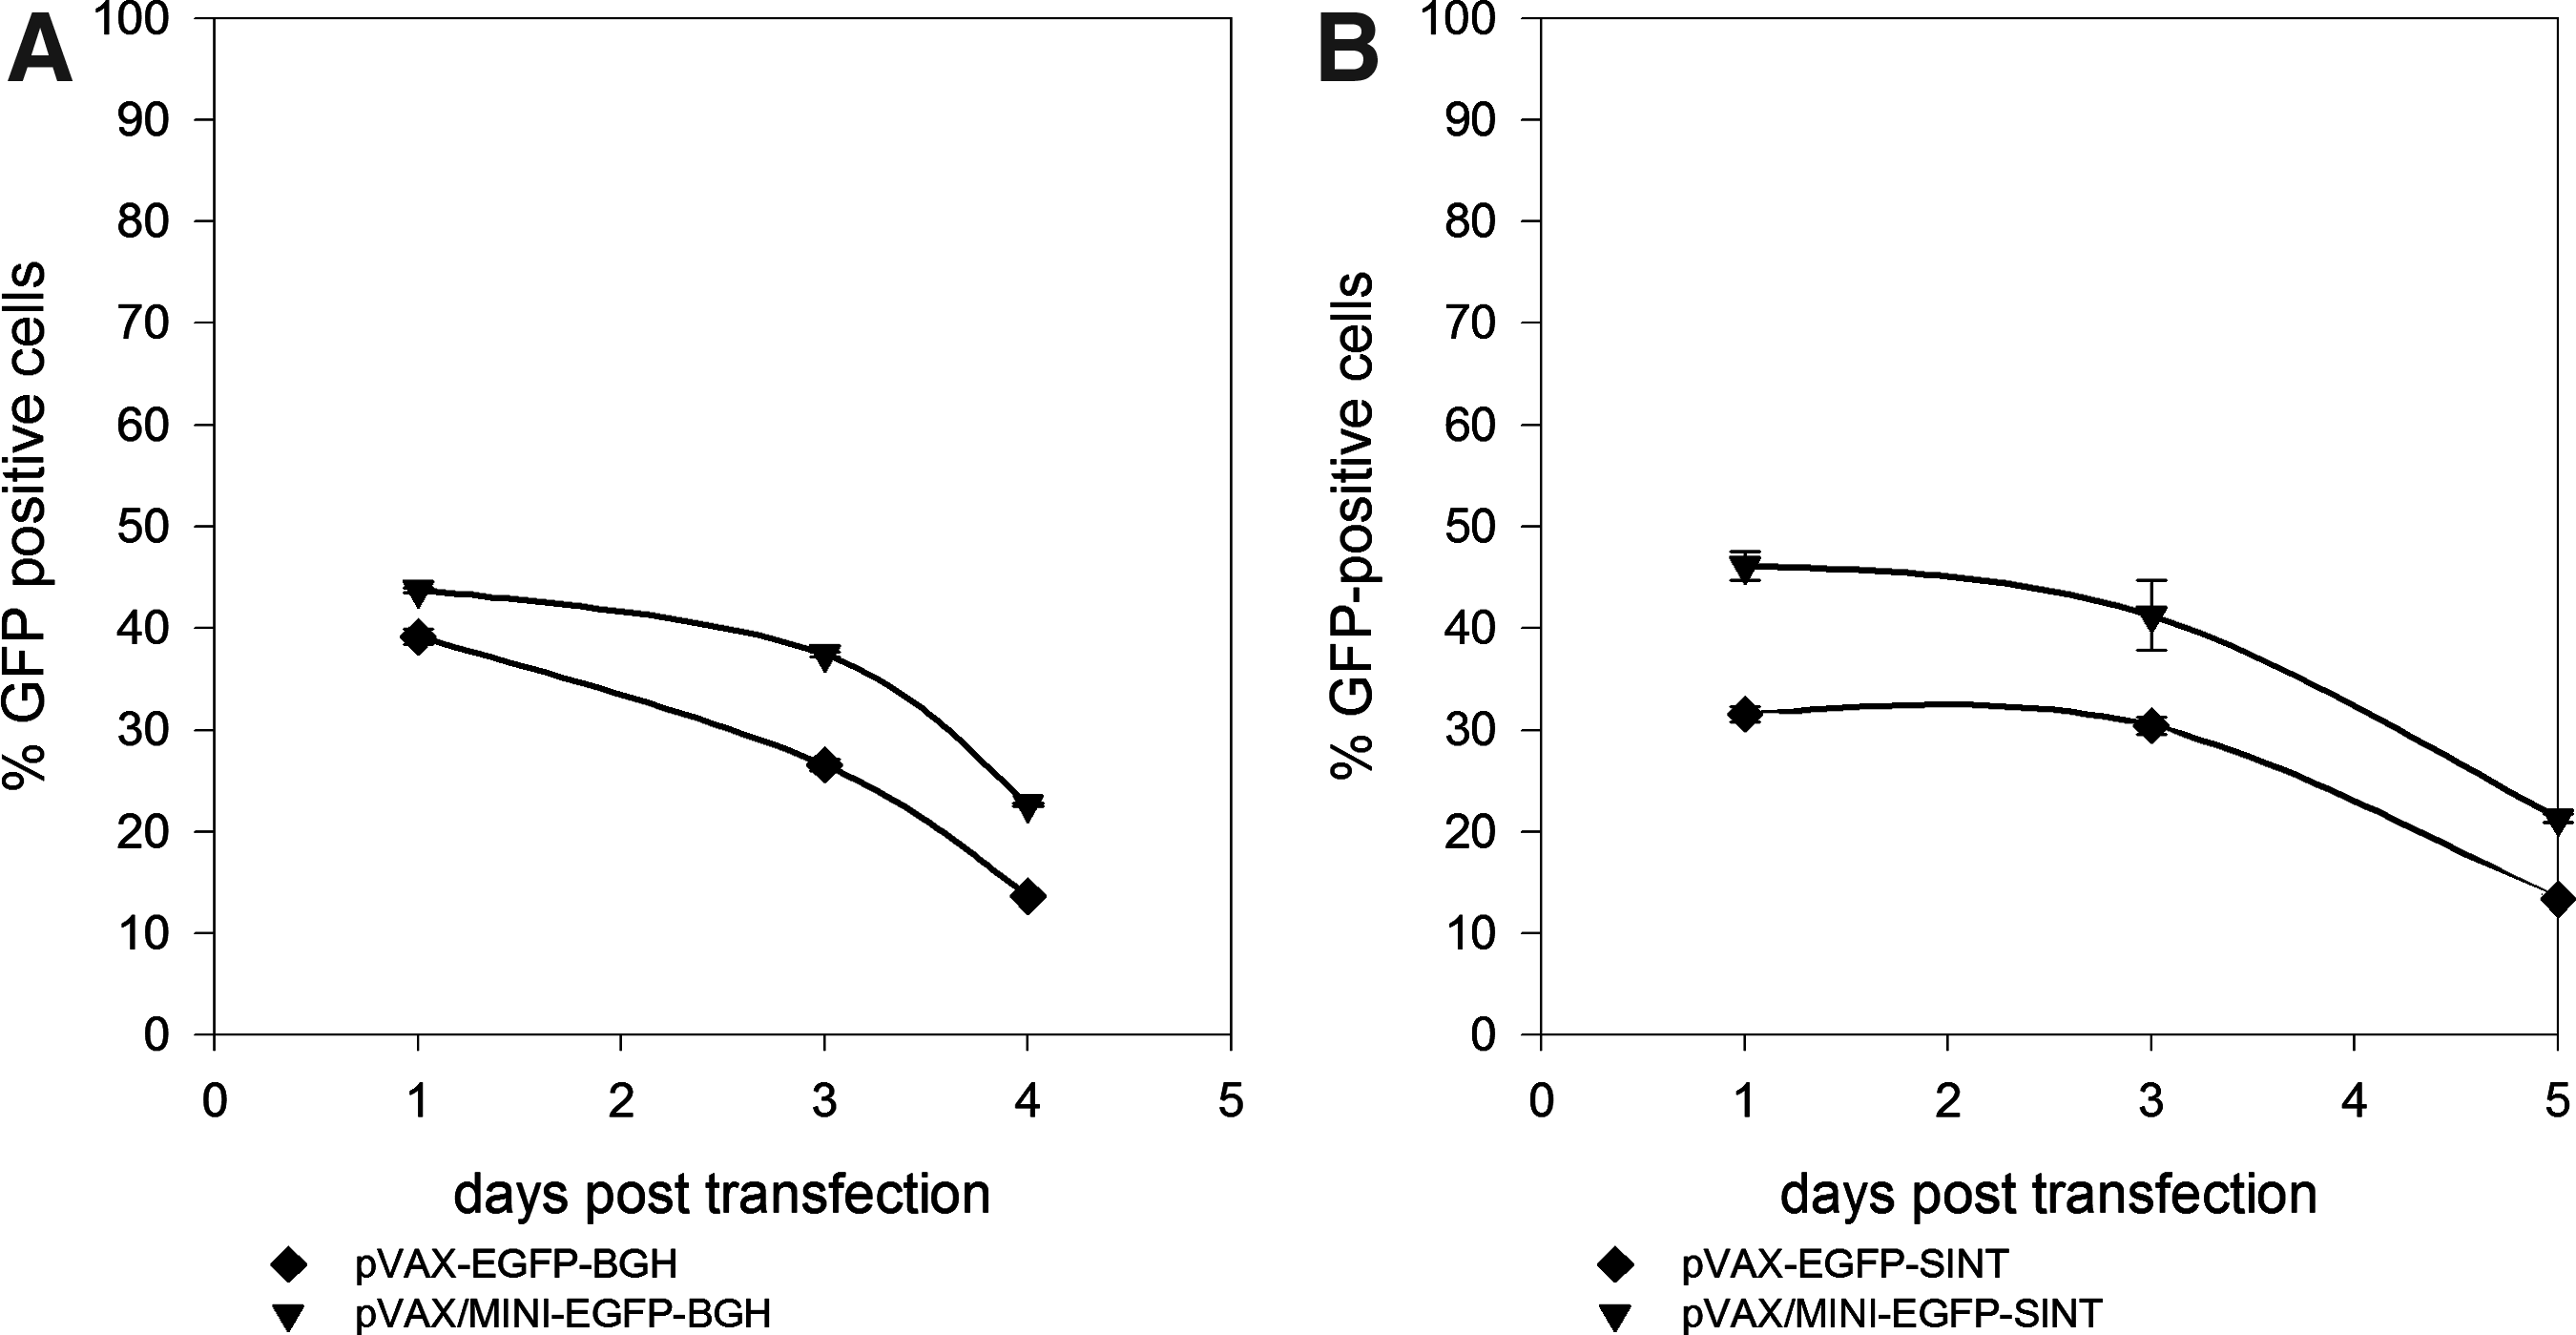
Overview on GFP+ cell counts of mNSC (passage numbers 22–27) transfected with plasmids differing in size (pVAX-EGFP and pVAX/MINI-EGFP) and polyA-signal (-BGH, -SINT). The microporation conditions used were 1,400 V, 20 ms, 1 pulse (
Mean fluorescence (MF) of transfected cells
A comparison of the GFP expression levels can be obtained using the values of the mean fluorescent intensities multiplied by the percentage of GFP+ cells, hereafter called mean fluorescence (MF). In all cases the MF was higher for the pVAX/MINI variants. An example of the MF values and decay for hMSC is presented in Figure 3 and Table 2. After 72 h of gene delivery to hMSC and mNSC (data not shown), the MF was 1.3–1.8-fold higher for pVAX/MINI–SINT variants and 2.2–2.3 fold higher for –BGH and –SV40 pVAX/MINI plasmids when compared to the larger plasmids. Consistent with the results obtained for the number of transfected cells and shown in the previous section, a slower MF decay over time was observed with the smaller plasmids for –BHG and –SV40 variants with hMSC (Fig. 3). At day 3 post-transfection the differences in the MF between smaller and larger plasmids ranged between 16 and 35%. In the case of mNSC, we observed a high initial MF that declined very rapidly to values between 3 to 15% 3 days posttransfection. In the case of –SINT plasmids no differences in the decay were observed both for hMSC and mNSC.

Mean fluorescent decay of hMSCs 1, 3, 5, and 7 days posttransfection with pVAX-EGFP-SV40 and pVAX/MINI-EGFP-SV40. Mean fluorescence was calculated by multiplying the mean fluorescence intensity by the percentage of GFP+ cells. Data is presented as mean±SD, n=2.
MF, mean fluorescent intensities×percentage of GFP+ cells. Data is presented as mean±SD, n=2.
Analysis of plasmid copy number (PCN) upon microporation
PCN was determined for pVAX–EGFP–SINT variants upon microporation of hMSC (Table 3) and mNSC (Table 4). In the case of hMSC, PCN was 2.6-fold higher for pVAX/MINI–EGFP–SINT on day 1 post-transfection and 2.0-fold higher on day 3 post-transfection when compared to pVAX–EGFP–SINT. No significant difference in PCN could be observed 5 days posttransfection. The analysis of mNSC showed that PCN was 2.0-fold higher on day 1 posttransfection and 1.4-fold higher on day 3 post-transfection for the marker-free plasmid when compared to the pVAX–EGFP–SINT plasmid. Again, no significant difference was observed on day 5 post-transfection.
Data is presented as mean±SD, n=2.
Data is presented as mean±SD, n=2.
Discussion
In the present study, we report the use of marker-free plasmids, a new vector type that is free of antibiotic resistance genes or any other genetic selection marker, for the nonviral gene delivery to hMSC and mNSC. The performance of marker-free plasmids was compared to that of parental plasmids in regard to (1) the number of plasmid copies per cell, (2) number of GFP+ cells, and (3) MF (fluorescence intensity×% GFP+ cells).
Plasmid uptake
The PCN obtained for the marker free pVAX/MINI-variants (pVAX/MINI–EGFP–BGH/SV40/SINT) were always higher compared to the original size plasmid vector (pVAX–EGFP–BGH/SV40/SINT). Although cells were always transfected with the same number of pDNA molecules we were able to show that the initial PCN per cell was twofold higher with the size-reduced plasmid variants. Therefore, it is conceivable that the plasmids with a minimal bacterial backbone and approximately 35% reduction in size have an increased uptake efficiency (in a twofold range). Such effects have previously been observed by McLenachan et al. (2007), who described that despite similar plasmid uptake efficiencies, nuclear delivery of DNA was severely compromised for large DNA constructs. This indicates that small plasmids evade degradation by rapid transit through the cytoplasm (McLenachan et al., 2007). In our protocol for PCN determination whole cells were used; therefore, our values include plasmids inside the nucleus and the cytosol (Ribeiro et al., 2010). However, it has been estimated that the half-life of naked plasmid DNA in the cytosol of cells ranges between 50 min and 5 h (Vaughan and Dean,2006). Therefore, we may assume that 24 h post-transfection all the plasmid molecules were inside the nuclei.
We found that, at 24 h post-transfection, the intracellular PCN was slightly higher for mNSC compared to hMSC. This can be explained by the higher proliferation rate of mNSC (which are embryonic stem cell derived) when compared to hMSC (which are derived from an adult source). Because a higher percentage of mNSC cells are undergoing mitosis during the transfection process, the temporary breakdown of the nuclear membrane allows a more efficient access of pDNA to the nucleoplasm (Akita et al., 2007). In contrast to the PCN values reported by Akita and coworkers, which were obtained after microinjection, we have recently shown (Madeira et al., 2010; Ribeiro et al., 2010) that the PCN obtained after lipofection of hMSC was between 20,000 and 100,000 plasmids/cell, which is 10- to 100-fold higher than achieved by microinjection. These differences in PCN appear to be mainly due to the protection of the pDNA by liposomes during intracellular trafficking. Indeed, Moriguchi and colleagues verified that the amount of nuclear-delivered pDNA to NIH3T3 cells was higher for lipoplexes prepared with higher concentration of cationic lipids when compared with those prepared with low amount of lipids (Moriguchi et al., 2008). This lower PCN and rapid elimination from the cells (within 7 days) may represent an advantage when the cells are to be used in a therapeutic approach such as transient expression of anti-inflammatory genes by MSC to suppress an acute inflammation or homing chemokines to move MSC toward the site of injury (Gheisari et al., 2008).
Number of GFP+ cells and MF
Except for plasmids containing the synthetic polyA signal, the most significant differences in the number of GFP+ cells and in the MF were detected 72 h posttransfection, attaining values 2.2-fold higher for the marker-free pVAX/MINI–EGFP–BGH. It has been shown that gene expression correlates to the number of intranuclear plasmids only at low plasmid copy numbers. However, above a certain gene dosage, expression rates do not continue to increase in a linear manner (Cohen et al., 2009; Tachibana et al., 2002). Our data suggest that the number of plasmids in the cell nucleus was high at 24 h post-transfection, leading to a saturation of gene expression. This hypothesis is in accordance with the lack of a substantial difference in the number of GFP+ cells and MF 1 day post-transfection. After cell division and upon the consequent decrease of the PCN inside the nucleus the differences in gene expression became more pronounced. In contrast, for the –SINT variants the difference in GFP expression was observed 24 h post-transfection. Previously, we have demonstrated that transfection of CHO cells with –BGH variants always resulted in a higher number of GFP+ cells compared to the –SINT variants (Azzoni et al., 2007). The reason for this is that the number of EGFP mRNA copies in cells transfected with –SINT variants is significantly lower when compared with the number of mRNA copies obtained with cells transfected with the –BGH variants. Thus, due to lower mRNA levels, gene expression saturation was not reached with pVAX–EGFP–SINT and pVAX/MINI–EGFP–SINT. Therefore, the differences in GFP expression were most distinct early on, at 24 h post-transfection.
In terms of the GFP expression in hMSC, two different profiles were obtained. The profiles obtained for–BGH and –SV40 variants depict an increase in the number of GFP+ cells during the first 3 days after transfection, and for the –SINT variant an immediate decrease, because the 24 h post-transfection can be observed. In the case of mNSC, we never observed an increase in the number of GFP+ cells for any of the plasmids studied (Fig. 2A and B). For these cells with higher proliferation potential we observed decreasing GFP+ cell numbers starting 1 day post-transfection for all vector variants.
The significant increase in GFP+ cells observed with –BGH and –SV40 marker-free plasmids seems to be partially due to (1) increased efficiency of nuclear uptake of marker-free plasmid molecules (as confirmed by PCN analysis), and (2) prolonged transgene expression. The values of the MF (a qualitative indication of the EGFP expression levels) were always higher for the pVAX/MINI variants. Furthermore, pVAX/MINI-based plasmids maintained higher GFP expression for 7 days compared to the pVAX based plasmids. Interestingly, this difference cannot be attributed to the decay in the number of intracellular plasmids because PCN dropped slightly faster for the –MINI variants (Tables 3 and 4). This might be due to a mixed effect caused by general enzyme kinetics of endo- and exonucleases (the more DNA available the faster it gets degraded) and triggering of the aforementioned enzymes caused by increased levels of foreign DNA. Another possibility could be an increased loss of MINI-plasmids into the cytoplasm during cell division and disassembly of the nucleus at a higher rate when compared to the larger plasmid.
We thus suggest that the slower decline in mean fluorescence is due to different transgene silencing effects. Furthermore, our results revealed that the fluorescence intensity 24 h posttransfection was higher for mNSC [between 700 and 2400 relative fluorescence units (RFU)] compared to hMSC (500 to 1200 RFU). This is in accordance with the slightly higher PCN found in mNSC, but could be also due to a higher expression levels in these cells. We also observed that the MF decreased more rapidly in the case of mNSC (results not shown). This effect may be attributed to the higher proliferation rate of mNSC.
Episomal transgene silencing could be responsible for the differences in MF decay
Except for the –SINT series of plasmids, after transfecting the smaller pVAX/MINI plasmids we observed higher MF and a slower decay of MF under all conditions tested, compared to the parental pVAX plasmids. It was reported previously, that episomal pDNA is prone to gene silencing, for example, in liver cells, due to the presence of bacterial DNA (Chen et al., 2004). The proposed theory is that within the plasmid backbone repressive heterochromatin is formed which then spreads and inactivates the gene of interest, leading to a decline in transgene expression. One common feature of bacterial backbone sequences is that they are transcriptionally inactive in mammalian cells. It is proposed that these transcriptionally inert sequences are similar to the heterochromatin, found in eukaryotic cells, and are therefore responsible for triggering a nucleosome condensation process, finally leading to the silencing of the transgene in the vicinity (Chen et al., 2004). There exist several reports that provide evidence that unmethylated CpG motifs in episomal plasmid DNA may play a role in transcriptional silencing of a transgene (Hodges et al., 2004; Hyde et al., 2008; Yew et al., 1999, 2000, 2002). Due to deletion of the antibiotic resistance gene, our size reduced pVAX/MINI plasmids are lacking 93 CpG-motifs compared to the parental plasmids (Table 1). Although the PCN dropped more rapidly for the pVAX/MINI variants, we found MF to be higher. This suggests that the effect of gene silencing is dependent on the length of the bacterial backbone sequence and possibly on the CpG-content of that sequence. At this point we have to address that the effect of CpG-content of plasmid vectors on episomal gene silencing is controversial. However, our findings are in accordance with Chen and colleagues (2008) who observed that the transgene silencing effect was more pronounced with larger plasmids than with smaller ones. The differences in the MF decay were not observed for –SINT variants. Possibly, the limiting factor for the transgene expression of these plasmid variants is the level of intracellular mRNA. The number of mRNA copies was found to be much lower when the synthetic polyadenylation signal was used (Azzoni et al., 2007) and potentially the phenomenon of transgene silencing was thus undetectable.
Conclusion
In this study we showed that the efficiency of nonviral gene delivery into stem cells can be increased by a reduction in the vector size. We showed that the transfer of a novel type of plasmids that are devoid of bacterial selection markers into hMSC and mNSC was significantly improved due to higher plasmid DNA uptake and enhancement of the level of expression of the gene of interest. Furthermore, our results support the theory that bacterial-motifs promote eukaryotic gene silencing. Although the plasmids are present only for a few days inside the target cells, in numerous cases of noninherited diseases this may represent an advantage in cell-based gene therapy settings. In the case of hMSC, transient expression of anti-inflammatory genes serves to suppress an acute inflammation or, for example, transient expression of homing chemokines moves hMSC toward the site of injury (Gheisari et al., 2008). Additionally, marker-free plasmids are highly feasible for generating induced pluripotent stem cells due to their improved delivery efficiency and increased safety, as they contain no antibiotic resistance genes (Jia et al., 2010; Maucksch et al., 2009). Finally, because the large-scale production of MINI-plasmids is easier and more straightforward (Mairhofer et al., 2010) than other alternative technologies for the production of marker-free plasmids (e.g., minicircles), MINI-plasmids comprise an efficient alternative for cell-based gene therapy and stem cell technology.
Footnotes
Acknowledgments
This work was financially supported by Fundação para a Ciência e Tecnologia (FCT, Portugal) through the MIT-Portugal Program, Bioengineering Focus Area, and through Project PTDC/EQU-EQU/114231/2009 and through postdoctoral grants awarded to S. Ribeiro (SFRH/BPD/41824/2007) and C. Madeira (SFRH/BPD/41755/2007). The authors gratefully acknowledge Professor Domingos Henrique, Institute of Molecular Medicine, Lisboa, Portugal for providing the CGR8-NS cell line.
Author Disclosure Statement
The authors declare that no conflicting financial interests exist.