
Abstract
Abstract
Human endothelial cells (ECs) have the ability to make up the lining of blood vessels. These cells are also capable of neovascularization and revascularization and have been applied in various clinical situations. With the aim of understanding the effect of NANOG superexpression on ECs, we transduced the Nanog gene into the ECs. Nanog is highly expressed in embryonic stem cells (ESCs) and is essential for pluripotency and self-renewal. However, Nanog can also be expressed in somatic stem cells, and this gene is related to great expansion capacity in vitro. We found that ECs expressing Nanog showed expression of other stemness genes, such as Sox2, FoxD3, Oct4, Klf4, c-myc, and β-catenin, that are not normally expressed or are expressed at very low levels in ECs. Nanog is one of the stemness genes that can activate other stemness genes, and the upregulation of the Nanog gene seems to be critical for reprogramming cells. In this study, the introduction of Nanog was sufficient to alter the expression of key genes of the pluripotent pathway. The functional importance of Nanog for altering the cell expression profile and morphology was clearly demonstrated by our results.
Introduction
Embryonic stem cells (ESCs) maintain pluripotency by the expression of specific transcription factors (TFs) that suppress differentiation (Chambers et al., 2003; Mitsui et al., 2003). Recent studies have shown that the pluripotent pathway is regulated by a set of ESC-specific genes, such as Nanog, Oct4, and Sox2, whose expression is high during the pluripotent state and downregulated during embryogenesis. One important pluripotent gene is Nanog. Deficiency of this gene in ESCs created by knockout (Mitsui et al., 2003) or by knockdown procedures (Strumpf et al., 2005) abolishes self-renewal and pluripotency and the cells are induced to differentiate into extraembryonic endoderm. Apparently Nanog functions in coordination with two other genes, Oct4 and Sox2, to maintain ESC pluripotency (Chambers, 2004).
The overexpression of Nanog is capable of maintaining the pluripotency and self-renewing properties of ESCs under culture conditions that normally would induce differentiation (Chambers et al., 2003). Nanog is normally expressed in pluripotent cells, ESCs, and embryonic germ (EG) cells. Nanog overexpression in human (h) ESCs enables feeder-free growth (Darr et al., 2006), indicating that Nanog has a key role in the maintenance of the pluripotency of stem cells. Moreover, it was demonstrated that mesenchymal stem cells (MSCs) overexpressing Nanog present a greater ability for expansion in vitro (Go et al., 2008). Forced expression of Nanog in NIH-3T3 cells increases growth rate and alters the cell morphology (Piestun et al., 2006; Zhang et al., 2005), suggesting that Nanog might function as an oncogene. The expression of Nanog was also found in germ cell (GC) tumors, suggesting that tumors cells are closely related to ESCs (Ezeh et al., 2005). Nanog expression was also found in some breast tumors and cell lines such as MCF7 (Ezeh et al., 2005).
A more detailed understanding of the role of transcription factors involved in the direction of pluripotency was obtained by identifying the promoters occupied by these factors in ESCs (Boyer et al., 2005). Nanog, Sox2, and Oct4 together bind 10% of the promoters present in the human genome; in addition, more than one transcription factor binds to a single promoter region. However, more than half of genes regulated by Nanog, Oct4, and Sox2 are silenced in ESCs, indicating that these genes suppress differentiation. Thus, Nanog supports pluripotency due to suppression of genes involved in the differentiation and activation of genes responsible for the maintenance of self-renewal (Golan-Mashiach et al., 2005). The identification of target genes for Nanog by forced gene expression is necessary for understanding the role of Nanog during development and its oncogenic potential.
In this work, we introduce Nanog into ECs with the aim of studying the effect of the high levels of Nanog in these cells. We show that the high levels of Nanog in ECs activates other pluripotent genes and changes cellular morphology drastically.
Material and Methods
Cell culture
Endothelial progenitor cells (EPCs) were isolated from 40 mL of human peripheral blood obtained from health volunteers. To obtain EPCs, mononuclear cells were isolated using Ficoll-Paque™. A total of 2×10⁶ cells/mL were seeded onto fibronectin-coated Petri dishes and cultured in complete EGM-2 MV medium (Lonza, USA) that contained human epidermal growth factor (hEGF), vascular endothelial growth factor (VEGF), human fibroblast growth factor-basic (hFGF-B), and R3-insulin-like growth factor-1 (R3-IGF-1) and was supplemented with 10% fetal bovine serum (FBS).
ECs were obtained and isolated from human umbilical cords. The cells were purified by CD105 MicroBeads (Macs, USA) and cultured in EGM2-MV medium (Lonza, USA). Phenotype characterization and functional assays confirmed the endothelial profile of these cells. The ECs were used between passages 2 and 5. A subline of human umbilical vein endothelial cells, HUVEC-CS, was obtained from the American Type Culture Collection (ATCC®; CRL-2873) and used as a control for the EC line.
Plasmid construction
The Nanog transcription factor (NM_024865.1) was amplified by the polymerase chain reaction (PCR) using a proofreading Taq polymerase (Promega) and cDNA from human ESCs as template. The open reading frame of human Nanog was cloned into pCR2.1-TOPO (Invitrogen, USA). The cloning primers used were: pNANOG-F-SmaI, 5′-
Lentiviral production
DNA molecules carrying the Nanog gene, the packaging construct pCMVΔR8.91 (Mastromarino et al., 1987; Zufferey et al., 1997), and the pseudotyping construct pMD2.VSVG, which codes for vesicular stomatitis virus glycoprotein G (Follenzi and Naldini, 2002; McGlynn et al., 1996), were introduced into 293T cells by a triple cotransfection using calcium phosphate coprecipitation. Sixteen hours after transfection, the supernatants were replaced by fresh medium and cells were incubated for additional 48 h. Culture supernatants containing the lentiviral particles were collected, and the virus preparations were snap frozen and stored at −80°C. At this temperature, titers remain stable for at least 2 months. Virus titers were determined as follows: 293T cells were seeded at a concentration of 5×10⁴ cells per well of a 24-well plate. Twenty-four hours later, 293T monolayers were transduced with serial dilutions of the viral concentrates supplemented with 1 μg/mL Polybrene (Sigma-Aldrich, Munich, Germany). After 72 h of incubation, the cells were harvested using trypsin-EDTA and counted. The transduced cells were detected by the expression of eGFP using fluorescence-activated cell sorting (FACS) on a FACSCalibur flow cytometer (BD Biosciences, Franklin Lakes, NJ, USA). Titers were expressed as 293T-transducing units per milliliter.
Lentiviral infection
ECs were seeded at 2×10⁴ cells per 100-mm dish 1 day before the transduction. The virus-containing supernatants were filtered through a 0.45-mm pore-size filter. The viruses were added at the concentration of multiplicity of infection (MOI) 10 to the ECs dish and incubated overnight. Twelve hours after transduction, the virus-containing medium was replaced by Dulbecco's modified Eagle's medium (DMEM) supplemented with 10% of FBS.
Flow cytometry
ECs transduced with Nanog lentiviral vector were trypsinized. Next 1 μg/mL propidium iodide (PI) (Sigma) was added to the solution as a vital marker to eliminate dead cells and debris. FACS analysis and sorting were performed based on PI exclusion, forward scatter, and side scatter. The GFP fluorescence was performed using a FACSVantage flow cytometer (Becton Dickinson, San Jose, CA, USA). Our cell populations positive for GFP were sorted twice to optimize cell purity. Percentages of GFP-positive cells were determined analyzing at least 50,000 cells per sample.
Real-time PCR assays
The RNA samples were purified with TRIzol reagent (Invitrogen, USA) and treated using a Turbo DNA-free kit (Ambion, USA) to remove any genomic DNA contamination. One microgram of RNA was used for the reverse transcription reaction, and the assay was performed using the High Capacity cDNA Reverse Transcription Kit (Applied Biosystems, USA) according to the manufacturer's instructions. Quantitative PCR was performed with TaqMan (Invitrogen, USA), and the analysis was performed in the 7300 real-time PCR system (Applied Biosystems, USA). The endogenous gene glyceraldehyde-3-phosphate dehydrogenase (GAPDH) was used for the normalization of the gene expression.
Results and Discussion
ECs form the inner layer of blood vessels. These cells have an important role in angiogenesis and in the development of new blood vessels from preexisting vessels, and therefore are a perfect source of cells for tissue-engineering applications due to their revascularization capacity (Asahara and Isner, 2002). These cells have already been applied in various clinical studies. However, in vitro, these cells lose their capability for proliferation after several passages. With the aim of conferring higher expansion capabilities in vitro and also to study the effect of the high levels of Nanog in these cells, we introduced the Nanog gene into the ECs.
Nanog is one of the stemness genes, and its molecular function was shown by the fact that upregulation of the Nanog gene results in the activation of other stemness genes, and it is critical in cell reprogramming (Silva et al., 2009). It has been reported that pluripotent stem cells can be generated from somatic cells by the forced expression of four defined genes (Takahashi and Yamanaka, 2006; Yu et al., 2007).
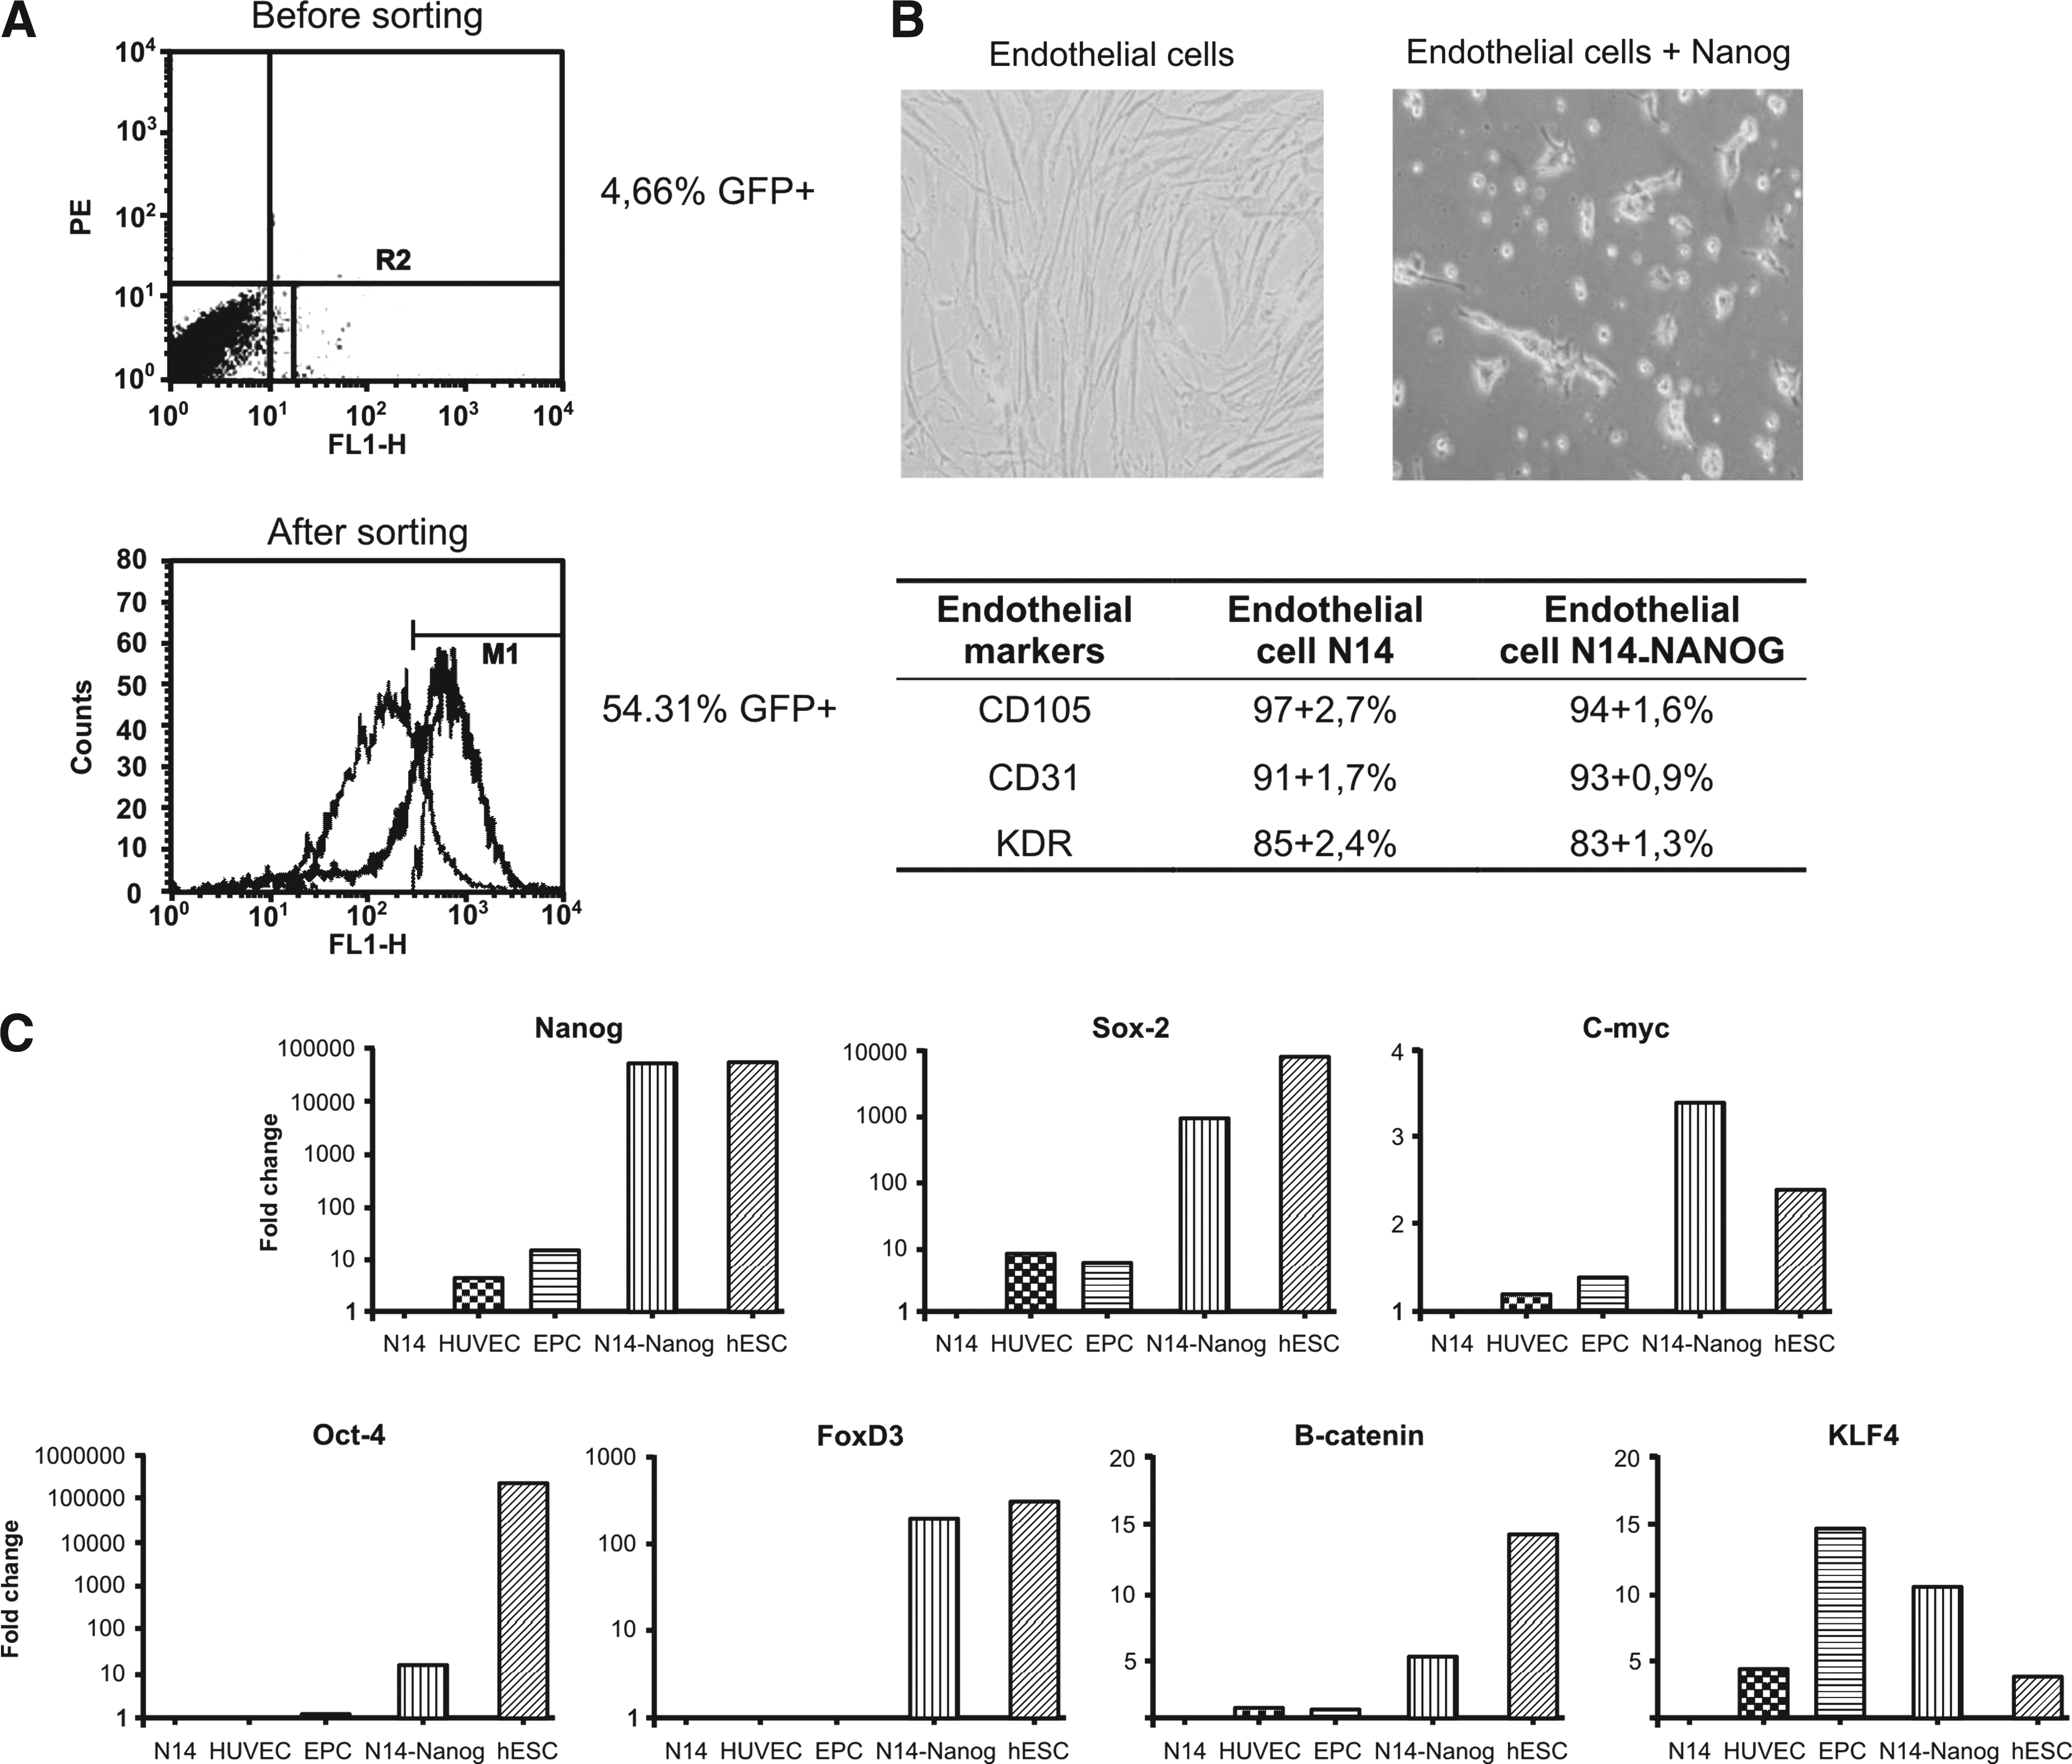
The introduction of one of those pluripotent transcription factors is insufficient to reprogram the genome; however, to study how the activation of the pluripotent network occurs, it is important to evaluate the expression of each transcription factor. Forced expression of Nanog in ECs was produced by using a third-generation lentiviral vector constructed in our laboratory. ECs at the third passage were incubated overnight with pLenti-cPPT-CIGWS-Nanog virus. Twenty-four hours after the transduction, 4.66% of positive cells were sorted by flow cytometry. After the selection, positivity increased to 54.31% (Fig. 1A).
(
Our transduction efficiency was low, even when we used high concentrations of viruses (10 viruses/cell). Primary ECs require an optimal cell density to grow in culture, and the selection of only positive cells would not allow optimal growth. The sorting was used as a form of enrichment of the positive population for the vector (GFP-positive) and not to produce a pure population. Even with a population showing 60% expression of GFP, we showed an effective expression of Nanog transgene (similar to the hESCs; see Fig. 1C).
This enriched population of positive cells was expanded, and the morphology had changed. The ECs had a fibroblast-shape morphology, and the transduced cells were relatively smaller (Fig. 1B). The growth rate of the transduced cells is much slower than the mature ECs. However, these Nanog-expressing cells maintained the expression on CD105, CD31, and KDR (Fig.1B).
The expression of some genes related to the pluripotency was analyzed in the mature ECs (N14), EPCs, HUVECs, and mature ECs transduced with the Nanog gene (N14-Nanog). hESCs were used as a positive control. The real-time PCR analyses showed that N14-Nanog cells express around 50,000-fold more Nanog than the nontransduced ECs, reaching a expression level similar to that of the hESCs. Interestingly, these cells have also increased the expression of other stemness genes, such as Sox2, FoxD3, Oct4, Klf4, c-Myc, and β-catenin, that are not normally expressed or are expressed at very low levels in ECs (Fig. 1C).
The ECs can be identified by a set of specific genes such as the VEGF receptors Flk-1, Flt1, and Flt4 and Nrp1 and Nrp2 (Bhatt et al., 2000). Arterial and venous ECs have a distinct molecular signature (Jain, 2003).
The arteriovenous (AV) characteristic of ECs is achieved early in their development by the expression of a set of specific genes. Venous endothelium is characterized specially by the expression of EphB4 (Bagley et al., 2003) and COUP-TFII (You et al., 2005), and arterial ECs express high levels of the surface proteins Notch 1 and Notch 4 (Villa et al., 2001), Dll-4 (Shutter et al., 2000), Eva 1, EphrinB1 and EphrinB2 (Bagley et al., 2003); metabolic enzymes such as alcohol dehydrogenase A1 and endothelial lipase (ALDH1A1); keratin 7 (Krt7) (Bulla et al., 2005); and the transcription factor Hey2 that is induced by Notch signaling (Shutter et al., 2000). We assessed the expression of the principal endothelial marker genes to determine if the genetic modification with the introduction of Nanog has also caused a change in the expression profile of normally expressed endothelial genes. We analyzed the endothelial genes to verify if Nanog, which caused morphological changes, also altered the expression of genes that are normally expressed by ECs (Fig. 2).
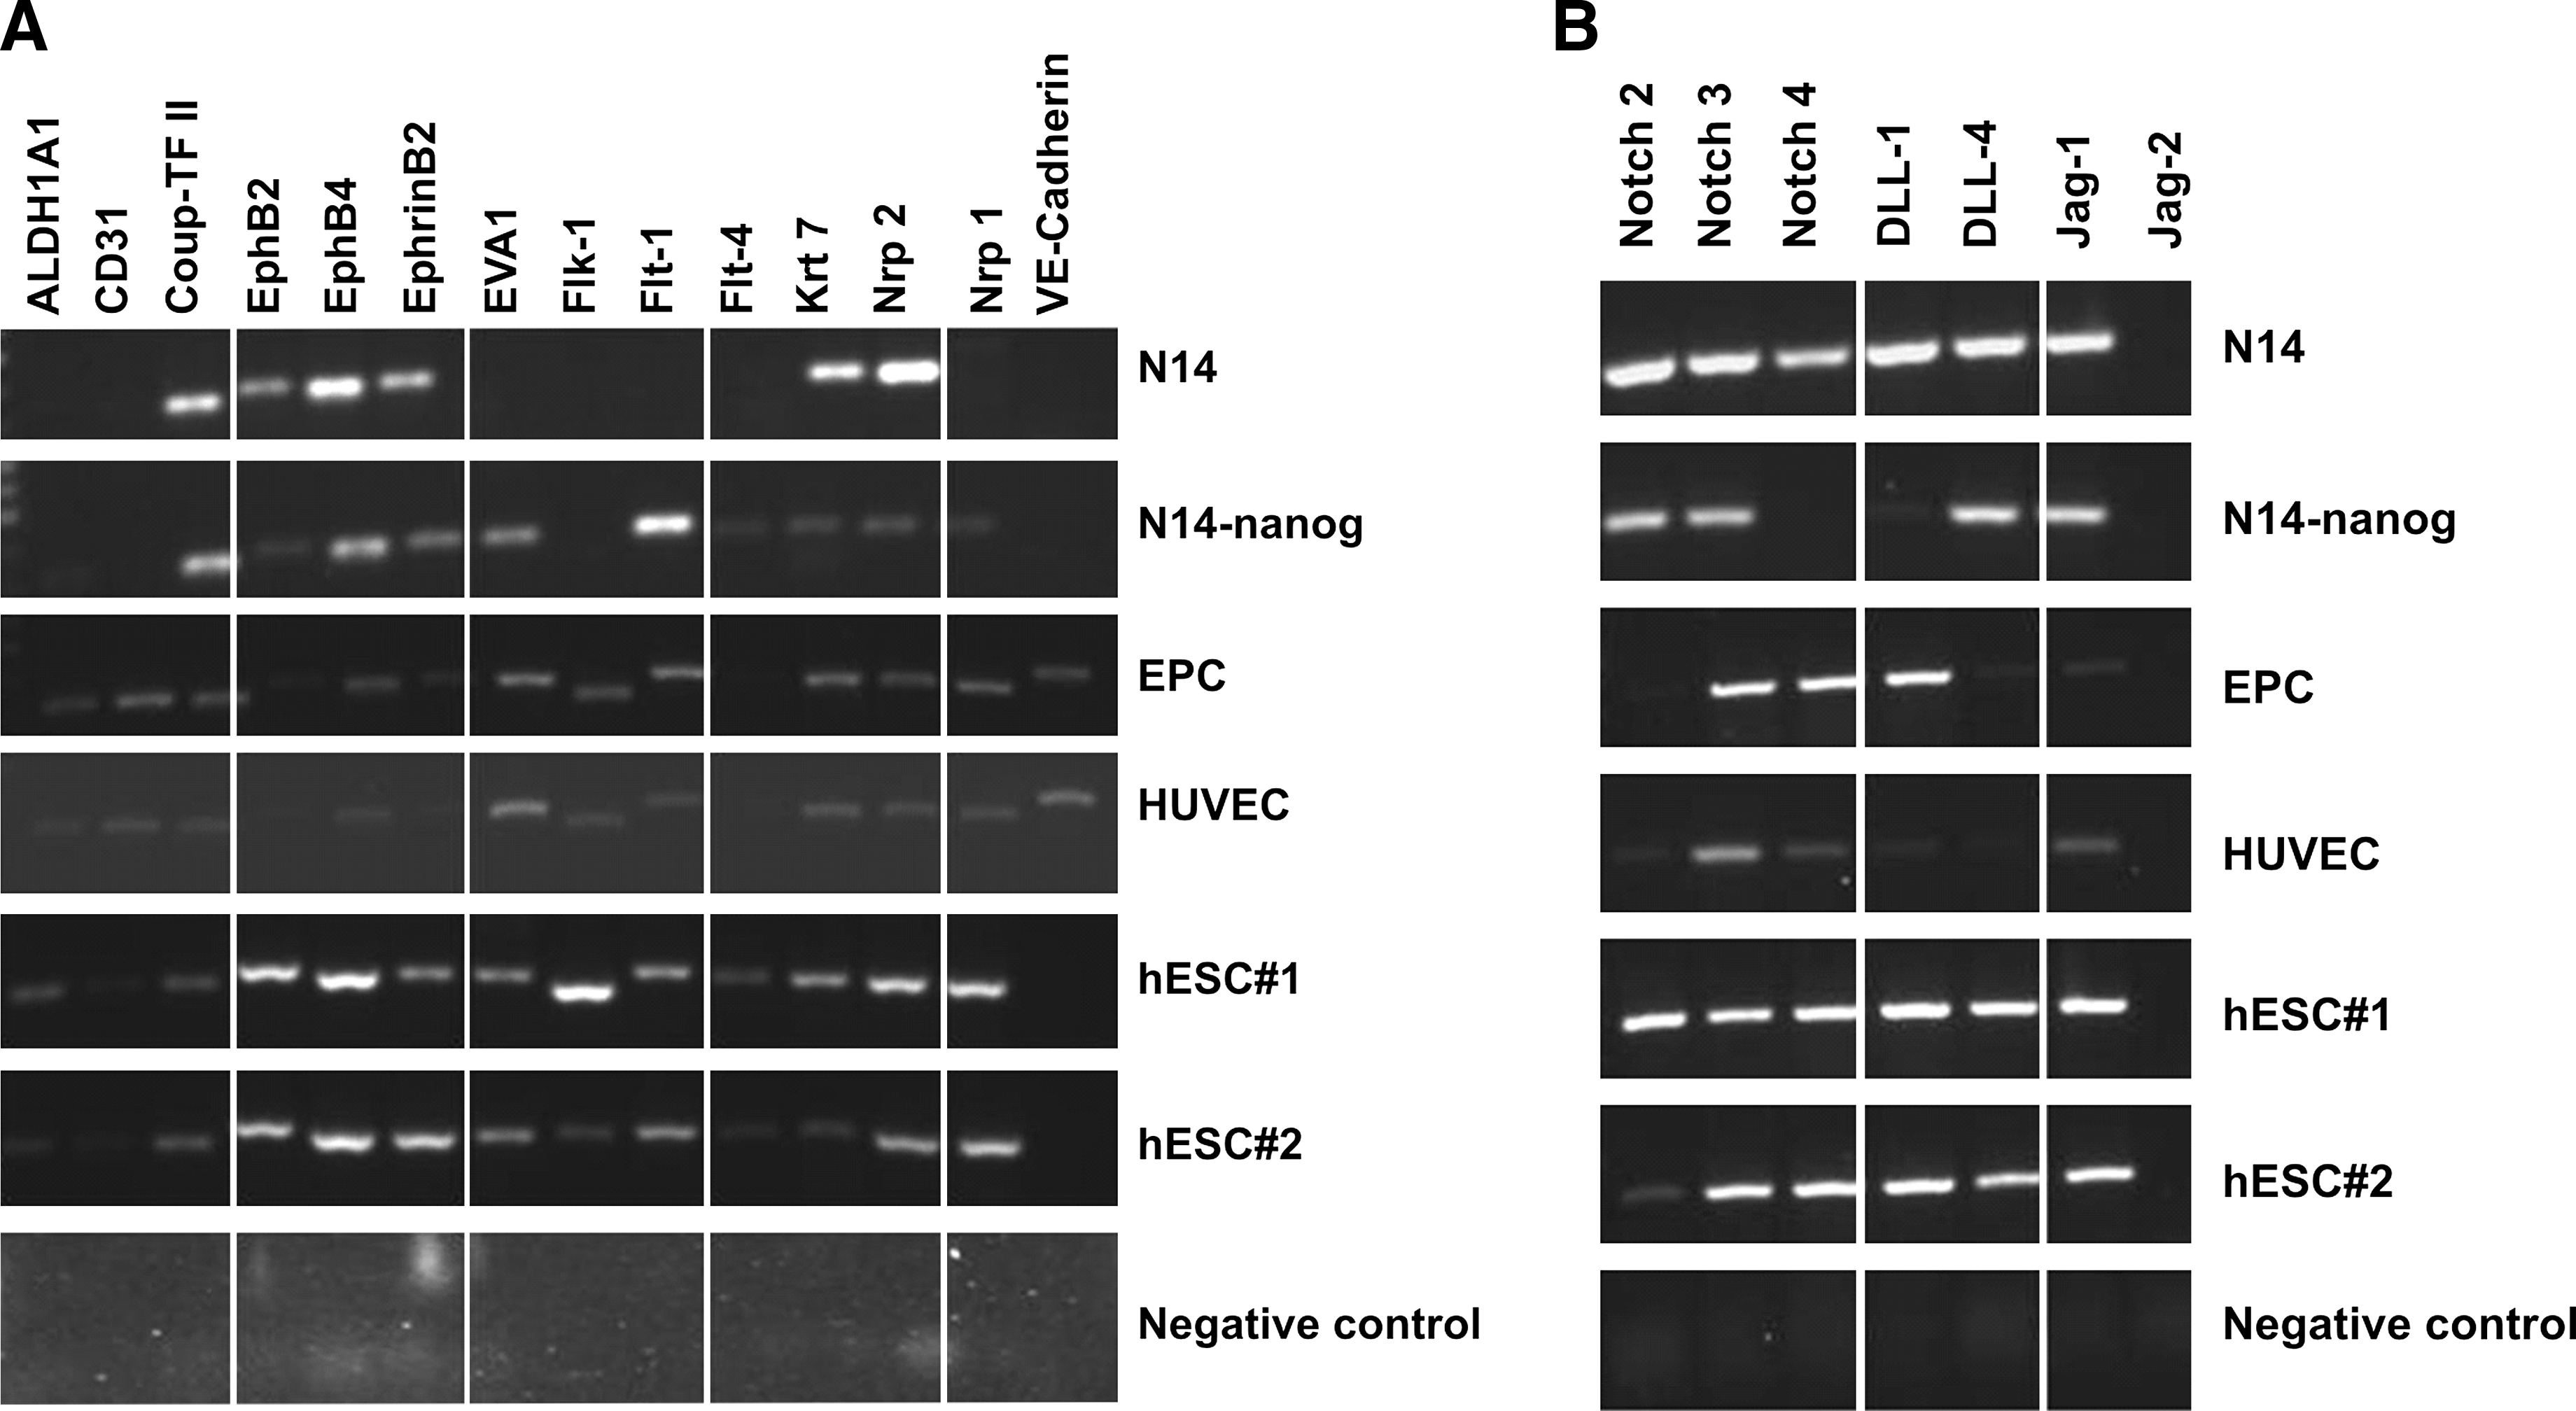
Panels of RT-PCR from different cell lines showing the expression profiles of genes normally present in endothelial cells. After introducing Nanog, some genes started to be expressed (EVA-1, FLT-1, FLT-4, and NRP-1 genes), whereas others have their expression diminished (NOTCH4 and DLL-1 genes).
EPCs express almost all of the endothelial-related genes, confirming their progenitor status. HUVEC cells present a similar expression profile to EPCs, and the mature ECs (N14) express only some of the endothelial markers (Fig. 2).
The genes EVA, Flt-1, and Flt-4 (the VEGF receptors) and Nrp-1 genes were not expressed in the unmodified ECs, but they started to be expressed after Nanog superexpression. Otherwise, the Notch4 and DLL1 genes were expressed in unmodified ECs and were silenced after the Nanog transduction (Fig. 2).
In this study, we sought to identify the impact of Nanog expression on ECs and to detect target genes that mediated its effects. We showed that overexpression of Nanog in ECs is enough to cause a significant increase in expression of the Sox2, Oct4, Klf4, β-catenin, c-Myc, and Foxd3 genes while their morphology is completed changed. Other studies in the literature also show that forced expression of Nanog in 3T3 cells and in T cells causes enhancement in cell growth as well as alterations in cell phenotype (Piestun et al., 2006; Tanaka et al., 2007; Zhang et al., 2005).
Our ECs express high levels of Nanog and grow slowly compared to nontransduced cells, indicating that Nanog has changed the cellular morphology and the ability of the cells to expand. However, work showing the ectopic expression of Nanog in human MSCs demonstrated enhanced cell proliferation and colony formation of MSCs in vitro (Liu et al., 2009). It may be that the genes that promote proliferation in ECs, especially in vitro, are not influenced by Nanog.
In conclusion, our findings show that forced expression of Nanog itself can activate the pluripotent network. The knowledge obtained by the overexpression of Nanog will help to elucidate the kinetics and mechanisms of reprogramming.
Footnotes
Author Disclosure Statement
The authors declare that no conflicting financial interests exist.