
Abstract
Abstract
The pig has been proposed as a relevant model for human obesity-induced inflammation, and cloning may improve the applicability of this model. We tested the assumptions that cloning would reduce interindividual variation in gene expression of innate immune factors and that their expression would remain unaffected by the cloning process. We investigated the expression of 40 innate immune factors by high-throughput quantitative real-time PCR in samples from liver, abdominal subcutaneous adipose tissue (SAT), visceral adipose tissue (VAT), and neck SAT in cloned pigs compared to normal outbred pigs.
The variation in gene expression was found to be similar for the two groups, and the expression of a small number of genes was significantly affected by cloning. In the VAT and abdominal SAT, six out of seven significantly differentially expressed genes were downregulated in the clones. In contrast, most differently expressed genes in both liver and neck SAT were upregulated (seven out of eight). Remarkably, acute phase proteins (APPs) dominated the upregulated genes in the liver, whereas APP expression was either unchanged or downregulated in abdominal SAT and VAT. The general conclusion from this work is that cloning leads to subtle changes in specific subsets of innate immune genes. Such changes, even if minor, may have phenotypic effects over time, e.g., in models of long-term inflammation related to obesity.
Introduction
Previous work has shown that the production and use of cloned pigs is not straightforward because side effects inherent in currently employed cloning procedures may affect the phenotype of cloned pigs (Tian et al., 2008). Cloning by somatic cell nuclear transfer (SCNT) in pigs remains a low-efficiency process with a small proportion of live clones and increased mortality perinatally (Park et al., 2005; Whitworth et al., 2009). The increased mortality has been attributed to a range of causes, including metabolic and cardiopulmonary abnormalities (Hill et al., 1999; Wells et al., 1999), lymphoid hypoplasia (Renard et al., 1999), and neonatal respiratory distress (Hill et al., 1999). Interestingly, increased susceptibility of such cloned animals to bacterial infections has also been described repeatedly (Carter et al., 2002; Keefer et al., 2001; Peura et al., 2003). Surviving cloned pigs are generally found to be healthy and production and reproduction properties in adult cloned pigs are generally normal; however, there are several reports of cloned pigs having deviant phenotypes. These include pulmonary hypertension and other hemodynamic disorders, contracted foreleg tendons, and respiratory problems (Whyte et al., 2011), changes in metabolic phenotype (Christensen et al., 2012; Clausen et al., 2011), and a higher incidence of mild atelectasis (Park et al., 2011). Lower body weight is a common finding in cloned pigs, both at birth and later (Archer et al., 2003; Jiang et al., 2007; Park et al., 2011; Tian et al., 2008), although it is not always observed (Carter et al., 2002). Furthermore, subtle gene expression abnormalities may be accommodated by apparently normal phenotypes, as demonstrated in mice (Humpherys et al., 2001), with unpredictable consequences for more complex phenotypic traits. Park and co-workers (Park et al., 2011) analyzing gene expression in 1-month-old cloned piglets found most differently expressed genes showing decreased expression. We extend these studies here by performing a detailed study on the effect of cloning on the expression of innate immune response genes in liver and three types of adipose tissue in the pig.
Only a few studies have reported on the regulation of specific innate factors in cloned pigs. Thus, cloning was shown to downregulate the response to lipopolysaccharide (LPS) of proinflammatory cytokines [tumor necrosis factor-α (TNF-α) and interleukin 6 (IL-6)] in serum (Carroll et al., 2005), whereas another paper described the adaptive immune system of cloned pigs as being apparently not affected by the cloning process (Carter et al., 2002). Looking at baseline levels of as well as response to vaccination of several humoral and cellular adaptive immune parameters, Chavatte-Palmer and co-workers (2009) also found cloned heifers to be indistinguishable from control heifers.
There is increasing evidence that low-grade systemic inflammation is associated with obesity, linking obesity with the development of disease states related to inflammation, including atherosclerosis, type 2 diabetes, and cardiovascular disease (Bastard et al., 2006; Federico et al., 2010; Gil et al., 2007). Obesity leads to chronic activation of the innate immune system, resulting in a low-grade inflammation of the white adipose tissue. Important players of the innate immune system include cytokines, chemokines, and acute-phase proteins. Several of the proteins involved in innate and inflammatory responses have been found to be produced in adipose tissue, such as C-reactive protein (CRP), IL-6, and TNF-α (for review, see Fain, 2010; Fantuzzi, 2005), pointing to adipose tissue as being directly involved in maintaining or propagating low-grade inflammation as seen in obesity. Depot-specific differences in the gene expression profiles of adipose tissue [e.g., visceral adipose tissue (VAT) as opposed to subcutaneous adipose tissue (SAT)] have been demonstrated in diabetic human subjects (Samaras et al., 2010) and in apparently healthy obese women (Alvehus et al., 2010). Furthermore, nonabdominal SAT has been found to be less metabolically active and to even offer protection against lipotoxicity and fat deposition (for review, see Wronska and Kmiec, 2012).
Therefore, we investigated the effect of cloning on expression of a range of key genes involved in innate immune reactions and/or inflammation in different types of relevant tissues in pigs cloned by the SCNT procedure focusing on the baseline expression at 9 months of age. To our knowledge, this is the first study on cloned pigs investigating innate immune response-related genes with relevance for obesity research in two types of adipose tissue from the abdominal region in addition to liver and neck SAT. In addition to demonstrating the feasibility of high-throughput quantitative PCR (qPCR) for analysis of expression of a large number of genes in different types of tissue, the results show that subtle changes occur in cloned animals as compared to noncloned animals in specific subsets of innate immune response genes in a tissue type–specific manner, serving as a reminder of some of the challenges inherent in using cloned model animals for biological and biomedical studies.
Materials and Methods
Animals, diets, and sampling
All experimental procedures involving animals were approved by the Danish Animal Experimental Committee. Cloning was performed at Aarhus University (Tjele, Denmark) using SCNT as described in Kragh et al. (2004). Donor cells were from cultured ear fibroblasts obtained from a Danish Landrace×Yorkshire (65%:35%) sow. The cloned embryos were surgically transferred to surrogate sows 5–6 days after cloning as described in Schmidt et al. (2010). Normal litters were used as controls (75% Danish Landrace:25% Yorkshire). They were obtained after standard artificial insemination. Cloned (n=8) and control (n=9) piglets were delivered normally. All pigs were reared in the same experimental stables of Aarhus University (Tjele, Denmark). All pigs were female.
Pigs were nursed by surrogate sows and weaned after 28 days. They were kept on a standard diet for an additional 2 months, after which they were individually housed and fed a high-energy diet (containing 10% sugar and 10% soy oil) restricted at 1.5 kg/day. At the time of slaughter, the average weight of the clones was 127.1±5.9 kg and 119.1±3.2 kg for the controls.
Pigs were killed at 9 months of age with a bolt pistol after overnight fasting. The animals were desangiunated, after which tissue samples from liver, abdominal fat (a combination of deep and superficial SAT), mesenteric fat surrounding the appendix (VAT), and subcutaneous fat from the neck (neck SAT) were obtained and snap frozen in liquid nitrogen. Blood was collected for serum preparation; it was allowed to clot at room temperature for 1 h, centrifuged at 3000 rpm for 10 min at 4°C, and then frozen. Tissue and serum samples were kept at −80°C until analysis.
Extraction of RNA
For RNA extracted from liver tissue the following method was used: Total RNA from ≈100 mg of liver tissue was isolated by a RNeasy Lipid tissue Midi kit (Qiagen, #75842) according to manufacturer's protocol. Samples were homogenized on a gentleMACS Dissociator (Miltenyi Biotec, Germany) in gentleMACS M tubes (Miltenyi Biotec, #130-093-458) and treated with on-column RNase-free DNase digestion (Qiagen, #79254).
A modified procedure was used for extraction of RNA from the VAT, abdominal SAT, and neck SAT. Total RNA from ≈1 g of fatty tissue was homogenized with QIAzol Lysis Reagent (1 mL of Lysis Reagent per 100 mg of tissue) in gentleMACS M tubes on the gentleMACS Dissociator. The tube with homogenate was left at room temperature for 5 min after which 2 mL of chloroform (Merck, #1.02445) was added. After shaking vigorously for 15 sec, the tube was left at room temperature for 2–3 min. The tube was then centrifuged at 4500 rpm for 20 min at 4°C. From the upper, aqueous phase 2.2 mL were carefully transferred to a new tube (Corning, NY, USA, #430828) and 1.4 mL of isopropanol (2-propanol, Merck, #1.09634) was added. The tube was placed at room temperature for 5 min and was then centrifuged at 4500 rpm for 10 min at 4°C. The supernatant was carefully aspirated and discarded. The pellet was washed 3 times in 10 mL of cold 75% ethanol (EtOH) and was centrifuged at 3300 rpm for 5 min at 4°C after each wash. The supernatant was removed completely and the pellet was left to air dry. Afterward, 50–100 μL of RNase-free water was added, and the tube was vortexed after 10 min at room temperature.
For both methods of RNA extraction, the RNA yield was measured on a NanoDrop spectrophotometer (ND-1000, NanoDrop Technologies Inc., USA).
RNA integrity
For the assessment of RNA integrity, the Agilent 2100 Bioanalyzer (Agilent Technologies, CA, USA) was used. The RNA integrity number (RIN) was determined using the Agilent RNA 6000 Nano Kit (Agilent Technologies, #5067-1511) according to the manufacturer's protocol. In the liver, all samples had a RIN of above 8, whereas all samples in the fatty tissues had a RIN of above 6, with the exception of VAT from one pig, which had a RIN of 5.1.
cDNA synthesis and preamplification
Two cDNA replicates were prepared from each sample of extracted RNA. Then 500 ng of total RNA was reverse transcribed using the QuantiTECT Reverse Transcription kit (Qiagen, #205311), containing a mix of random primers and oligo(dT), according to the manufacturer's instructions. cDNA was diluted 1:6 in low ethylenediaminetetraacetic acid (EDTA) Tris-EDTA (TE) buffer (VWR–Bie & Berntsen, Herlev) prior to preamplification. Preamplification was performed using TaqMan PreAmp Master Mix (Applied Biosystems, #PN 4391128). Stocks of 200 nM primer mix were prepared combining equal concentration of all primers used in the present study (see Table 1). TaqMan PreAmp Master Mix (5 μL) was mixed with 2.5 μL of 200 nM stock primer mix and 2.5 μL of diluted cDNA, and incubated at 95°C for 10 min followed by 16 cycles of 95°C for 15 sec and 60°C for 4 min. Preamplified cDNA was diluted at least 1:4 in low EDTA TE buffer before qPCR.
F, forward; R, reverse.
Primer design and validation
Primers were designed using Primer3 (http://frodo.wi.mit.edu/) as described previously (Skovgaard et al., 2009) and synthesized at TAG Copenhagen (Copenhagen, Denmark). Primer sequences and amplicon lengths are shown in Table 1. Primer amplification efficiencies and dynamic range were acquired from three individual standard curves constructed from dilution series of highly responding samples. To ensure primer specificity, melting curves were inspected for all primer assays, and agarose gel electrophoresis and sequencing were performed for selected primer assays.
Quantitative real-time PCR
qPCR was performed in 48.48 Dynamic Array Integrated Fluidic Circuits (Fluidigm, CA, USA), combining 48 samples with 48 primer sets for 2304 simultaneous qPCR reactions. The reaction mix was prepared using the following components for each of the 48 sample reactions: 3 μL of ABI TaqMan Gene Expression Master Mix (Applied Biosystems), 0.3 μL of 20×DNA Binding Dye Sample Loading Reagent (Fluidigm), 0.3 μL of 20×EvaGreen (Biotium, VWR–Bie & Berntsen), and 0.9 μL of low EDTA TE buffer. Reaction mix (4.5 μL) was mixed with 1.5 μL of preamplified cDNA, diluted at least 1:4 in low EDTA TE buffer. Specific primer mixes for each of the 48 primer sets were then prepared using 2.3 μL of 20 μM primer (forward and reverse), 2.5 μL of 2×Assay Loading Reagent (Fluidigm), and 0.2 μL of low EDTA TE buffer. Reaction mix, including cDNA (5 μL) and primer mix (5 μL), was dispensed into appropriate inlets and loaded into the integrated fluidic circuit of the Dynamic Array in the IFC Controller (Fluidigm). After loading and mixing of each sample–primer reaction in individual chambers, the Dynamic Array was placed in the BioMark real-time PCR instrument (Fluidigm) and the following cycle parameters were used: 2 min at 50°C, 10 min at 95°C, followed by 35 cycles with denaturing for 15 sec at 95°C and annealing/elongation for 1 min at 60°C. Melting curves were generated after each run to confirm a single PCR product (from 60°C to 95°C, increasing 1°C/3 sec). Nontemplate controls (NTC) were included to indicate potential problems with nonspecific amplification or sample contaminations. Expression data were acquired using the Fluidigm Real-Time PCR Analysis software 3.0.2 (Fluidigm) and exported to GenEx5 (MultiD, Göteborg, Sweden).
Data analysis and statistics
Data preprocessing, normalization, relative quantification, and statistics were performed using GenEx5. Data were corrected for PCR efficiency for each primer assay individually. The most stably expressed reference genes [for liver, hypoxanthine phosphoribosyl transferase 1 (HPRT1) and glyceraldehyde-3-phosphate dehydrogenase (GAPDH), and for adipose tissues, HPRT1 and β-2-microglobulin (B2M)] were identified from a panel of five putative reference genes using GeNorm (Vandesompele et al., 2002), and the geometric means of the most stably expressed genes were used to normalize all samples in GenEx5. Most stably expressed reference genes were determined for each tissue type individually as well as for the combined dataset. To visualize differential gene expression, relative expression for all samples was calculated relative to the least expressed samples for each primer assay. Data were log2 transformed to attain a normal distribution prior to t-test, F-test, and analysis of variance (ANOVA). Gene expression changes were considered to be significant if the p value was equal to or less than 0.05 and a fold change of±1.5 was arbitrarily defined as the cutoff for biologically significant changes. Data are expressed as the mean±standard error of the mean (SEM).
Quantitative serum enzyme-linked immunosorbent assay
Serum concentration of CRP was analyzed by a sandwich- type enzyme-linked immunosorbent assay (ELISA) using dendrimer-coupled cytidine diphosphocholine (a CRP-binding ligand) in the coating layer, as described in Heegaard et al. (2009), employing polyclonal rabbit anti-human antibodies with cross-reactivity toward porcine CRP followed by peroxidase-conjugated goat anti-rabbit antibody for detection (both antibodies from DAKO, Glostrup, Denmark). The cross-reactivity of the anti-human CRP antibody with pig CRP was demonstrated previously (Heegaard et al., 1998), and, in combination with catching of CRP by diphosphocholine, specificity is ensured for CRP. Pooled pig serum calibrated against a human CRP calibrator (DAKO A0073) was used as standard. The detection limit was 0.067 μg/mL (human equivalents).
Serum concentration of haptoglobin (HP) was determined by a sandwich ELISA using an in-house mouse anti-porcine HP monoclonal antibody in the coating layer and biotinylated commercial rabbit anti-human HP (DAKO P397) as the detection antibody, as described previously (Sorensen et al., 2006), with a lower limit of quantification of 1.4 μg/mL.
Orosomucoid (ORM) was analyzed by a competitive catching ELISA in which a mouse monoclonal antibody specific for ORM [1.62, prepared in-house (Heegaard et al., in preparation)], was used as the catching antibody in the coating layer. This was followed by simultaneous incubation with sample and biotinylated ORM (50 μL of each in the same well). Pooled pig serum calibrated against an ORM calibrator (Saikin Kagaku Institute Co. Ltd., Japan) was used as a standard. The detection limit of the assay was 50 μg/mL).
Commercially available sandwich ELISAs were used to determine serum IL-6 (Porcine IL-6 Duoset kit, R&D Systems, inc. #DY686), serum TNF-α (Swine TNF-α CytoSet™, Invitrogen, CA, USA, #CSC1753 with Antibody Pair Buffer Kit, Invitrogen, CA, USA, #CNB0011), and serum amyloid A (SAA; Phase SAA assay, Tridelta Development Ltd., Kildare, Ireland, #TP 802). Samples were tested according to manufacturer's instructions. The lower limits of quantification were defined as 62 pg/mL for the IL-6 assay, 126 pg/mL for the TNF-α assay, and 6.25 μg/mL for the SAA assay.
The plates were developed using an orthophenylenediamine peroxide procedure (TMB-PLUS, Kem-En-Tec, #4390A) according to the manufacturer's instructions. The optical densities of wells were read at 450 nm, and unspecific coloration was subtracted at 650 nm (550 nm for IL-6 ELISA assay) using an automatic plate reader (Thermo Multiskan Ex spectrophotometer, Thermo Scientific, Waltham, MA, USA). All samples including standard were analyzed in duplicates. For all assays, an intraassay coefficient of variation of <15% was accepted. Sample values were calculated from the curve fitted to the readings of the standard (using Ascent software v. 2.6, Thermo Scientific). Significance was tested using a two-tailed unpaired t-test, and variance was tested with an F-test. Changes in concentrations were considered to be significant if the p value was equal to or less than 0.05. Data from HP, CRP, and ORM ELISAs were evaluated with the Grubbs outlier test (Grubbs, 1969), and outliers were removed from dataset. Data are expressed as the mean±SEM.
Results
Pigs
There was no significant difference between the body weights of cloned and control pigs (p=0.24). Additional metabolic data for these pigs is published elsewhere (Christensen et al., 2012).
Gene expression
The expression of 43 genes related to innate immunity, as well as five reference genes, was investigated. The following genes were removed due to low efficiencies; mucin (MUC1), defensin beta 1 (DEFB1), IL12A (all tissues), and surfactant protein A1 (SFTPA1) (all adipose tissues). Additional genes were removed in the quality validation of the technical replicates (cDNA), if the standard deviation was above 15%; in the liver, IL8(a) and IL6 were removed and in the adipose tissues, fibrinogen (FIB), interferon gamma (IFNG), LPS binding protein (LBP), IL-1 receptor antagonist (IL1RN), ORM1, and IL10(b) were removed. FIB and ORM1 were measurable in the liver but was over detection limit in the adipose tissues.
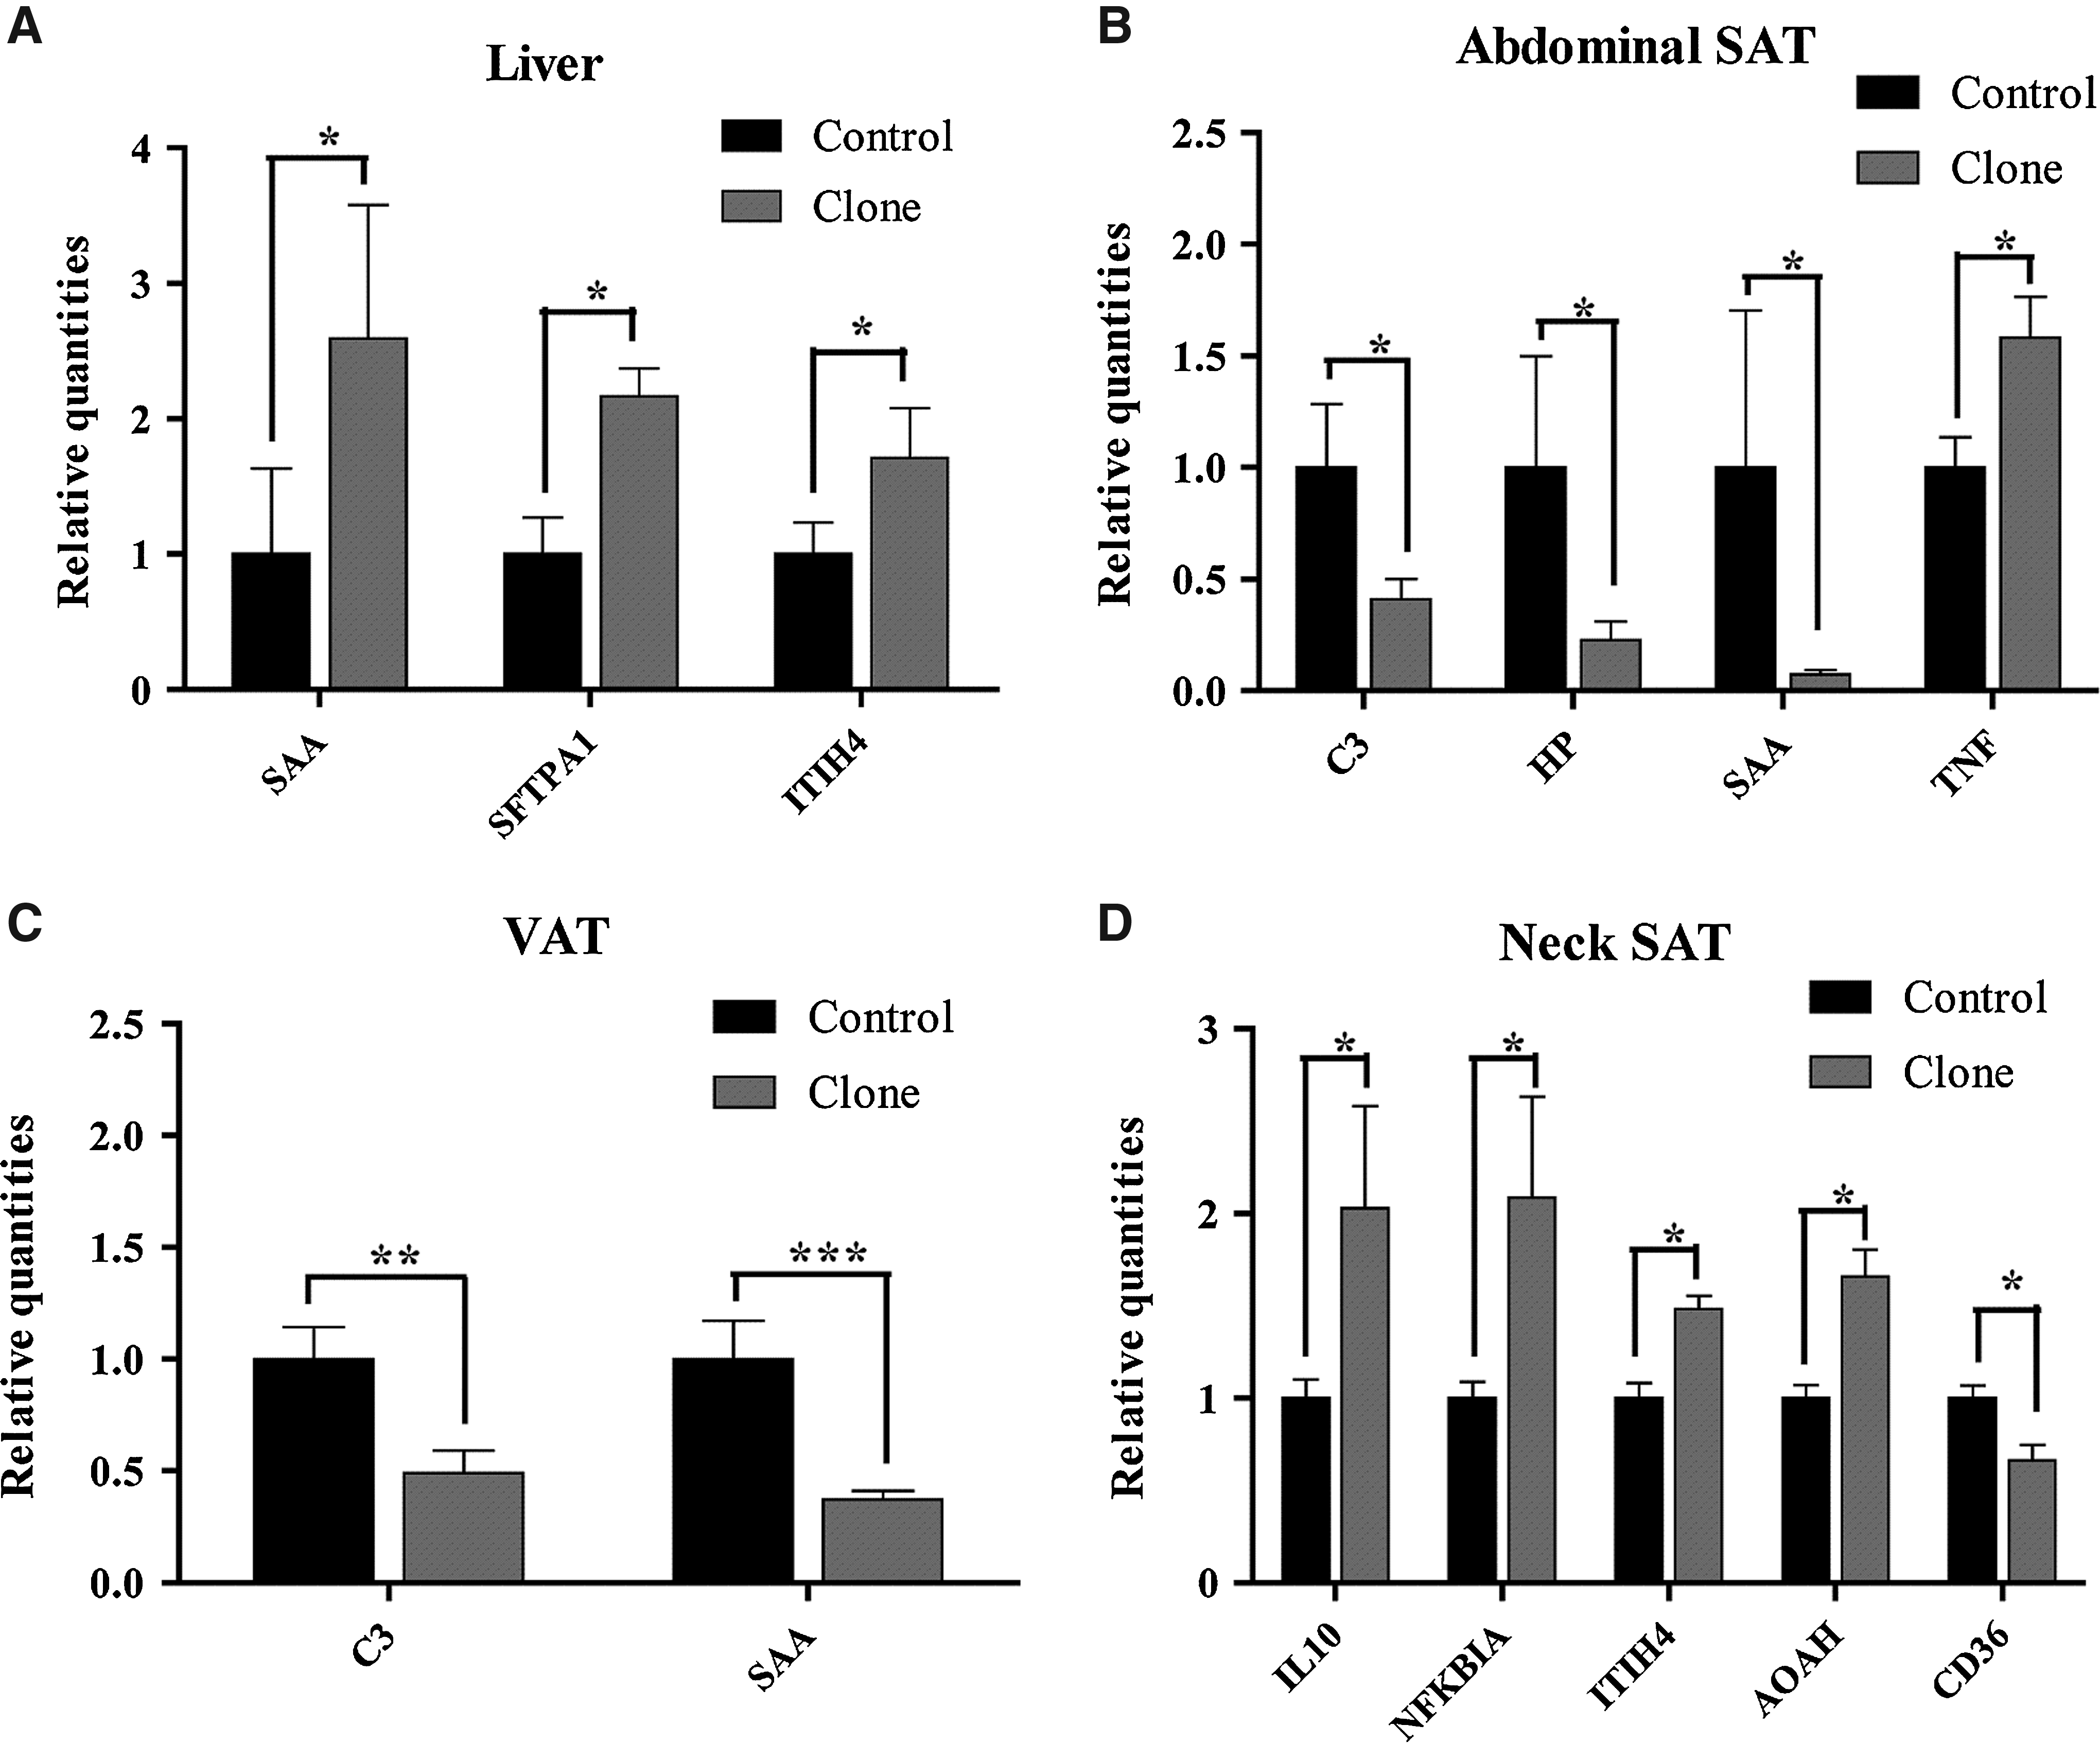
Out of the remaining 40 genes, the ones showing statistically significant differences and a fold change of at least ±1.5 in the gene expression are shown in Figure 1. Expression levels for genes were normalized relative to control pigs (set to 1). Table 2 lists a complete overview of the relative gene expression in cloned compared to control pigs.
Significantly differently expressed genes in cloned as compared to control pigs (=1) with a fold change of ±1.5 in liver (
Relative innate immune gene expression in liver, abdominal SAT, VAT, and neck SAT in cloned pigs relative to control pigs (=1) as analyzed by qPCR±SEM.
SAT, subcutaneous adipose tissue; VAT, visceral adipose tissue; ODL, over detection limit; NQ, not quantifiable; qPCR, quantitative PCR; SEM, standard error of the mean.
Gene expression patterns compared between control and cloned pig groups revealed minor changes in all four tissues in the expression of a few of the genes in the cloned pigs (Fig. 1).
In both of the two adipose tissues from the abdominal region [abdominal SAT (Fig. 1B) and VAT (Fig. 1C)], a general tendency for downregulation of genes in the cloned pigs was observed (Table 2). In the abdominal SAT, cloned pigs showed downregulated expression of the acute-phase proteins (APPs) HP and SAA as well as complement component 3 (C3). In contrast, the general trend for the differently expressed genes in cloned pigs both in the liver (Fig. 1A) and nonabdominal adipose tissue (neck SAT) (Fig. 1D) was to be upregulated; seven out of eight significantly differently expressed genes being upregulated in these two tissues.
In the liver (Fig. 1A), three out of the 40 genes investigated were upregulated significantly in the cloned pigs, but no genes were significantly downregulated in the cloned pigs compared to controls. Thus, the liver, representing a nonadipose, systemic organ, shows a quite stable phenotype, the only exception being upregulated expression of some APPs and the surfactant protein SFTPA1, a collectin involved in defense against bacteria, in the clones. Interestingly, this was not accompanied by increases in the expression of the proinflammatory cytokines included in the analysis; IL-1β (IL1B), TNF-α (TNF), IL8, and IL6 (not quantifiable in the liver); however, in the abdominal SAT (Fig. 1B) of clones TNF was indeed significantly upregulated, and IL1B and IL6 were borderline significantly upregulated, with more than a 1.5-fold increase compared to the level of control pigs (Table 2).
Cloning appeared to affect gene expression in VAT (Fig. 1C) in much the same way as in abdominal SAT, with SAA and C3 being significantly downregulated and HP being borderline significantly downregulated with a five-fold decrease compared to the level of the control pigs (Table 2). In contrast to abdominal SAT, in VAT none of the proinflammatory cytokines was observed to be affected by cloning.
In the neck SAT (Fig. 1D), cloning affected gene expression very differently than the two other adipose tissues in that four out of the five significantly differentially expressed genes were upregulated; IL10, inter-α-trypsin inhibitor heavy-chain family, member 4 (ITIH4), acyloxyacyl hydrolase (AOAH), and nuclear factor of κ light polypeptide gene enhancer in B cells inhibitor α (NFKBIA), whereas only one was downregulated, namely CD36. Furthermore, none of the genes that showed significant expression differences in the adipose tissues from the abdominal region (VAT and abdominal SAT) were significantly regulated in the neck SAT.
Thus, the general trend for the effect of cloning on gene expression was similar for neck SAT and liver in that the affected genes were generally upregulated in the clones. This is strikingly different in VAT and abdominal SAT, both of which reacted quite similarly to cloning with downregulation of gene expression, with the notable exception of the proinflammatory cytokine TNF, which was upregulated in abdominal SAT but not VAT of cloned pigs.
These results indicate subtle but distinct and tissue-specific gene expression changes in four different tissues upon cloning. Among the innate immune response genes selected for study here, it was remarkable that APPs were among the upregulated genes in liver tissue, whereas cytokine expression was not affected in this organ. In contrast, APP expression was either unchanged or downregulated in abdominal SAT and VAT.
To investigate whether cloning results in less interindividual variation, we used the F-test for equal variances of all genes in cloned and control pigs. The variance of the two groups was found to be equal (p=0.08 for liver, p=0.66 for abdominal SAT, p=0.89 for VAT, and p=0.65 for neck SAT).
Protein concentrations in serum
To analyze if the altered hepatic expression of APPs and cytokine genes could be detected as changes in circulating concentration of the corresponding proteins, the serum concentrations of IL-6, CRP, HP, ORM, SAA, and TNF-α were determined by ELISA (Fig. 2). After removal of possible outlier data points (one for HP and ORM, and two for CRP), no significant differences were found between the cloned and control groups for any of these proteins, although there was a slight (not significant) tendency for HP to be increased and for ORM to be decreased in the cloned group. The variance of the two groups was found to be equal for HP (p=0.62) and CRP (p=0.71); however, there was a significant difference between the two groups for ORM (p=0.0002).
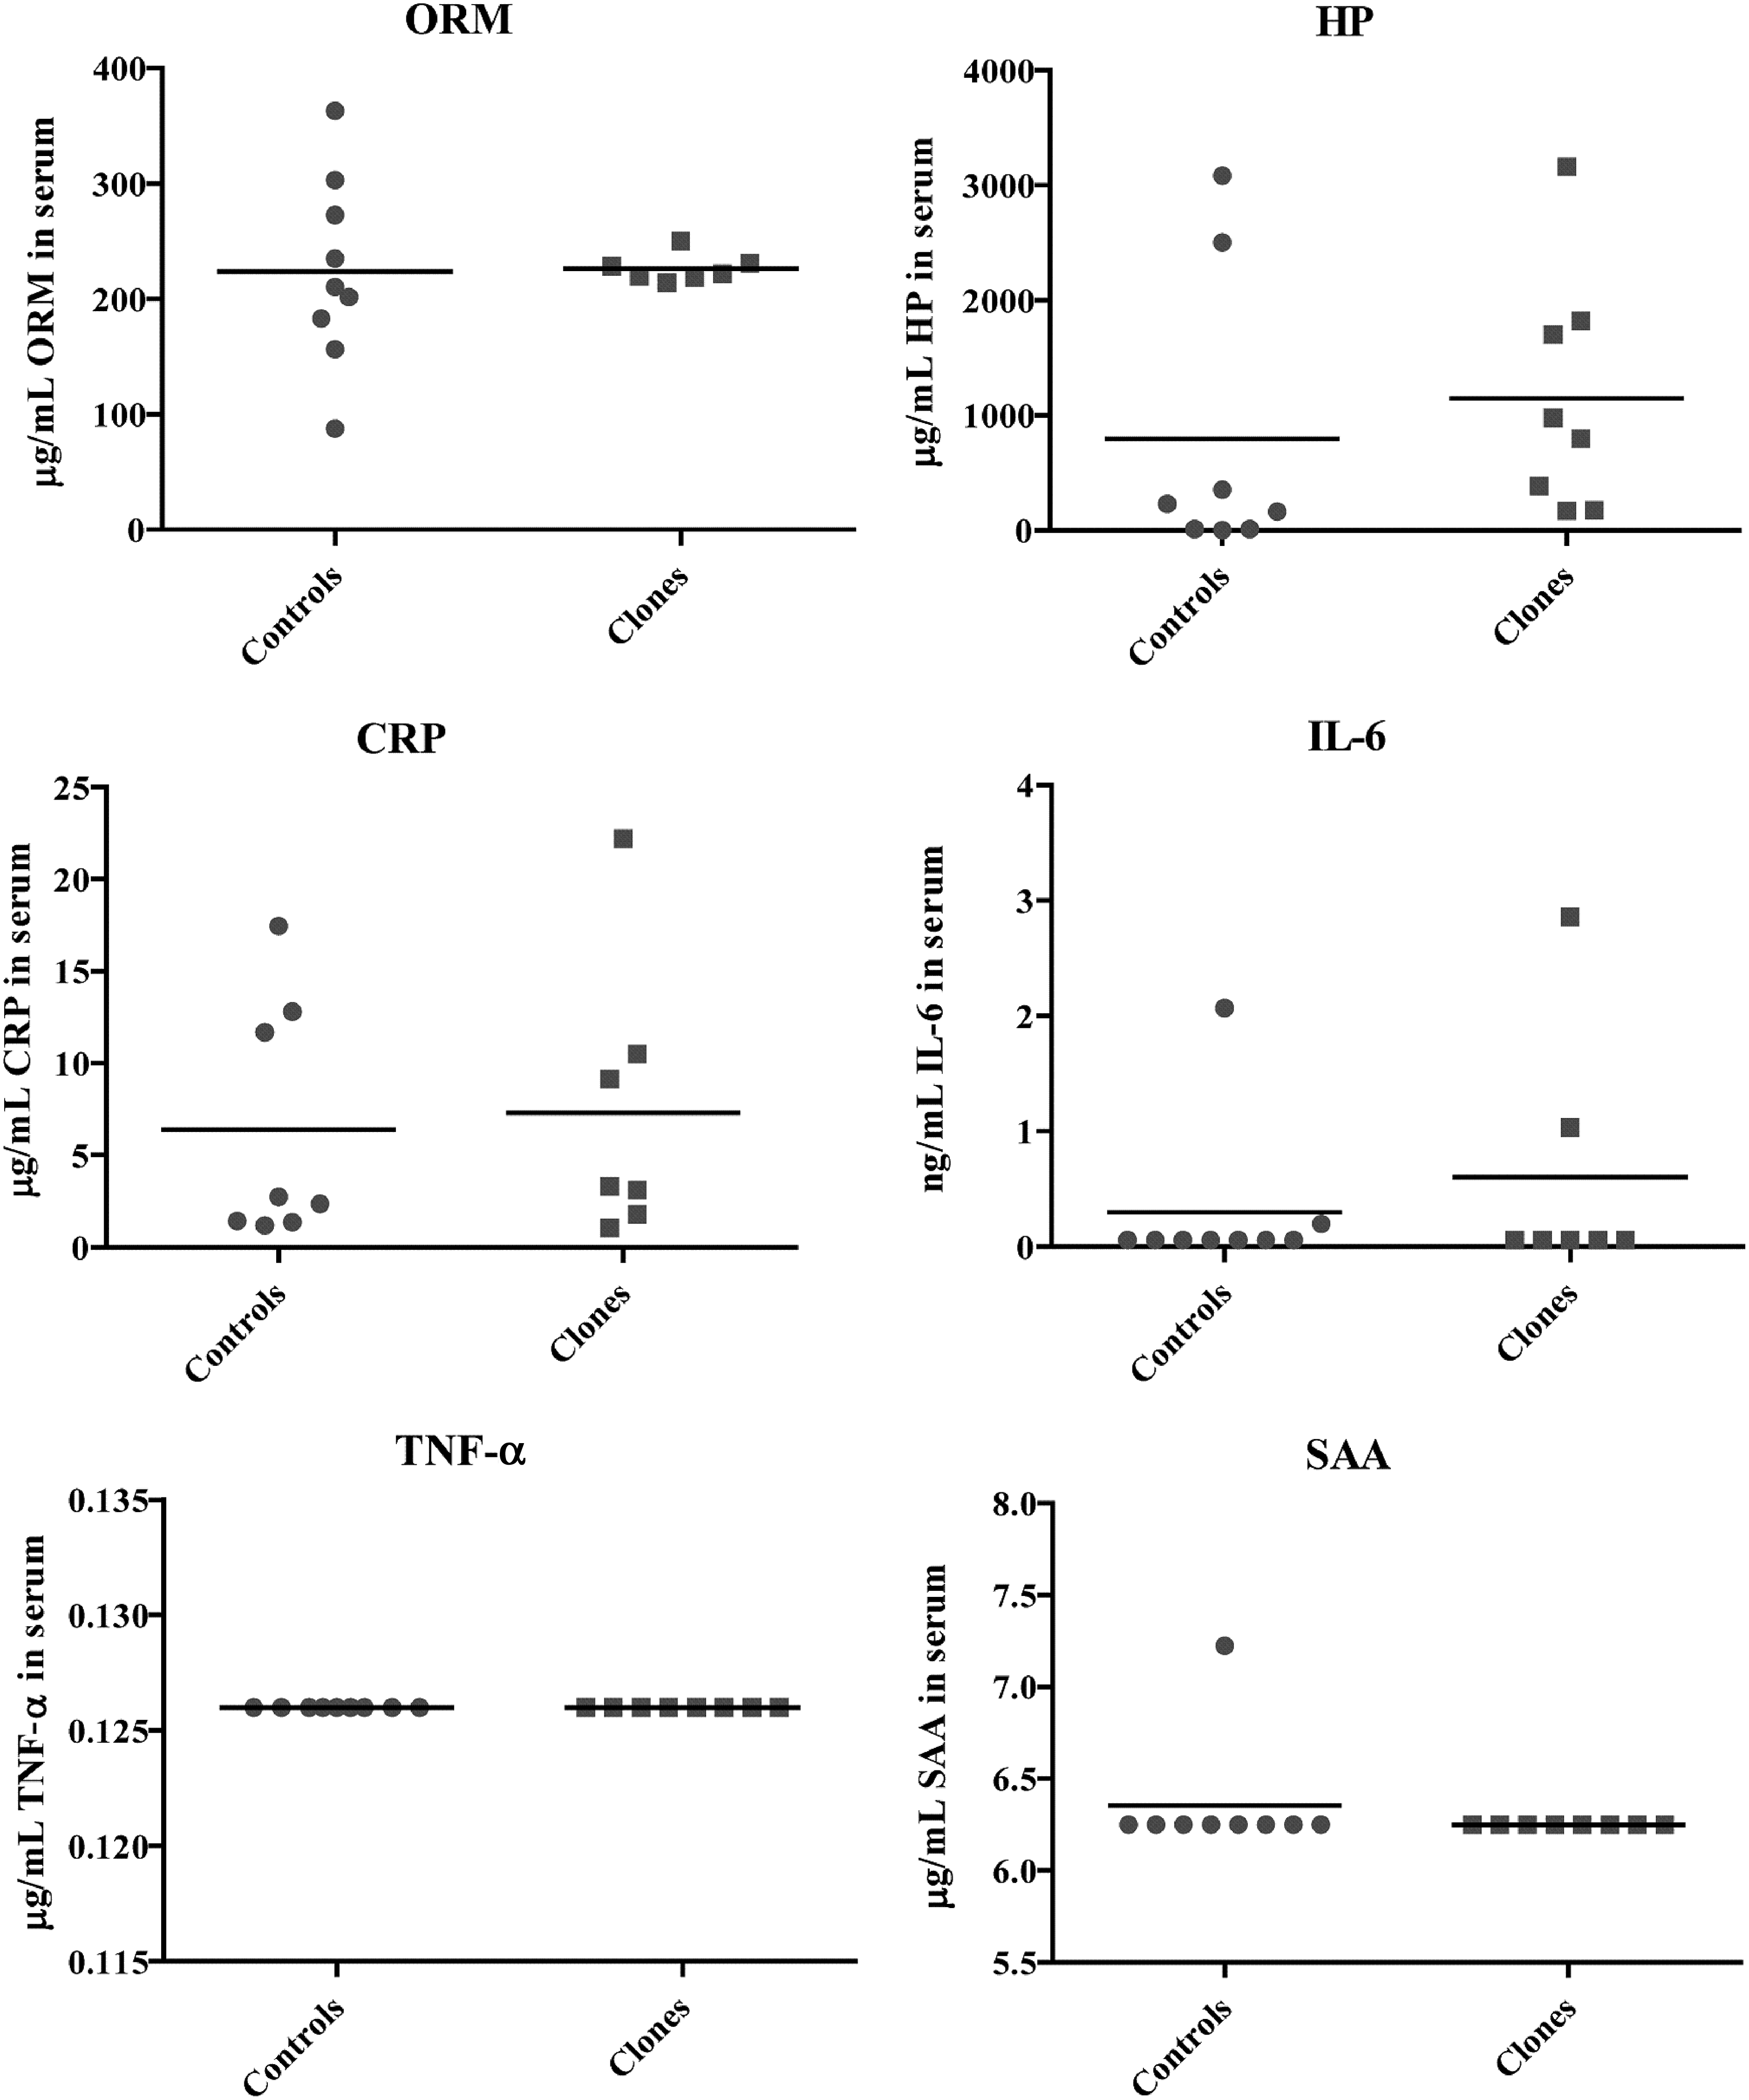
Scatter plot of serum concentrations of ORM, HP, CRP, IL-6, TNF-α, and SAA measured with ELISA in controls (n=8, for ORM n=9) and clones (n=7, for HP n=8). Line indicates mean.
Discussion
Based on optimized RNA extraction methods and employing strict procedures for quality control and validation, we used a chip-based, high-throughput qPCR to obtain accurate measures of the relative expression of innate immune system–related genes in three types of adipose tissue as well as in liver tissue in cloned pigs (n=8) compared to normal control pigs (n=9).
In accordance with other studies reporting on interindividual variability in pigs cloned by SCNT (Clausen et al., 2011; Hwang et al., 2009; Park et al., 2011; Whyte et al., 2011), we were not able to show significant differences between clones and controls in the interindividual variability in expression of 40 immune system–related genes in the four different tissues. The variability of serum concentrations of two of three serum proteins investigated was also similar in clones and controls, whereas the last serum protein (ORM) was significantly less variable in cloned pigs.
Furthermore, we found subtle changes in the mRNA expression of several innate immune response genes in liver and three types of adipose tissue in the clones compared to the normal outbred pigs. It is assumed that the minimal genetic difference between clones and controls (65% Danish Landrace:35% Yorkshire in clones vs. 75%:25% in controls) is of minor importance.
Expression of innate immune response genes in the liver was largely unaffected by cloning, with the notable exception of genes for APPs, two of which were significantly upregulated to more than 150% of the normal control group, namely SAA and ITIH4. Borderline upregulated genes in the liver were also mostly APPs (CRP, HP, and LBP), but also included the proinflammatory cytokine TNF and the antiinflammatory cytokine IL10. However, other proinflammatory mediators like IL1B and IL8 were not affected.
Thus, hepatic APP gene expression might have been directly and selectively affected by the cloning process. Alternatively, the small-scale induction of APP genes seen here may represent a normal physiological response, induced by proinflammatory cytokines not originating from the liver, because the expression of APPs in the liver is affected by disturbance of tissues wherever it may occur (Skovgaard et al., 2009). It is possible that these extrahepatic cytokines could be delivered from the VAT and omental fat via the portal vein as these adipose tissues are drained by the portal circulation. Fontana and co-workers (2007) have found that these tissues affect the liver via endocrine actions in abdominal obesity.
However, TNF was the only proinflammatory cytokine that showed a significantly different expression in the clones in either abdominal SAT and/or VAT; TNF was upregulated in the abdominal SAT (see below). TNF-α from visceral adipose tissues has been proposed to act locally only (Fontana et al., 2007), so this would support the conclusion that the altered gene expression in the liver seen in the present study may be a direct consequence of cloning. The possibility that other extrahepatic cytokines could affect liver APP expression cannot be ruled out. However, because proinflammatory cytokines like IL6 and IL1B were borderline upregulated in the abdominal SAT (see below), this does not seem likely.
Compared to the liver, VAT and abdominal SAT gene expression was affected very differently by cloning. Although APPs were still the main affected group, they were downregulated in both of these tissues, as seen by significant decreases in expression of SAA, HP, and C3 in abdominal SAT and SAA and C3 in VAT. Interestingly, this was accompanied by an upregulation of the expression of a subset of proinflammatory cytokines in abdominal SAT (TNF significantly and IL1B and IL6 borderline above 150%), whereas expression of the same cytokine subset was not changed or was even downregulated in VAT. Proinflammatory cytokines like IL-1β, IL-6, and TNF-α are extremely potent and have repeatedly been shown to be active both in endo- and paracrine fashion (Vilcek and Le, 1991), and it is remarkable how expression of these cytokines can occur in abdominal SAT without a concomitant induction of APP expression. This could be due to the existence of some mechanism for specific inhibition or downregulation of the local tissue APP induction in abdominal SAT. Again, however, this seemingly defective APP response may also be a direct consequence of the cloning process itself. Or, possibly, the differences in the expression of these cytokines were not large enough to induce APP expression. Although a defective or downregulated APP expression was also seen in VAT, there was no indication of any effect on proinflammatory cytokine gene expression in this tissue.
Whereas the three above-mentioned types of tissue were found to be affected by cloning with respect to many of the same genes, neck SAT showed a more mixed reaction to cloning, however, with most affected genes being upregulated, placing this tissue alongside the liver with regard to how gene expression was affected by cloning rather than with the other two adipose tissue types.
It should be noted that the expression of the APPs ORM1, and FIB could not be quantified because the sample dilution used in the assay for all genes was not sufficient to allow quantification of these two genes in all three types of adipose tissue, indicating a very high expression of ORM1 and FIB in these tissues.
None of the differences in APP and cytokine gene expression resulted in significant changes in the serum concentrations of APPs and cytokine in clones compared to controls (Fig. 2). Thus, the subtle changes in expression of mRNA coding for APPs and proinflammatory cytokines found in the tissues investigated do not give rise to discernible systemic effects. This could be due to the combined effect of opposite regulation in more than one endocrine organ, an adaptation of the protein secretion, and/or production pathways to increased gene expression or selective secretion from the tissue in question to the circulation.
The general conclusion of this work is that cloning does not affect gene expression to a large extent in the liver and in the three adipose tissues investigated in 9-month-old pigs; however, small changes were indeed consistently observed in cytokine and APP expression. Even if the effects may seem small compared to those observed during a full-blown acute-phase response to infection (see, for example, Skovgaard et al., 2009, 2010), such small changes may easily result in long-term phenotypic effects. Investigations in human healthy adults with prolonged acute-phase response in the high-normal range have been shown to have an increased long-term risk of angina, myocardial infarction, cardiovascular disease, and death (Munford, 2001; Ridker et al., 2000). It should be noted, however, that although the changes in gene expression observed here are indeed significantly associated with the cloned pigs, it remains to be seen if they are temporary or persist throughout the life of a cloned pig. On the other hand, the fact that a notable number of genes related to inflammatory responses are affected by cloning may have consequences for the usability of cloned pigs as obesity models for the study of the involvement of inflammation in development of obesity-related disease. Whether gene expression of innate immune response genes is different in obese clones and controls is currently being investigated and will be the subject of a subsequent paper.
Footnotes
Acknowledgments
Karin Tarp Wendt is acknowledged for her excellent help with qPCR and Mette Skou Hedemann, Winnie Østergaard, and Jens Askov Jensen for help with tissue sampling. The project was financially supported by a grant from the Danish Strategic Research Council (FØSU 2101-06-0034).
Author Disclosure Statement
The authors declare that no conflicting financial interests exist.