
Abstract
Abstract
Pluripotency is characterized by specific transcription factors such as OCT4, NANOG, and SOX2, but also by pluripotency-associated microRNAs (miRs). Somatic cells can be reprogrammed by forced expression of these factors leading to induced pluripotent stem cells (iPSCs) with characteristics similar to embryonic stem cells (ESCs). However, current reprogramming strategies are commonly based on viral delivery of the pluripotency-associated factors, which affects the integrity of the genome and impedes the use of such cells in any clinical application. In an effort to establish nonviral, nonintegrating reprogramming strategies, we examined the influence of hypoxia on the expression of pluripotency-associated factors and the ESC-specific miR-302 cluster in primary and immortalized mesenchymal stromal cells (MSCs). The combination of hypoxia and fibroblast growth factor 2 (FGF2) treatments led to the induction of OCT4 and NANOG in an immortalized cell line L87 and primary MSCs, accompanied with increased doubling rates and decreased senescence. Most importantly, the endogenous ECS-specific cluster miR-302 was induced upon hypoxic culture and FGF2 supplementation. Hypoxia also improved reprogramming of MSCs via episomal expression of pluripotency factors. Thus, our data illustrate that hypoxia in combination with FGF2 supplementation efficiently facilitates reprogramming of MSCs.
Introduction
The physiological oxygen tension for embryonic and adult cells lies in a range of 2–9% (Simon and Keith, 2008). In addition, it was shown that low oxygen tension prevents differentiation of human (h) ESCs (Ezashi et al., 2005). Despite these facts, current reprogramming strategies often disregard the physiologically correct milieu for pluripotent stem cells (Mitchell and Yochim, 1968; Yochim and Mitchell, 1968). In vitro, the required substratum for pluripotent stem cells is provided by mouse embryonic fibroblasts, which are stimulated by fibroblast growth factor 2 (FGF2) to release signaling molecules for the maintenance of human iPSCs and ESCs (Greber et al., 2007a). FGF2 induces differential expression of members of the transforming growth factor family (TGF β1). Upregulation of TGF-β1, activin A (TGF-β/ALK receptor ligand), and gremlin 1 [bone morphogenetic protein-4 (BMP4) inhibitor] as well as downregulation of BMP4 lead to SMAD2/3-driven expression of OCT4, NANOG, and SOX2 (Greber et al., 2007b). Accordingly, hypoxia and FGF2 treatment are sufficient to induce, but not to preserve, the expression of OCT4, NANOG, and SOX2 in primary fibroblasts (Page et al., 2009). Although hypoxia alone does not directly reprogram somatic cells, it does promote viral reprogramming of primary fibroblasts (Yoshida et al., 2009).
It has been shown that kinetics and efficiency of reprogramming differ dramatically among various cell types (Polo et al., 2010). Fibroblasts, the cell type most often used as a starting material for reprogramming studies, are of mesenchymal origin and harbor two disadvantages that hamper reprogramming. They are fully differentiated due to their mesenchymal nature, and they have to undergo a mesenchymal-to-epithelial transition to become pluripotent (Polo and Hochedlinger, 2010). In contrast, human mesenchymal stromal cells (MSCs) pose a valuable alternative for nonviral reprogramming. Even though they are also of mesenchymal origin, MSCs are immature multipotent stem cells capable of differentiating into any mesenchymal cell type. Currently, MSCs are one of the most promising candidates for tissue engineering and applications in regenerative medicine (Caplan, 2007), mostly due to their differentiation potential and their immunological properties (Tae et al., 2006). The immaturity of multipotent MSCs is reflected in the expression of several genes found in pluripotent ESCs and iPSCs, which in turn facilitates the generation of iPSCs.
The induction of pluripotency is still challenging because the underlying mechanisms have yet to be fully elucidated (Sridharan and Plath, 2008; Okita and Yamanaka, 2011). Which step in the reprogramming process is the most crucial is highly debated. We argue that miRs could exert the first strong exogenous impact by changing the transcriptome of a targeted cell. Small noncoding miRs (∼22 nucleotides) are abundant and capable of impairing or preventing translation by binding to hundreds of mRNA molecules (Treiber et al., 2012). Most likely, miRs regulate approximately 30% of the human genome via multiple biologic pathways (Yang and Lai, 2011). Expression of miRs is strongly induced in the blastocyst, and the epigenetic status of the genome is also regulated by distinct miRs during embryonic growth (Grandjean et al., 2009; Ohnishi et al., 2010). Subsequently, the expression of pluripotency-associated transcription factors like OCT4, NANOG, or SOX2 seems to be regulated due to epigenetic rebuilding of the genome (Altun et al., 2010).
The aim of this study was to investigate whether pluripotency factors and ESC-specific miRs could be induced in MSCs only by the exposure to hypoxia and supplementation of FGF2. The effects of a combination of these two easily controllable factors on reprogramming of human MSCs have not been fully investigated and are not used routinely to date. Here we demonstrate a functional link between hypoxic culture conditions, FGF2 supplementation, and the induction of the ESC-specific miR-302 cluster. The repression of target genes as well as the co-expression of pluripotency-associated genes showed the functionality of induced ESC-specific miRs. To verify hypoxia-dependent induction of pluripotency factors, we analyzed the ability of low oxygen to further increase exogenous and endogenous expression of OCT4, NANOG, LIN28, and SOX2 after transfection of MSCs with an episomal vector. Our data suggest that hypoxia and FGF2 treatment may be used to facilitate reprogramming of MSCs.
Materials and Methods
Cell culture and growth conditions
The immortalized human MSC line L87 obtained from bone marrow of a hematologically normal patient (Thalmeier et al., 1994, 1996) was kindly provided by Prof. Dr. Stefan Burdach (Department of Pediatrics, Technische Universität München, Germany). The cells were cultured in RPMI-1640 medium (Life Technologies, Germany) supplemented with 10% fetal bovine serum (FBS; Lonza Cologne GmbH) and 1% penicillin/streptomycin (Life Technologies, Germany). The cells were passaged at 70–80% confluence by exposing cells to 0.1 M EDTA for 1 min and rinsing once with RPMI-1640 medium. The cells were seeded in a 1:5 split ratio. Primary MSCs were obtained from bone marrow aspirates of 5 patients, kindly provided by Dr. Lutz Müller (Department of Internal Medicine IV, Martin Luther University Halle-Wittenberg). These cells were seeded in a range of 200–400 cells/cm2 and cultured until they reached 60% confluence in Minimal Essential Medium Eagle (PAA, Austria) with
Reverse transcription and semiquantative RT-PCR
RNA isolation and DNase treatment were performed using the RNeasy Mini Kit (Qiagen, Hilden, Germany) according to the manufacturer's protocol. RNA levels were quantified using a NanoVue spectrophotometer (GE Healthcare, Germany). Two micrograms of total RNA were used for reverse transcription using RevertAid M-MuLV Reverse Transcriptase (Life Technologies, Germany). The reaction mix (20 μL) contained: 0.5 μL RNase inhibitor, 1 μL reverse transcriptase (RT), 4 μL RT buffer, μL deoxyribonucleotide triphosphates (dNTPs), 1 μL oligo(dT) primers, and 11.5 RNase-free water including 2 μg of RNA (Life Technologies). The reaction was incubated at 65°C for 5 min, 42°C for 60 min, and 70°C for 10 min and then held at 4°C. For RT-PCR (25 μL) 2 μL of the first-strand cDNA was used as a template. The RT-PCR reaction was performed with 1× buffer BD, 2.5 mM MgCl2, 200 μM dNTPs, 10 pmol of forward and reverse primers, and 1.25 U FIREPol DNA polymerase (Solis BioDyne, Estonia). For the amplification of C-MYC, KLF4, and 18SrRNA, 2 mM MgCl2 was applied and Hotfire polymerase (Solis BioDyne, Estonia) was used for RT-PCR of KLF4. 18SrRNA served as a reference gene. PCR conditions were as follows: Initial denaturation at 95°C for 5 min followed by 40 cycles of denaturation at 95°C for 45 sec, annealing at 57°C (for C-MYC, 59°C) for 1 min, and extension at 72°C for 45 sec. The final extension was done at 72°C for 10 min and the samples were then held at 4°C. A nontemplate reaction served as a control. Amplification products were analyzed using 2% agarose gels containing 0.5 μg/mL ethidium bromide in 1× TAE buffer. RT-PCR forward and reverse Primers (Table 1) were designed using the Primer3Plus online tool (www.bioinformatics.nl/cgi-bin/primer3plus/primer3plus.cgi/). The human OCT4 gene encodes for three different splice variants OCT4A, OCT4, and OCT4B1, basically differing in their amino-terminal regions (Atlasi et al., 2008). Only variant 1 (OCT4A, NM_002701) is exclusively expressed in human ESCs and embryonic carcinoma cells. The RT-PCR primers used in our study for OCT4 were specifically designed to amplify the ESC-specific variant OCT4A.
Quantitative RT-PCR
For quantitative real-time analysis of transcript levels SYBR Green-based qRT-PCR was applied using the StepOnePlus Real-Time PCR System (Life Technologies, Germany). Reaction plates, adhesive film, eight-tube stripes, and caps were obtained from Life Technologies, Germany. Thermal cycling conditions were 95°C for 10 min, followed by 40 cycles of 95°C for 15 sec and 60°C for 1 min. A melting curve analysis was performed to ensure that the desired amplicon was detected. The specificity of the analyzed transcripts was also determined by gel electrophoresis using 2% agarose gels. The reaction mixture (20 μL) contained 1 μL of cDNA, 10 μL of SYBR Green reagent, 10 pmol of each primer, and RNase-free water (Life Technologies, Germany). All qRT-PCR reactions were performed in triplicate and calculated relative to the endogenous control 18SrRNA, which was shown to be constantly expressed in the analyzed model. Template-free samples served as negative controls. Relative standard curve analysis was chosen for detection of transcript levels and standard deviation was calculated according to manufacturer's manual of StepOnePlus Real-Time PCR System (see Appendix A-2 Formulas in the manual). Forward and reverse primers for qRT-PCR (Table 2) were designed using the software Primer Express 3.0 (Life Technologies, Germany).
Quantification of miR expression levels
Isolation of miRs was performed using the miRNeasy Kit, and DNase treatment was included according to the manufacturer's protocol (Qiagen, Germany). The miScript Reverse Transcription Kit was used for cDNA synthesis of 1 μg of RNA, which includes polyadenylation of the miRs to enable binding of oligo(dT) primers (Qiagen, Germany). The StepOnePlus Real-Time PCR System (Life Technologies, Germany) was used for quantification, and a three-step-protocol was performed: 95°C for 15 min, followed by 40 cycles of 94°C for 15 sec, 55°C for 30 sec, and 70°C for 30 sec. A melting curve analysis was performed to ensure that the desired amplicon was detected. According to the Qiagen miScript SYBR Green PCR Kit instructions, a 20-μL reaction mix was prepared as follows: 10 μL miScript SYBR Green, 1 μL universal forward primer, 1 μL miScript Primer Assay (reverse primer, specific for the respective miR), and 8 μL of RNase-free water including 10 ng of template. The miScript Primer Assays and miScript Precursor Assays for real-time analysis of pre- and mature miR-302a-d and snoRNA U6B were obtained from the Qiagen miScript GeneGlobe online database (see www.qiagen.com/GeneGlobe/). All reactions were performed in triplicate and normalized to the endogenous reference noncoding snoRNA U6B. Relative standard curve analysis and standard deviation were calculated according to the manufacturer's instructions (see miScript PCR System Handbook, Appendix B). Reactions without template served as negative controls.
Flow cytometry
Cells were harvested with 0.1 M EDTA for 1 min and further applied according to the manufacturer's instructions of the BD Stemflow™ Human and Mouse Pluripotent Cell Analysis Kit (BD Bioscience, Germany). Briefly, cells were fixed using BD Cytofix™ fixation buffer for 20 min, washed twice, resuspended, and incubated for 10 min at room temperature using BD Perm/Wash™ buffer. After addition of OCT3/4 and NANOG (goat sc-30331, Santa Cruz, CA, USA) antibodies and incubation for 30 min, cells were washed twice, and 5×10⁶ cells were analyzed immediately using FACS Canto (BD Bioscience, Germany). For correct instrument configuration, BD™ CompBead Plus control beads were prepared. Additionally, unlabeled cells and fluorescence-minus-one controls were used.
Nuclear staining with Ki-67 antigen was performed to measure the proliferation of L87 cells by fluorescence-activated cell sorting (FACS). For this purpose, mouse anti-human Ki-67 (Cat. No. 556003, BD Bioscience, Germany) and the secondary antibody chicken anti-mouse Alexa488 IgG (cat. no. A-21200, Life Technologies, Germany) were applied according to the manufacturer's instructions. The geometric mean was used for quantification.
Immunohistochemistry
Cells were seeded into 6-cm plates (Thermo Scientific, Germany) onto glass coverslips. The cells were fixed in 4% paraformaldehyde for 20 min, washed in phosphate-buffered saline (PBS), and permeabilized in 0.1% Triton X-100 (Sigma Aldrich Germany) and 1% mouse or goat serum in PBS for 30 min. Nonspecific binding was blocked with 5% mouse or goat serum for 30 min. Because OCT4 is expressed in four different isoforms, the antibody was chosen according to previous studies to detect the ESC-specific isoform OCT4A (Mueller et al., 2009; Wang and Dai, 2010). The primary antibodies against OCT4 (1:100; mouse sc-5279, Santa Cruz, CA, USA) or NANOG (1:100; goat sc-30331, Santa Cruz, CA, USA) were used at 4°C overnight. After washing in PBS, cells were incubated for 30 min at 37°C with the secondary antibody against mouse (1:400; A11001, Life Technologies, Germany) or goat (1:400; 705-485-147, Jackson ImmunoResearch, UK). Cells were washed with PBS, stained for 5 min with 5 μg/mL Hoechst 33342 in the dark, washed with PBS, and washed finally with distilled water. After sealing the cells with Dako Mountain Medium (Dako, Germany), cells were analyzed by fluorescence microscopy (Keyence BZ-8100E; Keyence Corporation Osaka, Japan).
Minicircle-based reprogramming
For ectopic expression of pluripotency factors OCT4, NANOG, SOX2, and LIN28 STEMcircles™-LGNSO episomal vectors (Stemcell Technologies, France) were transfected according to the provided protocol. Delivery was achieved by lipofection using 1.5 μL Interferrin (PeqLab, Germany) and 2×10⁴ cells per well of a 24-well plate.
Statistical analysis
Data are presented as mean±standard derivation and differences were considered to be relevant with the Student t-test at p<0.05 using SigmaPlot version 11.0 (Systat Software, USA).
Results
Induction of OCT4 and NANOG in L87 cells
To analyze whether hypoxia and FGF2 have the ability to induce properties of human ESCs, we cultured cells of the human MSC line L87 under normoxic (20% O2) and hypoxic (5% O2) conditions with and without supplementation of FGF2. Using semiquantitative RT-PCR, we analyzed the expression of crucial pluripotency-associated genes in the MSC line L87 (Fig. 1A). We were able to show that the combination of low oxygen and FGF2 supplementation increased OCT4 and NANOG expression, whereas C-MYC, LIN28, and SOX2 were absent and not induced. KLF4 was constantly expressed and neither altered by FGF2 nor by low oxygen. Therefore, we chose OCT4 and NANOG for further analyses and quantified mRNA expression levels in L87 cells after 7 days and 14 days of hypoxia and FGF2 exposure (Fig. 1B). Control cells were cultured using standard media and normoxia. L87 cells showed a 1.5-fold induction of the ESC-specific OCT4 transcript variant 1 when cells were cultured at 5% O2 in the presence of FGF2. In contrast, OCT4 mRNA levels were not affected by hypoxia or FGF2 alone (Fig. 1B). NANOG expression was upregulated by hypoxia alone, but most highly induced (four-fold) by FGF2 and hypoxia showing a synergistic effect of both factors on the expression value (Fig. 1B). However, FGF2 alone could not increase NANOG mRNA levels. The induction of OCT4 and NANOG was stable because the increase of mRNA levels was similar from 7 days until 14 days. FACS analyses were used to quantify OCT4 and NANOG protein–expressing cells at 7 days. For statistical significance, 5×10⁶ vital stained cells were sorted. OCT4 protein expression increased by 0.0034%, yielding 0.01% OCT4-expressing cells (Fig. 1C). NANOG protein was induced by 0.0011%, yielding 0.0015% NANOG-positive cells (Fig. 1C). Immunohistochemistry was chosen for distinct localization of OCT4 and NANOG proteins at 7 days to validate functionality of the induced pluripotency-associated transcription factors. However, OCT4 and NANOG proteins were localized predominantly in the cytoplasm and less in the nucleus (Fig. 1D).
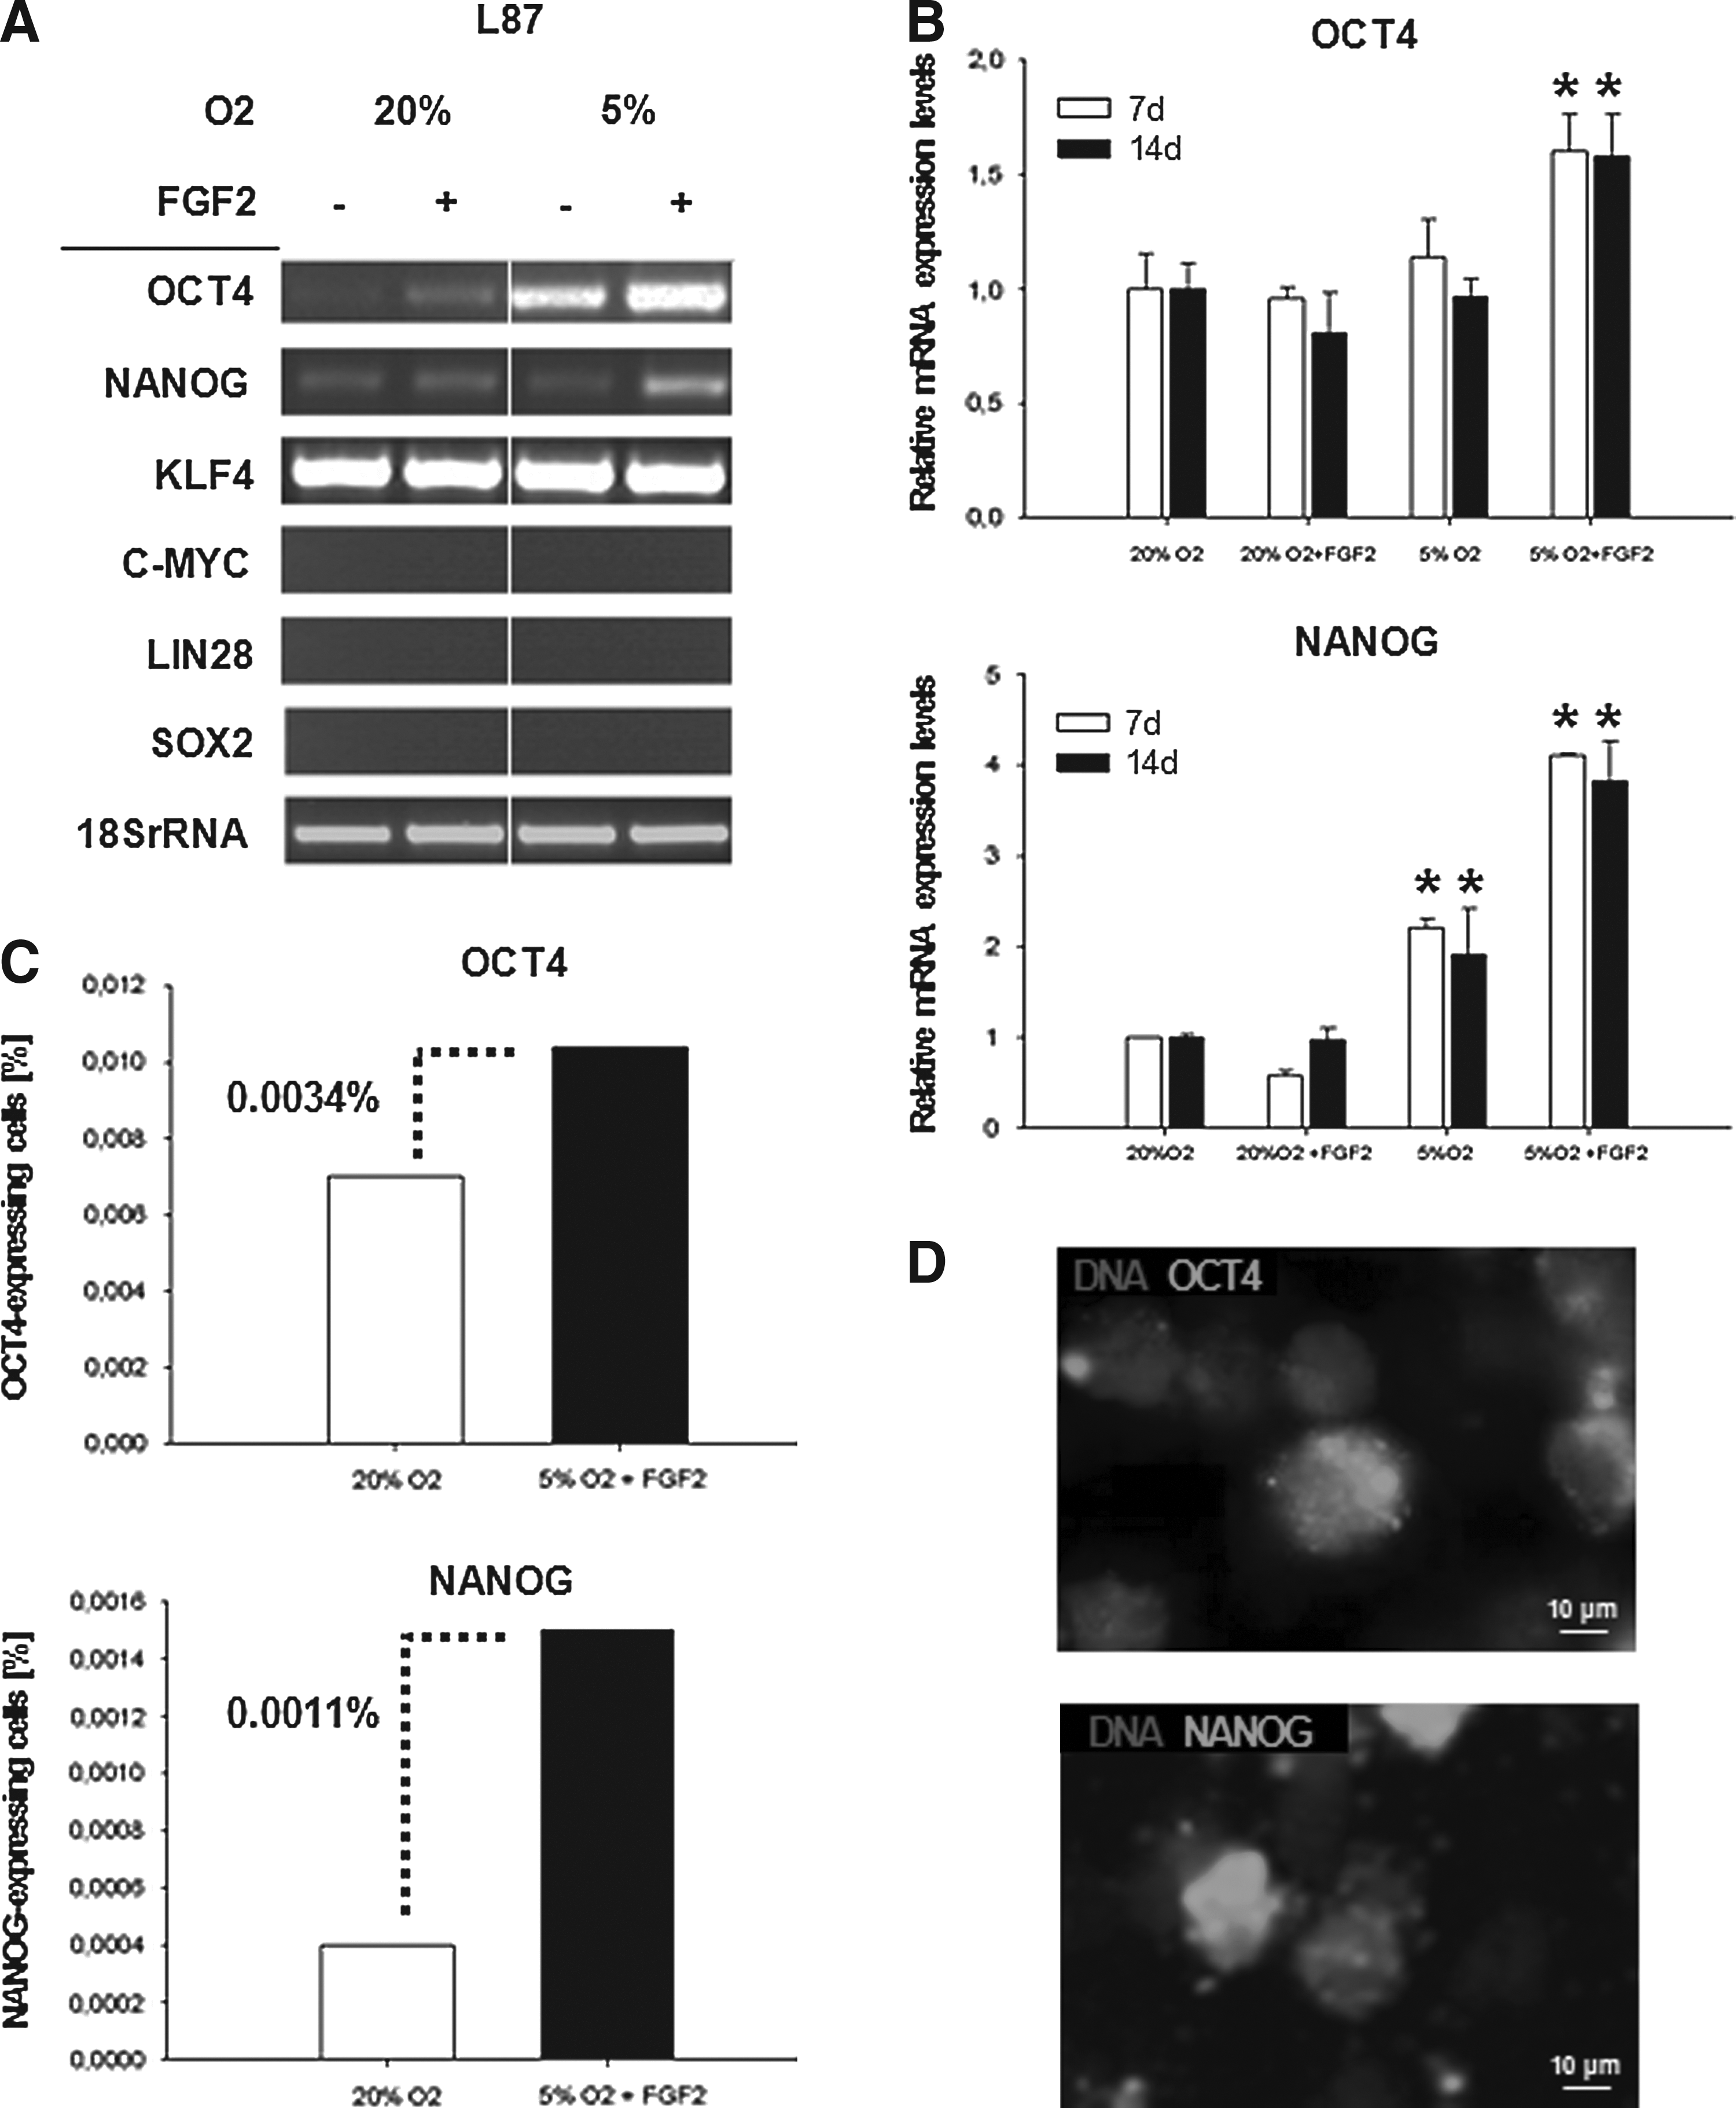
Induction of pluripotency marker genes in L87 cells after hypoxic culture and FGF2 supplementation. (
Preservation of the primordial status of primary MSCs through hypoxia and FGF2
For further analysis, we extended our experiments to human primary bone marrow–derived MSCs. We revealed a strong impact of hypoxia and FGF2 supplementation on long-term culture of primary MSCs because morphology, cell cycle progression, and population doubling rates were conserved or induced. In the presence of FGF2 and hypoxia, a stable population of small spindle-shaped cells was observed until passage 4, whereas cells cultured at ambient O2 levels displayed a senescent morphology (Fig. 2A). Compared to the normoxic culture, the population-doubling rate was 1.5-fold increased under hypoxic culture conditions and further increased to two-fold by the addition of FGF2 (Fig. 2B). Correspondingly, increased proliferation of hypoxia/FGF2-treated MSCs was reflected by elevated expression of POLI and MCM5, two genes responsible for cell cycle progression (Fig. 2C) and increased Ki67 staining (Fig. 2D).
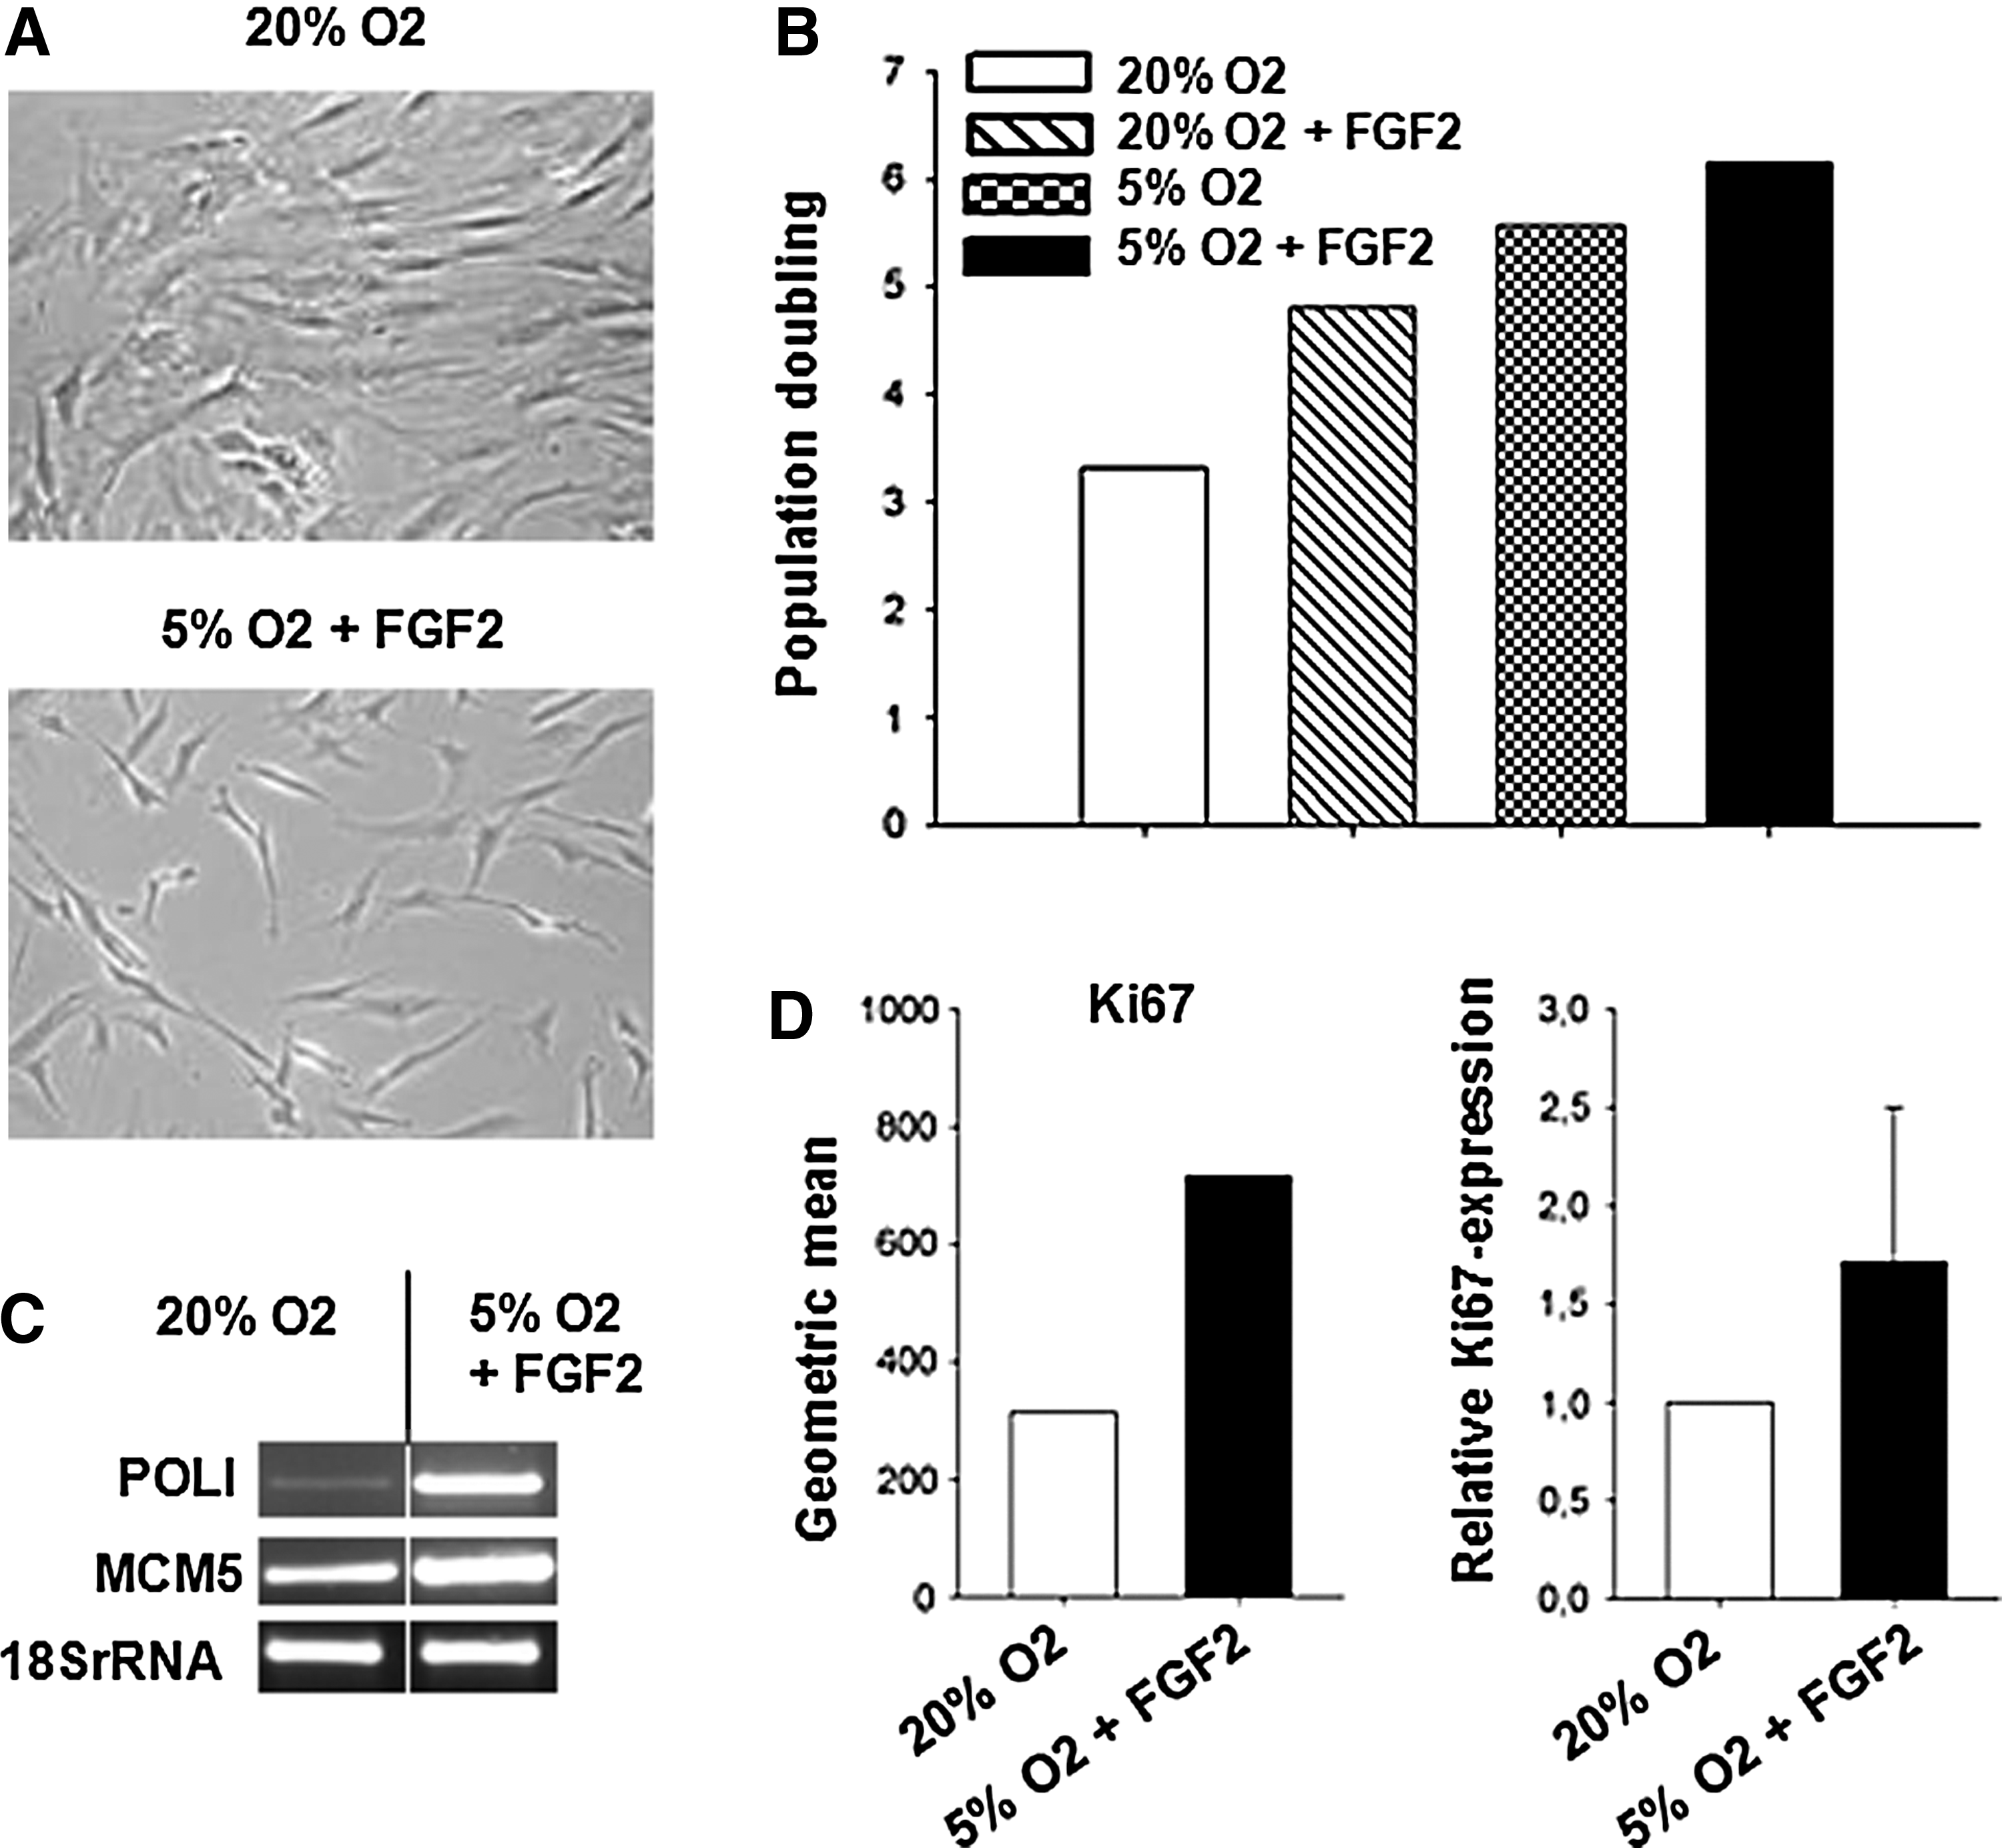
Enhanced proliferation of primary MSCs (passage 4) at 7 days is induced by hypoxic conditions and FGF2 (representative data from 1 patient). (
Induction of OCT4 and NANOG in primary MSCs
We also observed an inductive effect of FGF2 and hypoxic conditions on the mRNA expression of OCT4 and NANOG at 7 days in primary MSCs (Fig. 3A). In 4 out of 5 patients, KLF4 and C-MYC were constitutively expressed in MSCs and not influenced by either FGF2 or hypoxic conditions (Fig. 3A, patient 1). One out of 5 patient's MSCs showed low expression of KLF4 and lacked the expression of C-MYC. C-MYC mRNA levels were induced using FGF2 and hypoxic culture conditions, whereas KLF4 levels were already increased by hypoxia alone (Fig. 3A, patient 2). Quantitative real-time RT-PCR was employed, confirming the induction of OCT4 and NANOG in all 5 patients. In all primary MSCs, we observed an increased expression of OCT4 through the addition FGF2 alone, but the highest inductive effect was observed when culture with 5% O2 was combined with FGF2 treatment (Fig. 3B). Hypoxia slightly induced OCT4 in only 1 out of 5 samples. Additionally, in MSCs of all 5 patients, we could induce NANOG mRNA by the combination of FGF2 and low oxygen, whereas both factors alone were not sufficient to induce the pluripotency factors in all 5 samples (Fig. 3B).
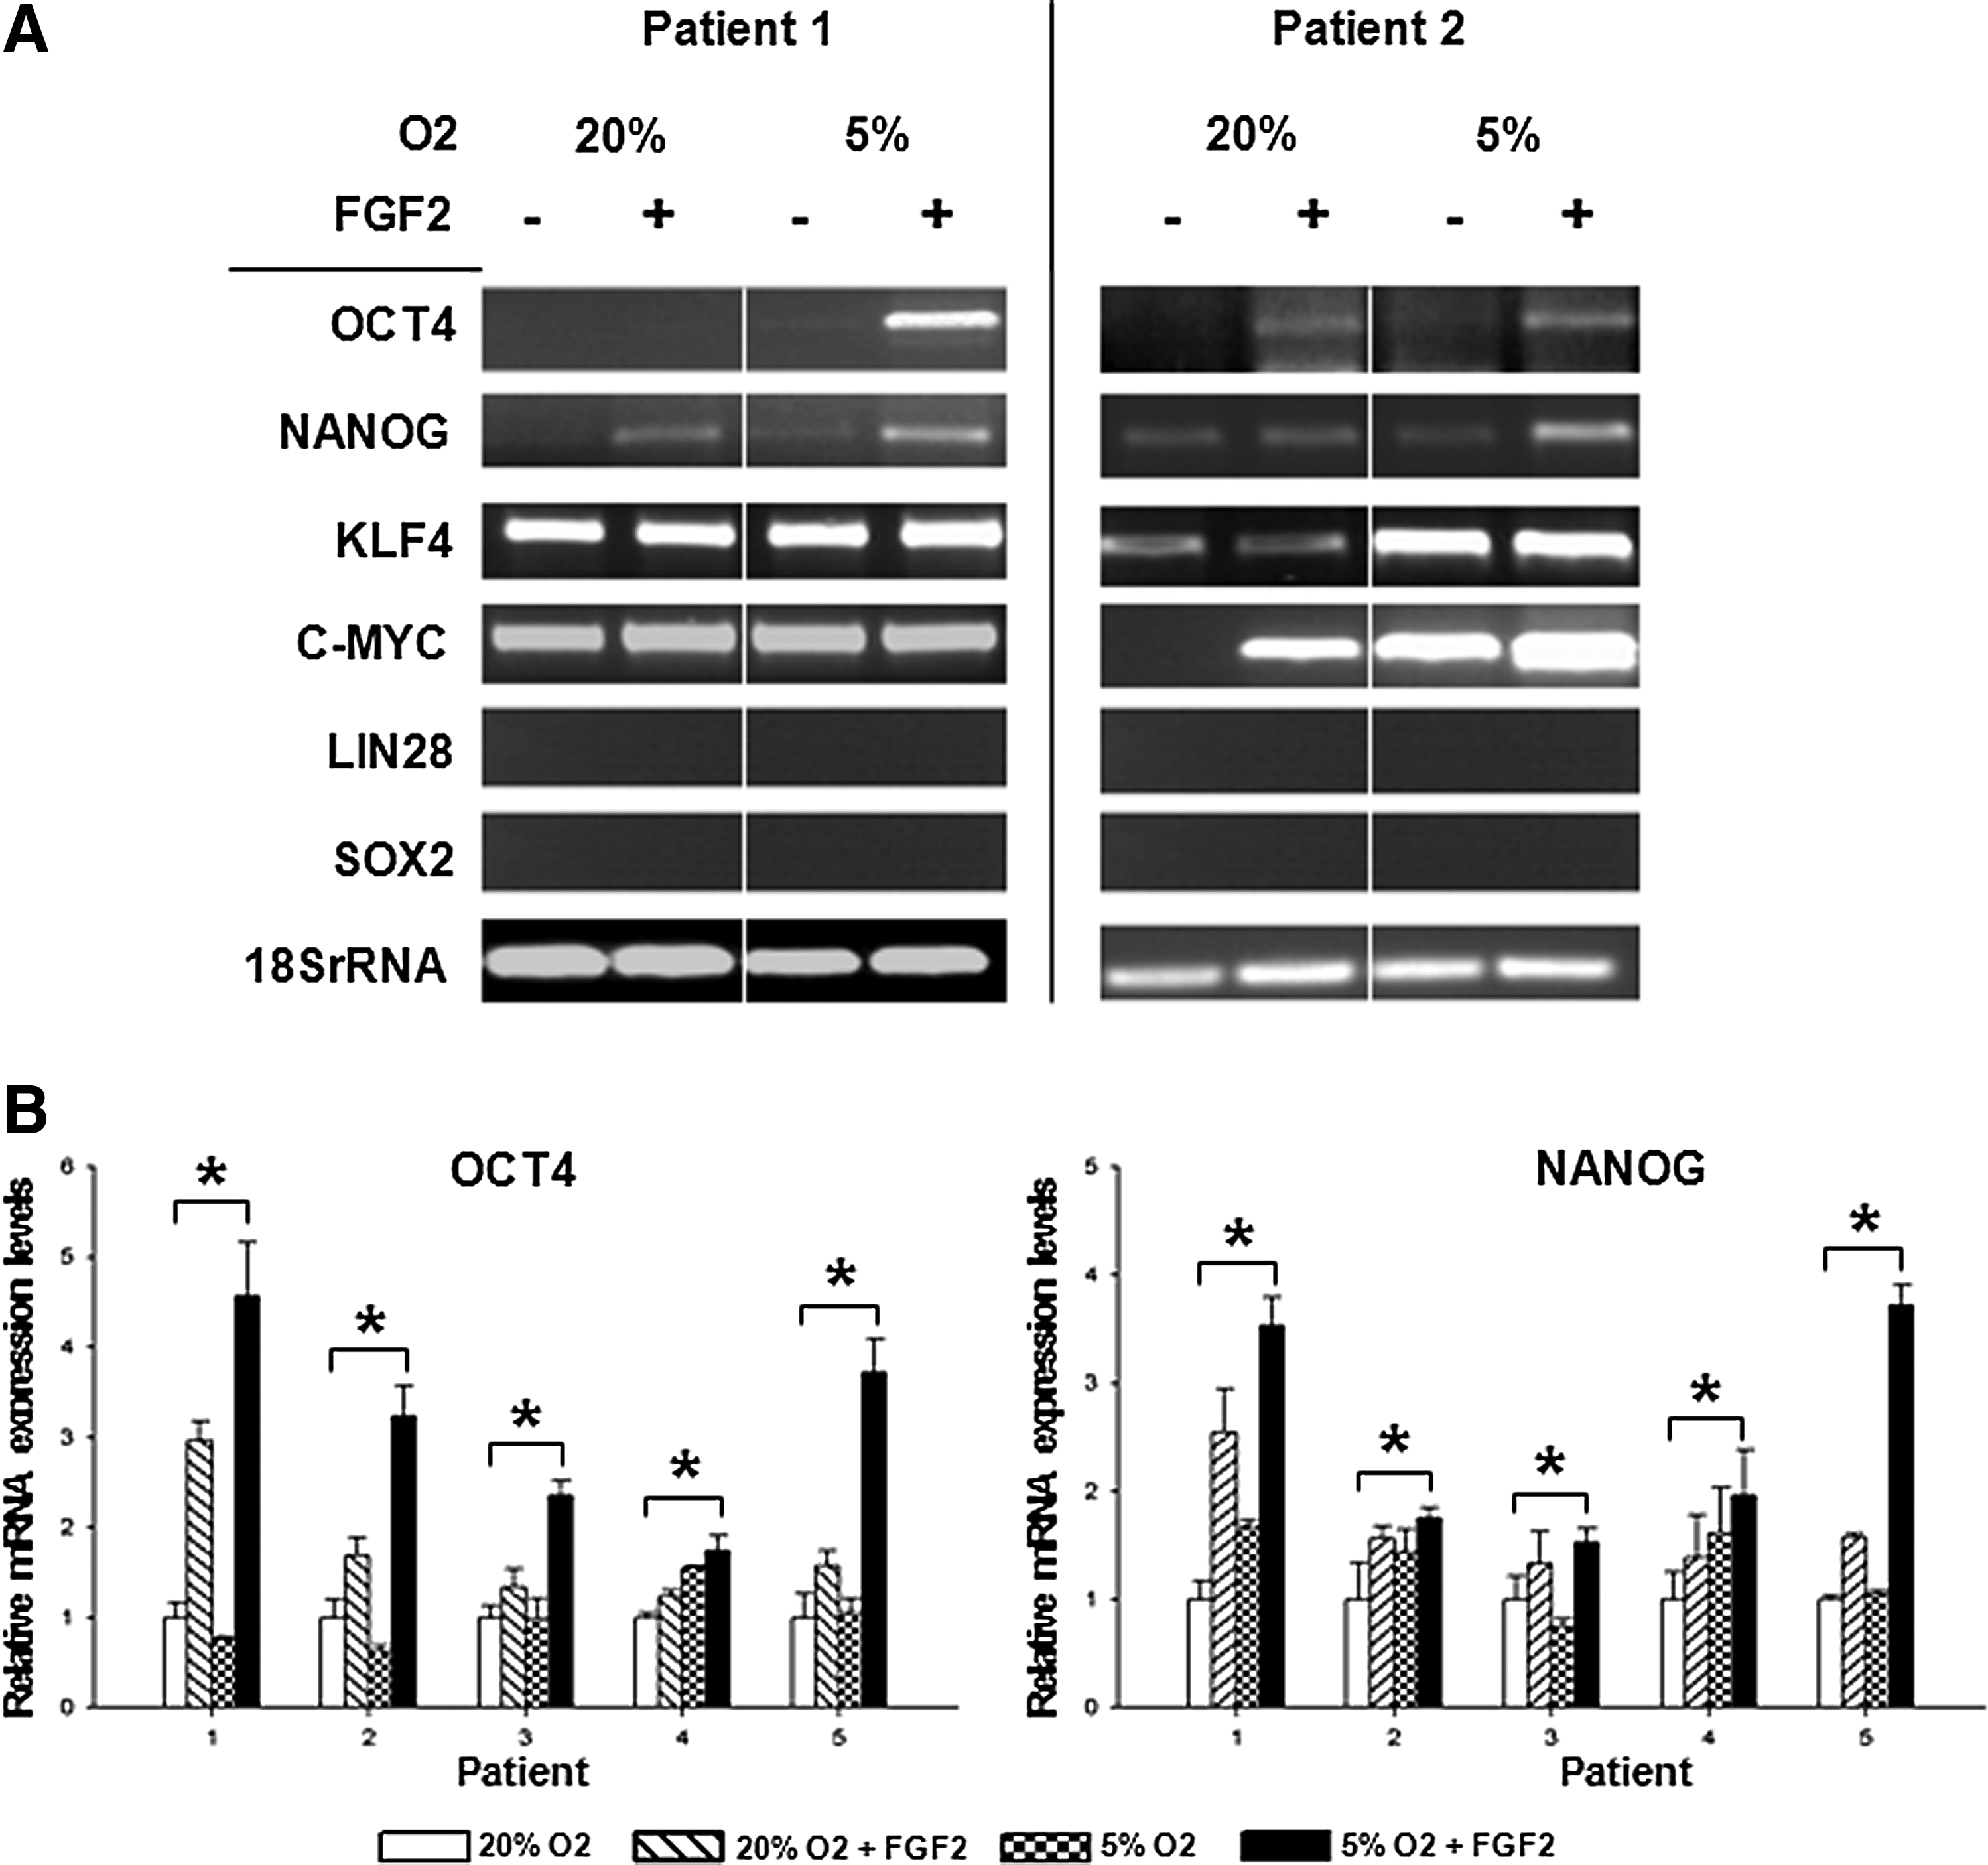
mRNA induction of pluripotency factors in primary MSCs (passage 4) at 7 days after hypoxic culture and FGF2 supplementation. (
Induction of pluripotency-specific miR-302 cluster
To evaluate whether the impact of hypoxia on pluripotency factors is associated by changes in the miR pattern, we analyzed the expression of the ESC/pluripotency-specific miR-302 cluster in L87 cells and primary MSCs at 7 days and 14 days. In L87 cells, we observed hypoxia-mediated inductive effects on the expression levels of pre-miR-302c and pre-miR-302d at 7 days (Fig. 4A, upper panel). In combination with FGF2, low oxygen was sufficient to enhance expression levels of the four pre-miRs, 302a–d. This effect was shown to be persistent until 14 days. Interestingly, pre-miR-302c was induced by all test variations, FGF2, and hypoxia alone and the combination of both at 14 days. The analysis of mature miR-302 cluster expression revealed that hypoxia or FGF2 alone had no impact on miR-302a and miR-302d expression at 7 days, whereas miR-302b and miR-302c were slightly increased. However, all four miR variants, miRs-302a–d, were highly enhanced by the combination of FGF2 and low oxygen (Fig. 4A, lower panel). These results were enforced at 14 days, whereas effects by FGF2 and hypoxia alone remained insignificant.
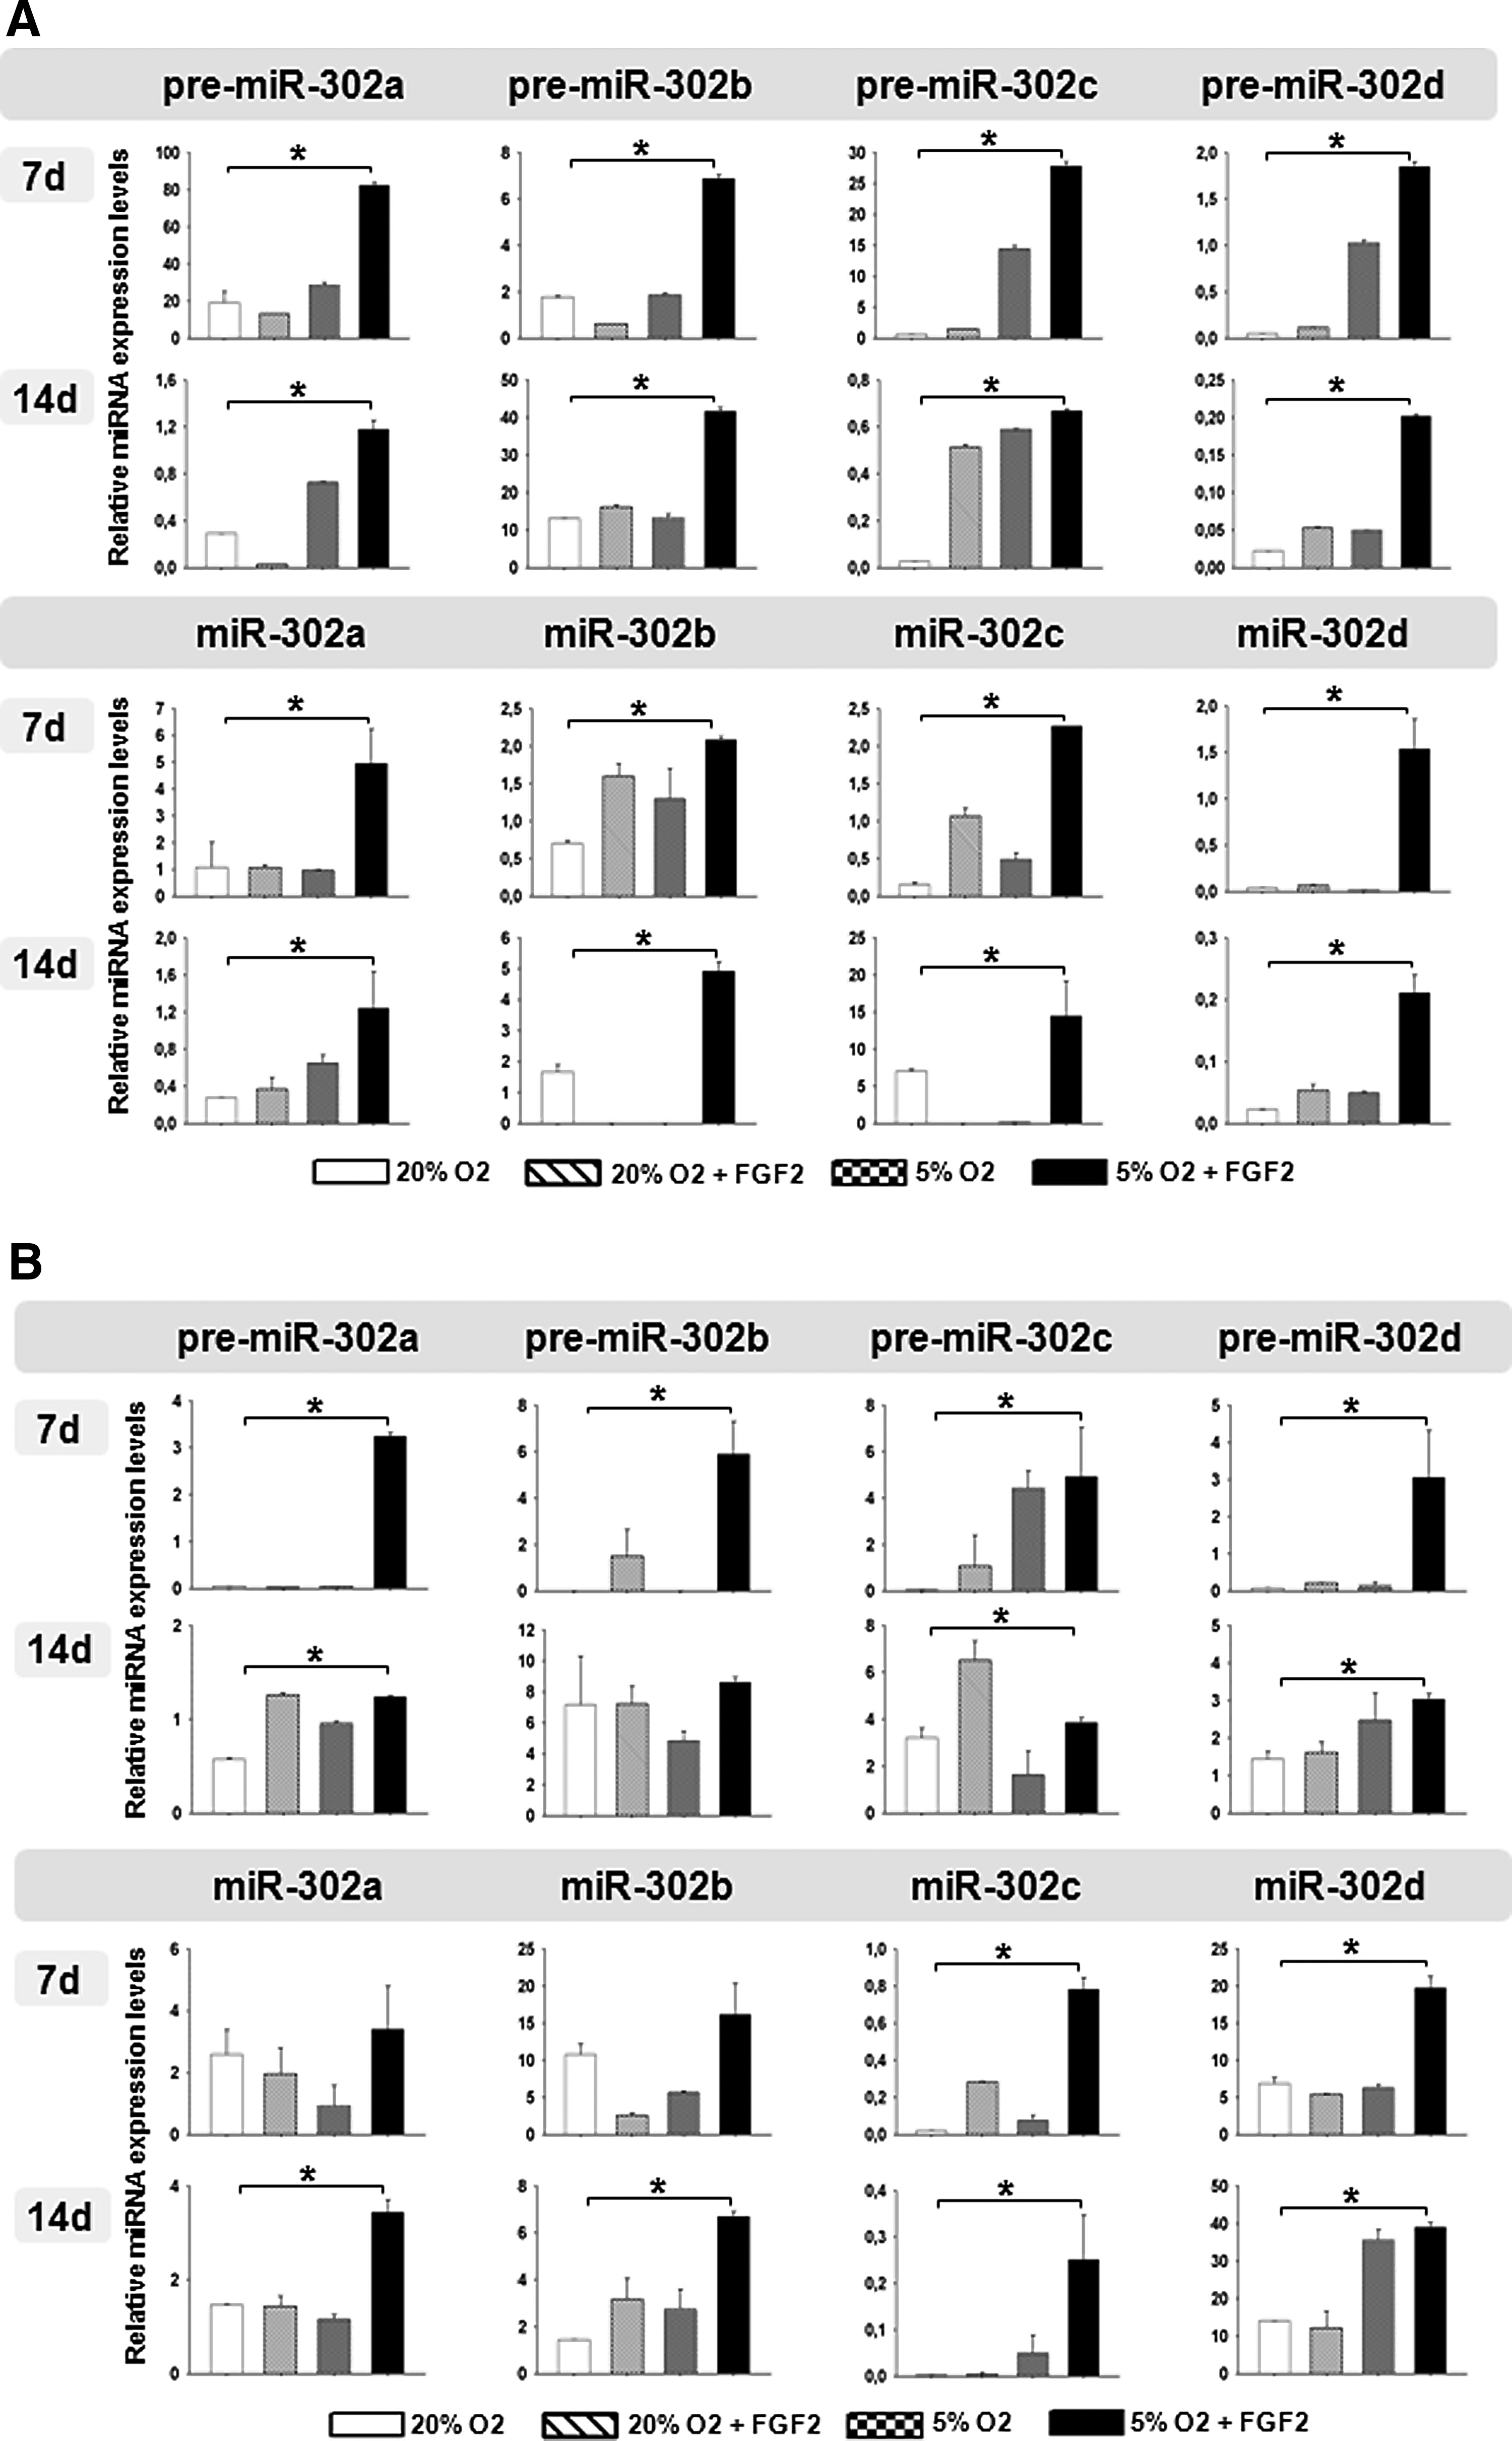
Relative miRNA expression levels of pre-miR and mature miR-302 at 7 days and 14 days regulated by hypoxic culture conditions and supplementation of FGF2 in L87 cells (
In primary MSCs, FGF2 treatment for 7 days resulted in a slight induction of pre-miR-302b and pre-miR-302c, but not pre-miR-302a and pre-miR-302d (Fig. 4B, upper panel). Hypoxia alone only induced pre-miR-302c. However, in combination, again all four pre-miRs were highly induced at 7 days. In contrast to the observations made in the MSC line L87, this effect could not be sustained until 14 days. Application of FGF2 or low oxygen led to no change or the decrease of mature miRs. Again, both FGF2 and hypoxia together were sufficient to increase the expression of all four mature miRs at 7 days (Fig. 4B, lower panel). This effect was further increased at 14 days, whereas FGF2 or hypoxia alone only sustained expression of miR-302b. Interestingly, hypoxia-related induction of miR-302d was very strong at 14 days.
Functionality of the induced miR-302 cluster
In addition to miR expression, we also examined the functionality of the miR-302 cluster via analyses of target gene repression. In both, L87 and MSCs, we found a significant reduction of target gene expression, namely KLF13, DNMT1, WDR61, and CYCLIN A1, after 14 days of culture under hypoxia and FGF2 supplementation (Fig. 5). WDR61 and CYCLIN A1 were repressed up to 80%, whereas KLF13 and DNMT1 showed a 50% reduction. Although WDR61 and CYCLIN A1 were more strongly expressed than KLF13 and DNMT1 in L87 cells, it was the other way around in primary MSCs, where WDR61 and CYCLIN A1 expression was decreased about 30%.
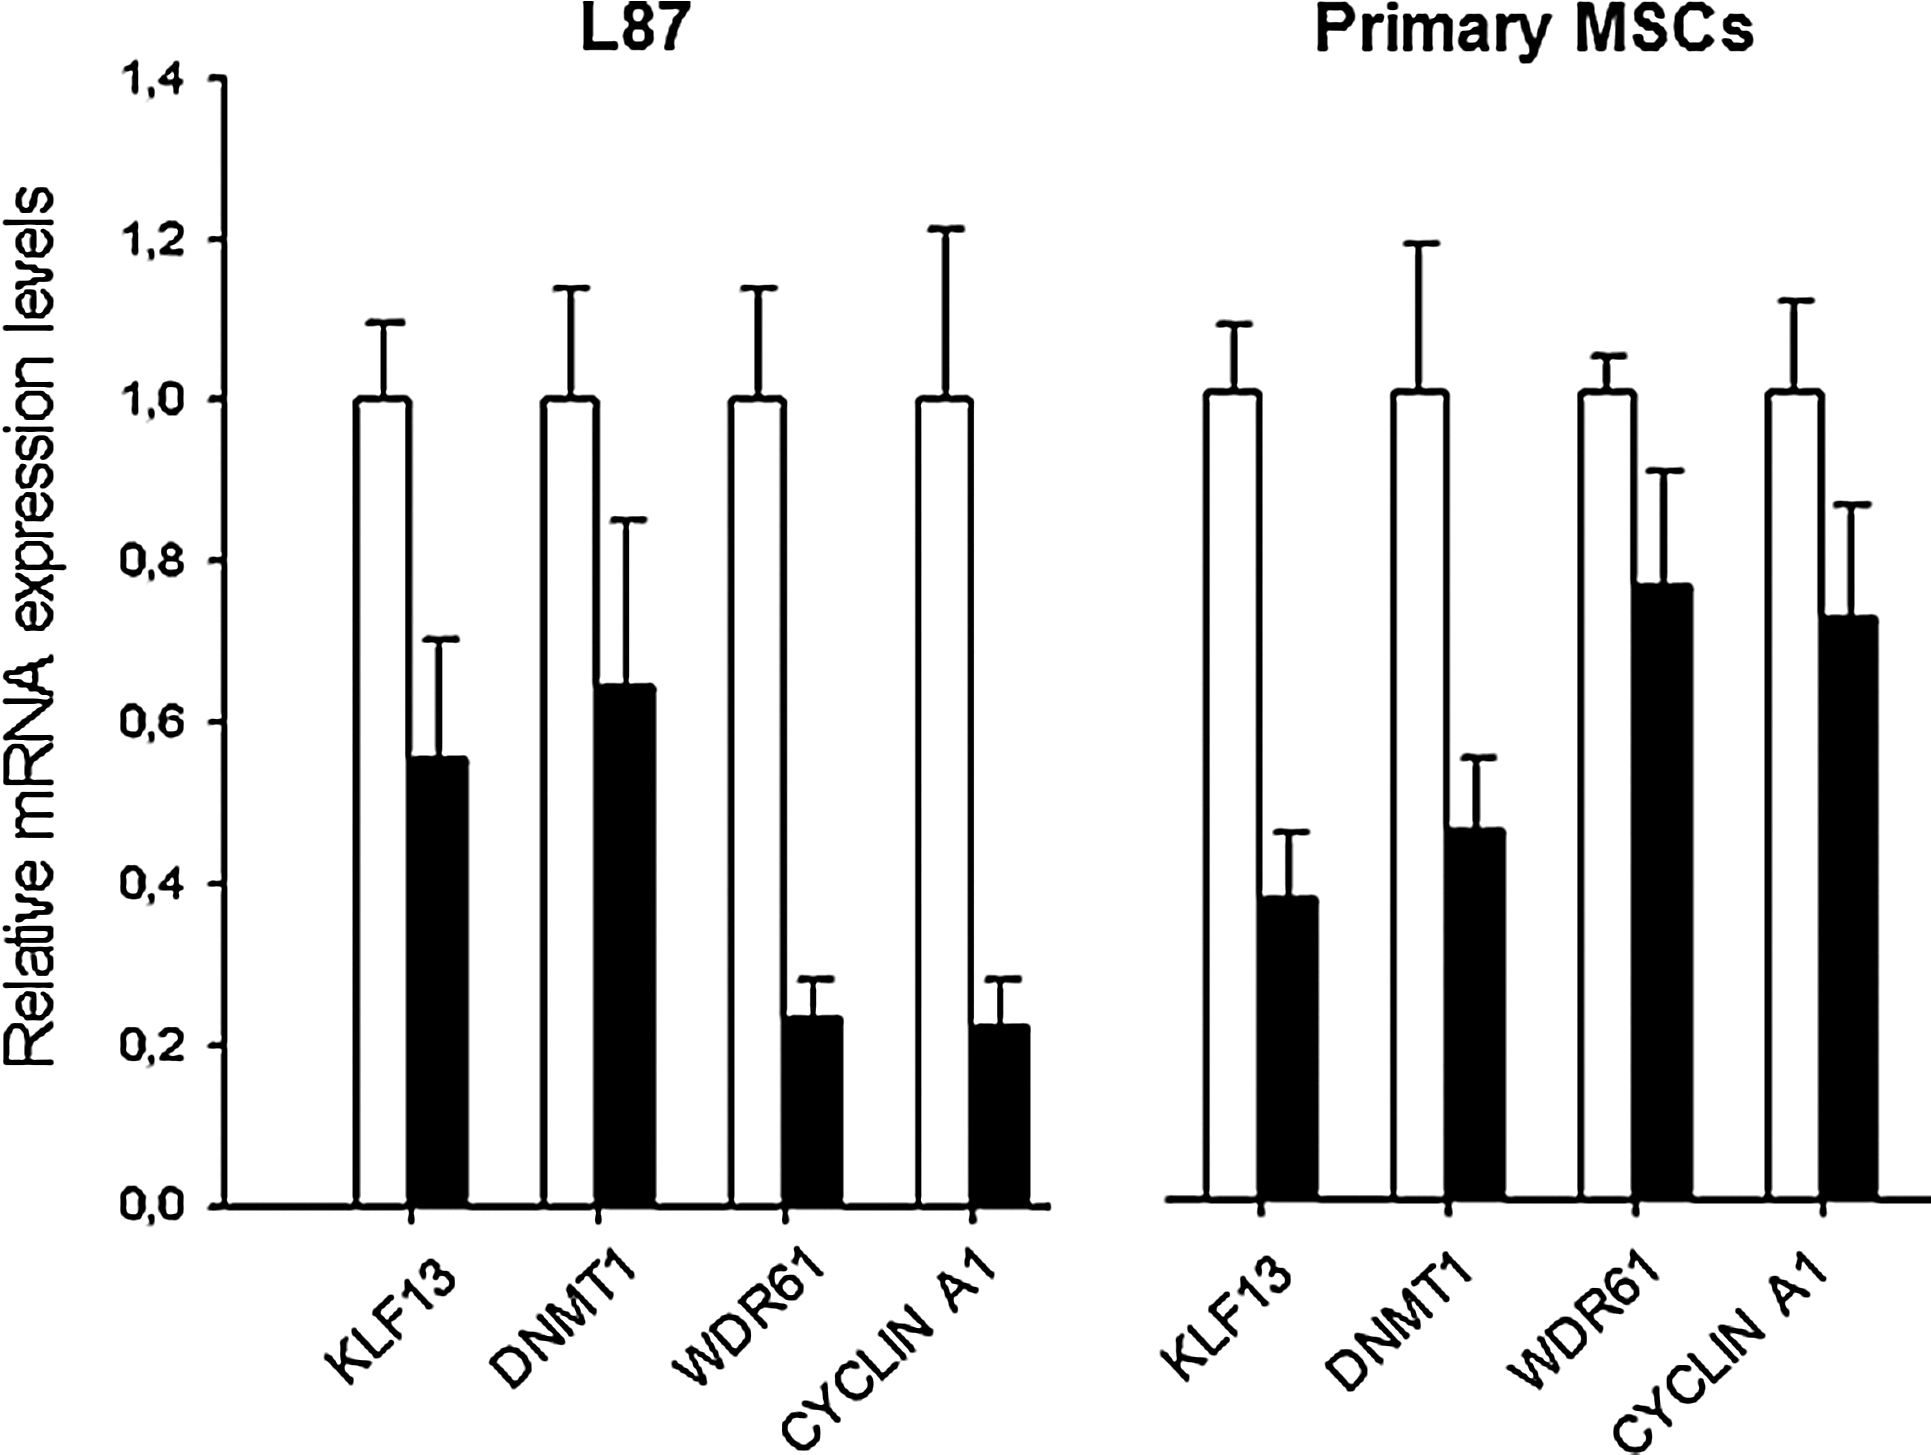
mRNA repression of miR-302 targets in L87 cells and primary MSCs at 14 days after culture under hypoxia with FGF2 supplementation (black) in comparison to control cells cultured under normoxia without FGF2 supplementation (white).
Hypoxia during reprogramming
Because hypoxia was the key regulator during induction of OCT4 and NANOG, we examined whether hypoxia enhances induction of OCT4 and NANOG when combined with other nonviral reprogramming strategies. We used the nonintegrative plasmid STEMcircles™-LGNSO (SC) to ectopically induce OCT4, NANOG, SOX2, and LIN28 under hypoxic and normoxic conditions. We could prove that the ectopically expressed reprogramming factors are sufficient to induce their endogenous expression 1 day after transfection using standard conditions (Fig. 6A). Figure 6B shows the levels of total (endogenous and exogenous) OCT4 and NANOG expression in L78 cells when episomal vector–based reprogramming was combined with FGF2 treatment and hypoxia. Under normoxia, OCT4 was induced after transfection with SC at 1 day and diminished thereafter to only marginal levels (Fig. 6B). In contrast, hypoxia led to the prolonged expression of OCT4 until 5 days. At 5 days, the observed expression level was only dependent on the hypoxic culture conditions but not on SC, as both negative control and SC-transfected cells showed similar OCT4 expression. NANOG mRNA was highly induced upon transfection with SC whereas mock controls showed hardly any NANOG. Again, hypoxia could sustain NANOG expression. In accordance with the findings presented in Figure 1, hypoxia alone was sufficient to induce NANOG expression at 5 days. To evaluate whether hypoxia could increase the mRNA levels of OCT4 and NANOG acting synergistically to SC, the fold change of the expression induced by hypoxia in comparison to normoxia was determined. OCT4 induction remained to be very low and SOX2 was also induced at a very low level, even under hypoxic conditions (Fig. 6C). However, NANOG expression dramatically increased in the presence of low oxygen at 1 day, whereas LIN28 levels were enhanced at a lower, albeit still significant, level.
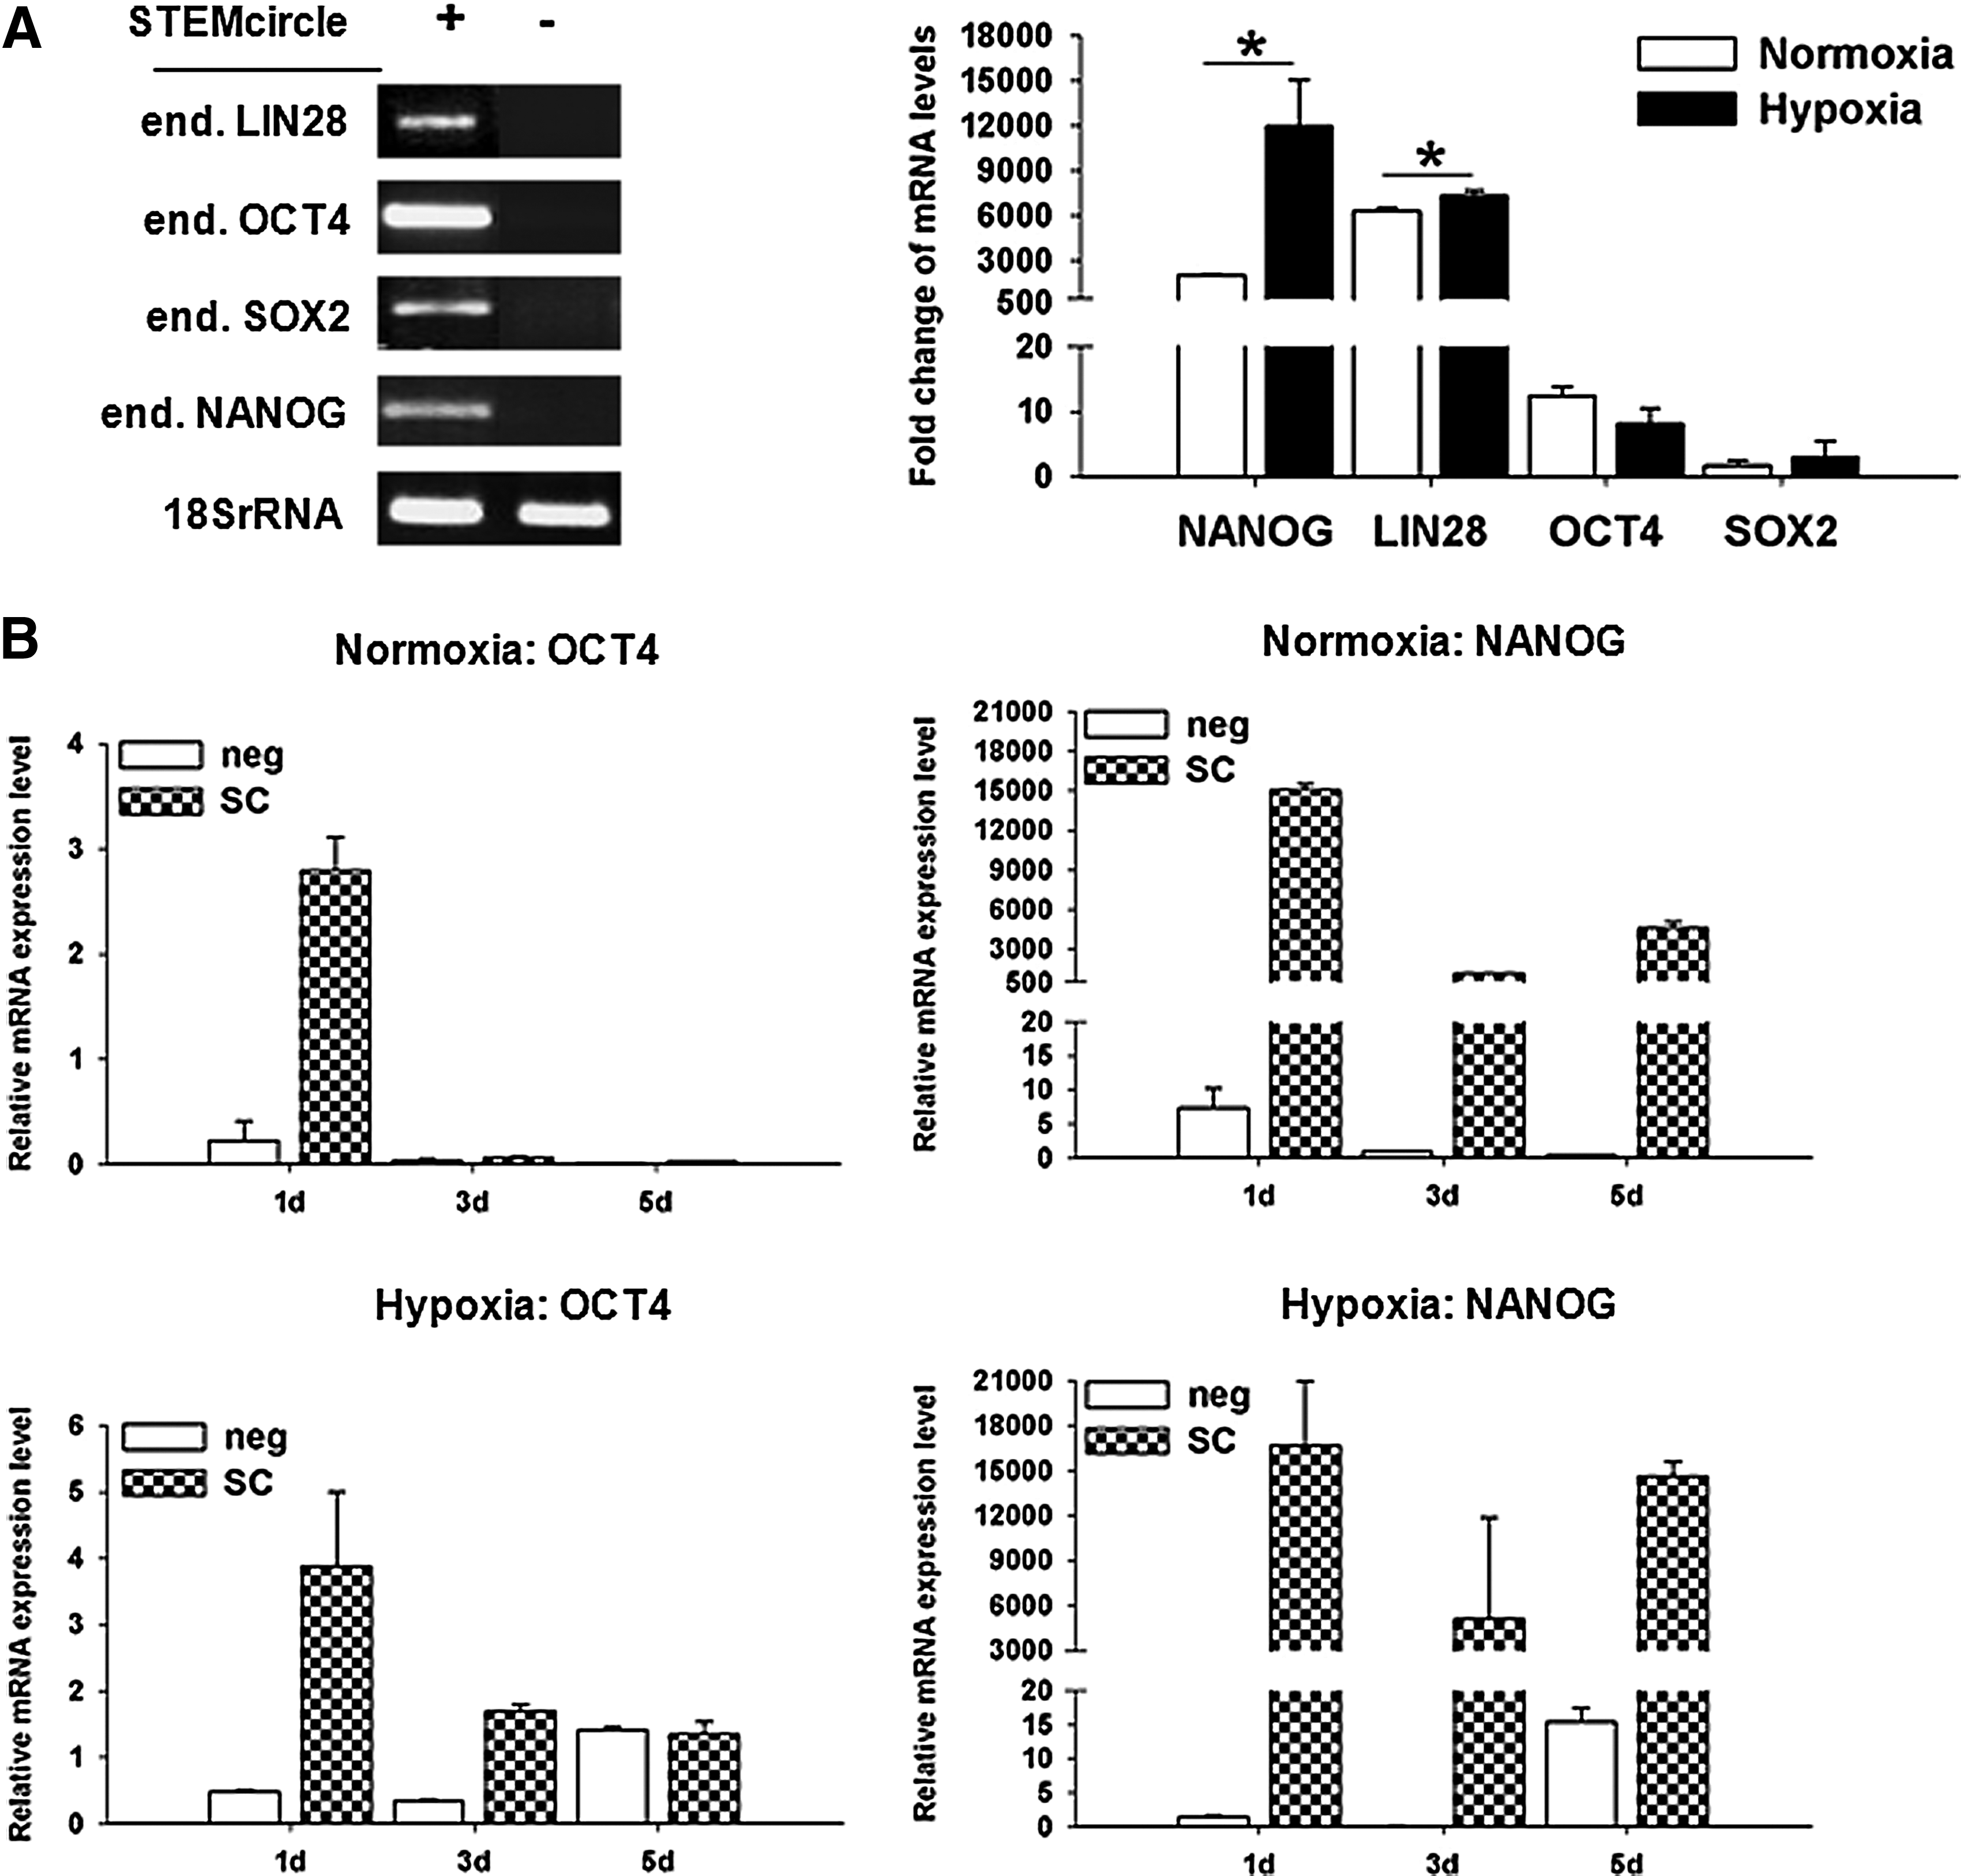
Hypoxia supports episomal, nonviral reprogramming when introducing the reprogramming factors OCT4, NANOG, SOX2, and LIN28 in L87 cells. (
Discussion
The goal of the study was to examine whether hypoxic culture conditions not only would enable expansion of MSCs while maintaining their multipotency, but also whether they would support induction of pluripotency. For this purpose, we examined the behavior of the human MSC line L87 and primary MSCs during hypoxic culture with or without supplementation of FGF2, known to maintain pluripotency in human ESCs.
We found that hypoxia (5% O2) alone was sufficient to preserve the MSC-specific morphology and to increase the population-doubling rate of primary bone marrow–derived MSCs. This is in agreement with findings by Grayson et al. (2007), who showed a clear link between 2% O2 and the enhancement of proliferation of MSCs from healthy individuals, and findings by Tsai et al. (2011) demonstrating inhibition of senescence and maintenance of MSC properties in the presence of 1% O2. Therefore, our data reveal that even less stringent, easily achievable hypoxic conditions result in an improvement of MSC culture. Supplementation of FGF2 further increased this effect consistent with a study by Ahn and co-workers (2009) showing FGF2-based increased proliferation of primary bone marrow–derived MSCs via transient activation of c-Jun amino-terminal kinase (JNK). In the present study, FGF treatment in conjunction with hypoxia induced DNA polymerase iota (Pol I) and minichromosome maintenance complex component 5 (MCM5), two factors crucial for DNA replication. Pol I and MCM5 were also examined during reprogramming of mouse fibroblasts and B lymphocytes using retroviral vectors and shown to be essential markers for the enhancement of proliferation during iPSC generation (Mikkelsen et al., 2008; Ruiz et al., 2011). In accordance, Ki67 expression, a more commonly used marker for cell proliferation, was increased in hypoxia-FGF2–treated cells, too.
Therefore, we hypothesized that hypoxia and FGF2 treatment may be sufficient to induce pluripotency in MSCs. It has been shown that hESCs cultured under hypoxic conditions (5% O2) for 3 days expressed higher levels of the pluripotency factors OCT4, NANOG, and SOX2 (Forristal et al., 2010). This induction was mediated by hypoxia-inducible factor (HIF) 2A. Likewise, Mathieu et al. (2011) revealed HIF2A and HIFB mediated induction of OCT4 and NANOG in the human lung adenocarcinoma cell line A549 cultured at 2% O2, whereas SOX2 was induced by HIF1A. The rate of OCT4- and NANOG-positive cells was low, but similar to those obtained by other reprogramming techniques such as retroviral, adenoviral, or DNA-free methods (Robinton and Daley, 2012). The induction of OCT4 and NANOG in human primary MSCs as well as in the human MSC cell line is concurrent with observations from Page and colleagues, who also described such induction after culture of human dermal fibroblasts under hypoxic conditions in combination with FGF2 supplementation (Page et al., 2009). In contrast to our observations, they described that glass surfaces were essential for the translation of pluripotency-associated transcription factors and their appropriate translocation to the nuclei of adult human fibroblasts. Again, this points toward a higher suitability of MSCs for reprogramming studies.
In contrast to hESCs (Forristal et al., 2010), SOX2 and LIN28, other pluripotency markers, were not induced in MSCs by hypoxia. Naturally, human ESCs and carcinoma cells harbor more pluripotency-associated properties than the multipotent MSCs, explaining the deviating results. On the other hand, primary MSCs used in our study either exhibited abundant expression of c-MYC and KLF4, which are routinely used for reprogramming strategies, or these two factors were easily induced by hypoxia alone. Recently, Nemajerova et al. (2012) suggested that there is a partial functional redundancy between SOX2 and KLF4. Therefore, SOX2 expression may not be a prerequisite for successful reprogramming of MSCs.
An important role in the acquisition and maintenance of pluripotency is played by miRs, small, noncoding RNAs that target mRNAs leading to their cleavage or translational repression. Several ESC-specific miRs have been identified, of which the miR-302 cluster is the most predominant in human ESCs and iPSCS (Kuo et al., 2012). In the MSC line L87, hypoxia and FGF2 supplementation led to the significant induction of all members of the miR-302 family in their pre-miR and mature forms. The same results were obtained using primary MSCs. Such induction of ESC-specific miRs is essential for successful reprogramming, and the efficiency of iPSC generation is significantly repressed upon miR inhibition (Chen et al., 2012). The miR-302 cluster is regulated by OCT4 (Liu et al., 2011). On the other hand, the miR-302 cluster positively regulates OCT4 expression by suppressing nuclear receptor subfamily 2, group F (member 2NR2F2), a member of the nuclear orphan receptor family of transcriptional repressors (Kuo et al., 2012).
Therefore, the induction of OCT4 seen in our study may in part be explained by the hypoxia-mediated induction of the hESC-specific miR-302, even though OCT4 is also directly induced by hypoxia via HIF2a (Covello et al., 2006). In addition to its possible effects on pluripotency factors, the miR-302 cluster also targeted genes involved transcriptional regulation, cell cycle–related G1/S transition, and methylation, such as KLF13, DNMT1, WDR61, and CYCLIN A1. WDR61 is a regulator of transcriptional processes and is involved in events downstream of RNA synthesis, such as RNA surveillance (Zhu et al., 2005). KLF13 is a member of the KLF-family of zinc finger transcription factors and binds GC-rich DNA in a sequence-specific manner (McConnell and Yang, 2010). The DNA methyltransferase DNMT1 is responsible for CpG methylation of the DNA during mitosis in adult cells. DNMT1 preserves the methylation status of the DNA and regulates gene expression (Qin et al., 2011). CYCLIN A1 is crucial for G1/S transition and for entering the M-phase of the cell cycle in vertebrates, especially in the germ line (Wolgemuth, 2011).
Finally, hypoxia also enhances and prolongs the effect of episomal vector–based reprogramming strategies. An episomal vector, such as the STEMcircles™-LGNSO used in this study, is able to induce crucial reprogramming factors such as OCT4 and NANOG only for a very short period of time (1 day). This impulse, even if strong, is not sufficient to generate stable iPSC clones in MSCs. In fact, the STEMcircles™-LGNSO reprogramming approach has only been optimal for human adipose stem cells (Joseph C. Wu, personal communication). Therefore, changing culture conditions to hypoxia and FGF2 supplementation may make this approach also available for those cell sources that previously have not been amenable for episomal reprogramming. In conclusion, this work emphasizes that it is possible to support reprogramming of adult somatic cells very efficiently by modifying the in vitro culture conditions.
Footnotes
Acknowledgments
The work presented in this paper was made possible by the Translational Centre for Regenerative Medicine (TRM) Leipzig funded the German Federal Ministry of Education and Research (BMBF, PtJ-Bio, 0315883). L87 cells were kindly provided by Prof. Stefan Burdach, Children Hospital, TU Munich. We are particularly grateful to Lutz Müller, Thomas Müller and Jana Lützkendorf, Department of Oncology/Hematology, Martin Luther University Halle-Wittenberg, for their support and provision of primary MSCs. Special thanks go to Corinna Giersberg for her assistance in FACS analyses.
Author Disclosure Statement
The authors Sabine Foja, Matthias Jung, Bernadette Harwardt, and Insa S. Schroeder declare that there are no conflicting financial interests. Oliver Pelz-Ackermann is employed at BD Bioscience.