
Abstract
Abstract
Our purpose was to investigate genes and molecular mechanisms involved in patients with Leber congenital amaurosis (LCA) and to model this type of LCA for drug screening. Fibroblasts from two unrelated clinically identified patients with a yet undetermined gene mutation were reprogrammed to pluripotency by retroviral transduction. These human induced pluripotent stem cells (hiPSCs) were differentiated into neural stem cells (NSCs) that mimicked the neural tube stage and retinal pigmented epithelial (RPE) cells that could be targeted by the disease. A genome-wide transcriptome analysis was performed with Affymetrix Exon Array GeneChip®, comparing LCA-hiPSCs derivatives to controls. A genomic search for alteration in all genes known to be involved in LCA revealed a common polymorphism on the GUCY2D gene, referenced as the LCA type I (OMIM *600179 and #204000), but the causative gene remained unknown. The hiPSCs expressed the key pluripotency factors and formed embryoid bodies in vitro containing cells originating from all three germ layers. They were successfully differentiated into NSC and RPE cells. One gene, NNAT, was upregulated in LCA cell populations, and three genes were downregulated, GSTT1, TRIM61 and ZNF558, with potential correlates for molecular mechanisms of this type of LCA, in particular for protein degradation and oxidative stress. The two LCA patient-specific iPSC lines will contribute to modeling LCA phenotypes and screening candidate drugs.
Introduction
In most cases, there is only rudimentary understanding of the molecular mechanisms leading to retinal degeneration in LCA. Animal models are available for modeling some mutations, including chicken (Perrault et al., 2000), mouse (Batten et al., 2004; Dyer et al., 2004; Ramamurthy, 2004; Redmond et al., 1998; Rolling, 2004; Yang et al., 1999), dog (Aguirre et al., 1998), and zebrafish (Stiebel-Kalish et al., 2012), but there is clearly a need for in vitro models that would allow exploration of pathological mechanisms in vitro and could be used in a search for treatment. Induced pluripotent stem cells (iPSCs) produced by genetic reprogramming of somatic cells from human donors could be of interest, because of a clinical phenotype or an identified disease-related mutation (Takahashi et al., 2007), and may be a unique tool to meet those challenges. Indeed, iPSCs have been proposed as an inexhaustible source of cells (Stadtfeld and Hochedlinger, 2010; González et al., 2011) because of their similarities in capacites of self-renewal and pluripotency to embryonic stem cells (ESCs) (Thomson et al., 1998). Moreover patient-specific iPSCs have been derived as sources for drug screening, toxicology, and cell replacement therapy, as well as generating disease models (Chun et al., 2011). These cells could provide a valuable tool for exploring LCA because cells of interest for the pathology, like neural stem cells (NSCs) and RPE cells, can be generated. Quite particularly, hiPSCs derivatives that are obtained after only a few weeks of differentiation may open the possibility for studying early developmental defects associated with LCA that occur well before the retina is functional, and thus allow us to identify initial mechanisms that may eventually lead over time to cell dysfunction and death.
The present study was undertaken to establish a human patient-specific model of LCA that could be harnessed for exploring molecular mechanisms associated with the disease. We report the generation of disease-specific hiPSCs from clinically affected LCA patients with a yet unknown mutation. Human iPSCs differentiation into NSCs and RPE cells at near-homogeneity has allowed us to perform a whole-genome transcriptomic analysis that revealed differential expression of four genes, the dysfunction of which may be associated with early developmental defects in this form of LCA.
Material and Methods
Human cell sources
Two LCA fibroblast lines and one normal fibroblast line were purchased from the Coriell Institute (Camden, NJ, USA). The mutated GM03852 line was established from a 2-year-old Caucasian female and the mutated GM05300 from a 9-year-old Caucasian male. The WT cells GM04603 were derived from an adult Caucasian male. The other normal adult fibroblastic CRL2097 (46,XY) and normal adult RPE and ARPE-19 cell lines were purchased from the American Type Culture Collection (ATCC, France).
Mutation detection
The two LCA fibroblast lines, GM03852 and GM05300, were sent to Asper Ophtalmics (Asper Biotech, Tartu, Estonia) to determine which mutations were expressed in those cells. LCA microarray chips containing 641 disease-associated sequence variants associated with LCA or early-onset retinitis pigmentosa genes were used.
Production of retroviral vectors using Platinum-A cells
The Platinum-A Retroviral Packaging Cell Line, Amphotropic (Plat-A cells, Cell Biolabs, San Diego, CA, USA) was maintained in “Plat-A medium” consisting of Dulbecco's modified Eagle medium (DMEM)+GlutaMAX II (High Glucose) supplied with 10% fetal bovine serum (FBS), 1 mM sodium pyruvate, and 50 μM 2-mercaptoethanol (all from Invitrogen, France). The Platinum-A cells were seeded (150,000 cells/cm2) on 0.1% gelatin-coated (Sigma Aldrich, St. Louis, MO, USA) cell culture dishes (TPP, St. Louis, MO, USA). Ten micrograms of pMIG-OCT4, pMIG-KLF4, pMIG-c-Myc, and pMIG-SOX2 (Addgene, Cambridge, MA, USA) were transfected into viral packaging Plat-A cells using FuGENE (Roche, France). Supernatants were collected 48 h posttransfection and filtered through a 0.45-μm pore size filter and supplemented with 4 μg·mL−1 of Polybrene (Sigma Aldrich). The “retroviral mix” contained viral supernatants mixed at a 1:1:1:1 ratio.
Reprogramming of human fibroblasts
All fibroblast lines were cultured using DMEM High Glucose supplemented with 10% FBS (both from Thermo Fisher Scientific, France), 1 mM sodium pyruvate, 1×minimum essential medium (MEM) nonessential amino acids (NEAA), 2 mM
Culture of hiPSCs
The hiPSC colonies were picked under a stereomicroscope (Vision Engineering Ltd., France) according to their hESC-like colony morphology. They were expanded on to mitomycin C–inactivated Zenith Mouse Embryonic Fibroblast (MEF) layer feeders (IVFonline.com) seeded at 25,000/cm2. They were fed daily with “iPS medium.” Cells were manually passaged once a week under the stereomicroscope increasing the passage by one every week.
Differentiation protocols
Embryoid bodies
To form embryoid bodies (EBs), hiPSC colonies were mechanically detached from the MEF layer under a stereomicroscope (Vision Engineering Ltd.) and cultured in suspension into ultra-low-attachment culture dishes (Corning, France) in DMEM/F12 (1:1) GlutaMAX medium (Invitrogen) supplemented with 20% FBS (Thermo Fisher Scientific), 1×MEM NEAA, and 0.05 mM 2-mercaptoethanol (both from Invitrogen). Medium was changed every 2–3 days and EB were cultured for 3 weeks.
Neural stem cells
To establish NSCs, hiPSC colonies were mechanically harvested from the MEF layer under a stereomicroscope, resuspended into small clumps in low-attachment culture dishes, and cultured using DMEM/F12 (1:1) GlutaMAX medium containing Neurobasal medium (1:1) supplemented with 2% B27 supplement without vitamin A, 1% N2 supplement, and 0.05 mM 2-mercaptoethanol (all from Invitrogen) for 6 h at 37°C, 5% CO2 to remove feeder factors. This medium was called “N2B27 medium.” To induce neuroepithelial cells (NEP) formation, clumps were seeded on 0.0015% poly-
Retinal pigmented epithelial cells
To establish RPE cells, hiPSCs were cultured on feeders for 1 week until they reached confluence, after which medium was removed and cells were cultured with DMEM+GlutaMAX II (High Glucose) containing 20% KnockOut™ SR (all from Invitrogen) without FGF2. This medium was called “RPE medium.” Pigmented areas begun to appear within 2 weeks and were allowed to expand until they reached a few millimeters (1 more week), with medium changes twice a week. Pigmented areas were mechanically dissected under a stereomicroscope using a needle and then placed on 1:30 Matrigel-coated (BD Matrigel™ Basement Membrane Matrix, BD Biosciences, France) plate. This first passage was called P0. Medium was changed twice a week until 100% confluence was reached. Then cells were dissociated in 0.05% trypsin-EDTA and seeded on Matrigel at a density of 100,000 cells/cm2. This passage was called P1. The cells were cultured in DMEM+GlutaMAX II (High Glucose) containing 4% KnockOut™ SR. The normal adult RPE cell line ARPE-19 was used as positive control in phagocytosis assays. It was cultured with DMEM/F12 (1:1) GlutaMAX medium supplemented with 10% FBS, 0.02 mM
Alkaline phosphatase staining
Alkaline phosphatase (AP) staining was performed using Sigma FAST™ 5-bromo-4-chloro-3-indolyl phosphate/nitro blue tetrazolium (BCIP/NBT) Tablets (Sigma Aldrich) according to manufacturer's protocol.
Karyotype analysis
Actively growing hiPSC colonies (80% confluency) were treated with colchicine (20 mg·mL−1, Eurobio, France) for 90 min at 37°C. Cells were dissociated with 0.05% trypsin-EDTA, incubated in 0.075 M KCl (Sigma Aldrich) for 10–14 min at 37°C, followed by fixation with 3:1 methyl alcohol/glacial acetic acid. For multicolor fluorescence in situ hybridization (mFISH) karyotyping, fixed cells were hybridized overnight at 37°C with a denatured cocktail painting mFISH probe (MetaSystems, Altussheim, Germany). Slides were washed in successive baths of 1× SSC and 0.4× SSC, and nuclei were stained with 2.5 ng of 4′,6-diamidino-2-phenylindole (DAPI, 250 ng·mL−1, MetaSystems). Biotinylated probes were revealed using Cy5 MetaSystems B-tect detection kit (MetaSystems). Ten to 20 metaphases were captured using a Zeiss Z1 fluorescence microscope equipped with a UV HBO 100-W lamp coupled to an AxioCam camera (both from Carl Zeiss, France) and 20× and 63× objectives. All the analyzed metaphases were karyotyped using the MetaSystems Isis software (MetaSystems).
Immunocytochemistry analysis
Cells were fixed for 20 min at room temperature with 4% paraformaldehyde (Euromedex, France). After three phosphate-buffered saline (PBS; Sigma Aldrich) washes, cells on dishes were blocked with a saturating solution consisting of PBS/0.6% Triton X-100/1% bovine serum albumin (BSA) (all from Sigma Aldrich) and incubated overnight at 4°C with the primary antibodies. The mouse monoclonal anti-Oct3/4 (Santa Cruz Biotechnology, Inc., Santa Cruz, CA, USA) was used at 1:500 to determinate the pluripotency state. To characterize NSCs and neuron-derived NSCs, these primary antibodies were used at 1:500—mouse monoclonal anti-Nestin (clone 10C2, Millipore, Billerica, MA, USA), rabbit polyclonal anti-Sox2 (Millipore), 1:200 mouse monoclonal anti-human HuC/HuD neuronal protein (clone 16A11, Invitrogen), which recognized the expressed product of the ELAVL3/ELAVL4 genes, and 1:2000 mouse monoclonal anti-Neuronal Class III β-tubulin (TUJ1 also known as TUBB3, Eurogentec, Belgium). Finally, the following primary antibodies—rabbit polyclonal ZO-1 (Invitrogen) 1:50, a tight junction marker and mouse monoclonal anti-microphthalmia-associated transcription factor MITF (clone D5, Dako France S.A.S, France) 1:200—were used to characterize the RPE cells. Secondary antibodies were goat anti-mouse or goat anti-rabbit Alexa-Fluor-488 and Alexa-Fluor-555 used at 1:500. Nuclei were visualized with 1:10,000 DAPI (all from Invitrogen). Specificity of staining was tested by omission of the primary antibodies. Immunofluorescence analysis was performed using an inverted phase-contrast fluorescence microscope Axiovert 40 CFL, and images were processed using the Axio-vision software (Zeiss, France).
Functional testing of RPE cells by phagocytic activity detection
One day before the phagocytic activity detection, RPE cells were seeded at 100,000 cells/cm2 on 1:30 Matrigel-coated plates and cultured into “RPE medium.” The day after, the medium was removed and the RPE cells were incubated for 1–3 h with photoreceptor outer segments (POS). Adapted from (Molday et al., 1987), porcine POS were isolated and coupled with the fluorescein isothiocyanate (FITC). After washing to remove unbound porcine POS, cells were fixed for 20 min at room temperature with 4% paraformaldehyde and nuclei were visualized with DAPI staining. The ARPE-19 cell line was used as a positive control for phagocytic activity and RPE cells in the absence of POS were used as a negative control. Phagocytosis of FITC-POS was measured on an Arrayscan VTI HCS Reader (Thermo Scientific Cellomics, France). Data were collected with vHCS Scan software package, version 6.6.1.4 (Thermo Scientific Cellomics). Pictures were acquired with a 20× objective in high-resolution camera mode and were analyzed based on the ‘‘Colocalization’’ bioapplication. The first channel was used for nucleus identification (DAPI staining) and the second channel was used to identify FITC-POS (based on intensity thresholds and segmentation parameters). The detection of total phagocytic activity was done by measuring on 3000 cells in a well, detected by DAPI staining, the number of cells having at least one FITC-POS. To quantify total phagocytic activity, this number was divided by the number of cells, which gave us the phagocytic index.
Molecular characterization techniques
Total RNA extraction and reverse transcription
Total RNAs were extracted from cells of interest using RNeasy Protect Mini Kit (Qiagen, France) according to the manufacturer's protocol. An on-column DNase I digestion was performed to avoid genomic DNA amplification. RNA yields and quality were checked with a NanoDrop spectrophotometer (Thermo Fisher Scientific, Wilmington, DE, USA). Complementary DNAs (cDNA) were synthesized from 500 ng of total RNA using SuperScript® III reverse transcription kit (Invitrogen) following manufacturer's recommendations. cDNAs synthesized were then diluted at 1/10 in DNase-free water before performing real-time quantitative PCR.
Real-time quantitative PCR by SYBR Green detection
Quantitative PCR (qPCR) analyses for transgene expression and RPE cell characterization were performed on P96-well plates using a LightCycler® 480 SYBR Green I Master and SYBR Green PCR Master Mix (both from Roche, Basel, Switzerland) following the manufacturer's instructions. qPCR analyses for NSC characterization and transcriptome analysis validation were performed on P384-well plates using Power SYBR® Green PCR Master Mix and the Applied Biosystems 7900HT Fast Real-Time PCR System (both from Applied Biosystems, Foster City, CA, USA). This began with an initial denaturation step at 95°C for 5 min, followed by 50 cycles of denaturation at 95°C for 15 sec, annealing at 60°C for 15 sec, and extension at 72°C for 15 sec. Quantification of gene expression was based on the δ cycle threshold (δCt) method and normalized to 18S expression. Melting curve analysis was used to determine the specificity of PCR products. For the transcriptome analysis validation when a Ct was undetermined the Ct value was fixed at 45. Primers used are listed in Table 1.
qPCR by TaqMan® Low Density Array (TLDA) card
qPCR analysis was performed using TaqMan® Human Stem Cell Pluripotency Arrays, TaqMan® Gene expression Master Mix, and the Applied Biosystems 7900HT Fast Real-Time PCR System (all from Applied Biosystems) following the manufacturer's instructions. qPCR was run at similar conditions as described above. The distance from the gene signal in a given sample to the corresponding average in all the samples was calculated for each regulated gene. The Ct value for a referred gene is reversely related to its RNA level. We chose to display −δCt values using dChip software from the Cheng Li Lab of Computational Genomics (Harvard School of Public Health & Dana-Farber Cancer Institute, Boston, MA, USA); the downregulated genes in the heat map are shown in green and upregulated genes are shown in red for the sample considered.
Transcriptome analysis
Sample quality control, preparation, hybridization, and data quality control
Affymetrix Human Exon 1.0 ST arrays were hybridized by GenoSplice technology (www.genosplice.com) according to the Ambion WT protocol (Life Technologies, France) and Affymetrix (Santa Clara, CA, USA) labeling and hybridization recommendations. Briefly, 100 ng of total RNA was first mixed with bacterial transcripts, and the mixture was reverse transcribed into cDNA. After synthesis of double-stranded cDNA, an in vitro transcription reaction was conducted overnight. Resulting amplified cRNAs were reverse transcribed into sense DNA incorporating deoxyuridine triphosphate (dUTP). This single-stranded DNA was treated with a combination of uracil DNA glycosylase and apurinic/apyrimidinic endonuclease 1. DNA fragments were biotin-labeled by terminal deoxynucleotidyl transferase. Targets were finally prepared according to the Affymetrix recommendations for hybridization of exon arrays. Microarrays were hybridized, washed, and scanned using Affymetrix instruments. Total RNAs RNA integrity number (RIN) values were between 7.8 and 10 (average, 9.22). Raw data were controlled with Expression Console (Affymetrix).
Data analyses
Affymetrix Human Exon 1.0 ST Array dataset analysis and visualization were made using EASANA® (GenoSplice technology), which is based on the GenoSplice's FAST DB® annotations (De la Grange et al., 2005, 2007). Exon array data expressed in log2 scale were normalized using quantile normalization. Background correction was made by using the antigenomic probes, and probe selection was made as described previously (De la Grange et al., 2010). Only probes targeting exons annotated from FAST DB® transcripts were selected to focus on well-annotated genes whose mRNA sequences are in public databases (De la Grange et al., 2005, 2007). Among these selected probes, bad-quality probes (e.g., probes labeled by Affymetrix as “cross-hybridizing”) and probes with a too low-intensity signal compared to antigenomic background probes with the same GC content were removed from the analysis. Only probes with a detection above background (DABG) p value ≤0.05 in at least half of the arrays were considered for statistical analysis. (De la Grange et al., 2010). Only genes expressed in at least one compared condition were analyzed. To be considered as expressed, the DABG p value had to be ≤0.05 for at least half of the gene probes. We performed a Student t-test to compare gene intensities in the different biological replicates. Genes were considered significantly regulated when fold-change was ≥1.5 and p value ≤0.05.
Hierarchical clustering
The distance from the gene signal in a given sample to the corresponding average in all the samples was calculated for each regulated gene. Corresponding values were displayed and clustered with MeV4.6.2 from The Institute of Genome Research using Pearson correlation and average linkage clustering.
Results
LCA mutation analysis
LCA microarray chips containing 641 disease-associated sequence variants associated with LCA or early-onset retinitis pigmentosa genes were used to assay fibroblasts GM03852 and GM05300. No previously identified LCA mutations were detected, but a G-to-T switch was observed in both unrelated samples at position 154 on exon 2 of guanylate cyclase 2D (GUCY2D). Human iPSC lines were generated from the two patients' GM03852 and GM05300 fibroblasts (at passage 7 and 6, respectively), with one and four clones obtained, respectively (see Supplementary Figure S1A–C) (Supplementary Data are available at www.liebertpub.com/cell/.) Control hiPSC lines were generated in parallel from CRL2097 and GM04603 WT fibroblasts (further noted as WT-hiPSCs). Full quality control and characterization were performed on all the clones, which confirmed successful reprogramming (Supplementary Figure S1D–H).
Differentiation of neural derivatives
All experiments were conducted in at least three independent cultures for each hiPSC clone, WT and LCA hiPSCs being systematically treated in parallel. There was no difference between WT and LCA cells at any time during the process in terms of their morphology, proliferative activity, rate of differentiation, or expression of specific markers of the various stages of differentiation.
To obtain neural derivatives, hiPSCs were first induced to produce neural rosettes by the combination of human Noggin, SB431542, and FGF2 (Fig. 1A, B), and were selected mechanically at 1 week and replated to obtain homogeneous populations of NSCs. Cells progressively detached from the rosettes over days and spread out. Homogeneous NSC populations were grown for four passages (Fig. 1C). When incubated with BDNF, those NSCs gave rise to neuronal networks (Fig. 1D). NSCs were immunoreactive for the early neural markers NES and SOX2 (Fig. 1E). RT-qPCR confirmed that they expressed the neural markers SOX1 and PAX6, but also revealed the neural crest marker SNAI2 (snail homolog 2 Drosophila, marker of neural crest, also known as SLUG), MSI1 (musashi homolog 1 Drosophila also known as Musashi), and NES during NSC derivation from LCA-hiPSCs (noted as LCA-NSC) (Fig. 1F). Neurons derived from NSCs were immunopositive for SOX2, tubulin β3, and HuC/HuD in a part of neuronal population (Fig. 1G, H).
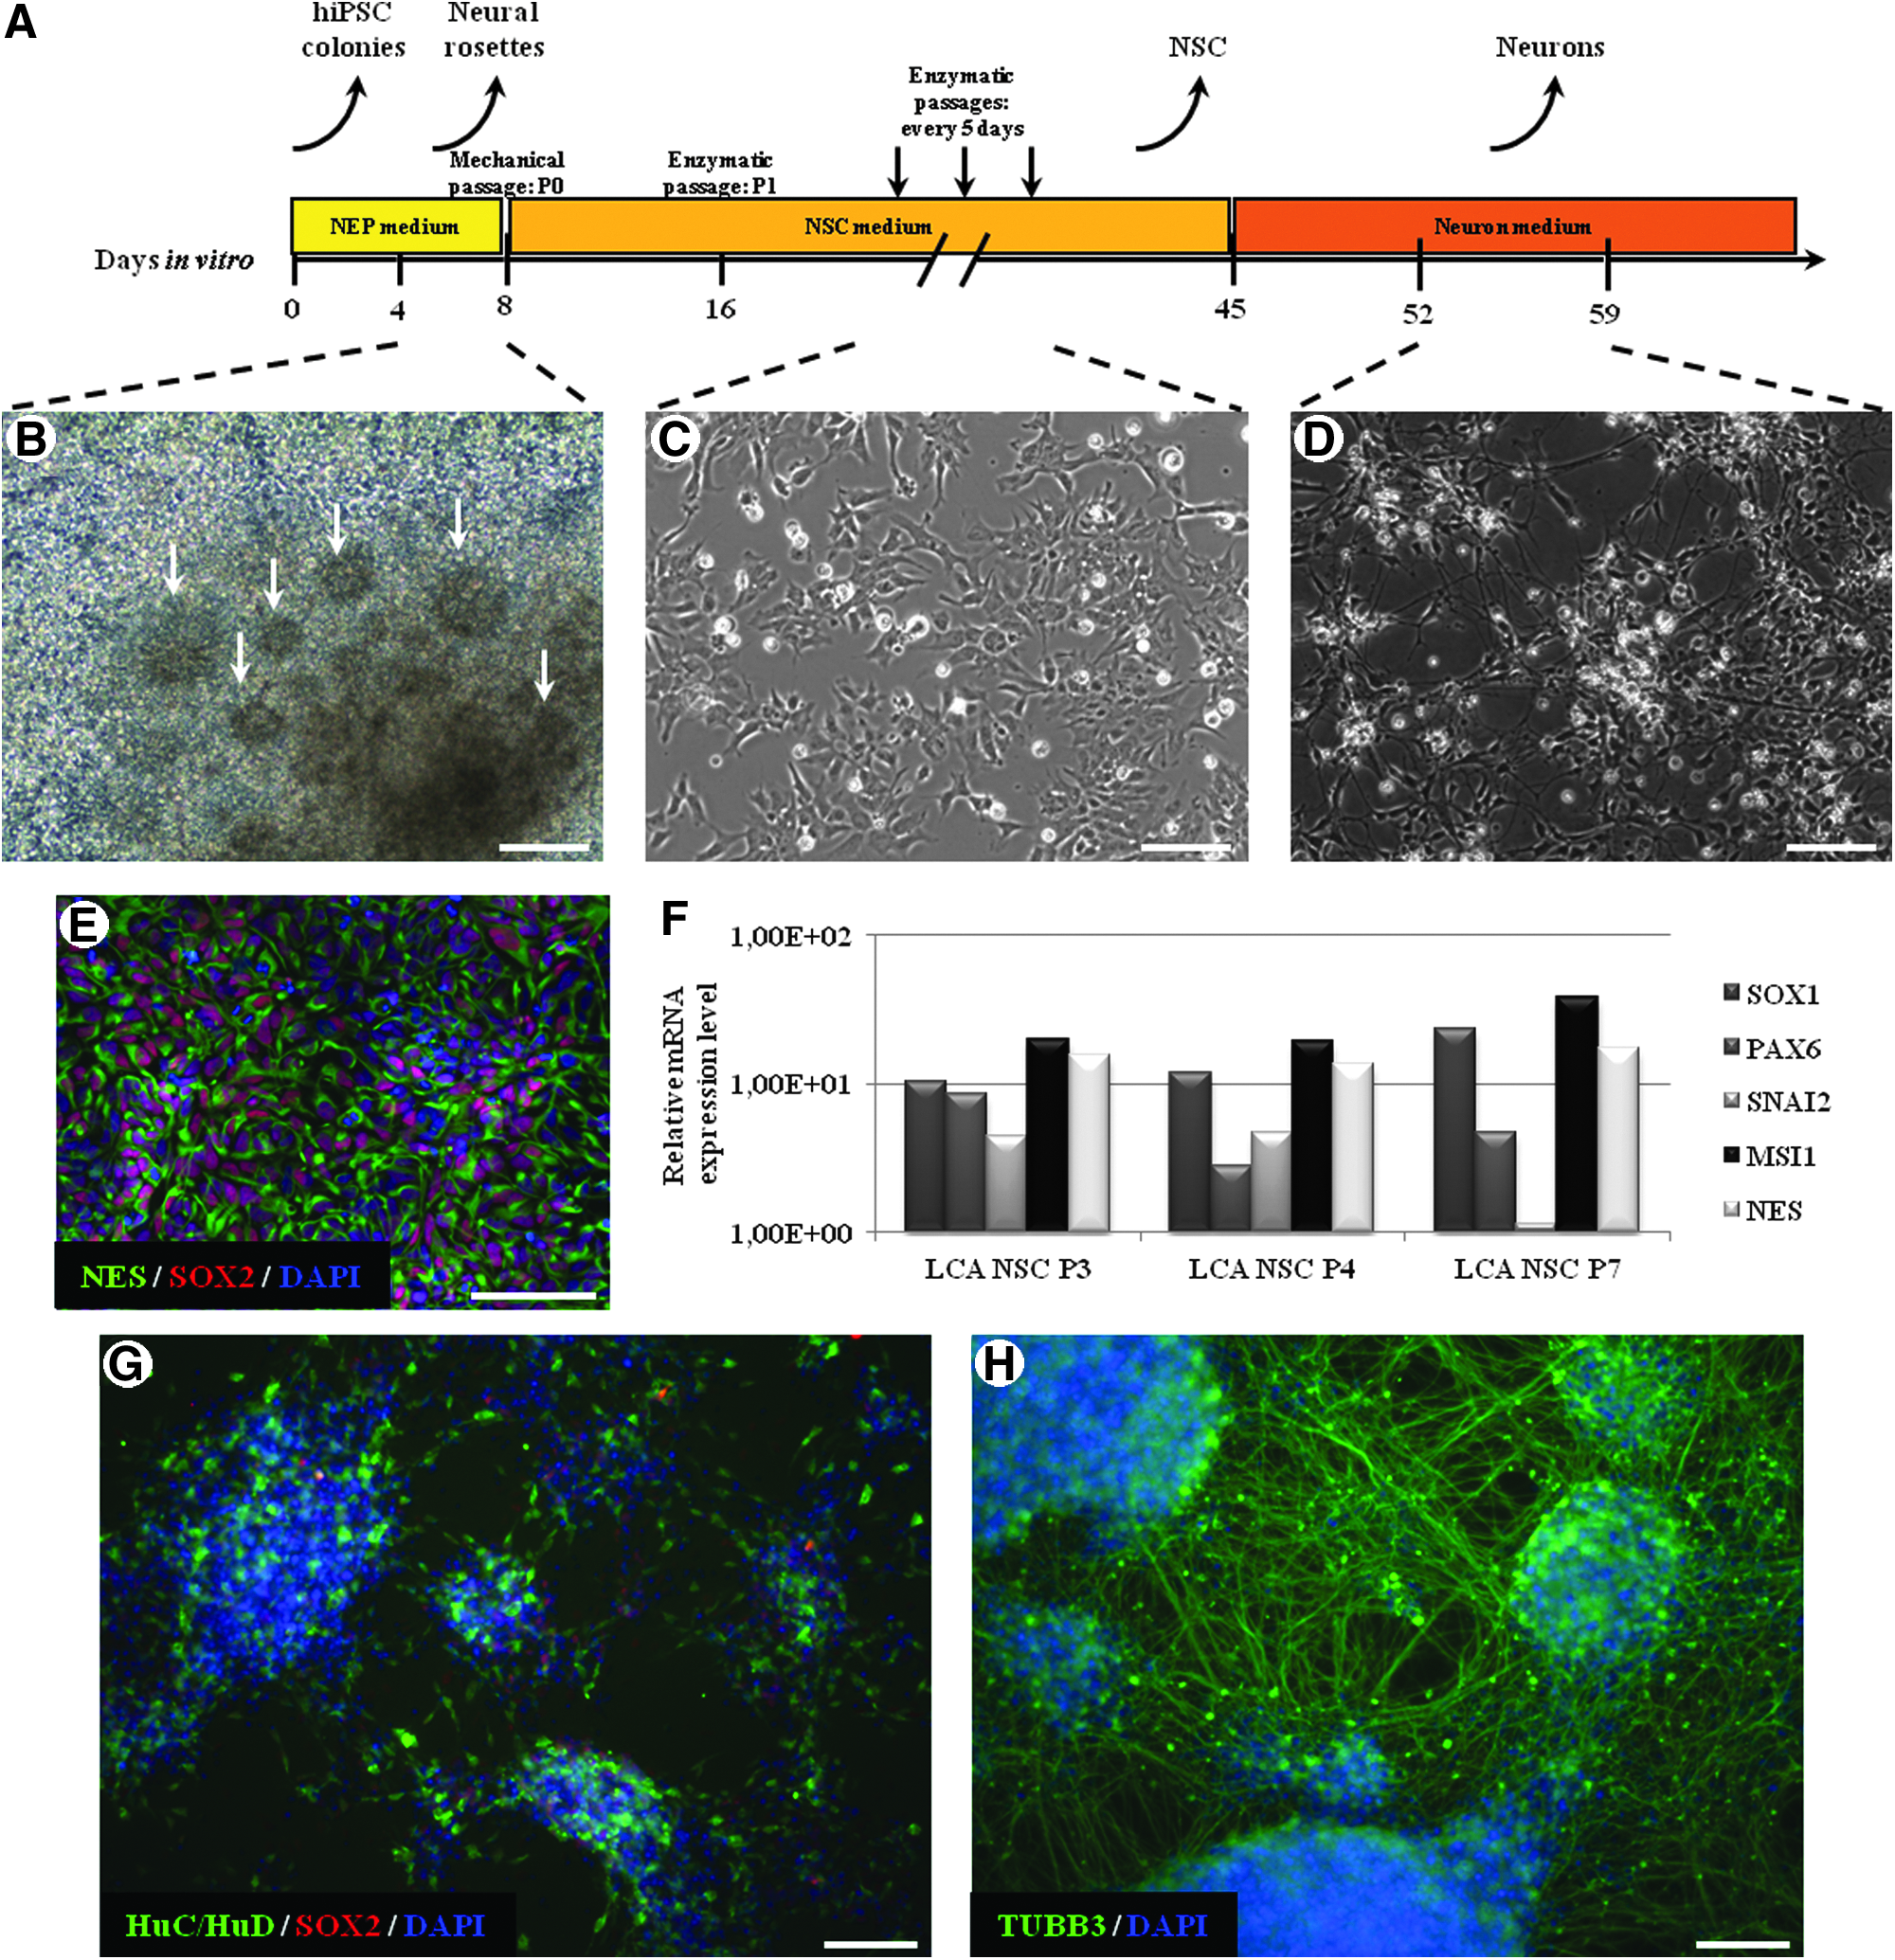
Generation and characterization of NSCs and differentiation into neurons. (
Differentiation of retinal derivatives
To obtain retinal derivatives, FGF2 was removed from hiPSC cultures (Fig. 2A). Pigmented areas appeared spontaneously over the following weeks (Fig. 2B) and were mechanically selected and replated at high density (10–15 clumps/cm2) on Matrigel. They formed a cell monolayer that displayed the classical cobblestone morphology of a RPE cell sheath (Fig. 2C). Most cells were immunoreactive for the specific transcription factor for melanogenesis, MITF, and cell-to-cell interfaces were lined by ZO-1, a tight junction marker of the retinal epithelium (Fig. 2D). RT-qPCR analysis complemented the phenotypic identification of RPE cells by revealing expression of PAX6, RPE65 (retinal pigment epithelium-specific protein 65kDa), BEST1 (bestrophin 1), and MITF (Fig. 2E). The RPE cells were functional, as demonstrated by their capacity at phagocytosing photoreceptor fragments (Fig. 2F).

Generation and characterization of RPE cells. (
Whole-genome differential transcriptomic analysis
Two transcriptome analyses were performed, the first one between LCA-NSCs (n=9) and WT-NSCs (n=11) and the second one between LCA-RPE (n=9) and WT-RPE (n=4) cells (Fig. 3A). Affymetrix Human Exon 1.0 ST Array dataset analyses (32,778 tested genes) revealed 413 genes expressed for LCA-NSC populations and 188 genes expressed for LCA-RPE cells, with those having a p value ≤0.05 and a fold change ≥1.5. Among these genes, 21 were expressed in both types of LCA derivatives (Table 2). One upregulated gene, neuronatin (NNAT), and three downregulated genes, tripartite motif containing 61 (TRIM61), zinc finger protein 558 (ZNF558), and glutathione S-transferase theta 1 (GSTT1), were chosen because they exhibited the highest fold-change (between 2.28 and 8.84) (Table 2). In addition, results obtained by the transcriptome analysis for these four genes were fully validated by RT-qPCR analysis (Fig. 3B).
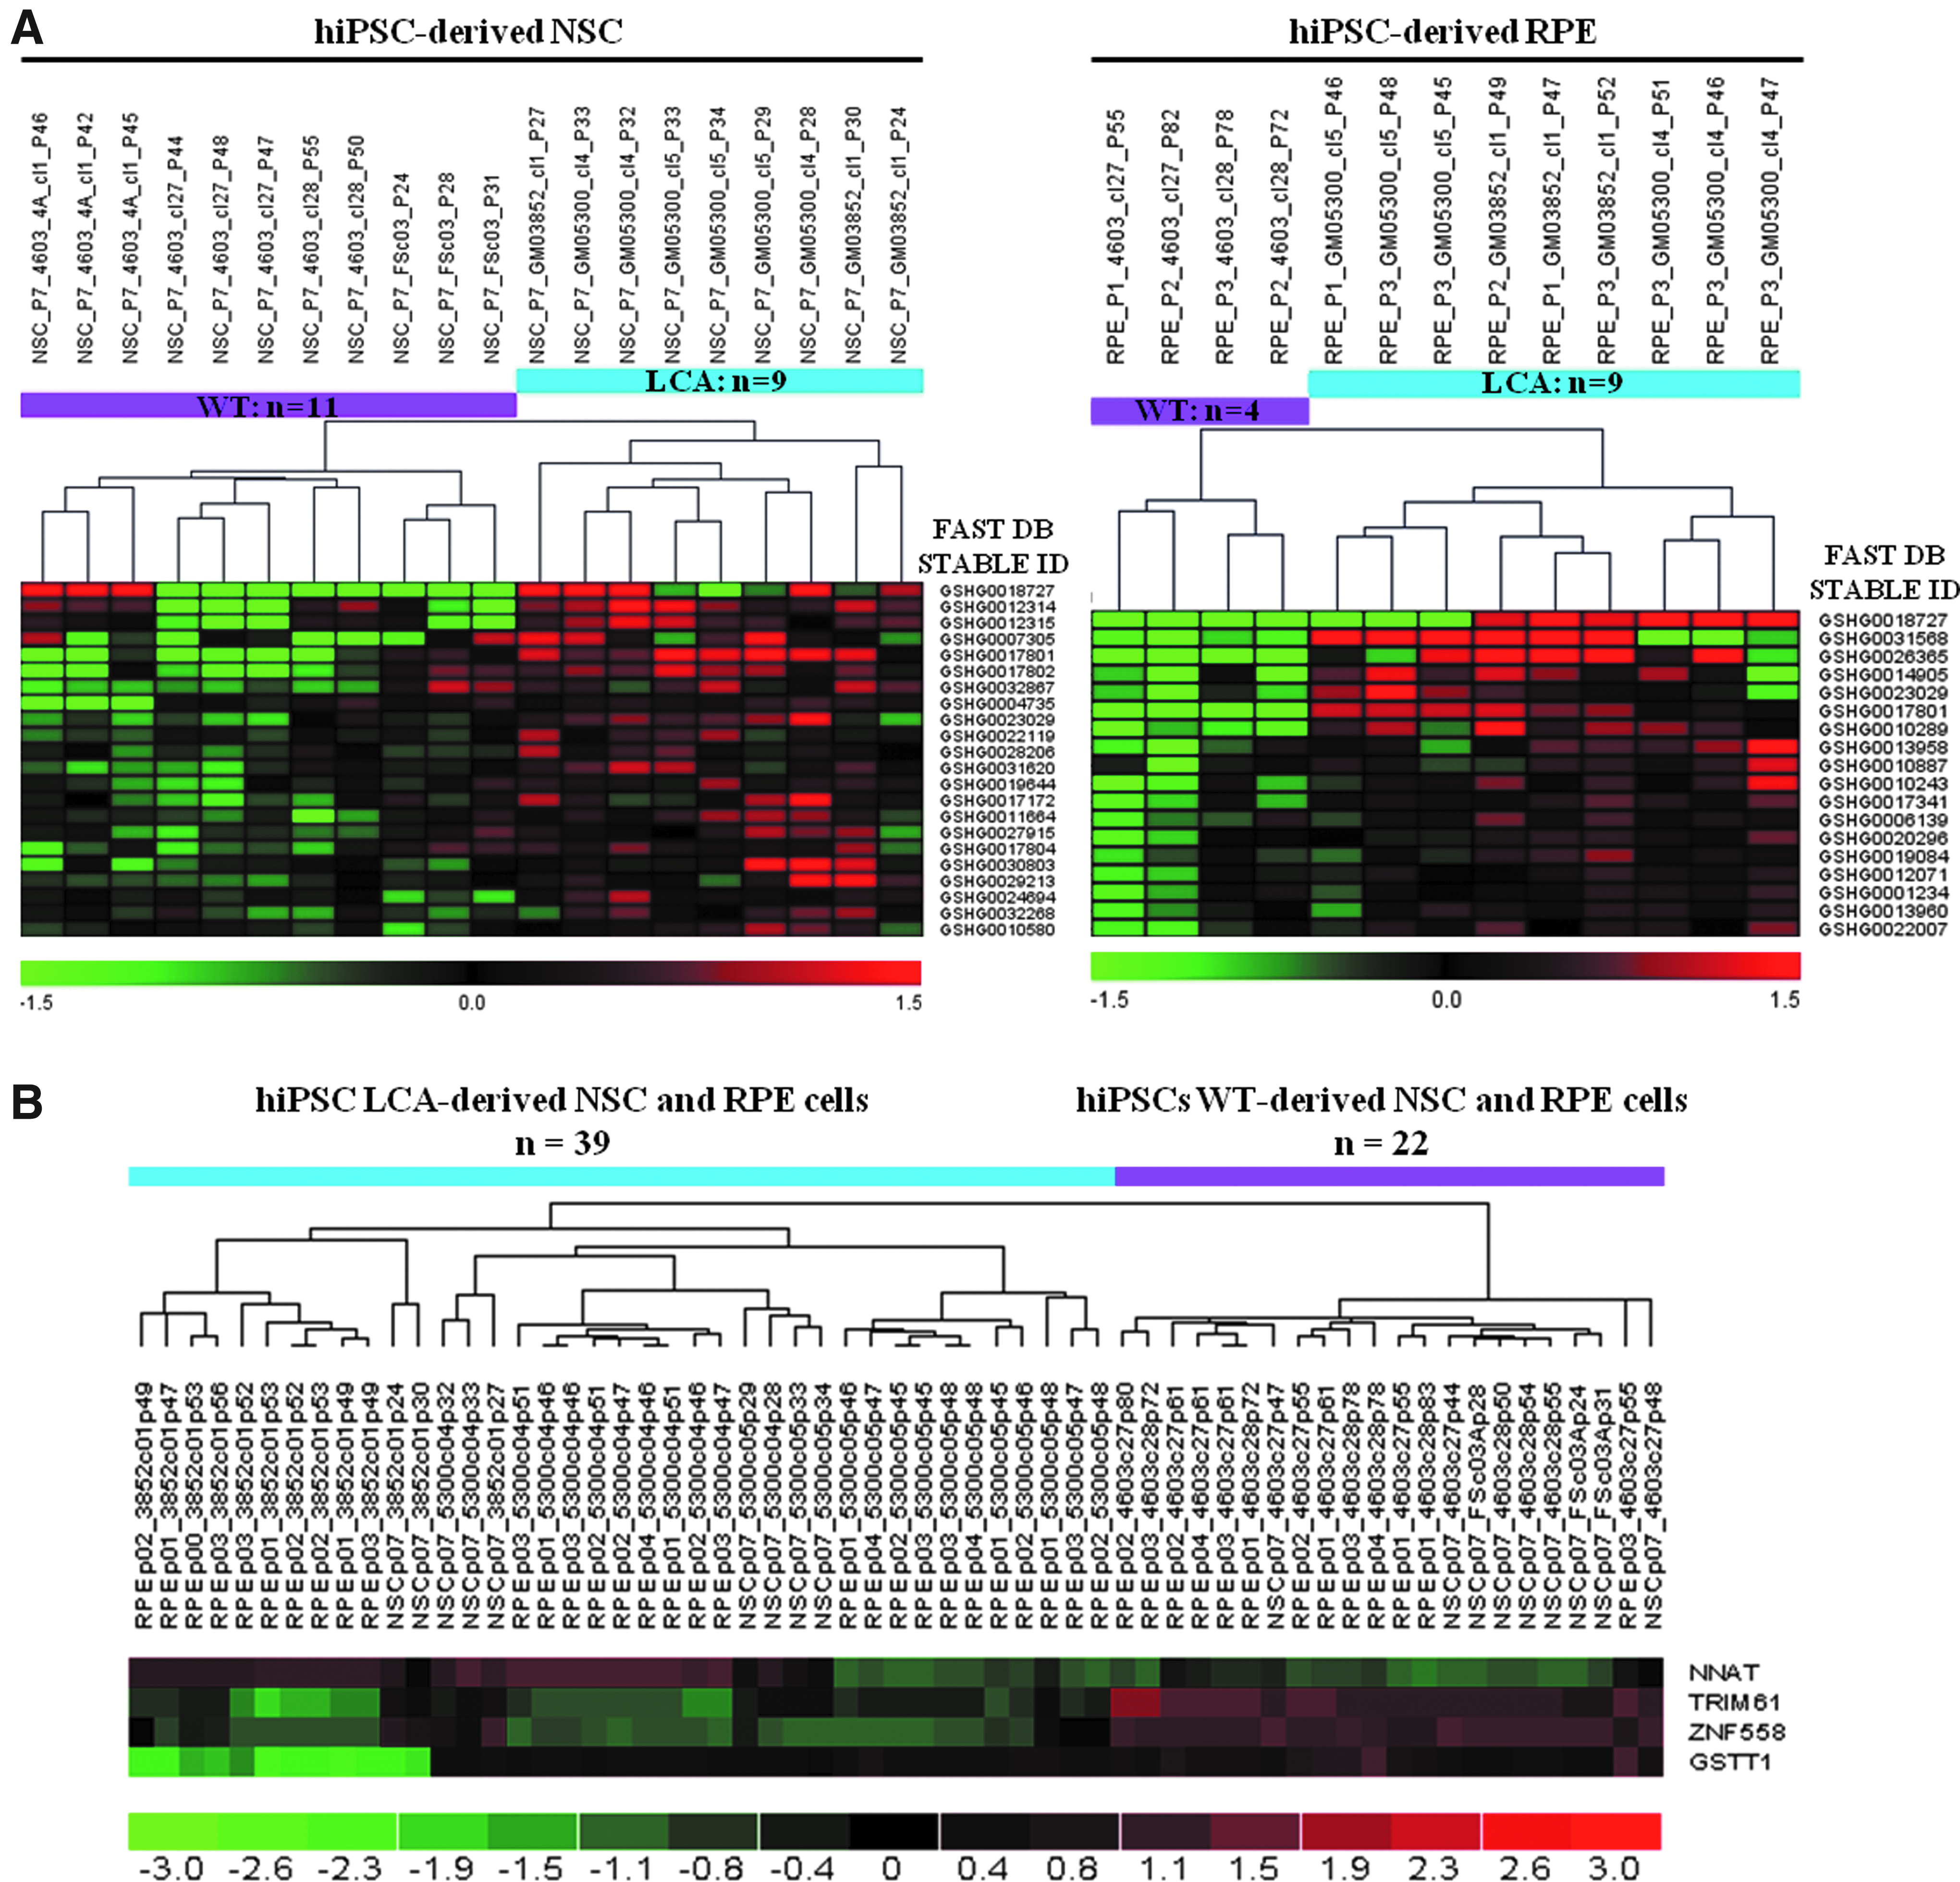
Transcriptome analysis. (
LCA, Leber congenital amaurosis; hiPSCs, human induced pluripotential stem cells; NSCs, neural stem cells; RPE, retinal pigmented epithelial cells.
Discussion
The main objective of this study was to derive human pluripotent stem cell lines that would provide a biological resource for studying molecular mechanisms associated with LCA in vitro. The reprogramming of fibroblasts from two clinically affected patients has allowed us to derive relevant neural and retinal cell derivatives and the differential transcriptomic analysis, which relative to WT equivalents has revealed a set of four genes that were significantly at variance in the mutant cells. These gene defects might suggest an early developmental consequence of LCA, in particular for protein degradation and oxidative stress.
The hiPSC lines explored in the present study were obtained by reprogramming commercially available fibroblasts that originated from two unrelated patients who clearly demonstrated a clinical LCA syndrome, with poor vision, high hyperopia, and nystagmus and for the male patient an ERG in both eyes under both photopic and scotopic conditions. The mutation described in our results had not been associated with LCA previously and was therefore not recovered in the set tested in our study that included only registered mutations. However, both patients exhibited a G-to-T transition in exon 2 of the membrane, retina-specific guanylate cyclase 2D, GUCY2D, a gene that is responsible for the type I of LCA (OMIM *600179 and #204000). This G-to-T transition had already been reported in patients with LCA, but its presence as a common polymorphism, with G found up to 59.307% (1300/2192 tested) and T found up to 40.693% (892/2192 tested) (genome.ucsc.edu, rs61749665) (Perrault et al., 1996), making its causal role in LCA questionable.
The derivation of human LCA-iPSCs from mutant fibroblasts may represent an ideal in vitro model because it permits the production of patient and disease-specific specialized cells to correlate gene default to pathological phenotype (Colman, 2008; Yoshida and Yamanaka, 2010). Indeed, it has been reported that patient-specific iPSCs were generated successfully for several genetic disorders and diseases (Wu and Hochedlinger, 2011), with several groups showing disease-specific phenotypes in iPS-derived cells (Ebert et al., 2009; Lee et al., 2009; Marchetto et al., 2010). Moreover, hiPSC derivatives could provide an unlimited number of cells needed to examine the pathophysiology of LCA at the cellular and molecular levels and to perform a high-throughput screening to find new drugs and therapeutic regimens. Cells used for such procedures should have a stable phenotype and be easily amplifiable to provide a pool of cells for screening and validation.
We derived LCA and WT hiPSCs into two differentiated derivatives: NSC and RPE cells using protocols previously described (Chambers et al., 2009; Klimanskaya et al., 2004). These two populations are the ones affected in some form of LCA (or their precursors) and have the advantage of forming a homogeneous population suitable for transcriptomic analysis and drug screening. RPE cells have many crucial functions for long-term vision and photoreceptor survival that highlight their central role as guardian or caretaker of the neural retina (Plafker et al., 2012; Strauss, 2005). However, in our study, NSC and RPE cells obtained from LCA hiPSCs did not show any disease-specific functional defect, contrary to other studies using hiPSCs from patients with retinal diseases (Jin et al., 2011; Meyer et al., 2011; Zahabi et al., 2012). One limitation could be that these cells are not fully mature and do not reproduce the pathological phenotype entirely. NSCs are very immature cells, and RPE derived from iPSCs are more closely related to human fetal RPE than adult RPE, even if functional, i.e., capable of phagocytosis of fluorescently labeled POS (Klimanskaya et al., 2004). These cells might need to be challenged by some type of stress to express functional or phenotypical defects (Jin et al., 2011). Moreover, if GUCY2D is one of the genes causing the pathology in our model, we may need to differentiate our cells into photoreceptors, or at least their progenitors. This was challenging because most of the protocols described so far were lengthy and provided a low ratio of photoreceptors (Lamba et al., 2006; Meyer et al., 2009; Osakada et al., 2008). However, recent publications (Meyer et al., 2011; Nakano et al., 2012) have demonstrated that hESCs and iPSCs could give rise to neural retina formation in vitro, providing hope that photoreceptors could be used for cell therapy and pathological modeling.
However, our main objective was to identify differentially expressed genes in early developmental defects before the establishment of mature retinal circuitry. Whole-gene expression profiling performed on the two LCA-hiPSC derivatives revealed that 21 genes had changes in expression relative to WT controls. We focused on four genes with no reported link to visual function that showed a high fold change (≥2) and a significant p value ≤0.05 in NSC and RPE cells—NNAT, TRIM61, ZNF558, and GSTT1. First, one gene, (neuronatin) NNAT, was upregulated in LCA cells. NNAT is a neural-specific developmental gene with α and β splice forms (Siu et al., 2008; Yokota et al., 2004). It has been shown very recently that NNAT was a key imprinted gene that is deregulated in hiPSCs and, thus, may not be related to the pathology (Teichroeb et al., 2011). We found three genes to be downregulated in LCA cells—the tripartite motif containing 61 (TRIM61) gene, the zinc finger protein 558 (ZNF558) gene, and the glutathione S-transferase theta 1 (GSTT1) gene. TRIM61, whose role remains unclear, belongs to the TRIM family. TRIM proteins contain RING finger domains that could simultaneously bind ubiquitination enzymes and their substrates and hence function as ligases. Ubiquitination, in turn, targets the substrate protein for degradation (Napolitano and Meroni, 2012). ZNF558 belongs to ZNF family of DNA-binding proteins acting as transcriptional regulators (Matthews and Sunde, 2002). GSTT1 encodes an enzyme of the glutathione S-transferase (GST) family that catalyzes the conjugation of glutathione (GSH) to wide range of potential toxins as the first step in detoxification (Baars and Breimer, 1980; Hayes et al., 2005). This gene is particularly of interest because a growing body of clinical and experimental data strongly implicate oxidative stress as a threat to the structural and functional integrity of the RPE (Cai et al., 2000; Plafker et al., 2012). GST polymorphisms may be associated with an increased risk for the development of primary open-angle glaucoma, age-related macular degeneration (AMD), and age-related cataract (ARC) (Güven et al., 2011; Jiang et al., 2012; Juronen et al., 2000; Othman et al., 2012). The precise link between GSTT1 and LCA pathology is unknown, but its downregulation in both LCA-NSC and LCA-RPE cells might suggest it plays a role (along with TRIM61 and ZNF558) in the mechanisms underlying the LCA phenotype through interactions with other unknown proteins and thus deserves further examination.
Footnotes
Acknowledgments
We thank M. Girard and C. Denis for their help on the reprogramming step on LCA fibroblasts, J. Feteira for providing hiPSC clones derived from normal fibroblast lines GM04603 and CRL2097, and C. Varela for performing karyotype analysis.
This work was supported by the Institut National de la Santé et de la Recherche Médicale (INSERM), University Evry Val d'Essonne (UEVE), Association Française contre les Myopathies (AFM), and Genopole.
Author Disclosure Statement
The authors declare that they have no conflicts of interest.
References
Supplementary Material
Please find the following supplemental material available below.
For Open Access articles published under a Creative Commons License, all supplemental material carries the same license as the article it is associated with.
For non-Open Access articles published, all supplemental material carries a non-exclusive license, and permission requests for re-use of supplemental material or any part of supplemental material shall be sent directly to the copyright owner as specified in the copyright notice associated with the article.