
Abstract
Abstract
The objective of this study was to evaluate the usefulness of cloned pigs as porcine obesity models reflecting obesity-associated changes in innate immune factor gene expression profiles. Liver and adipose tissue expression of 43 innate immune genes as well as serum concentrations of six immune factors were analyzed in lean and diet-induced obese cloned domestic pigs and compared to normal domestic pigs (obese and lean). The number of genes affected by obesity was lower in cloned animals than in control animals. All genes affected by obesity in adipose tissues of clones were downregulated; both upregulation and downregulation were observed in the controls. Cloning resulted in a less differentiated adipose tissue expression pattern. Finally, the serum concentrations of two acute-phase proteins (APPs), haptoglobin (HP) and orosomucoid (ORM), were increased in obese clones as compared to obese controls as well as lean clones and controls. Generally, the variation in phenotype between individual pigs was not reduced in cloned siblings as compared to normal siblings. Therefore, we conclude that cloning limits both the number of genes responding to obesity as well as the degree of tissue-differentiated gene expression, concomitantly with an increase in APP serum concentrations only seen in cloned, obese pigs. This may suggest that the APP response seen in obese, cloned pigs is a consequence of the characteristic skewed gene response to obesity in cloned pigs, as described in this work. This should be taken into consideration when using cloned animals as models for innate responses to obesity.
Introduction
Pigs are promising models for the obesity-induced, inflammation-related responses thought to be the underlying cause of the metabolic syndrome (Litten-Brown et al., 2010). Cloned pigs should in theory show less interindividual variation because they have identical genotypes and therefore are expected to have more uniform phenotypes than normal outbred pigs and thus have potential to improve the model. However, it has been shown by us and others that interindividual phenotypic variation was not reduced for a number of traits by cloning, including expression levels of specific genes (Rødgaard et al., 2012; Tian et al., 2008). Even though several reports have shown that animals cloned by somatic cell nuclear transfer (SCNT) are healthy and normal, other investigations report deviant phenotypes (Clausen et al., 2011; Hwang et al., 2009; Park et al., 2011; Whyte et al., 2011), including lower body weights (Park et al., 2005; Tian et al., 2008). Furthermore, cloning by SCNT leads to higher perinatal and early postnatal mortality (Park et al., 2005; Whitworth et al., 2009). This has been attributed to a large number of causes, including metabolic and cardiopulmonary abnormalities (Hill et al., 1999; Wells et al., 1999), lymphoid hypoplasia (Renard et al., 1999), and neonatal respiratory distress (Hill et al., 1999), but also, interestingly, to bacterial infections (Carter et al., 2002; Keefer et al., 2001; Peura et al., 2003). Studies in cloned piglets (Carter et al., 2002) and cloned cattle (Chavatte-Palmer et al., 2009) have revealed that the adaptive immune system is apparently not affected by the cloning process. However, we have previously described that basal innate immune response gene expression is altered in cloned pigs compared to normal outbred pigs (Rødgaard et al., 2012) supported by earlier findings by Carroll and co-workers (Carroll et al., 2005) on altered innate immune responses to lipopolysaccharide in cloned pigs.
All of this has raised concerns regarding the use of cloned animals in metabolic and knockout analysis (St. John et al., 2005), and there is a need for further investigations into the use of cloned animals in nutrition studies to supplement the few studies that have already been conducted (Christensen et al., 2012; Jensen et al., 2010). Therefore the objective of this study was to evaluate the usability of cloned pigs in nutritional studies by looking at the expression of innate immune genes and serum levels of APPs and cytokines in obese cloned pigs and to investigate whether cloning reduced interindividual variation in these parameters and whether cloning had any other effects on these parameters. Cloned pigs (n=9) and normal outbred pigs (controls, n=10) fed a high-fat/high-sucrose diet ad libitum (obese group) and cloned pigs (n=8) and normal outbred pigs (controls, n=9) fed a high-fat/high-sucrose diet restricted to 60% of ad libitum intake (lean group) were compared.
Materials and Procedures
All methods and descriptions of the lean clones and controls have been previously described in Rødgaard et al. (2012). The following is a brief summary.
Animals, diets, and sampling
All experimental procedures involving animals were approved by the Danish Animal Experimental Committee.
Somatic cell nuclear transfer was used to perform the cloning, as described in Kragh et al. (2004). Donor cells were from cultured ear fibroblasts obtained from a Danish Landrace×Yorkshire (65%:35%) sow, and the cloned embryos were transferred to surrogate sows 5–6 days after cloning, as described in Schmidt et al. (2010). Controls were normal litters (either 36%:64% or 75%:25%) obtained by standard insemination. The lean pigs are described in Rødgaard et al. (2012).
The obese pigs were from two groups born a year apart. Group 1 consisted of four clones and four controls, and group 2 consisted of five clones and six controls. Piglets from group 1 were delivered normally and piglets from group 2 were delivered by cesarean section on gestation day 116 (Schmidt et al., 2010), with treatment with a prostaglandin analog (175 μg of Estrumate intramuscularly [i.m.], Pitman-Morre, UK) 24 h before cesarean section. All pigs were reared in the experimental stables of Aarhus University (Tjele, Denmark). Pigs were weaned after 28 days, and at 3 months of age the pigs were fed a high-energy diet (containing 10% sugar and 10% soy oil) ad libitum as described in Christensen et al. (2012). At an age of 7–8 months, the pigs were killed with a bolt pistol after overnight fasting. The animals were desanguinated and the carcass split into two halves; the right side was used for tissue sampling and the left side was used for computed tomography (CT) scanning. Tissue samples were snap frozen in liquid nitrogen. Blood was allowed to clot at room temperature for 1 h and then centrifuged at 3000 rpm for 10 min at 4°C, and aliquots of serum were then frozen. Tissue and serum samples were kept at −80°C until analysis. CT scanning was performed with a high-speed single-slice CTi instrument from General Electric, obtaining slices of 5-mm resolution. CT data were analyzed using VG MAX 2.1 software (Volume Graphics GmBH, Germany) for quantification of fat and muscle volume.
Extraction of RNA
For RNA extracted from abdominal fat samples from group 1 and liver tissue from groups 1 and 2, the following method was used: Total RNA from ∼100 mg of liver tissue was isolated by a RNeasy Lipid tissue Midi kit (Qiagen, Ballerup, Denmark) and ∼1 gram of abdominal fat tissue was isolated by a RNeasy Maxi kit (Qiagen) and QIAzol Lysis Reagent (Qiagen) according to manufacturer's protocol. Both were treated with on-column RNase-free DNase digestion (Qiagen). The tissues from group 1 were homogenized with a hand blender, whereas the liver tissue from group 2 was homogenized on a gentleMACS Dissociator (Miltenyi Biotec, Germany) in gentleMACS M tubes (Miltenyi Biotec).
For the abdominal subcutaneous adipose tissue (SAT) from group 2 as well as the visceral adipose tissue (VAT) and neck SAT from groups 1 and 2, the method of RNA extraction with phenol and chloroform was used. Approximately 1 gram of fatty tissue was homogenized with QIAzol Lysis Reagent on the gentleMACS Dissociator, after which chloroform was added. After centrifugation, the upper, aqueous phase was transferred to a new tube and isopropanol (2-propanol) was added. The tube was centrifuged and the pellet was washed three times in cold 75% ethanol. The supernatant was removed completely, and the pellet was left to air dry. The RNA was dissolved in RNase-free water. The RNA yield was then measured on a NanoDrop ND-1000 Spectrophotometer (NanoDrop Technologies Inc, USA).
RNA integrity
For the assessment of RNA integrity, the Agilent 2100 Bioanalyzer (Agilent Technologies, CA, USA) and the Agilent RNA 6000 Nano Kit (Agilent Technologies) were used according to manufacturer's protocols. The Bioanalyzer calculates an RNA integrity number (RIN) expressing fragmentation of RNA on a scale from 1 to 10 (1=degraded, 10=non-degraded). In the liver, all samples had a RIN of above 8, whereas all samples in the fatty tissues had a RIN of above 6.2.
cDNA synthesis and preamplification
Each sample of extracted RNA was run in duplicate, and 500 ng of total RNA was reverse transcribed using the QuantiTECT Reverse Transcription kit (Qiagen), according to the manufacturer's instructions. Preamplification was performed using TaqMan PreAmp Master Mix (Applied Biosystems, CA, USA).
Primer design and validation
Primers were designed using Primer3 (http://frodo.wi.mit.edu/) as described previously in Skovgaard et al. (2009) and synthesized at TAG Copenhagen (Copenhagen, Denmark). Primer specificities, primer amplification efficiencies, dynamic ranges, specificity, and sequences were tested as described in Rødgaard et al. (2012).
Quantitative real-time PCR
Quantitative real-time PCR (qPCR) was performed in 48.48 Dynamic Array Integrated Fluidic Circuits (Fluidigm, CA, USA), combining 48 samples with 48 primer sets for 2304 simultaneous qPCR reactions in the BioMark real-time PCR instrument (FluiDigm). Reaction mix was prepared with ABI TaqMan Gene Expression Master Mix (Applied Biosystems), 20×DNA Binding Dye Sample Loading Reagent (Fluidigm), 20×EvaGreen (Biotium, VWR–Bie & Berntsen), and low EDTA TE buffer. Reaction mix was combined with preamplified cDNA. Specific primer mixes were prepared using 20 μM primer (forward and reverse), 2×Assay Loading Reagent (Fluidigm), and low EDTA TE buffer. Expression data were acquired using the Fluidigm Real-Time PCR Analysis software 3.0.2 (Fluidigm) and exported to GenEx5 (MultiD, Göteborg, Sweden).
Data analysis and statistics
GenEx5 was used for data preprocessing, normalization, relative quantification, and statistics. Data were corrected for PCR efficiency for each primer assay individually. The most stable expressed reference genes were found for each tissue type individually as well as for all samples combined out of a panel of five putative reference genes using GeNorm (Vandesompele et al. 2002), and the geometric means of these were used for normalization in GenEx5. Expression was calculated relative to the least expressed samples for each primer assay, and data were log2 transformed to approach normal distribution prior to two-tailed, unpaired t-test, one-way analysis of variance (ANOVA) with Tukey–Kramer post test and/or F-test. Gene expression changes were considered to be significant if p≤0.05 with a fold change of at least ±1.5. Data are expressed as the mean±standard error of the mean (SEM).
Quantitative serum enzyme-linked immunosorbent assay
The protein concentrations in serum of CRP, HP, ORM, IL-6, TNF-α, and serum amyloid A (SAA) were analyzed by sandwich enzyme-linked immunosorbent assays (ELISAs). CRP, HP, and ORM was analyzed with in-house assays, whereas commercially available ELISA assays were used to determine IL-6 (Porcine IL-6 Duoset kit, R&D Systems, MN, USA) and TNF-α (Swine TNF-α CytoSet™, Invitrogen, CA, USA, with Antibody Pair Buffer Kit, Invitrogen, CA, USA) and SAA (Phase SAA assay, Tridelta Development Ltd., Kildare, Ireland). All ELISAs were developed using TMB-plus (KEM-EN-TEC, Taastrup, Denmark) according to the manufacturer's instructions and read using an automatic plate reader (Thermo Multiskan Ex spectrophotometer, Thermo Scientific, Waltham, MA, USA). Within a single assay, all samples were run in duplicate, and an intraassay coefficient of variation of <15% was accepted. Ascent software v. 2.6 (Thermo Scientific) was used to calculate sample values, and significance was tested using a two-tailed unpaired t-test where variance was tested with an F-test. p≤0.05 was considered significant. Outliers were removed from dataset after evaluation with the Grubbs outlier test (Grubbs, 1969) where applicable. Data are expressed as the mean±SEM.
Results
Pigs
When comparing the four groups (lean controls, lean clones, obese controls, and obese clones) at the time of slaughter, there was no significant difference in the weight of the lean controls and lean clones (Rødgaard et al., 2012). The weights of the obese clones and controls were significantly higher than the lean clones (p<0.0001) and lean controls (p=0.03), respectively. However, the obese control animals weighed significantly more than the obese clones (170.1±4.9 kg and 147.5±5.9 kg, respectively, p=0.009). CT scans were performed on all lean pigs and on six obese controls and five obese clones, selected to be representative of the groups. A representative CT scan from each group is shown in Figure 1, and the percentage of total body fat calculated from these scans is shown in Figure 2. The CT scans showed a significantly higher percentage of total body fat (p=0.002) in the obese controls when compared to the obese clones. Furthermore, the obese controls had more back fat (p<0.0001) and abdominal SAT (p<0.0001) than the obese clones (data not shown). In addition, a significantly higher proportion of total body fat was seen in the obese controls (40.1%±1.5%) and obese clones (28.4%±2.3%) compared to the lean controls (21.8%±1.3%, p<0.0001) and lean clones (18.4%±2.5%, p=0.02), respectively.
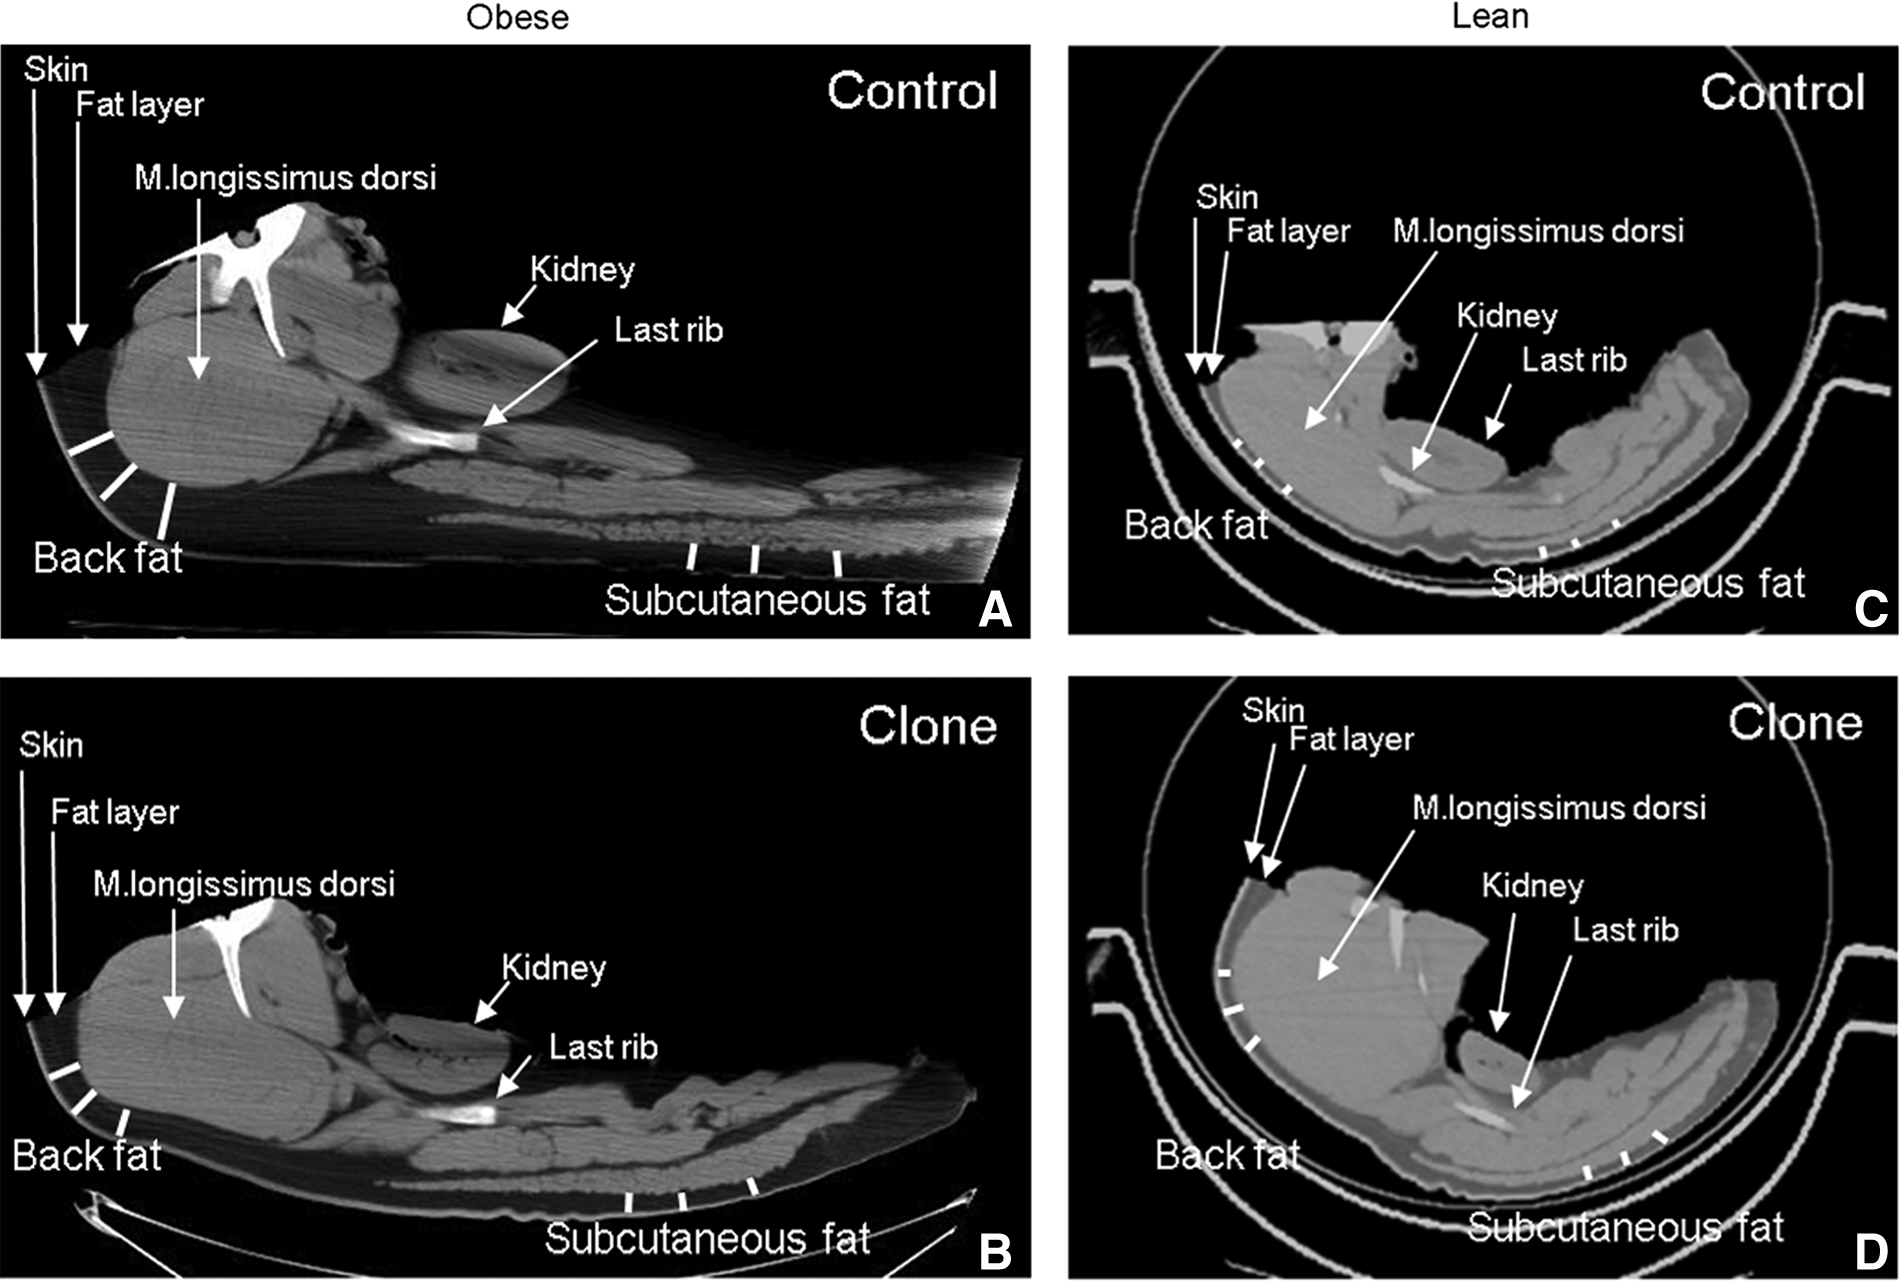
Representative CT scans of obese controls
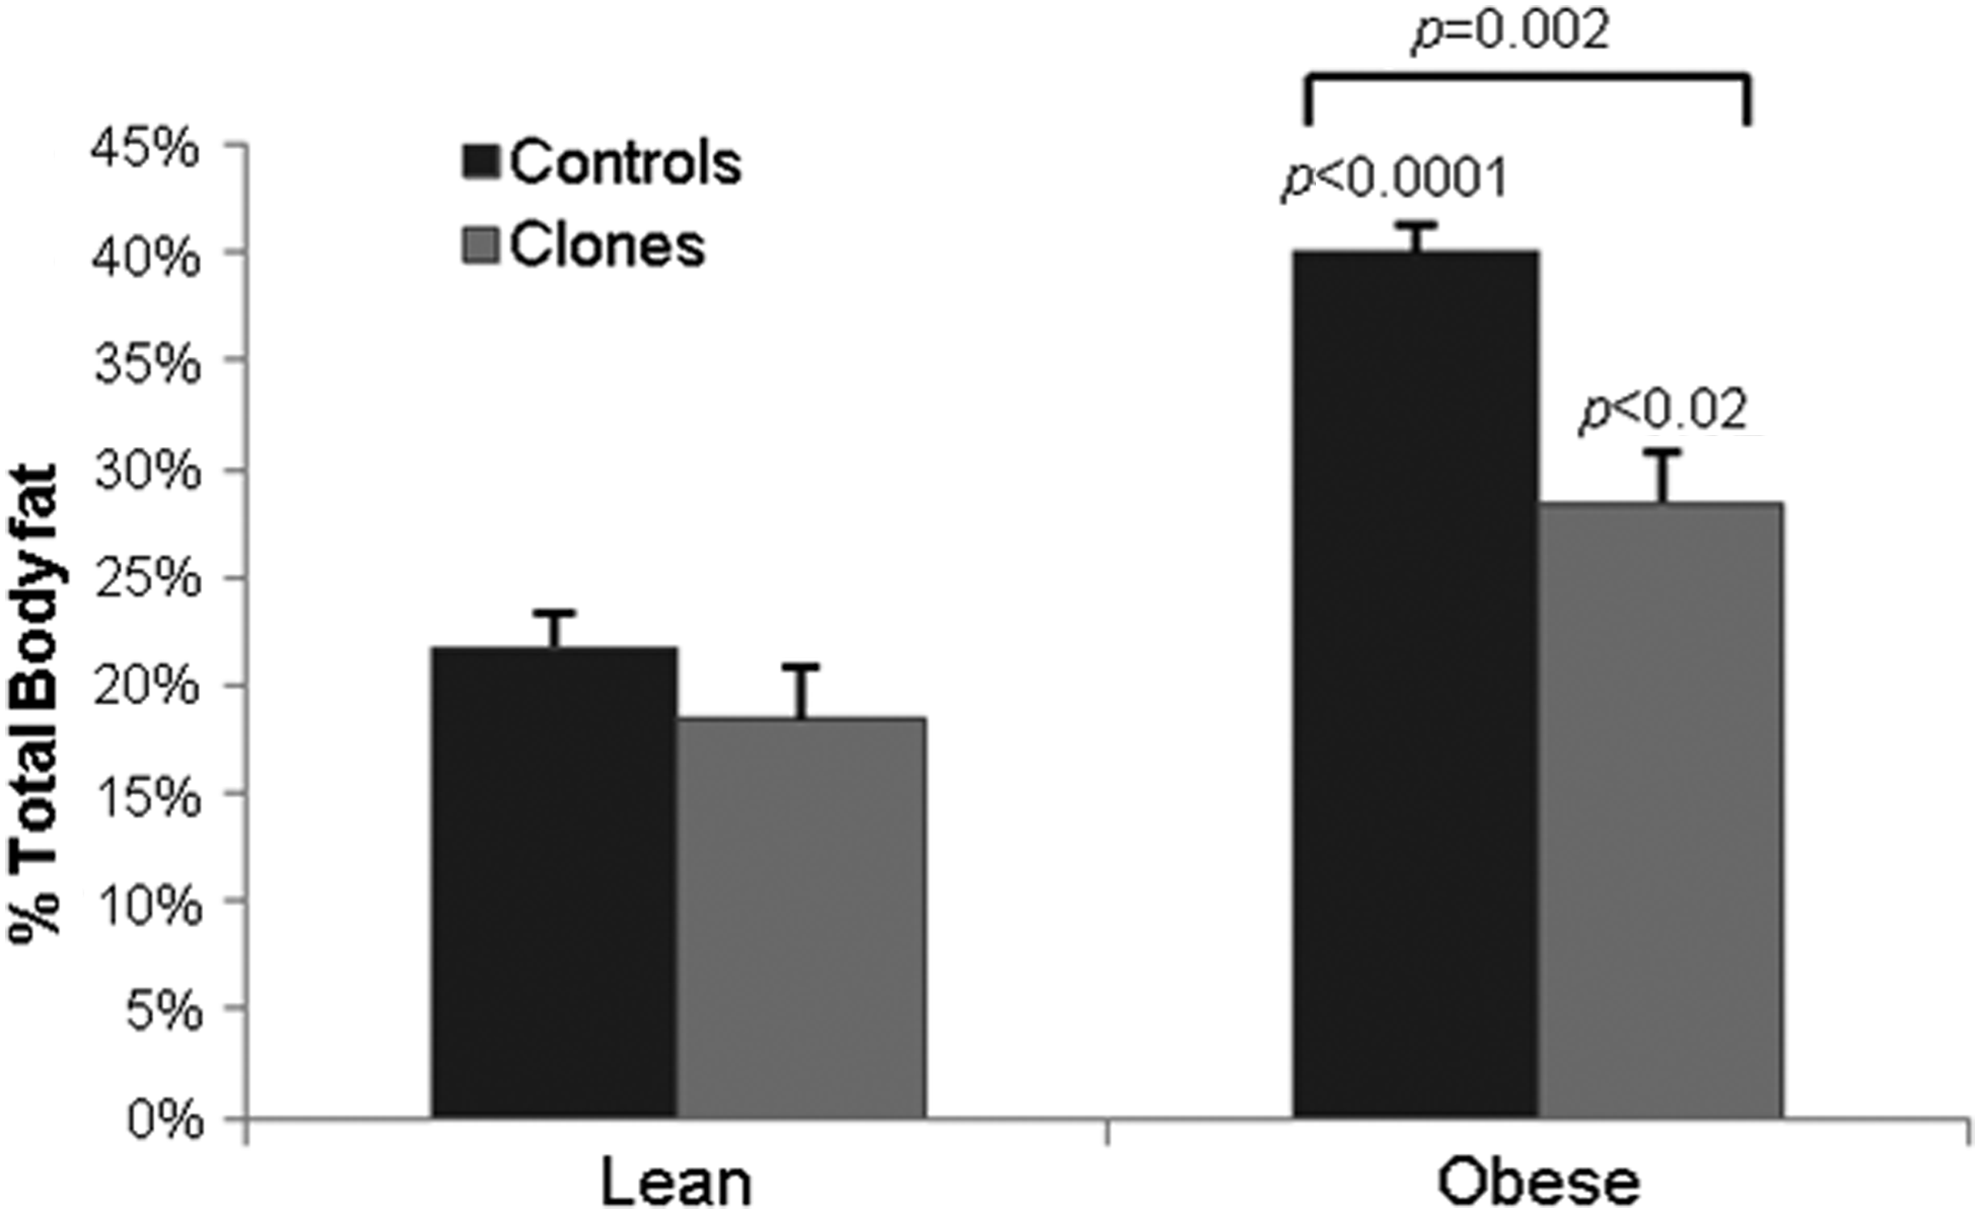
Percentage of total body fat in lean and obese clones and controls, as measured from CT scans done at end point. n=9 for lean controls, n=8 for lean clones, n=6 for obese controls, and n=5 for obese clones. Error bars depict SEM.
Gene expression
A total of 43 immune-related genes and five reference genes were analyzed. After quality control, as described in Rødgaard et al. (2012), a number of genes were found to yield subquality data (i.e., low PCR efficiency or standard deviation between double determinations above 15%) and were excluded from further evaluation. This included MUC1, DEFB1, and IL12 for all tissues; SFTPA1, FIB, IFNG, LBP, IL1RN, ORM1, and IL10(b) for all adipose tissues; and IL8(a) and IL6 for the liver. Furthermore, when duplicate primer sets were used with similar results, only the result from one of the primer sets is shown—IL8(a) in the adipose tissues, IL10(a) for the liver and ITIH4(b) for all tissues. Significantly differentially expressed genes were defined as genes showing a statistically significant difference in expression (p≤0.05) and a fold change of at least ±1.5, comparing either two pig groups or two types of tissues (tissue expression patterns).
The expression data for obese clones and obese controls (set to 1), for all tissues, are shown in Supplementary Table 1 (supplementary data are available at www.liebertpub.com/cell/), whereas Table 1 shows expression levels in adipose tissues (abdominal SAT and VAT) relative to neck SAT (set to 1) for all four pig groups, illustrating the tissue expression patterns for the 31 genes.
Relative innate immune gene expression in abdominal subcutaneous adipose tissue (SAT), visceral adipose tissue (VAT) as compared to neck SAT (set to 1) in lean and obese controls and clones, as analyzed by qPCR±standard error of the mean (SEM).
Significant difference and fold change of at least±1.5 between abdominal SAT/VAT and neck SAT.
Significant difference and fold change of at least±1.5 between abdominal SAT and VAT.
Abd., abdominal.
Figure 3 shows the expression for all four tissues investigated of all genes that were significantly differentially expressed in obese as compared to lean pigs (set to 1) for both controls and for clones.
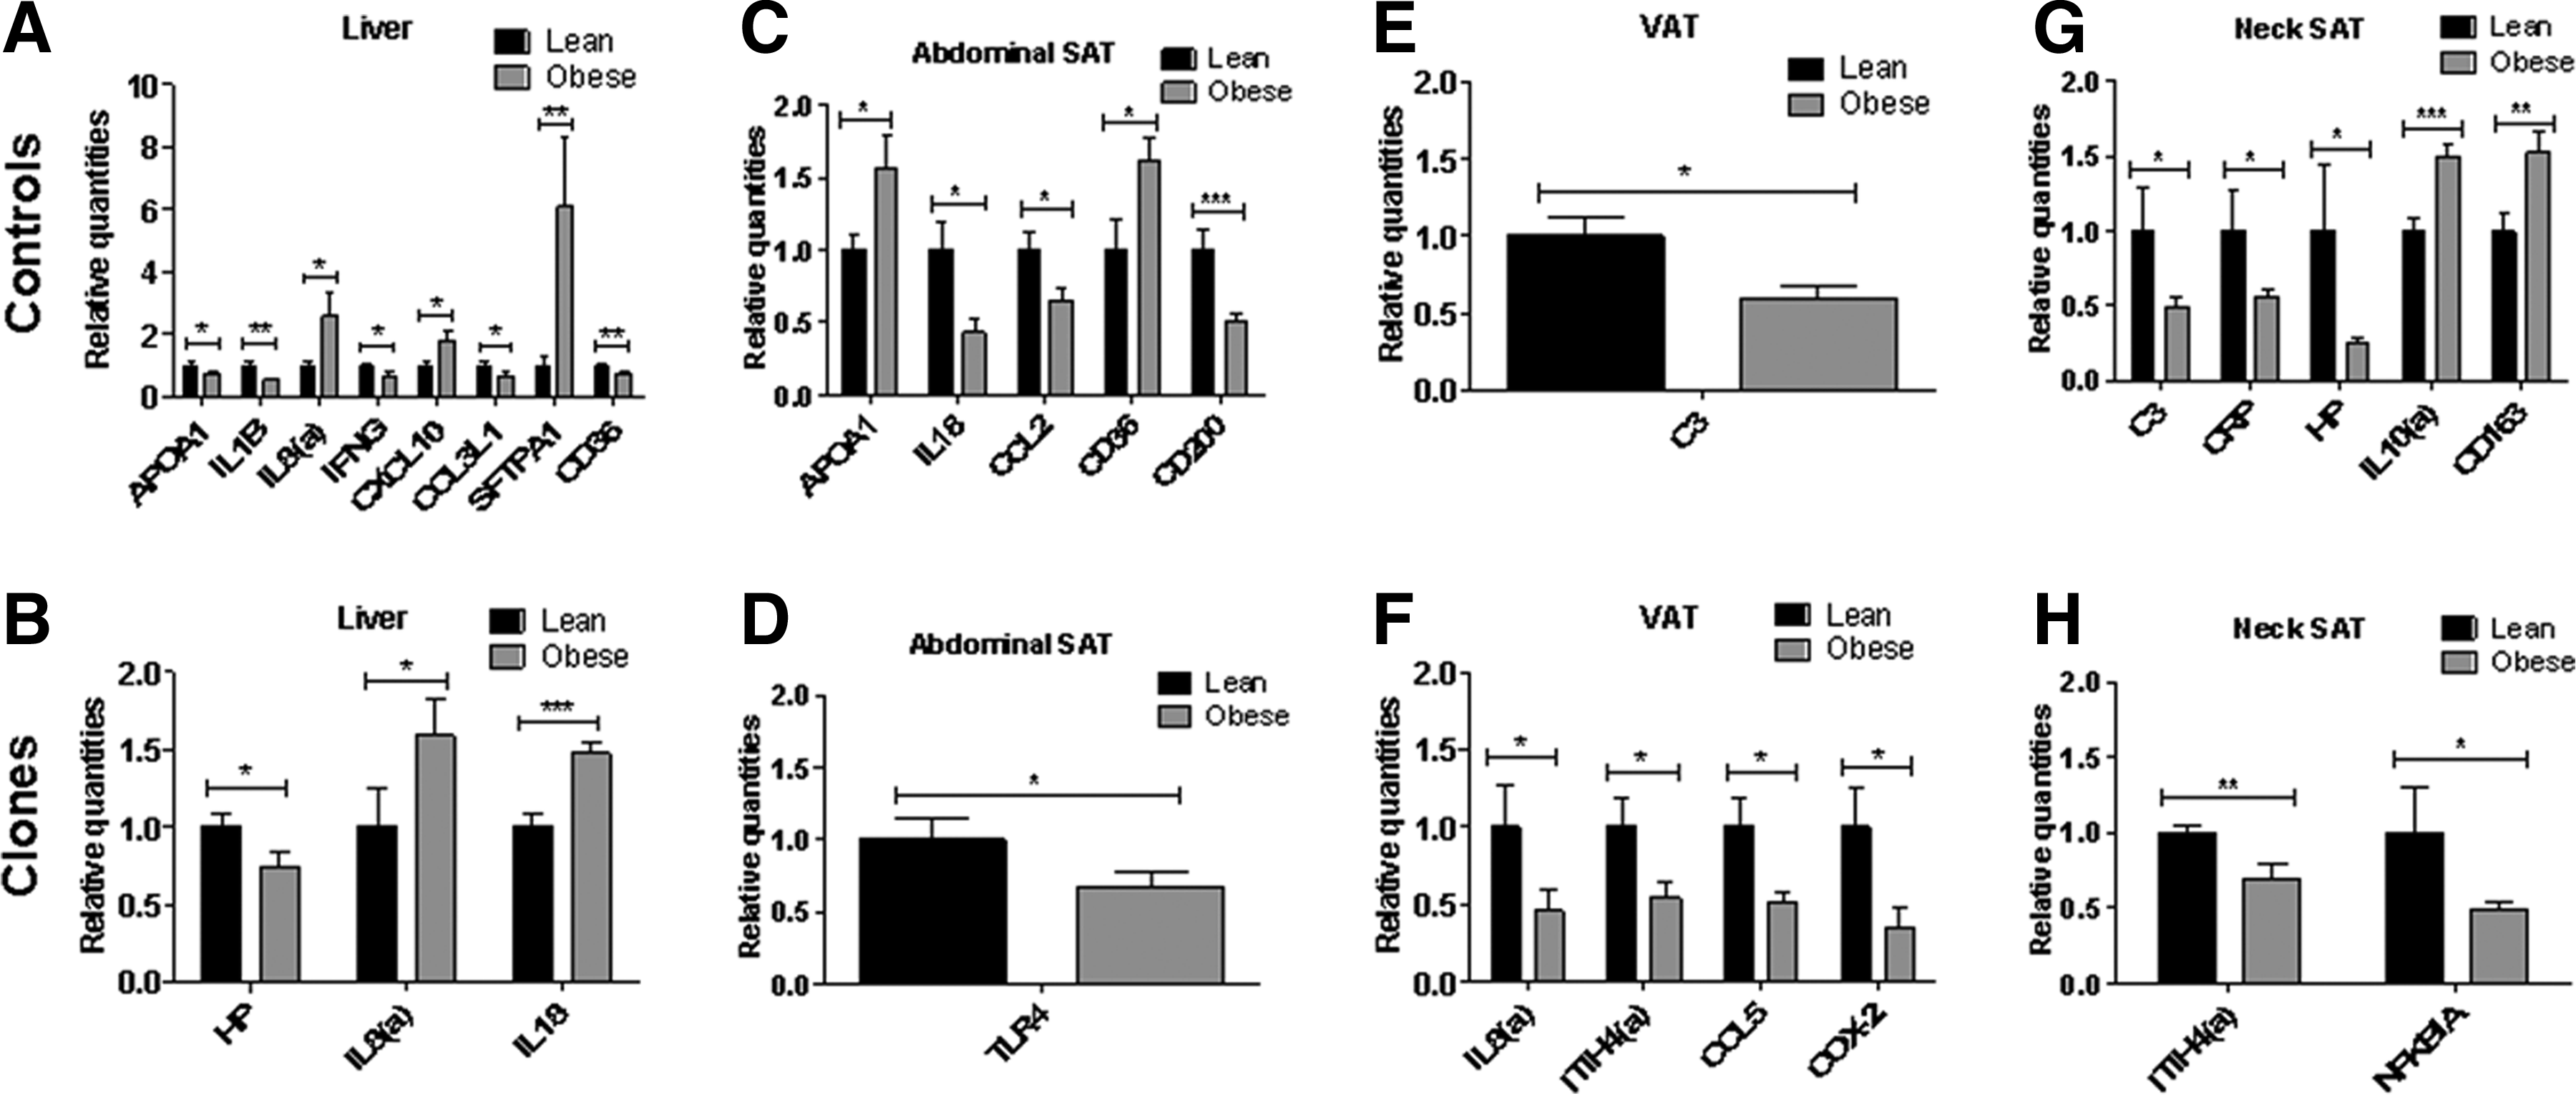
Control vs. clones—significant genes. Significantly differentially expressed genes in lean (set to 1) compared to obese in clones and controls with a fold change of at least ±1.5 in liver
Effect of cloning
As a general observation, the interindividual variability in gene expression between pigs in the group of obese clones was not different from that observed between individual pigs of the obese control group as analyzed by the F-test (p=0.54 for liver, p=0.36 for abdominal SAT, p=0.87 for VAT, and p=0.72 for neck SAT). Only a few genes showed a significantly changed expression in obese clones compared to obese controls (Supplementary Table 1). Two genes were slightly (LBP) or moderately (SAA) significantly upregulated in the liver, whereas one gene in each of the adipose tissues was affected by cloning (IL1B in abdominal SAT, C3 in VAT, and IL18 in neck SAT).
Tissue-specific expression patterns, i.e., the relative expression in the three adipose tissues using the level of expression in neck SAT as a reference (i.e., set to 1 for each group) were compared for 31 genes in obese clones versus obese controls (Table 1). In the obese control group, differential expression was seen for a substantial number of genes, with five genes being expressed higher in abdominal SAT than in neck SAT and five genes being expressed higher and one expressed lower in VAT than in neck SAT. In contrast, in the obese clones, only two genes in abdominal SAT and one gene in VAT were differentially expressed compared to neck SAT, all being expressed higher. In comparison, in the lean control group, nine genes in abdominal SAT and 13 in VAT were significantly differentially expressed compared to neck SAT (all except two genes were expressed higher), whereas the corresponding numbers for lean clones were two and three, respectively.
Differential expression in abdominal SAT compared to VAT (Table 1) were seen for eight genes in obese controls and for no genes in obese clones. In the lean group, six genes were differentially expressed in abdominal SAT compared to VAT in the controls and two in the clones. Thus, both cloned groups showed a much reduced differentiated adipose tissue specific gene expression.
Effect of obesity
Considering the effect of obesity on liver gene expression in controls and clones, respectively, a mixed effect was seen in the control group (Fig. 3A), with three out of eight significantly differentially expressed genes being upregulated, namely two chemokine genes (IL8 and CXCL10) as well as SFTPA1. The effect of obesity on gene expression in the liver of the cloned pigs (Fig. 3B) was limited to only two genes being upregulated (IL8 and IL18) and HP being downregulated with all changes being very small. A more limited effect of obesity in cloned as compared to control pigs was also seen on abdominal SAT gene expression because only one gene was downregulated to a minor degree in obese cloned pigs (TLR4, Fig. 3D), whereas in the obese control group (Fig. 3C) five genes were changed compared to lean controls, two of which were upregulated to a minor degree (APOA1 and CD36). In the neck SAT (Fig. 3G), five genes were affected by obesity in control pigs, whereas only two genes changed expression in cloned pigs (Fig. 3H) (downregulation of ITIH4 and NFKBIA). In VAT, in contrast to the other tissues, a higher number of genes was affected by obesity in the cloned group compared to the control group (Fig. 3E, F); in the latter, C3 was the only gene affected (minor downregulation), whereas four downregulated genes were observed in the cloned group (IL8, ITIH4, CCL5, and COX-2). As a general trend, all adipose tissue genes changing expression as an effect of obesity in the cloned group were downregulated, whereas obesity had a mixed effect on adipose tissue gene expression in the control group (Fig. 3).
The effect of obesity on tissue-specific expression patterns, using neck SAT expression as the reference (set to 1) can also be seen in Table 1. The five genes being expressed higher in abdominal SAT of obese controls included one cytokine (IL18) and a group of APPs (C3, CRP, HP, and SAA), and the six differentially expressed genes in VAT represented all groups of immune factors. In both abdominal SAT and VAT of lean controls, a wide range of innate immune factors, the cytokines IL10, IL18, and TGFB, the APPs C3 and SAA, the chemokine IL8, and the immune-related factors CD40, CD200, and TLR4 were differentially expressed with additional differential expression by IL18, CCL2, CCL3L1, and CCL5 in VAT. In obese clones, abdominal SAT showed differential expression of only SAA and IL18, whereas only IL10 was differentially expressed in VAT. In comparison, lean clones showed differential expression of IL18 and CD200 in both abdominal SAT and VAT with the addition of a group of chemokines (IL8, CCL3L1, and CCL5) in VAT. Finally, genes being differentially expressed between abdominal SAT and VAT were six and eight for lean and obese controls, respectively, and two and zero for lean and obese clones, respectively. Thus, generally, differential tissue expression was reduced by cloning and further reduced by obesity.
Protein concentrations in serum
Serum protein concentrations of ORM, HP, and CRP in the lean and obese controls and clones are shown in Figure 4. IL-6, SAA, and TNF-α were below the lower limit of detection for most samples. Possible outlier data points were pinpointed by the Grubbs test and removed (1 for ORM, 1 for HP, and 2 for CRP).
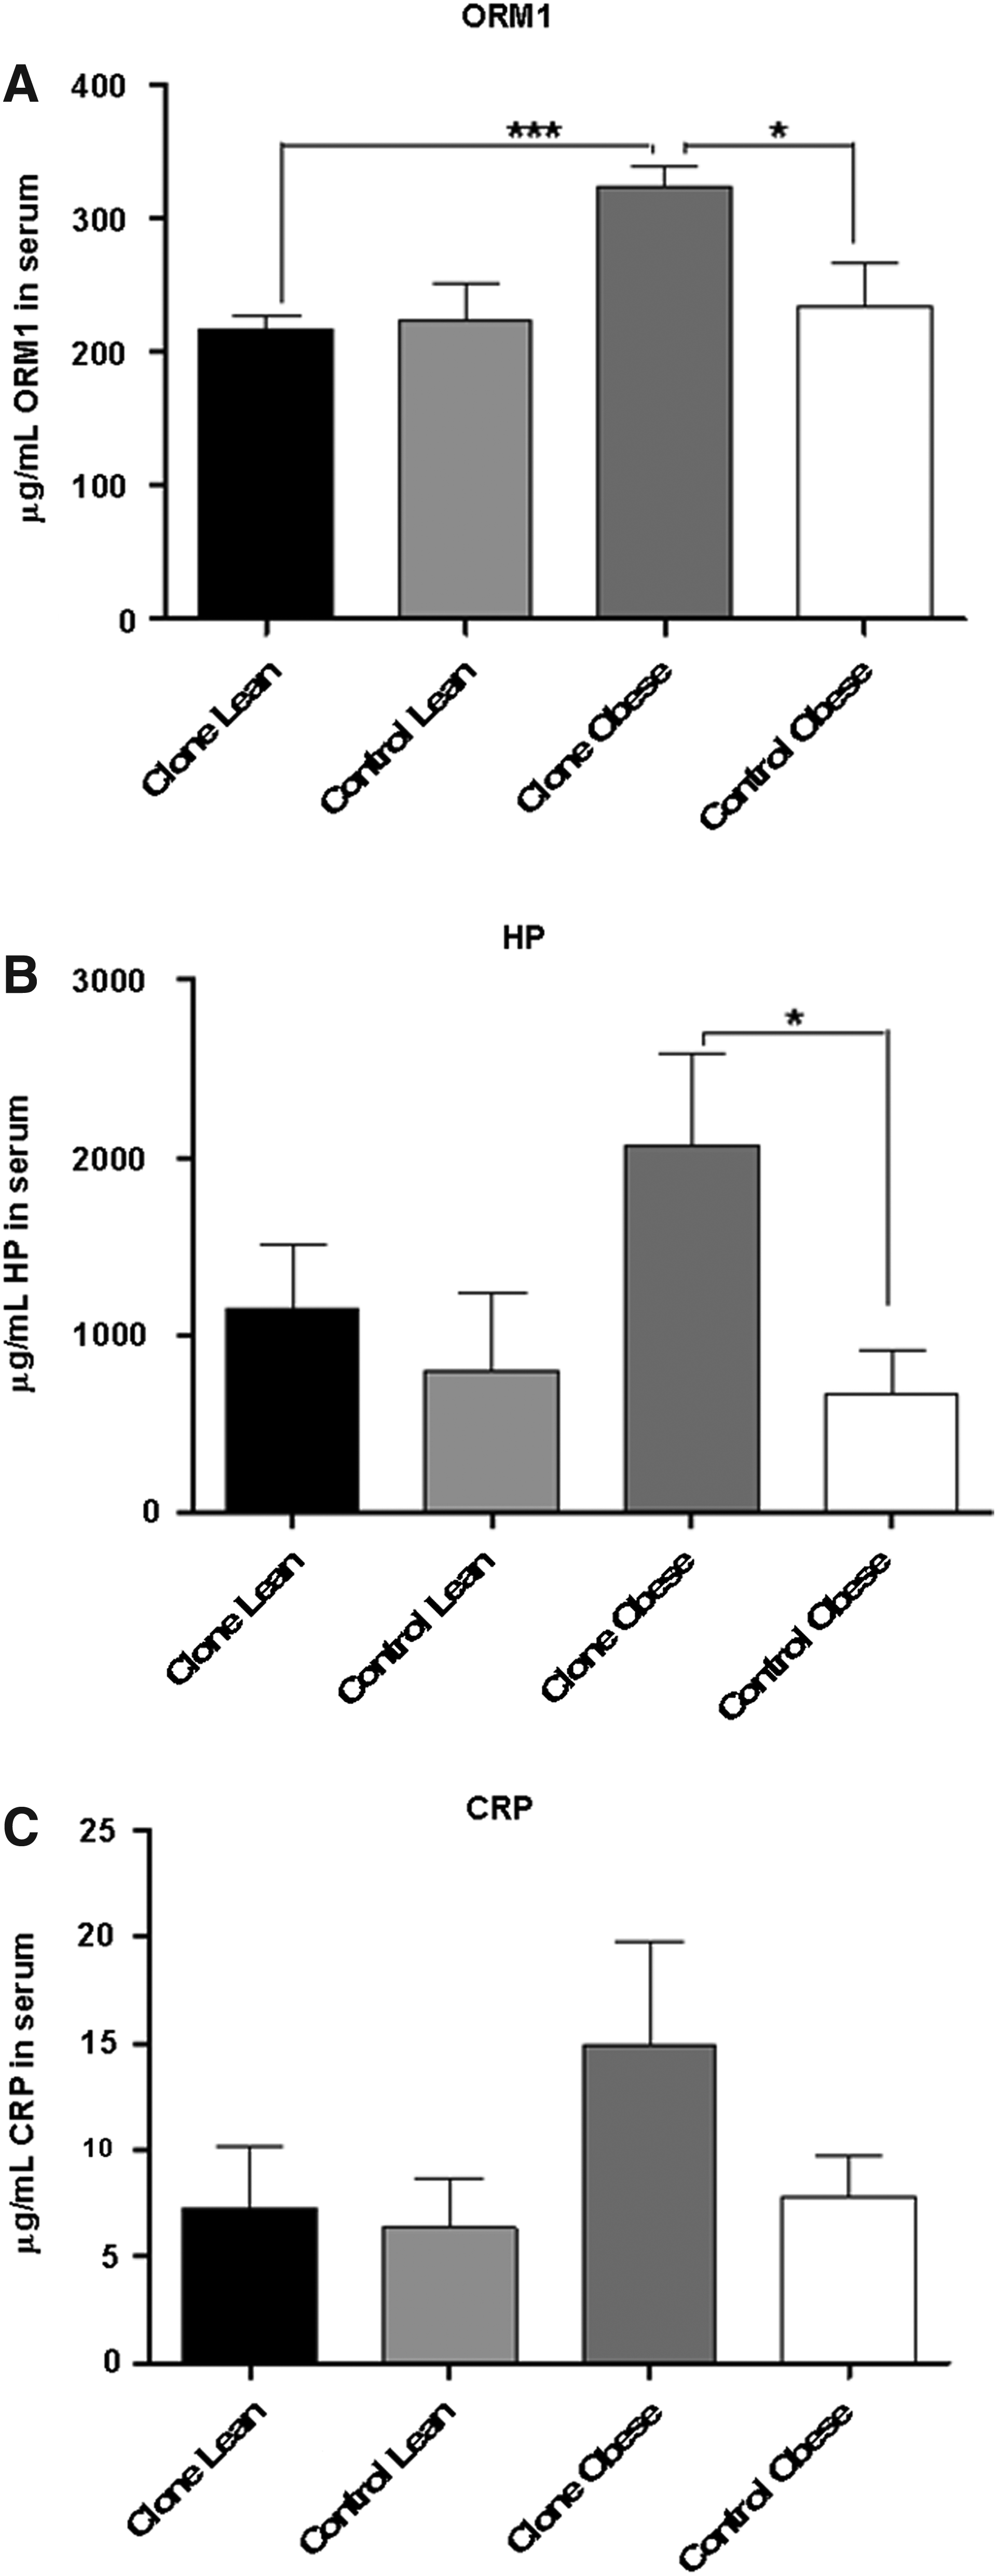
Protein quantification in the serum. Mean serum concentrations of ORM
The interindividual variation in specific serum protein concentrations between animals of the cloned groups was compared to the variation between the animals in the control groups, using the F-test. The variance was found to be not equal for ORM (p=0.05) and CRP (p=0.02), and bordering on significance for HP (p=0.053). However, only for ORM was the interindividual variance reduced in the clones; for the two other proteins, the clones showed higher interindividual variation than the controls.
The APPs ORM (p=0.03) and HP (p=0.02) had a significantly higher serum concentration in the obese clones compared to the obese controls, being increased approximately 50% and 120%, respectively. CRP also was slightly (although not significantly) elevated in the obese clones. Furthermore, there was a clear and significant higher serum concentration of ORM in obese clones compared to lean clones (p=0.0002), and a tendency for the same to be true for HP and CRP. This was not seen for lean controls compared to obese controls.
Discussion
Both obese pig groups (controls and clones) in this study had a significantly increased body weight and percentage of body fat compared to both lean groups; however, while the weights of lean controls and lean clones were not significantly different (Rødgaard et al., 2012), cloned obese pigs weighed significantly less than the obese controls and had a significantly lower percentage of body fat. Biochemical values reported elsewhere (Christensen et al., 2012) indicate that the feed intake of the obese clones was significantly lower and the daily weight gain correspondingly smaller than seen with the obese controls. As discussed below, this potentially could hamper the comparison of adipose gene expression in obese clones with that of obese controls.
It was not possible in this study to demonstrate a lower intraindividual variation in the cloned pigs compared to that of the control pigs for either gene expression or serum protein concentrations, except for the serum concentrations of ORM. This supports other recent findings in pigs cloned by SCNT (Christensen et al., 2012; Clausen et al., 2011; Hwang et al., 2009; Park et al., 2011; Rødgaard et al., 2012; Whyte et al., 2011). For the serum proteins CRP and HP, the trend was that the interindividual variation was even higher in the cloned group than in the control group.
First, the effect of cloning on innate immune gene expression was studied in the two obese pig groups (clones vs. controls). In the liver (see Supplementary Table 1), gene expression was unchanged by cloning except for two significantly differentially upregulated genes (LBP and SAA); however, the approximately three-fold upregulation in liver SAA expression in obese clones was not reflected in serum SAA concentration (data not shown). The same pattern was observed in lean clones compared to lean controls, because SAA expression in the liver was upregulated by 2.5-fold with no concomitant rise in serum SAA concentrations (Rødgaard et al., 2012). Previous studies into the expression of the APP ORM have also found no relationship between gene expression in various tissues and serum concentrations in obese humans and pigs (Alfadda et al., 2012; Rødgaard et al., 2013). In each of the adipose tissues, one gene showed a changed expression in obese cloned pigs compared to obese controls (see Supplementary Table 1). Overall, the number of genes expressed in obese clones compared to obese controls was smaller than observed in lean clones compared to lean controls, where two to five genes were differentially expressed in the adipose tissues (Rødgaard et al., 2012). For tissue expression patterns, only very few genes were expressed at significantly different levels in VAT and abdominal SAT compared to neck SAT in the cloned pigs. As discussed below, cloning also reduced differentiated expression in lean pigs (Rødgaard et al., 2012), however not to the same degree as seen in obese pigs.
Second, the response to obesity was compared between clones and controls. In all other tissues than VAT, obesity resulted in fewer gene expression changes in cloned pigs than in control pigs. In cloned pigs, all adipose tissue genes affected by obesity were downregulated, whereas in the adipose tissue of the control pigs, a mixed gene expression response to obesity was seen. The general downregulation of the adipose tissue response to obesity in the clones observed here is surprising because it does not confirm the elevated levels of immune factors reported to be secreted by adipose tissue in obese subjects (for review, see, for example, Fain, 2010; Weisberg et al., 2003). Several of the innate immune factors investigated here are known to be secreted by active immune cells in adipose tissue (Fain et al., 2004; Weisberg et al., 2003). Increased infiltration and activity of immune cells are expected in obesity as part of the low-grade adipose-located inflammation implicated in the obesity-related disease syndrome (Bastard et al., 2006; Hotamisligil, 2006); however, one possible reason why the adipose tissue of the obese clones express less chemokines and/or the immune cells might not be activated to the same degree as seen in the controls could be that obese clones were significantly less obese than the obese controls in this study.
Finally, looking at relative gene expression levels (differential expression) among the three adipose tissue types, neck SAT generally showed the lowest gene expression levels of the immune factors studied here in all four groups of pigs. More genes were more highly expressed in either VAT or abdominal SAT or both in the controls compared to the clones. In the obese clones, this could be explained by the difference in percentage of body fat between the obese clones and controls (Figs. 1 and 2); however, this does not explain the lowered gene expression changes in lean clones compared to lean controls. The weights of lean clones and controls were similar, even though a significantly different daily weight gain was observed, and the two groups showed a very similar response to the diet, as reported by (Christensen et al., 2012). Therefore, it would seem that the cloning procedure in itself is a factor in limiting the differentiation of innate immune response gene expression.
Differences between controls and cloned animals were also observed for the serum concentrations of APPs, including ORM and HP (with CRP showing the same tendency), as obese, cloned pigs showed significantly increased serum concentrations of those APPs. It is of interest to note that the liver expression of HP was in fact downregulated in obese clones compared to lean clones and not found to be changed in any other tissue. Thus, the observed increase in serum HP concentration must be ascribed to other, unknown sources. Blood plasma concentrations of CRP, SAA, and IL-6 were found to be elevated in overweight women with cardiovascular disease (Ridker et al., 2000) and serum concentrations of ORM and HP were increased in obese humans (Chiellini et al., 2004; Lee et al., 2010). So taken alone, the cloned pigs seem to reflect this obesity response better than the control pigs, even if proinflammatory cytokines like TNF-α and IL-6, classically involved in the low-grade inflammation of obesity (for review, see Tataranni and Ortega 2005) were not detected in either obese controls or obese clones (data not shown).
Overall, cloning decreased the number of genes responding to obesity in all tissues (except VAT) investigated and also decreased the number of genes being differentially expressed in the three different adipose tissues investigated, both in lean and obese pigs. There was a small difference in the genetic background of the clones (65% Landrace:35% Yorkshire) and the two control crossbreeds (36%:64% and 75%:25%); however, it may be assumed that this small genetic difference will not by itself lead to the observed gene expression differences between clones and controls. This is supported by the fact that the two control crossbreeds, which differ slightly genetically (see above), did not show any difference in reference gene expression (data not shown). One possible explanation for the more limited gene expression changes seen in obese cloned animals as opposed to obese control animals is the lower feed intake of the cloned pigs (Christensen et al., 2012) and the consequently lower final weight than the obese controls, simply leading to a reduced “obesity effect” on the animal. Interestingly, however, we did find changes (increases) in the serum concentrations of APPs in the obese, cloned pig group compared to the other three groups, whereas control pigs showed obesity-induced changes in the expression in a number of innate immune system–related genes in all of the four tissues investigated. These controls, however, did not show any change in circulating APP or cytokine serum concentrations as a response to obesity. Taken together, this may indicate that the less differentiated and more constant expression of innate immune genes in the cloned pigs might result in a decreased ability to cope with obesity as indicated by the observable changes in APP concentrations. This is probably related to inflammation and is originating from an extrahepatic source.
In summary, as in the lean pigs (Rødgaard et al., 2012), cloning did not reduce interindividual variability in innate immune gene expression between obese pigs. Furthermore, cloning influenced the expression of one to two innate immune genes in each of the tissues of obese clones compared to obese controls. In light of these results and other published data (Christensen et al., 2012; Clausen et al., 2011; Jensen et al., 2010), it can be concluded that cloning does not increase the usability of pigs as model animals for innate responses to diet-induced obesity, even though cloned pigs showed an increase in serum APP concentrations in agreement with human studies.
Footnotes
Acknowledgments
Karin Tarp Wendt is acknowledged for her excellent help with qPCR and Mette Skou Hedemann, Winnie Østergaard, and Jens Askov Jensen for help with tissue sampling. The project was financially supported by a grant from the Danish Strategic Research Council (FØSU 2101-06-0034).
Author Disclosure Statement
The authors declare that no conflicting financial interests exist.
References
Supplementary Material
Please find the following supplemental material available below.
For Open Access articles published under a Creative Commons License, all supplemental material carries the same license as the article it is associated with.
For non-Open Access articles published, all supplemental material carries a non-exclusive license, and permission requests for re-use of supplemental material or any part of supplemental material shall be sent directly to the copyright owner as specified in the copyright notice associated with the article.