
Abstract
Abstract
In this study, we estimated the distribution of DNA diploidy and aneuploidy in porcine mesenchymal stem cells (pMSCs) that were subjected to osteoblast/osteocyte and adipocyte differentiation to determine the impact of long-term in vitro culture and differentiation on the cell cycle distribution and nuclear DNA profile. This determination could be helpful to confirm or exclude the suitability of physico-chemical culture conditions for the purposes of both the maintenance of an undifferentiated state and to promote differentiation in pMSCs. Flow cytometry was applied to analyze the cell cycle and occurrence of aneuploidy/diploidy, and real-time PCR was used to quantify aP2 and osteocalcin, markers of adipocytes and osteocytes, respectively. The chi-squared test was used to compare the total rates of G0/G1-, S-, and G2/M-phase cell fractions with diploid and aneuploid DNA and the DNA index ratios between three experimental groups of pMSCs. Five weeks of in vitro culture under differentiating conditions resulted in a considerable reduction of DNA stability and a remarkable increase in the rate of cells exhibiting an aneuploid DNA stem line; however, a similar dependence was not found in the nondifferentiated MSCs. Furthermore, the cell fraction rates in each phase of the mitotic cycle and the DNA index (DI) were calculated. The results of real-time PCR for aP2 and osteocalcin proved positive MSC differentiation toward adipocytes and osteocytes. In terms of the possible use of differentiated MSC lines in tissue engineering and regenerative medicine, we propose cytokinetic diagnostics using flow cytometry as an objective and useful method for screening the tumor-forming capacity and malignancy potential of both in vitro long-term cultured MSCs and MSCs subjected to ectopic differentiation.
Introduction
Research evaluating the risk of cross-species infection and its possible elimination is ongoing, and some success has already been achieved in this field, e.g., in the development of porcine heart valves prepared for clinical use. Porcine heart valves appropriately fixed are of better utility compared to commercially available bioprosthetic heart valves due to their greater tissue resistance to calcification, enzymatic degradation, and reduced cytotoxicity (Cyganek-Niemiec et al., 2012). Complete degradation of porcine endogenous retrovirus (PERV) DNA was observed after glutaraldehyde fixation (Moza et al., 2001) and after diepoxide fixation (Cyganek-Niemiec et al., 2012) of porcine heart valves prepared for clinical use.
Such research relies on MSCs due to their multilineage potential and characteristics; in particular, MSCs do not express antigens of the class II major histocompatibility complex (MHC II) on their cell surface and suppress lymphocyte reaction (Tse et al. 2001, Tse et al. 2003). Therefore, these cells can be used in preclinical and clinical research programs aimed at xenotransplantation of tissues and organs (xenograft transplantation surgery). However, cells growing in vitro under stressful and/or unoptimized conditions for long periods may become aneuploid or polyploid, or display a propensity for the structure-based mutagenesis of genes and chromosomes that is triggered by various ex vivo culture environmental factors.
Common structural mutagenic alterations include DNA rearrangements, chromosomal deletions, and other heritable chromosome abnormalities. All of the above-mentioned numerical/quantitative and structural chromosomal aberrations could predispose ex vivo–proliferating cells to serious pathologies, including the diversification of immortalized precancerous cell lineages or neoplastic transformation (Lindvall and Kokaia, 2009; Rubio et al., 2005; Zhou et al., 2006). Aneuploid chromosome complements are most frequently caused by a weakened or completely inactive mitotic checkpoint and the resulting nondisjunction of sister chromatids during the anaphase segregation of nonhomologous daughter chromosomes. Multiple aneuploid chromosomal losses and/or the presence of supernumerary individual chromosomes can also be caused by anaphasic lagging in the unequal separation of sister chromatids during the movement of nonhomologous chromosomes from the center of the mitotic spindle toward the spindle poles (Devalle et al., 2012; Foudah et al., 2009; Qin et al., 2009; Zhang et al., 2007).
The in vitro culture of cells for extended periods of time can also give rise to the physiological, molecular, and epigenetic aging that is related to replicative senescence. Replicative senescence results from a limitation of both the cellular life span and number of cell population doublings, an irreversible time delay/time lag in cell cycle progression, and a lack of and/or diminishment of telomerase activity and the resulting enhancement of telomere attrition (Bork et al., 2010; Izadpanah et al., 2008; Røsland et al., 2009; Schallmoser et al., 2010).
The nuclear DNA content of a cell can be quantitatively measured by flow cytometry in which a fluorescent dye binds stoichiometrically to DNA, and the stained material, thus, incorporates an amount of dye that is proportional to the amount of DNA (Assailly et al. 1999; Bihari et al., 2003). Because flow cytometric analysis is based on the DNA content, the results of this analysis should be clearly differentiated from the data obtained using cytogenetic techniques. Although the cytogenetic diploidy status is compatible with the number of homologous chromosome sets equal to 2n, the cytometric diploid/euploid DNA modal value is equivalent to the number of chromatids equal to the level of either 2C DNA in the cells at the G0/G1 phase or 4C in the cells at the G2/M phase of the cell cycle (Foudah et al., 2009; Nikitina et al. 2011). To emphasize the difference between cytometric DNA aneuploidy/polyploidy and cytogenetic chromosomal aneuploidy/polyploidy, the prefix DNA must be considered (Kimball et al., 1997; Osterheld et al., 2004; Remmerbach et al., 2001). Nevertheless, the absence of abnormal DNA in MSCs does not exclude the existence of an abnormal karyotype, such as balanced chromosome translocations. Accordingly, a negative cytometric result should be referred to as no evidence of abnormal DNA in MSCs.
The cytometric estimation of the degree of DNA content aberration is commonly expressed as the DNA index (DI), the quantitative ratio of the G0/G1 peak channel in a DNA histogram of the experimental sample to the G0/G1 peak channel of the reference sample, with normal mammalian DNA-diploid cells or cell nuclei as the reference (Nunez, 2001). This index is a measure of DNA aneuploidy or abnormal DNA content; a DI of 1.0 represents a normal diploid DNA content, whereas deviations in cellular DNA content values other than 1.0 indicate DNA aneuploidy or polyploidy. A diagnosis that confirms the occurrence of DNA aneuploidy/polyploidy should be reported only when at least two separate G0/G1 peaks are demonstrated (Bihari et al., 2003; Kimball et al., 1997; Nunez, 2001).
As a result of the possibility of measuring the relative cellular DNA content, flow cytometry also enables the identification of the cell cycle phases. Five distinct phases can be recognized in a proliferating cell population: G0, G1, S (DNA synthesis), G2, and M phases (mitosis). However, G0- and G1-phase sets and G2- and M-phase sets, which have an identical DNA content (i.e., number of nonsister chromatids equal to 2C and 4C, respectively), cannot be discriminated on the basis of differences in the level of nuclear DNA molecules (Assailly et al., 1999; Li et al., 2005; Nunez, 2001).
It is not yet possible to fully predict or control MSC behavior, the molecular mechanisms underlying MSC plasticity, multipotency, proliferative activity, self-renewal, and lineage commitment, or their ability to transform spontaneously. However, through the use of standardized culture conditions and high-quality hMSCs, their spontaneous transformation (i.e., multilineage cytodifferentiation, transdetermination/transdifferentiation and oncogenic transformation, and tumor-supporting potential) should be limited or avoided in vitro.
Therefore, the aim of the present study was to analyze the DNA diploidy and aneuploidy distribution of porcine undifferentiated and differentiated MSCs to assess the impact of long-term in vitro culture and differentiation on the cell cycle distribution and DNA profile. This assessment could be helpful in estimating the impact of culture conditions on undifferentiated and differentiated MSCs in terms of possible their use for xenotransplantation experiments, cell therapy, and tissue engineering in human medicine.
Materials and Methods
Animal care
Three outbred Polish Large White (PLW) pigs of either sex, weighing 15–20 kg each, were maintained under conventional conditions in the Institute's Experimental Station in Rudawa. All animal procedures were approved by the Local Animal Care Ethics Committee No. II in Kraków at the Institute of Pharmacology of the Polish Academy of Sciences.
Isolation and in vitro culture of porcine mesenchymal stem cells
Pig mesenchymal stem cells (MSCs) were isolated by bone marrow aspirates from the iliac crests of the animals. The bone marrow was aspirated under general anaesthesia. Mononuclear cells were collected by gradient centrifugation at 400×g for 20 min over a layer of Ficoll-Paque Plus (Stem Cell Technologies; SCT, Canada). Single-cell suspensions were seeded at a concentration of 1×10⁸ cells/cm2 per 75-cm2 culture flask (Corning, USA) containing a growth/nondifferentiation medium that was formulated to support adult stem cell expansion and preserve stable stemness. This medium was comprised of low-glucose Dulbecco's modified Eagle's medium (DMEM; Sigma-Aldrich, Germany) and supplemented with 10% fetal bovine serum (FBS; Sigma-Aldrich, Germany) and 1% antibiotic-antimycotic solution (AAS; Sigma-Aldrich, Germany). The cells were plated in 75-cm2 Corning cell culture flasks in 17 mL of culture medium and incubated at 39°C and 5% CO2 in 100% humidified air. The nonadherent cells were removed after the first 24 h, and small portions of culture medium containing the suspended cells not attached to the bottom of the culture flask were changed every 3 days thereafter. When the cell monolayers reached 80% confluence, they were detached and digested into single-cell suspensions using 0.25% trypsin-0.01% EDTA solution (Sigma-Aldrich, Germany) and either replated at a density of 1×10⁴ cells/cm2 for mitotic clonal expansion or frozen (Bosch et al., 2006; Dominici et al., 2006; Foudah et al., 2009).
In vitro differentiation of MSCs into osteogenic and adipogenic cells
The porcine MSCs were analyzed for their capacity to differentiate toward putative osteo- and adipoprogenitor cells. Porcine MSCs that were multiplied through in vitro mitotic proliferation and migration in culture medium (DMEM) lacking any cytodifferentiating agents comprised the control group. The porcine MSCs were seeded at approximately 4×10³ cells/cm2 onto the bottom of culture flasks in DMEM supplemented with 10% FBS (Sigma-Aldrich, Germany). After the first replenishment of the culture medium, the cells were grown in DMEM alone or in osteogenic differentiation medium (ODM) consisting of the same culture medium with the addition of 100 nM dexamethasone (Sigma-Aldrich, Germany), 10 mM β-glycerophosphate (Sigma-Aldrich, Germany), and 0.05 mM ascorbic phosphate acid (Sigma-Aldrich, Germany) or in adipogenic differentiation medium (ADM) comprised of DMEM supplemented with 10% FBS, 500 μM isobutylmethylxanthine (Sigma-Aldrich, Germany), 100 μM indomethacin (Sigma-Aldrich, Germany), and 1 μM dexamethasone (Abbah et al., 2008; Foudah et al., 2009; Heino and Hentunen, 2008; Juhásová et al., 2011; Ringe et al., 2002).
Flow cytometry–mediated analysis of cell cycle and simultaneous cytokinetic measurements for screening aneuploidy and associated diploidy
Flow cytometry was performed to calculate the cell percentages in each cell cycle phase and to measure the DI, the aneuploid/euploid DNA content ratio. Briefly, MSCs, presumptive osteogenic cells (osteoblasts) and adipoprogenitor cell lines that had been harvested by trypsinization were disaggregated into single-cell suspensions. The cell samples were permeabilized by a 30-sec exposure to a 0.1% solution of Triton X-100 (Sigma-Aldrich, Germany) at the ratio of 1 mL of cell sample to 2 mL of Triton X-100 solution (105 –106 cells/mL), followed by centrifugation at 500×g for 5 min. The sedimented cell pellets were extensively rinsed and resuspended in 10 mL of HEPES buffer solution (Sigma-Aldrich, Germany) and then exposed to DNA staining and RNA digestion solution for 60 min at room temperature in the dark. This solution was comprised of 30 μg mL−1 propidium iodide (PI; Molecular Probes, USA) at a concentration of 1 mg/mL (1.5 mM) in distilled water (dH2O) and 0.3 mg mL−1 bovine pancreatic RNase A (Sigma-Aldrich, Germany), both diluted in 10 mL of Tris-EDTA buffer (Sigma-Aldrich, Germany) (Bihari et al., 2003; Boquest et al., 1999; Kimball et al., 1997). The cells dyed with PI and simultaneously depleted of RNA molecules were analyzed using a Galaxy flow cytometer (DAKO Galaxy and Partec PAS, Germany) by measuring the DNA fluorescence in the red band (λmax=675 nm). The DNA fluorescence spectra emitted by cell doublets were discriminated by the pulse-processing method (area vs. height fluorescence signal). No less than 1×10⁴ cells per cell sample were diagnosed. The identification and quantification of DNA aneuploidy/euploidy states and the cell cycle phase calculations were accomplished with the aid of the ModFit LT (version 3.2) software (Verity Software House, VSH, USA).
Real-time PCR quantification of aP2 and osteocalcin in adipocytes, osteocytes, and nondifferentiated MSCs
Total RNA was isolated as described previously (Chomczynski, 1993). The relative expression level of glyceraldehyde-3-phosphate dehydrogenase (GAPDH) was used to normalize marker gene expression in each sample. One-step Brilliant II SYBR Green QRT-PCR Master Mix Kit (Stratagene, La Jolla, CA, USA) was used to perform the relative quantification of gene expression. Each PCR reaction (total volume of 25 μL) consisted of 1 μL of total RNA (50 ng) and 24 μL of the following reaction mixture: 12.5 μL of 2×SYBR Green QRT-PCR master mix [containing optimized RT-PCR buffer, MgCl2, nucleotides (GAUC), SureStart® Taq DNA polymerase, SYBR Green, and stabilizers], 0.4 μL of each 200 nM forward and reverse primer (see Table 4, below), 1 μL of RT/RNase block enzyme mixture, and 9.7 μL RNase-free water. The thermal cycling conditions were as follows: 30 min at 50°C (for first-strand synthesis); 10 min at 95°C; 35 cycles of 30 s at 95°C for denaturation, 60 s at 57°C for annealing, and 30 s at 72°C for extension.
The experiments were performed using a Realplex (Eppendorf, UK Limited, Cambridge). GAPDH was used as the endogenous standard, and the results for the individual target genes were normalized according to the relative concentration of the endogenous standard. Each reaction was performed in triplicate, and the results obtained were averaged. The results for adipocytes and osteocytes were compared with the control nondifferentiated MSCs, which served as a calibrator.
Statistical analysis
The chi-squared test was used to compare the total rates of G0/G1-, S-, and G2/M-phase cell fractions with the diploid (i.e., euploid) and aneuploid (i.e., hypoploid and hyperploid) DNA stem lines and the DI ratios between three experimental groups of porcine bone marrow–derived MSCs (nondifferentiated and in vitro differentiated into osteogenic and adipogenic cell derivatives). The effects of the MSC culture conditions were categorized as follows: Significant at the level of random error probability value 0.01<p≤0.05, highly significant at the level of 0.001<p≤0.01, and very highly significant at the level of p≤0.001.
Results
Figure 1 represents the DNA histograms obtained using flow cytometry, showing the distribution of cycling MSCs in the various phases of the cell cycle. The DNA histograms of PI-tagged MSCs emitting bright red fluorescence provided data for the percentages of cells in the following stages of the cell cycle: G0/G1 (2C DNA content), S (between 2C and 4C), and G2/M (4C). Prominent G0/G1 DNA peaks were detected in the control MSCs not subjected to differentiation (Figs. 1 and 2). The vast majority of MSCs at a given point in time remained in the G0/G1 stages. The percentage of DNA-aneuploid cells was very low compared to the presumptive MSC-descended osteoblasts/osteocytes and adipocytes (Table 1; Figs. 3 and 4). The DI of the control MSCs was the closest to 1 and the highest compared to both groups of differentiated cells, proving that these cells represented a normal diploid DNA content (Table 1). Interestingly, the total rates of both DNA-aneuploid S-phase cell fractions and DNA-diploid S-phase cell fractions were the highest in one of the clonal cell lines of nondifferentiated MSCs, suggesting that enhanced DNA replicative activity might occur in this cell line (Table 1). This finding can be correlated with the increased ability of the cells to undergo mitotic proliferation, which, in turn, may lead to their acquisition of a precancerous immortality state triggered by DNA aneuploidy-mediated mutagenic alterations in gene expression (Casado et al., 2012; Røsland et al., 2009; Tang et al., 2012). These profound mutagenic genome transformations can be induced by either a decreased/hypoploid level of nuclear DNA (nDNA) molecules (i.e., a monosomic and/or nullisomic number of nonsister chromatids less than 4C−2 and/or 4C−4, respectively) or their elevated/hyperploid level (i.e., a trisomic and/or uniparentally disomic or tetrasomic number of nonsister chromatids less than 4C+2 and/or 4C or 4C+4) (Devalle et al., 2012; Josse et al., 2010; Li et al., 2005; Qin et al., 2009).

Examples of bimodal stem line DNA histograms generated from the ModFit LT software-based flow cytometric analysis of porcine bone marrow-derived MSCs cultured under nondifferentiating and differentiating (osteogenic and adipogenic) conditions. The black-highlighted DNA stem line peaks show the cell fractions with a euploid/diploid DNA copy number. The gray-highlighted DNA stem line peaks represent the cells fractions with an aneuploid DNA content.
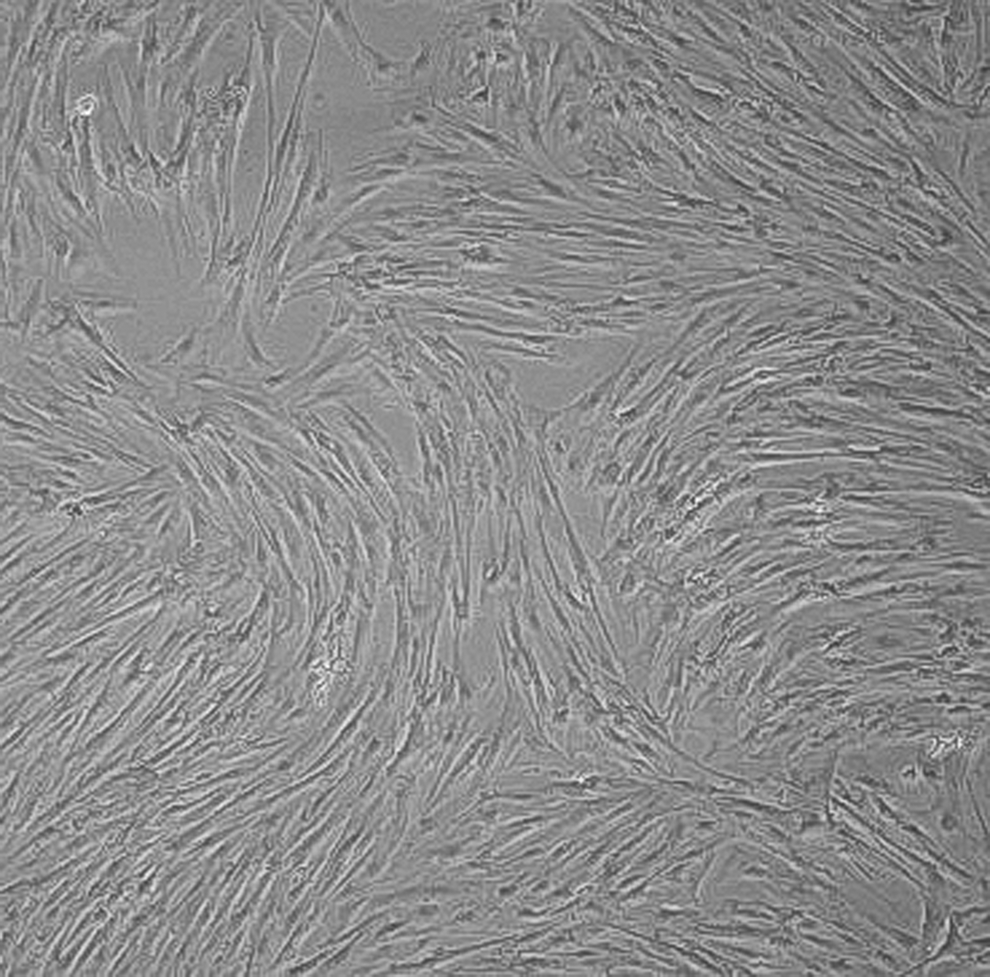
Porcine bone marrow-derived MSCs cultured in vitro for 5 weeks in a medium preserving stable stemness. Original magnification, 100×.
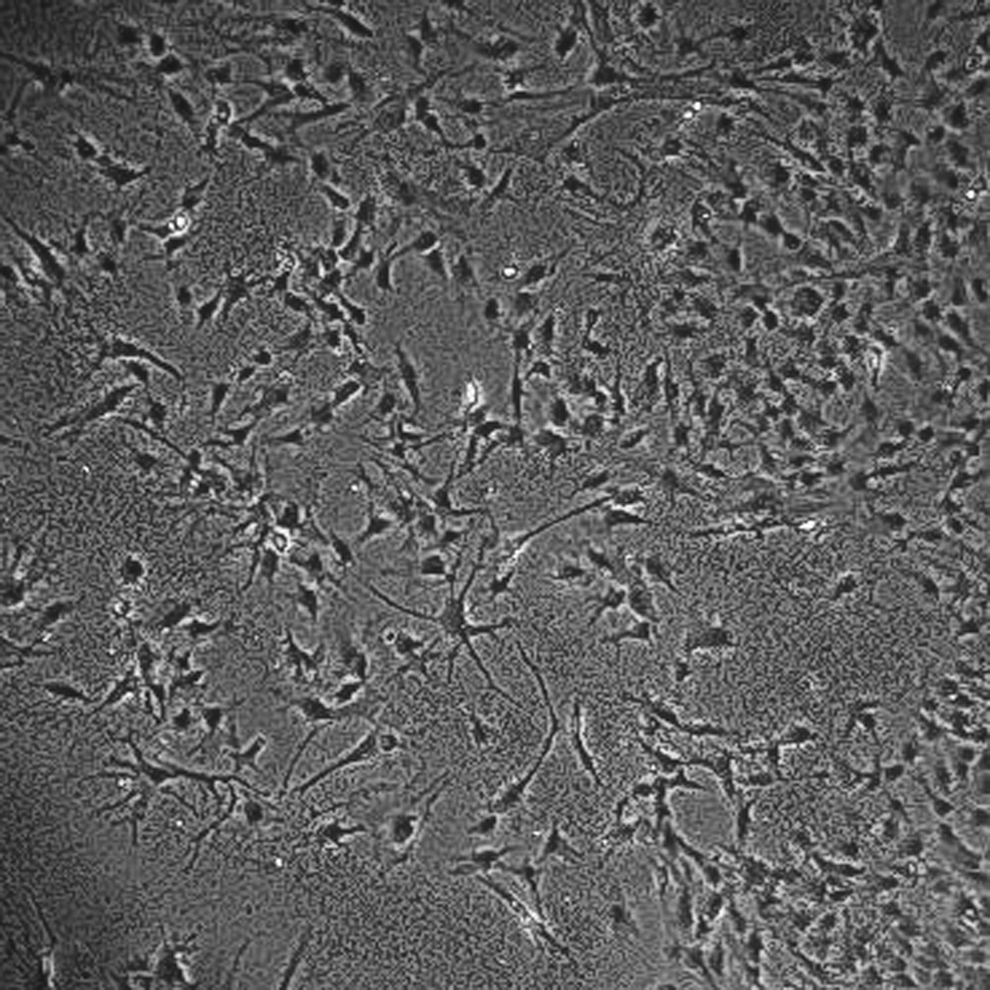
Porcine bone marrow-derived MSCs cultured in vitro in osteogenic differentiation medium for 5 weeks. Original magnification, 100×.
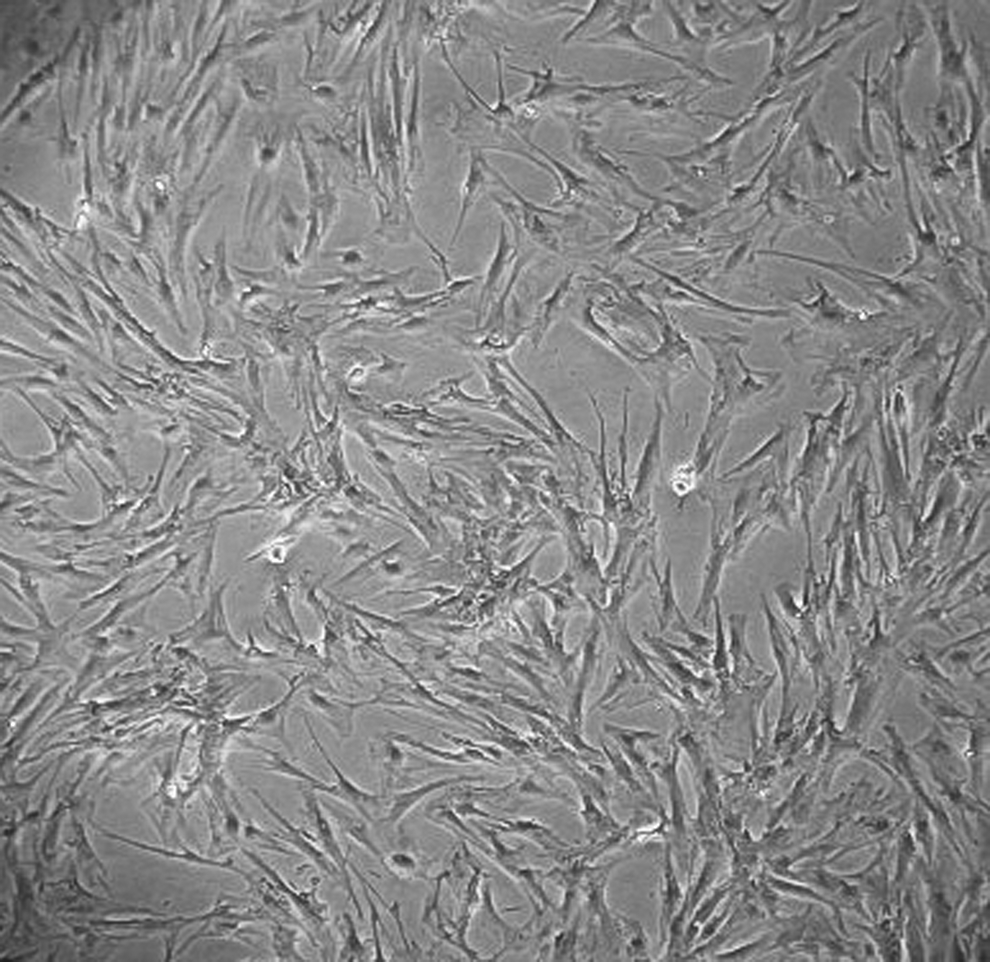
Porcine bone marrow-derived MSCs cultured in vitro in adipogenic differentiation medium for 5 weeks. Original magnification, 100×.
The values with identical superscript letters within the same row do not vary significantly (p>0.05, chi-squared test).
The values with different superscript letters within the same row differ significantly (0.01<p≤0.05, chi-squared test).
The values with different superscript letters within the same row differ significantly (p≤0.001, chi-squared test).
The values with different superscript letters within the same row vary significantly (0.001<p≤0.01, chi-squared test).
MSCs, mesenchymal stem cells.
Ectopic cytodifferentiation markedly increased the frequencies of DNA-aneuploid cells. The cultures that differentiated into both osteoblasts/osteocytes and adipocytes contained high rates of DNA-aneuploid cells distributed in the G0/G1 and G2/M stages compared to the control treatment (Fig. 1; Tables 1 and 2). Comparing the aneuploid DNA modal values in the in vitro–differentiated cells, it can be observed that the cell lines of osteoblasts/osteocytes and adipocytes were characterzed by similar percentages of cells with an altered DNA profile (Table 2). Additionally, a higher incidence of DNA-aneuploid cells residing in the G0/G1 and G2/M phases of the cell cycle was found in the MSC subpopulations that differentiated into osteoblasts/osteocytes and adipocytes than in the control MSC subpopulations (Table 2). The aneuploid G0/G1-phase and G2/M-phase DNA modal values were consistent with the reduced (hypoploid) levels of nDNA molecules (i.e., a monosomic and nullisomic number of nonsister chromatids equal to 2C−1/2C−2 and 4C−2/4C−4, respectively). Nonetheless, the aneuploid DNA stem lines within the G0/G1-phase and G2/M-phase cell fractions could also be partially due to an increased (hyperploid) nDNA content (i.e., a trisomic/uniparentally disomic and tetrasomic number of nonsister chromatids equal to 2C+1/2C/2C+2 and 4C+2/4C/4C+4, respectively). However, the prevalence of MSC-descended osteogenic and adipogenic cell subpopulations displaying DNA hypoploidy (monosomy and/or nullisomy) appeared to be much higher than that in the cell subpopulations afflicted with such DNA hyperploidies as DNA trisomy, uniparental DNA disomy, or DNA tetrasomy.
Comparison of the statistical intergroup variation in the frequencies of DNA-diploid cells at different phases of the mitotic cycle among the subpopulations of nondifferentiated MSCs, MSCs differentiated into osteogenic cell derivatives, and MSCs differentiated into adipogenic cell derivatives.
The values with identical superscript letters within the same column do not vary significantly (P>0.05, chi-squared test).
Comparison of the statistical intergroup variations in the frequencies of DNA-aneuploid cells at different phases of the mitotic cycle among the subpopulations of non-differentiated MSCs, MSCs differentiated into osteogenic cell derivatives, and MSCs differentiated into adipogenic cell derivatives.
The values with identical superscript letters within the same column do not differ significantly (p>0.05, chi-squared test).
The values with different superscript letters within the same column vary significantly (p≤0.001, chi-squared test).
The values with different superscript letters within the same column differ significantly (0.001<p≤0.01, chi-squared test).
MSCs, mesenchymal stem cells.
This finding was confirmed by the fact that the subpopulations of cells with a DNA content that was decreased by approximately one-fourth of the basal value of a DI equal to 1, which represents the normal cells exhibiting DNA diploidy, were more numerous/predominant. Moreover, osteogenic differentiation resulted in the highest frequency of DNA-diploid cells entering S phase (Table 2). The abundance of MSC osteoprogenitor cell derivatives that were accumulated in the S stage of the cell cycle indicates that these cells did not fail to maintain an increased DNA replicative and cellular proliferative potential. This situation may provide a sufficient basis for the enhancement/acceleration of the intracellular cytophysiological and metabolic activity of osteoblasts before their final structural-functional (morphological, biochemical, biophysical, molecular, and epigenetic) specialization into osteocytes has ceased (Bork et al., 2010; Heino and Hentunen, 2008; Juhásová et al., 2011; Monaco et al., 2012). According to the DNA histograms obtained (Fig. 5), it can be concluded that the sizes of the control undifferentiated MSCs was similar to the sizes of their adipogenic cell derivatives. In contrast, the MSC-descended osteoprogenitor cells (osteoblasts) were smaller than their adipoprogenitor cell counterparts and control MSCs because the strength of the forward scatter that was computed for the presumptive osteoblasts/osteocytes was 10-fold lower than that for the nondifferentiated MSCs exposed to the medium that preserved their stable stemness and that for the MSC-derived specialized cells exposed to adipogenic differentiation medium.
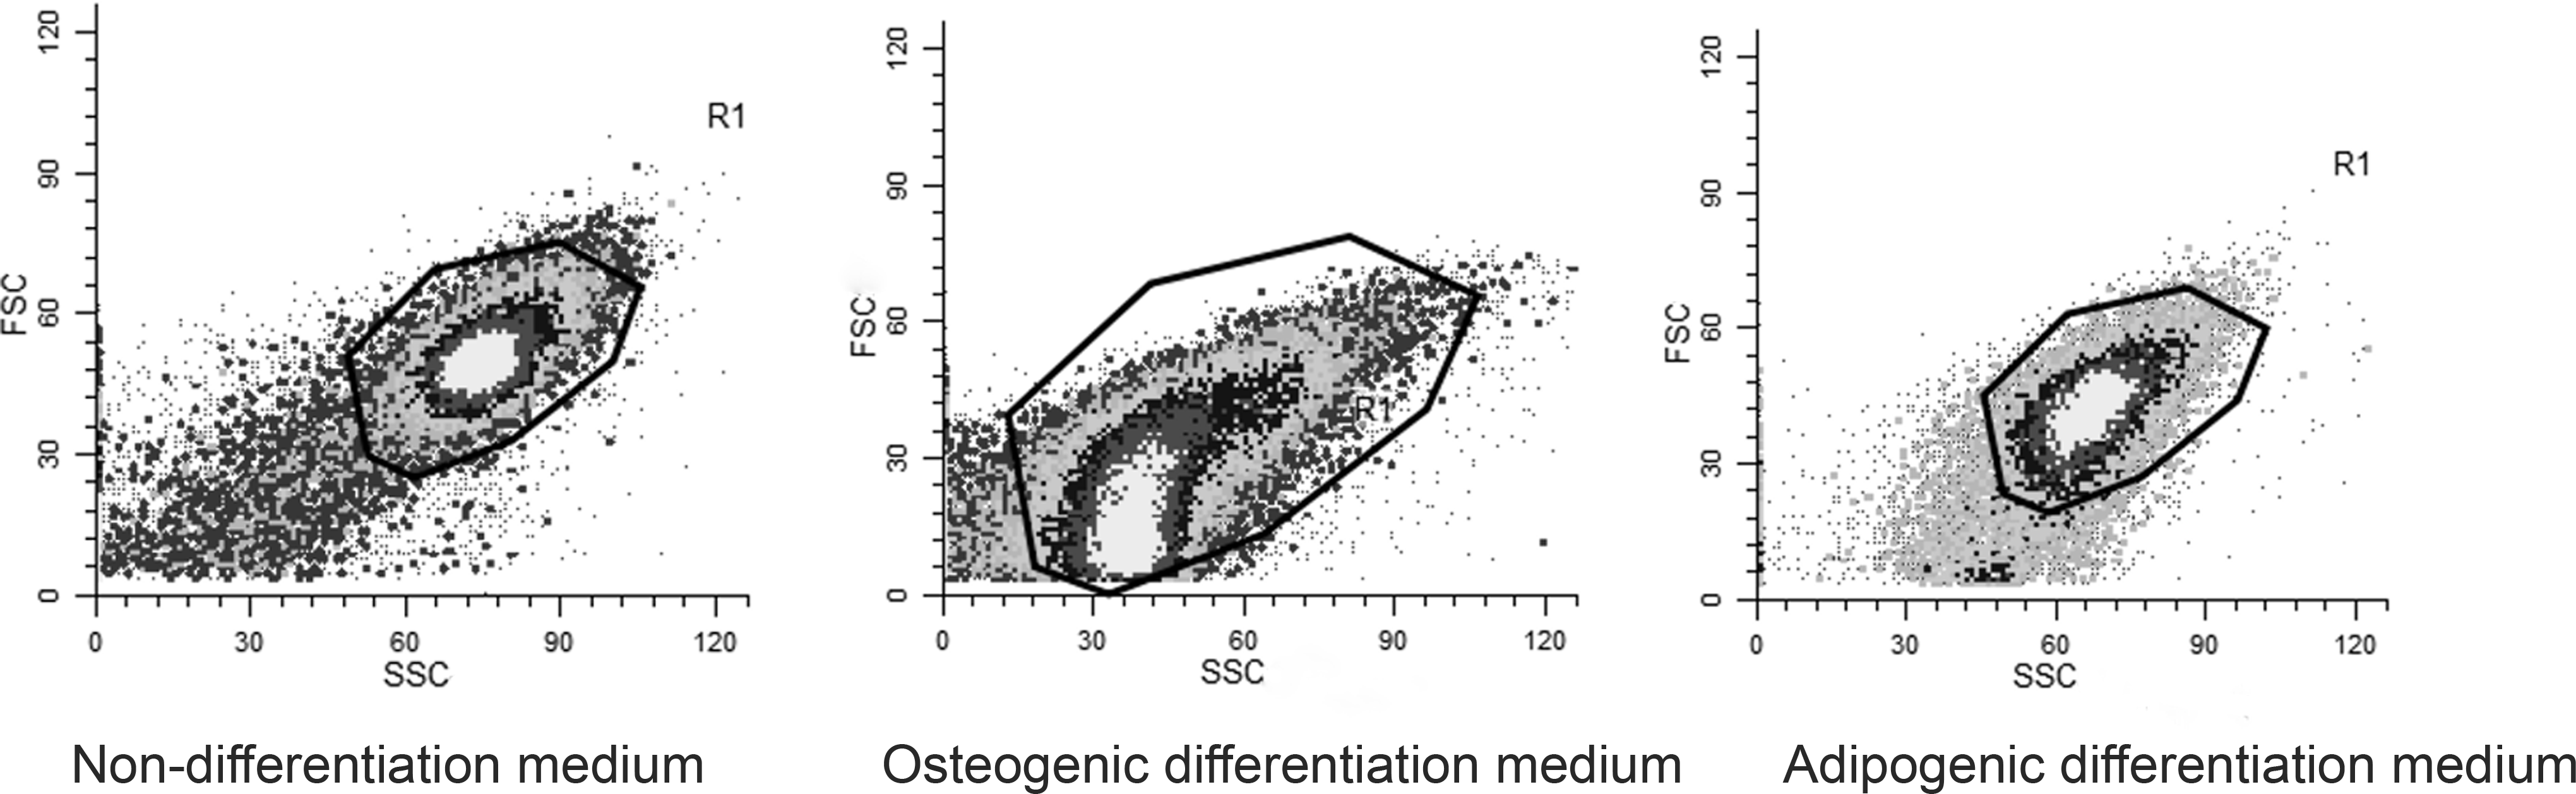
Examples of DNA histograms computing the cell size range of the flow cytometrically analyzed cell fractions of MSCs cultured under nondifferentiating and differentiating (osteogenic and adipogenic) conditions.
This study also demonstrated that the MSCs cultured for 5 weeks in adipogenic and osteogenic differentiation medium underwent proper differentiation. The results of real-time PCR for aP2 and osteocalcin verified the positive differentiation of MSCs toward adipocytes and osteocytes. Table 3 represents the mRNA level of the adipogenic and osteogenic markers versus the porcine bone marrow-derived MSCs cultured in nondifferentiation medium, which served as a control. Table 4 provides the primers used for the real-time quantitative PCR detection of both aP2 and osteocalcin.
ADM, adipogenic differentiation medium; ODM, osteogenic differentiation medium.
Discussion
We have reported the quantification of the DNA diploidy and aneuploidy distribution and DNA heterogeneity in flow cytometrically analyzed cell lines of MSCs and MSC-descended osteoblasts/osteocytes and adipocytes. Furthermore, the cell fraction rates in each phase of the mitotic cycle and the measurement of the DI were calculated. As aneuploidy reflects an altered DNA profile (Bihari et al., 2003; Li et al., 2005; Osterheld et al., 2004), we demonstrated that long-term cultured MSCs that underwent in vitro differentiation into osteo- and adipoprogenitor cells exhibited high rates of DNA aneuploidy both at the G0/G1 stage and at the G2/M stage. This finding may indicate that enhanced DNA transcription and RNA translation processes can occur after the completion of cytodifferentiation in the osteogenic and adipogenic cell derivatives of MSCs (Casado et al., 2012; Monaco et al., 2012). Simultaneously, as a result of extended differentiating culture, profound DNA aneuploidy-based mutagenic changes were initiated in these cells, suggesting that the cells remaining in the G0/G1 phase can display a reduced ability to proliferate and migrate and can be susceptible to replicative senescence through retardation/slowness or the inhibition of cell cycle progression (Bork et al., 2010; Schallmoser et al., 2010). Nevertheless, the high frequency of occurrence of aneuploid cells existing in the G2/M stage can provide evidence for their increased proliferative activity, which can lead to the acquisition of precancerous immortality (Izadpanah et al., 2008; Rubio et al., 2005; Tolar et al., 2007; Zhou et al., 2006).
Cells grown for long periods (for 5 weeks in the case of in our experiments) or under stressful culture conditions may be susceptible to DNA aneuploidy- (e.g., trisomy or monosomy) and polyploidy-induced changes in gene expression, which can contribute to an elevated incidence of transcriptomic, proteomic, and metabolomic alterations in the cellular phenotype (Casado et al., 2012; Foudah et al., 2009; Izadpanah et al., 2008; Monaco et al., 2012; Vacanti et al., 2005). In these cells, DNA rearrangements, chromosomal deletions, and other structural mutagenic genome abnormalities may also occur, which could predispose these cells to severe pathocytophysiological disorders, including oncogenic transformation (Lindvall and Kokaia, 2009; Qin et al., 2009; Røsland et al., 2009; Tolar et al., 2007). Indeed, there are many reports of flow cytometry analysis as a more objective and reproducible determinant of the biological behavior and cytophysiological characteristics of tumors (Nunez, 2001; Røsland et al., 2009; Rubio et al., 2005; Tolar et al., 2007). Flow cytometric analysis enables an accurate measurement of the DNA content of individual cells and quantification of DNA-ploidy modes. This technique has been performed on various premalignancy-related cellular and tissue alterations, and a higher prevalence of cellular DNA aneuploidy was found to be one of the most important pathophysiological symptoms (Nikitina et al., 2011; Røsland et al., 2009; Rubio et al., 2005; Tolar et al., 2007). These results suggest that the occurrence of abnormal (aneuploid) DNA may be associated with malignant cancerogenesis. Both the estimation of DNA euploidy/aneuploidy levels and calculation of the range of ratios of cell fractions residing in the different cell cycle phases have been correlated with the clinical features of preneoplastic lesions and metastatic neoplasms and also patient survival rates for tumours (Assailly et al., 1999; Josse et al., 2010; Kimball et al., 1997; Ueyama et al., 2012).
In terms of the possible use of differentiated MSCs in tissue engineering and regenerative medicine (Caplan, 2007; Juhásová et al., 2011; Motlík et al., 2007; Ringe et al., 2002) we propose that cytokinetic diagnostics by flow cytometry is an objective and useful method for screening the tumor-forming capacity and malignancy potential of both in vitro long-term cultured and telomerase-positive MSCs and MSCs subjected to ectopic differentiation (Røsland et al., 2009; Tolar et al., 2007; Zhou et al., 2006). Moreover, the results of the current investigation indicated that the 5-week in vitro culture of MSCs under differentiating conditions altered their DNA stability and remarkably increased the percentage of DNA-aneuploid cells. In contrast, such dependence was not demonstrated in nondifferentiated MSCs that were cultured in a medium that preserved stable stemness or in cells undergoing differentiation.
Proper cell cycle coordination is necessary for the successful production of mammalian embryos by the somatic cell nuclear transfer technique (Samiec et al., 2012). The mitotic cycle of cultured somatic cells must be artificially synchronized at the G0/G1 stage before the cell nuclei are transplanted into enucleated metaphase II–stage oocytes, which contain a high cytoplasmic concentration and activity of meiosis/maturation-promoting factor (MPF) (Samiec and Skrzyszowska, 2012). This condition is required to preserve correct ploidy in the cells of cloned embryos that undergo mitotic cleavage divisions (Boquest et al., 1999; Gómez et al., 2003). The differentiation media that were used in our experiments affected the dynamics/kinetics of the MSC cell cycle. The cultures grown for 5 weeks under differentiating conditions displayed higher rates of DNA-aneuploid cells compared to the cultures grown for 5 weeks without differentiating conditions. One can, therefore, predict that the use of cell nuclei derived from undifferentiated and short-term-cultured MSCs (primary cultures or young clonal cell lines established after first passage/population doublings) will result in decreased frequencies of preimplantation cloned embryos, the descendant blastomeres of which exhibit quantitative aberrations of both individual chromosomes (such aneuploid alterations as trisomies, tetrasomies, monosomies, and nullisomies) and also entire sets of chromosomes (i.e., polyploidies) (Kumar et al., 2007; Qin et al., 2009; Shi et al., 2004). Accordingly, the reconstruction of enucleated oocytes with the cell nuclei of nonaged MSCs in which replicative senescence and cell cycle retardation do not occur can enhance the developmental outcome of nuclear-transferred embryos possessing cells characterized by a correct/complete number of nuclear DNA molecules (i.e., nonsister chromatids) in homologous chromosome complements throughout mitotic cleavage divisions (Gómez et al., 2006; Jin et al., 2007; Lee et al., 2010; Qin et al., 2009).
Footnotes
Acknowledgments
We would like to thank Prof. Z. Smorąg for critical discussions and Dr. Med. Vet. Jarosław Wieczorek for the bone marrow recovery. We would also like to thank Mgr. Kacper Zukowski for statistical assistance.
This scientific work was financed by the National Center for Research and Development, funds for science in 2009–2012 as a developmental project no. N R13 0075 06, and by the Polish National Science Centre resources allocated on the basis of decision number DEC-2011/03/D/NZ9/05537.
Author Disclosure Statement
The authors declare that no competing financial interests exist.