
Abstract
Abstract
Mouse utricle sensory epithelial cell–derived progenitor cells (MUCs), which have hair cell progenitor and mesenchymal features via epithelial-to-mesenchymal transition (EMT) as previously described, provide a potential approach for hair cell regeneration via cell transplantation. In this study, we treated MUCs with trichostatin A (TSA) to determine whether histone deacetylase inhibitor is able to stimulate the expression of epithelial genes in MUCs, an essential step for guiding mesenchymal-like MUCs to become sensory epithelial cells. After 72 h of TSA treatment, MUCs acquired epithelial-like features, which were indicated by increased expression of epithelial markers such as Cdh1, Krt18, and Dsp. Additionally, TSA decreased the expression of mesenchymal markers, including Zeb1, Zeb2, Snai1, and Snai2, and prosensory genes Lfng, Six1, and Dlx5. Moreover, the expression of the hair cell genes Atoh1 and Myo6 was increased in TSA-treated MUCs. We also observed significantly decreased expression of Hdac2 and Hdac3 in TSA-treated MUCs. However, no remarkable change was detected in protein expression using immunofluorescence, indicating that TSA-induced HDAC inhibition may contribute to the initial stage of the mesenchymal-to-epithelial phenotypic change. In the future, more work is needed to induce hair cell regeneration using inner ear tissue–derived progenitors to achieve an entire mesenchymal-to-epithelial transition.
Introduction
M
Recently, cell reprogramming technology has been used in stem cell research. A dedifferentiation program was suggested for inducing differentiated somatic cells to become pluripotent embryonic-like stem cells (Halley-Stott et al., 2013; Takahashi et al., 2007; Takahashi and Yamanaka, 2006; Yu et al., 2007). Such a dedifferentiation program occurs in mammalian pancreatic epithelial cell cultures, in which pancreatic cells dedifferentiate into mesenchymal-like cells that are able to re-enter the cell cycle, probably via epithelial-to-mesenchymal transition (EMT) (Gallo et al., 2007; Gershengorn et al., 2004; Joglekar and Hardikar, 2010). In the auditory system, we have generated mouse utricle sensory epithelial cell–derived progenitor cells (MUCs) via EMT (Zhang and Hu, 2012). We found that adult mouse utricle sensory epithelial cells underwent EMT to become MUCs that were able to propagate in adherent cultures, express mesenchymal markers, and lose the expression of epithelial markers. Remarkably, these mesenchymal-like MUCs expressed prosensory cell markers, which indicated that MUCs were prosensory-like hair cell progenitors that may be able to differentiate into new hair cells. Prosensory cells are hair cell progenitors because they differentiate into hair and supporting cells during development (Kelley, 2006). In suspension cultures, we found that MUCs formed spherical structures and started to express epithelial markers and bundle-like structures, which indicates that MUCs may possess the potential to become epithelial hair-like cells. However, the yield of epithelial bundle–bearing cells is limited in MUC suspension cultures and/or hanging drops. Furthermore, floating spheres in the suspension culture may drift with fluids and are difficult to handle in vitro and/or in a site-specific implantation, which may restrict its future in vivo application in animal research. In this study, we maintained mesenchymal-like MUCs in adherent cultures to test new methods that were able to guide MUCs to become a number of epithelial cells expressing epithelial genes such as Cdh1. However, how adherent-cultured MUCs can be stimulated to become epithelial cells is still an open question.
Previous studies suggest that epigenetic modifications are involved in the regulation of gene expression (Cheung and Rando, 2013; Liu et al., 2008; Papp and Plath, 2013). Histone modification, which is accomplished by the balance of histone acetyltransferases (HATs) and histone deacetylases (HDACs), is one of the common epigenetic regulation mechanisms involved in the control of the accessibility of the transcriptional machinery to promoter and enhancer elements in the genome. It has been reported that HDAC inhibitors have multiple biologic effects consequent to alternations in histone acetylation (Chikamatsu et al., 2013). Several HDAC inhibitors have been used not only as anticancer drugs but also as a transdifferentiation reagent. For example, an HDAC inhibitor could induce the expression of differentiation marker proteins, morphological change, and functional cytodifferentiation in both human endometrial stromal and epithelial cells (Uchida et al., 2006). In addition, trichostatin A (TSA) preserved E-cadherin gene expression via inhibition of EMT in hepatocytes (Kaimori et al., 2010) and renal proximal tubular epithelial cells (Yoshikawa et al., 2007). However, it is unclear whether a HDAC inhibitor is able to stimulate mesenchymal-like progenitors to restore the expression of epithelial features. In this study, we treated prosensory-like MUCs with TSA to determine whether a HDAC inhibitor is able to induce the expression of epithelial marker Cdh1 in MUCs.
Materials and Methods
MUC culture and TSA treatment
Primary cultures of MUCs have been generated using pure utricle sensory epithelia collected from 3-month-old Swiss Webster mouse in our previous study (Zhang and Hu, 2012). MUCs used in this study were obtained from frozen stock at passages 33–35. MUCs were transferred from the frozen vial into a 15-mL conical tube containing prewarmed Dulbecco's modified Eagle medium (DMEM)/F12 (Invitrogen), followed by centrifugation and resuspension. MUCs were maintained in a 60-mm culture dish containing DMEM/F12-GlutaMAX and 10% fetal bovine serum (FBS; Invitrogen) at 37°C in a 5% CO2 incubator. MUCs were cultured for a few passages, and passages 37–42 of MUCs were used in this study. When MUCs reached approximately 70–80% confluence, TSA dissolved in dimethyl sulfoxide (DMSO; Fisher) was added to culture medium at 0.1, 0.3, 0.5, or 1 μM. In control cultures, vehicle (DMSO, diluted to 1:104) was added to the MUCs. MUCs were observed daily using phase-contrast microscopy and imaged with a digital camera. Half of the culture medium was changed at 1–2 days, and the cultures were maintained for 72 h.
Viability and proliferation assay
The viability of MUCs was assessed with calcein and propidium iodide (PI) (both from Invitrogen). After treatment with 0.1, 0.3, 0.5, or 1 μM TSA for 72 h, MUCs were rinsed with phosphate-buffered saline (PBS) and incubated in the culture medium containing 2 μM calcein and 0.3 μg/mL PI for 30 min at 37°C in a 5% CO2 incubator. MUC samples were photographed using epifluorescence microscopy (n=5). Analysis of variance (ANOVA) was performed, and p<0.05 was determined as statistical significance in this study.
To evaluate cell proliferation, a bromodeoxyuridine (BrdU) incorporation assay was used as previously described (Zhang and Hu, 2012). Briefly, BrdU (3 μg/mL; Sigma) was added to the MUC cultures for 24 h; these cultures had already been treated with TSA for 48 h. At the end of the culture period, MUC samples were fixed in 4% paraformaldehyde (Sigma). The samples were denatured using 1 M HCl and preincubated in blocking solution containing 5% donkey serum (Millipore) and 0.2% Triton X-100 (Sigma) in PBS. MUC samples were incubated in antibodies specific for BrdU (1:100; BD Biosciences) overnight at 4°C, followed by DyLight conjugated secondary antibodies incubation at room temperature for 2 h. A universal nucleus marker, 4′,6-diamidino-2-phenylindole, (DAPI; Invitrogen), was used to label all of the nuclei in the samples. MUC samples were observed using epifluorescence microscopy or confocal microscopy (both from Leica). The percentage of BrdU-incorporated cells=(BrdU-positive cells)/(DAPI-positive cells). ANOVA was performed, and p<0.05 was determined as statistical significance.
RNA extraction, reverse transcription PCR, and real-time quantitative RT-PCR
At the end of the culture period, MUCs in the TSA and control groups were harvested, and the total RNA was extracted using RNeasy Mini Kit (Qiagen), followed by cDNA synthesis using a QuantiTect Reverse Transcription Kit (Qiagen) according to manufacturer's protocols. Reverse transcription (RT)-PCR was performed using a thermal cycler (Eppendorf ), and a Bio-Rad CFX system was used for quantitative PCR using SsoAdvanced™ SYBR® Green Supermix (Bio-Rad). Quantitative PCR was applied when RT-PCR indicated obvious gene expression changes. Both RT-PCR and quantitative PCR used the same pairs of primers (Table 1) which met the following criteria: (1) The melting point in the melting curve analysis was 80–90°C and (2) the efficiency values of primers were 90–110%. The mean of quantification cycle (Cq) was calculated with Bio-Rad CFX software in a regression mode set. All cDNA samples were tested by quantitative PCR at a final concentration of 20 μg/mL. The relative expression values of mRNA were delta/delta values normalized by the internal control gene Gapdh. Cq values >40 were considered to be no expression of mRNA in genes. A two-tailed Student's t-test was used to compare the expression of genes in TSA and control groups. In this study, p<0.05 was considered statistically significant.
Immunofluorescence
At 72 h after TSA or vehicle (DMSO) treatment, MUCs were fixed in 4% paraformaldehyde at room temperature for 10 min. MUCs were preincubated for 30 min in the blocking solution containing 5% donkey serum and 0.2% Triton X-100 in PBS, followed by incubation in primary antibodies for 3 h at room temperature. Secondary antibodies were Dylight-488, -549, or -649 conjugated antibodies (1:500; all from Jackson Immunoresearch). DAPI was used to label all the cells in the sample. Most of the primary antibodies have been used in our previous studies (Hu et al., 2012; Zhang and Hu, 2012), including E-cadherin (1:100; Santa Cruz), ZO-1 (tight junction protein; 1:100; Life Technologies); ZEB1 (1:100; Santa Cruz), N-cadherin (1:100; Millipore), fibronectin (1:100; Millipore), P27Kip1 (1:100; Thermo Scientific), myosin VIIa (1:200; Developmental Studies Hybridoma Bank), and myosin VI (1:100; Sigma). MUC samples were observed using epifluorescence microscopy, and digital images were captured using a QImaging monochrome cooled CCD camera.
Results
Viability and proliferation of MUCs following TSA treatment
To evaluate the effective and nontoxic concentration of TSA used for prosensory-like MUCs, a dose–response study was performed using viability assays. A calcein viability study revealed viable cells labeled with calcein showing strong fluorescence in the cytoplasm (Fig. 1A). The quantitative study indicated that 97.65±0.70%, 97.86±0.69%, 98.12±1.40%, 90.65±2.05%, and 99.19±0.28% of MUCs were labeled with calcein when treated with 0.1, 0.3, 0.5, and 1 μM TSA and control medium for 72 h, respectively (Fig. 1B). Statistical analysis suggested significant difference in the calcein viability assay (p<0.001; ANOVA). The Tukey post hoc test revealed that there was no significant difference in the viability of MUCs treated with 0.1, 0.3, and 0.5 μM TSA and the control medium, but these cells were significantly different from MUCs treated with 1 μM TSA (p<0.05). In PI staining, the nuclei of dead cells were labeled with PI and fluorescence was shown in the nuclei (Fig. 1A). The cell counting showed 2.36±0.66%, 2.14±1.49%, 1.88±1.56%, 9.35±0.25%, and 1.03±0.25% of PI-positive MUCs in the treatment with 0.1, 0.3, 0.5, and 1 μM TSA and control medium for 72 h, respectively (Fig. 1B), which was statistically significant (p<0.001; ANOVA). A Tukey post hoc test did not indicate significant difference in the PI staining of MUCs treated with 0.1, 0.3, and 0.5 μM TSA and the control medium, but MUCs treated with 1 μM TSA were significantly different from other treatments (p<0.05).

Viability and proliferation of MUCs following TSA treatment. (
After treatment with TSA for 72 h, a BrdU incorporation assay revealed that 12.62±5.85%, 9.89±6.98%, 9.87±6.39%, and 68.28±9.57% of MUCs incorporated BrdU in 0.1, 0.3, and 0.5 μM TSA and control medium groups, respectively (Fig. 1D). The number of surviving cells in the 1 μM TSA group was the lowest in all treatments, so that few cells were detected with BrdU antibody, which was not appropriate for statistical analysis (not shown). Statistical analysis revealed that the percentage of BrdU-incorporated MUCs in the control group was significantly higher than those in 0.1, 0.3, and 0.5 μM TSA groups (p<0.05; ANOVA), whereas there was no significant difference in the 0.1–0.5 μM TSA treatment groups (Fig. 1C). This observation indicated that a decreased number of MUCs entered the S phase in response to TSA treatment. On the basis of cell viability and proliferation results, 0.5 μM TSA seemed to be an effective concentration that caused less toxicity to MUCs.
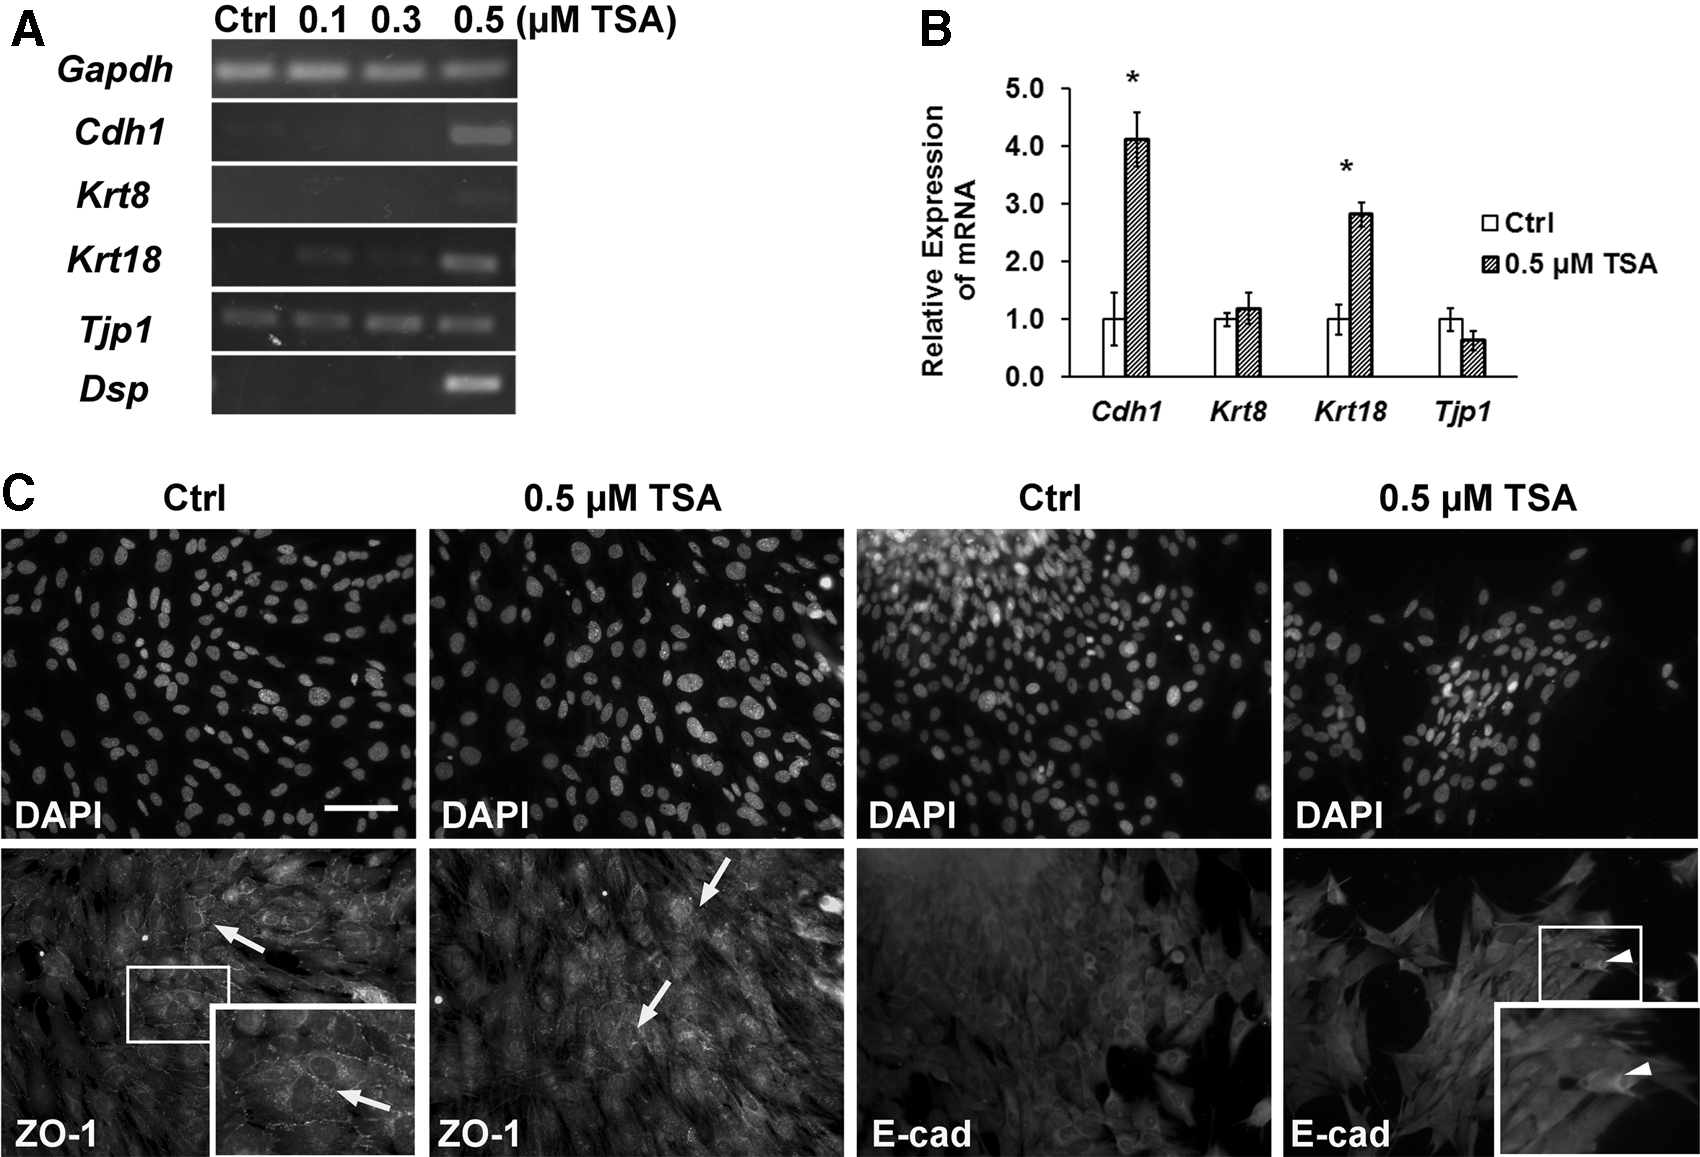
TSA treatment increased the expression of epithelial markers
When MUCs were treated with 0.1 or 0.3 μM TSA, RT-PCR showed that there was no significant change in the expression of epithelial genes, including Cdh1, Krt8, Krt18, Dsp, and Tjp1 (Fig. 2A). On the contrary, the expression of Cdh1, Krt18, and Dsp was significantly increased when MUCs were exposed to 0.5 μM TSA. These data indicated that TSA treatment may have a dose-dependent effect on the expression of selected epithelial genes of MUCs. In the meantime, we found that the expression of Tjp1 and Krt8 was not changed following 0.1–0.5 μM TSA treatment (Fig. 2A). In quantitative PCR, the corresponding fold changes of Cdh1, Krt18, Krt8, and Tjp1 from TSA to control groups in quantitative PCR were approximately 4.11±0.47, 2.82±0.30, 1.19±0.82, and 0.63±0.17, respectively (Fig. 2B). Statistical analysis revealed that there was a significant difference in the expression of Cdh1 and Krt18 between the TSA and control groups (p<0.05; ANOVA), whereas not with Krt8 and Tjp1. The mean Cq value of Dsp was not detectable in the control MUCs, but it was 31.12±0.45 in TSA-treated MUCs. However, the changes in gene expression did not seem to translate into protein expression changes in the immunofluorescence study. In immunofluorescence, E-cadherin (an epithelial protein encoded by Cdh1) and ZO-1 (a tight-junction protein encoded by Tjp1) were expressed at similar levels in TSA-treated and control groups (Fig. 2C).
MUCs expressed epithelial genes following TSA treatment. (
TSA treatment decreased the expression of mesenchymal markers
RT-PCR suggested that TSA-treated MUCs exhibited decreased expression of mesenchymal genes, including Zeb1, Zeb2, Snai1, and Snai2 compared to control MUCs (Fig. 3A). The other mesenchymal genes, including Cdh2, Fn1, and Vim, presented similar levels in 0.5 μM TSA-treated and control MUCs. In quantitative PCR analyses of normalized relative mRNA expression between TSA-treated and control MUCs, Zeb1, Zeb2, Snai1, and Snai2 were significantly decreased following TSA treatment, and were quantified as 0.13±0.03, 0.09±0.03, 0.04±0.00, and 0.35±0.05 fold decreases, respectively (Fig. 3B) (p<0.01 in Zeb1 and Snai2; p<0.001 in Zeb2 and Snai1; Student's t-test). In immunofluorescence, MUCs in the control and TSA groups were stained with mesenchymal markers such as ZEB1, fibronectin, and N-cadherin (Fig. 3C). The relative fluorescence intensity of ZEB1 was decreased in MUCs treated with 0.5 μM TSA (Fig. 3C), whereas no obvious change was observed in other tested markers.

TSA reduced the expression of mesenchymal markers in MUCs. (
TSA treatment affects the expression of hair cell genes, hair cell progenitor genes, and HDACs
In our RT-PCR study, TSA treatment led to downregulation of prosensory genes, including Lfng, Six1, and Dlx5 (Fig. 4A). In quantitative PCR, the mean Cq value of Lfng was 29.25±0.35 in the control MUCs, but the expression of Lfng was decreased and could not be detected in MUCs treated with 0.5 μM TSA. The fold changes of normalized relative mRNA expression of Six1 and Dlx5 between TSA and control MUCs were approximately 0.19±0.01 and 0.04±0.00, respectively (p<0.001; Student's t-test; Fig. 4A). The expression of other progenitor genes, such as Hes1, Isl1, Jag1, Cdkn1b, Bmp4, and Sox2, did not demonstrate significant changes in RT-PCR between the TSA and control groups (Fig. 4A); therefore, quantitative PCR was not performed. Immunofluorescence study showed that the prosensory protein P27kip1 was expressed consistently in TSA-treated and control MUCs (Fig. 4C).
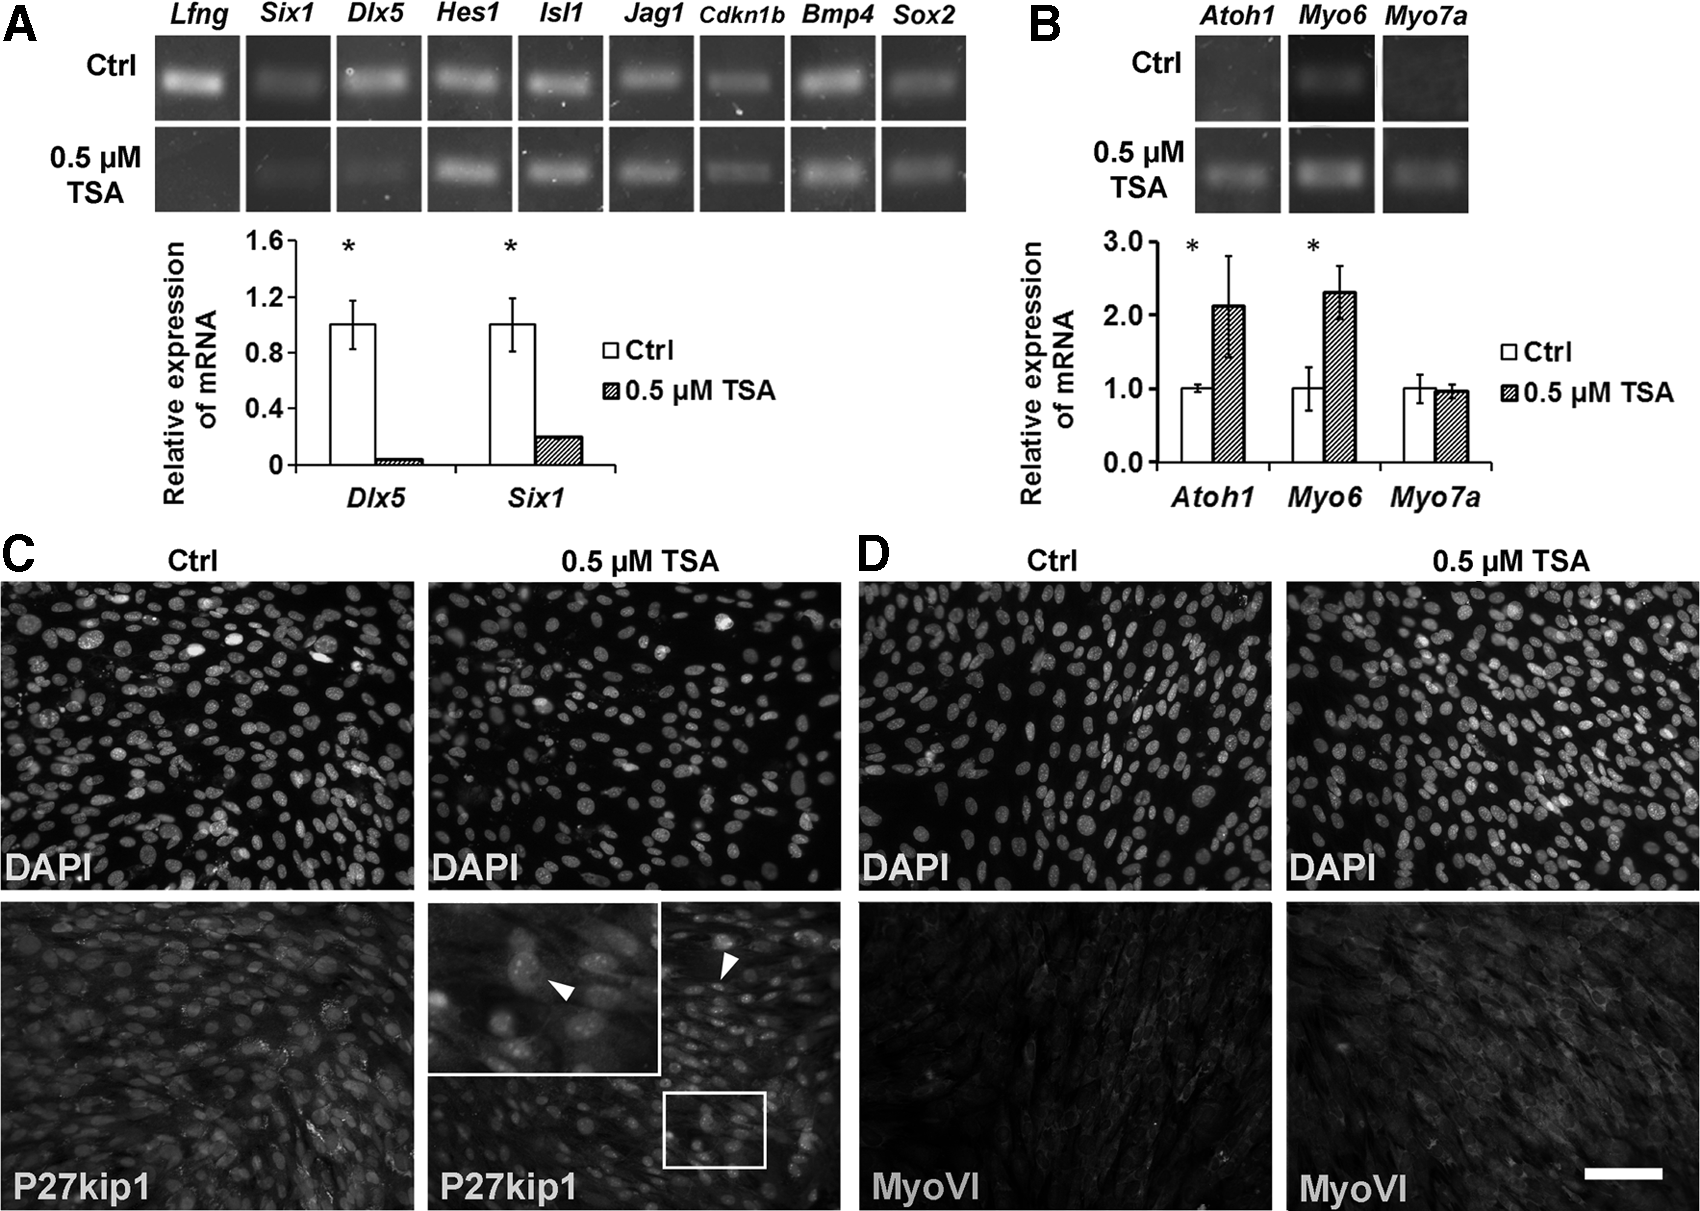
TSA treatment affected the expression of hair cell and its progenitor markers. (
In the study of hair cell genes, RT-PCR indicated that 0.5 μM TSA-treated MUCs increased the expression of Atoh1, Myo6, and Myo7a. In quantitative PCR, normalized relative expression levels of Atoh1 and Myo6 in the TSA group were 2.10±0.05- and 2.31±0.36-fold higher than those in the control group, which was statistically significant (p<0.05 in Myo6, p<0.01 in Atoh1; Student's t-test; Fig. 4B). No obvious change was observed in the expression of Myo7a in quantitative PCR. MUCs in the TSA and control groups were labeled by antibodies specific for myosin VI with slightly increased expression in the TSA group (Fig. 4D), whereas the myosin VIIa immunostaining was very weak in both groups (not shown).
Additionally, we studied the expression of HDACs following TSA treatment. We found that after treatment with 0.5 μM TSA for 72 h, Hdac1 expression did not change significantly in RT-PCR. In contrast, quantitative PCR study indicated a significant decrease in Hdac2 and Hdac3 expression following TSA treatment, which was 0.28±0.06- and 0.16±0.06-fold lower than that of controls, respectively (p<0.05; Student's t-test) (Fig. 5).
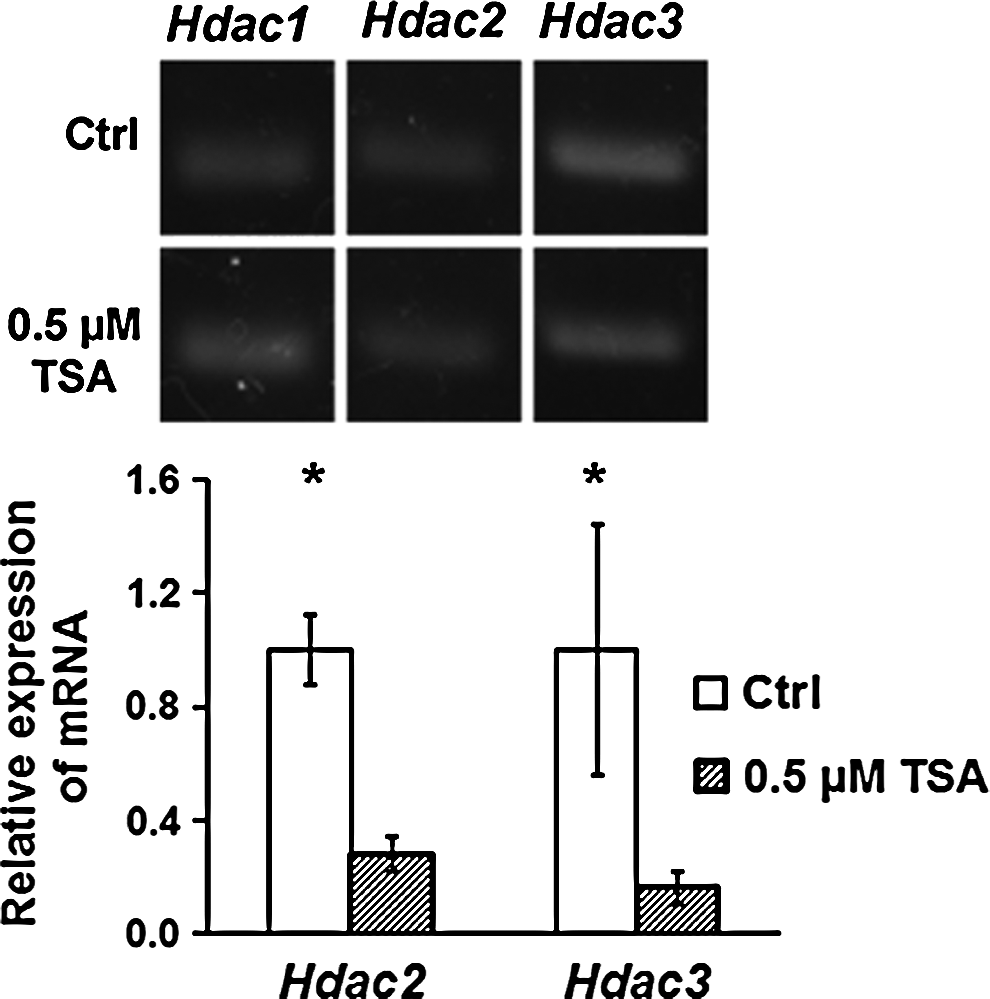
RT-PCR analysis showed that the expressions of Hdac2 and Hdac3 in MUCs were slightly decreased in TSA-treated MUCs, whereas Hdac1 expression did not change obviously. The normalized relative mRNA expression values of Hdac2 and Hdac3 in TSA-treated MUCs were approximately 0.28±0.06-, 0.16±0.06-fold lower than those of control MUCs. (*) p<0.05; Student's t-test.
Discussion
In this study, we treated mesenchymal-like MUCs with TSA to determine whether a HDAC inhibitor could induce the expression of epithelial markers in MUCs maintained in adherent cultures. We found that TSA treatment stimulated MUCs to upregulate the expression of epithelial markers and downregulate the expression of mesenchymal markers. Additionally, MUCs decreased the expression level of prosensory genes and increased the expression of hair cell genes, including Atoh1 and Myo6.
TSA is a potent class I and II HDAC inhibitor that has been applied to alter gene expression by interfering with the removal of acetyl groups from lysine in the histone tail. TSA is a cell-toxic chemical that is able to affect the viability and proliferation of a variety of cell types. First, cell viability following TSA treatment varies in different cell lines. For example, retinoblastoma cells could hardly endure 0.2 μM TSA (Karasawa and Okisaka, 2004), whereas mutant human lymphocytes were able to survive through 48 μM TSA (Smith et al., 2014). Second, TSA can arrest the cell cycle in a variety of cell types (Kong et al., 2014; Sikandar et al., 2011; Smith et al., 2014). For instance, in cochlear and vestibular tissue explant cultures, TSA showed the ability to decrease supporting cell proliferation (Slattery et al., 2009). In our study, MUCs presented a dose–response to TSA treatment. The number of viable cells was not significantly changed when MUCs were exposed to 0.1–0.5 μM TSA, but a higher dose of TSA (1 μM) remarkably increased the proportion of dead cells in MUCs. Although MUCs survived well in lower concentrations of TSA from 0.1 to 0.5 μM, TSA at this dosage range significantly suppressed cell proliferation compared to control MUCs, and this was indicated in the BrdU incorporation assay. Our study suggests that TSA led to an inhibitory effect on MUCs proliferation at lower concentrations (≤0.5 μM) and caused cells apoptosis at relatively higher concentrations (≥1 μM).
In addition to its effect on cell viability and proliferation, TSA has been implicated in affecting the differentiation of stem/progenitor cells (Karantzali et al., 2008; Lim et al., 2013). In general, stem/progenitor cells usually downregulate the expression of stem cell genes during differentiation into a specific cell type. However, TSA-induced cell differentiation showed variable stem cell gene expression in different stem/progenitor cell lines. Take Sox2 as an example. Sox2 is a stem cell marker involved in maintenance and self-renewal of stem cells (Takahashi et al., 2007; Wegner and Stolt, 2005). In the auditory system, Sox2 was detected in both prosensory cells (Neves et al., 2012) and supporting cells (Liu et al., 2012). Sox2 was upregulated in oligodendrocyte progenitor cells (Foti et al., 2013) and prostate cancer cells (Kong et al., 2012) after TSA treatment, whereas its expression was slightly reduced in embryonic stem cell differentiation (Karantzali et al., 2008). In our study, TSA did not significantly affect the expression of Sox2 in MUCs. The discrepancy of these observations suggests that the role of TSA in the expression of progenitor genes may depend on the cell line. Additionally, we found in this study that TSA decreased the expression of Six1 and Dlx5, indicating MUCs might have been partially directed to cell differentiation fate.
EMT and mesenchymal-to-epithelial transition (MET) play crucial roles in development, organogenesis, and tumor metastasis. Previous studies demonstrated that TSA inhibited transforming growth factor-β (TGFβ)-induced EMT in liver (Kaimori et al., 2010; Lei et al., 2010) and heart cells (Liu et al., 2008), which played a role in preventing hepatic and cardiac fibrogenesis (Niki et al., 1999). In the current study, we studied the expression of epithelial and mesenchymal genes in MUCs to evaluate TSA's effect on MET. We found that TSA was able to promote the expression of the epithelial genes Cdh1 and Krt18 and decreased the expression of the mesenchymal genes Zeb1, Zeb2, Snai1, and Snai2 at the gene level. Although it has been described in many cell lines that the inhibition of E-cadherin was dependent on the transcription factors Zeb1 and Snai1 (Kakihana et al., 2009; Peinado et al., 2004), the detailed regulation mechanism is still unclear. We speculate that the role of TSA in MET may involve two aspects. First, TSA may serves as an HDAC inhibitor to reverse HDAC-related Cdh1 silencing. It was suggested that the expression of Cdh1 was upregulated via the activation of histone acetylation in its promoter area under the effect of TSA (von Burstin et al., 2009). A study of pancreatic cancer cells found that TSA could restore the expression of Cdh1 via interfering with the SNAIL/HDAC1/HDAC2 repressor complex. In line with this observation, we found in our study that TSA reduced the expression of Zeb1, Zeb2, Snai1, Snai2, and HDAC2, but increased the expression of the epithelial gene Cdh1 in MUCs. Second, TSA may direct MET via upregulation of the prosensory gene Six1, a homeodomain transcription factor involved in organ development (Zheng et al., 2003; Zou et al., 2004) and tumorigenesis (Wu et al., 2014). A study in breast cancer cells found that Six1 was able to induce EMT mediated with TGFβ activation (Micalizzi et al., 2010). In our study, TSA suppressed the expression of Six1 concomitant with increased expression of Cdh1. It is possible that TSA-induced Six1 downregulation may play a role in inhibiting Six1-related EMT, which subsequently leads to the upregulation of epithelial genes such as Cdh1. Overall, our data suggest that TSA may cause MET of MUCs, including upregulation of the expression of epithelial genes and downregulation of the expression of mesenchymal genes.
In addition to our selected gene expression study, we investigated the protein expression of MUCs following TSA treatment using immunofluorescence, including epithelial, mesenchymal, prosensory, and hair cell proteins. We found that no significant change was observed in most of the proteins studied using immunofluorescence, indicating that TSA may contribute to the initial gene expression changes during MET, which have not translated into a protein level. A solid conclusion needs more efforts on a comprehensive understanding of both gene and protein levels to elucidate the underlying mechanisms. In addition, it is noted that TSA was applied to MUCs for 72 h in the current study. It is possible that a longer TSA treatment period may be required to translate gene expression changes into the protein level. Therefore, further work may be necessary to determine whether longer TSA treatment, such as 5–10 days, may have effects on protein expression and cell morphology of MUCs. Finally, it is interesting to understand whether TSA is needed to maintain gene and protein expression changes, and this should be an independent study to be explored in our future research.
In summary, our present study investigated a novel epigenetic approach to induce stem/progenitor cells to change their cell fate. We focused on the effect of the HDAC inhibitor TSA on the gene expression levels of epithelial, mesenchymal, and prosensory markers in prosensory-like MUCs. Our data showed that TSA induced significant changes in the expression of a group of selected genes, which indicates that TSA may have stimulated the initial stages of mesenchymal-to-epithelial transition at the gene expression level. Our results suggested the potential of MUCs to differentiate toward an epithelial cell fate using epigenetic methods, which may provide evidence to further understand the molecular pathways that mediate a complete restoration of epithelial and hair cell features. Finally, additional study will be needed to clarify how to guide MUCs to become specialized and functional inner ear hair cells in the future.
Footnotes
Acknowledgments
The authors thank Neelkumar Patel for his technical support, and Fei Nie, Yang Zhou, and Xiaoyang Li for valuable comments to the manuscript. Antibodies were obtained from Developmental Studies Hybridoma Bank. The study is supported by the National Institute on Deafness and Other Communication Disorders, National Institutes of Health (NIDCD/NIH grant no. R03DC011597) and the Carls Foundation.
Author Disclosure Statement
The authors declare that there are no conflicts of interest.