
Abstract
Abstract
Researchers have exerted sustained efforts to improve the viability of somatic cell nuclear transfer (SCNT) embryos, testing their experimental designs and probing the resultant embryos. However, the lack of a reliable method to estimate the efficacy of these experimental attempts is a chief hindrance to tackling the low-viability problem in SCNT. Here, we introduce a procedure that assesses the degree of difference in gene expression profiles (GEPs) of blastocysts from each other as a representative control of good quality. We first adapted a multiplex reverse transcription-polymerase chain reaction strategy to obtain GEPs for 15 reprogramming-related genes from single mouse blastocysts. GEPs of individual blastocysts displayed a broad range of variations, the extent of which was calculated using a weighted root mean square deviation (wRMSD). wRMSD-based quantitation of GEP difference (qGEP) found that GEP difference between in vivo–derived blastocysts (in vivo) and SCNT blastocysts was greater than the difference between in vivo blastocysts and in vitro–produced (IVP) blastocysts, demonstrating that the SCNT group was more distantly related to the in vivo group than the IVP group. Our qGEP approach for grading individual blastocysts would be useful for selecting a better protocol to derive embryos of better quality prior to field applications.
Introduction
T
The low cloning efficiency and the rare liveborn offspring (Cibelli et al., 1998; Wakayama et al., 1998; Wells et al., 1997; Wilmut et al., 1997) have deprived researchers of the chance to compare beforehand the efficacy of their own experimental trials that are designed with the intention of improving clonal viability. Therefore, a prescreening procedure that can identify effective laboratory attempts before field applications is an urgent need. If not liveborn clones, the alternative that is open to researchers would be the preimplantation-stage embryos. Of them, the blastocyst is the latest stage that is affordable for analysis. Therefore, blastocysts have been the subjects for quality assessment and grading on the basis of morphological similarity to in vivo–derived blastocysts (Amano et al., 2001; Kang et al., 2002; Koo et al., 2002; Peterson and Lee, 2003). However, the relevance of the premise that similar morphology follows a similar genetic program has not been proved by an in-depth correlation analysis between the embryo morphology and the gene expression profiles (GEPs): GEPs were not always associated with blastocyst morphologies (Amarnath et al., 2007).
Because the expression of any given gene is a function of its epigenetic state, which is, in turn, established by combined effects of the available repertoire of transcription factors and modulators acting on its regulatory region (Jaenisch and Bird, 2003; Li, 2002), errors in epigenetic reprogramming would be predicted to affect the GEPs of the embryo. The accumulated action of abnormally expressed genes disrupts normal embryo development, leading to lethality (Humpherys et al., 2001). For example, in the case of the Oct4 gene, even a relatively small change (approximately two-fold) in the mRNA level can yield a dramatic change in the lineage specification (Niwa et al., 2000). The reprogramming-associated epigenomic state of the embryo has been set and regulated largely by a group of genes that play roles in reading, writing, and erasing the epigenetic states of chromatin. In this regard, the “expression signature” of those genes that governs the epigenetic states of specific cells and, thereby, leads to the elaboration of whole repertoire of transcripts for correct cell functioning would be the utmost parameter that demonstrates the functional identity of the cells. Thus, these genes are very important for SCNT embryos that must undergo harsh reprogramming. Correct expression of these genes in early embryos would, therefore, provide a fundamental index that represents the soundness of the epigenetic reprogramming and the viability of SCNT embryos.
In this study, we wanted to define and qualify the GEPs that represent the competency of early embryos that were derived by distinct experimental protocols. We developed a procedure to obtain GEPs in individual blastocysts and to measure the difference of a blastocyst's GEP to the controls representing the best-quality embryo. The measurement involves a statistical calculation of the deviation in the GEP of a blastocyst from a reference GEP. For this purpose, we examined the GEPs of 15 genes that might regulate the epigenomic states during reprogramming in single mouse blastocysts. Collectively, our approach to quantitate and grade the GEPs of individual blastocysts would be useful for selecting a protocol to improve clonal viability prior to field applications when the efficacy is otherwise unknown before prescreening.
Materials and Methods
Ethics statement
This study was carried out in strict accordance with the recommendations in the Guide for the Care and Use of Laboratory Animals of the National Livestock Research Institute of Korea. The protocol was approved by the Committee on the Ethics of Animal Experiments of the Korea Research Institute of Bioscience and Biotechnology. All surgery was performed under sodium pentobarbital anesthesia, and all efforts were made to minimize suffering.
Collection of mouse blastocysts
To obtain in vitro–produced (IVP) blastocysts, fertilized mouse oocytes were collected from superovulated females according to standard procedure (Cho et al., 2012). Briefly, 6- to 8-week old female BCF1 (C57BL/6×CBA/CA) mice were superovulated by intraperitoneal injections of 5 IU pregnant mare serum gonadotropin (PMSG; Sigma-Aldrich, St. Louis, MO, USA), followed by injection of 5 IU human chorionic gonadotropin (hCG; Sigma-Aldrich) 48 h apart. The females were mated with 8- to 15-week-old males of the same strain. At 20 h post-human chorionic gonadotropin (hCG) injection, fertilized oocytes were collected from oviducts of the females, and the cumulus cells surrounding the embryo were removed by treatment with 1 mg/mL hyaluronidase (Sigma-Aldrich) in HEPES-buffered CZB medium. The fertilized oocytes were then cultured to the blastocyst stage in M16 medium (Sigma-Aldrich) under mineral oil at 37°C, 5% CO2 in air. For in vivo–derived blastocysts, BCF1 mouse uterus was flushed at 3.5 days postcoitum using HEPES-buffered CZB medium, and only mid-expanded-stage blastocysts were chosen for gene expression analysis without further culture.
Production of mouse cloned blastocysts
To obtain SCNT embryos, nuclear transfer was performed as previously described (Wakayama et al., 1998). To obtain recipient oocytes, 6- to 8-week-old female BCF1 mice were induced to superovulate by 5 IU PMSG and 5 IU of hCG at an interval of 48 h. Mature metaphase II oocytes were collected from the oviducts 15 h after hCG injection and released from cumulus cells by treatment with 1 mg/mL hyaluronidase in HEPES-buffered CZB medium. Nuclear transfer from cumulus cells was performed using a Piezo-driven micromanipulator (PMM-150FU, Prime Tech, Japan). Enucleated BCF1 oocytes were each injected with a cumulus cell nucleus using piezo pulses. At 30–60 min after nuclear transfer, the reconstituted oocytes were activated by 10 mM strontium chloride (SrCl2) in Ca2+-free CZB medium containing 5 μg/mL cytochalasin B (Sigma-Aldrich) for 6 h to activate the oocytes. After several washes in HEPES-buffered CZB medium, the oocytes were cultured for 4 days in M16 medium under mineral oil at 37°C, 5% CO2 in air. Reconstituted oocytes were cultured to the blastocyst stage in the same way as the IVP embryos.
Multiplex RT-PCR
For multiplex RT-PCR, with a whole blastocyst as a template, first-round PCR was conducted using a One-Step RT-PCR Kit (Qiagen, USA) according to the manufacturer's manual. PCR amplification of multiple targets in a single tube can be influenced by several factors, including gene expression levels, primer interactions, and competition for PCR reagents. We initially started with a pool of primer pairs for 21 genes. From multiplex PCRs with different combinations of 14-gene primer pairs that were chosen arbitrarily, we managed to select eight primer pairs as “seed pairs” that yielded their amplicons relatively stably. To the selected seed pairs, we next added two additional primer pairs to determine if the inclusion of the new primer pairs would perturb the amplicon levels of the PCR products of the seed pairs; if so, we removed or replaced the primer pair(s). Then, we tested another two primer pairs to determine whether they came along with the already established (2+ seed pairs) set. Through this consecutive selection process, we finally selected 15 target sequences for multiplexing, each of which displayed relatively independent PCR amplification in the PCR reaction.
RT-PCR and the first PCR were done with the same sets of primers (Table S1; Supplementary Data are available at www.liebertpub.com/cell/). RT-PCR was done at 50°C for 30 min in a thermal cycler (DNA Engine, BioRad, USA) and then the first PCR was done in the resultant RT-PCR mixture. The cycles consisted of 30 cycles of 94°C for 30 sec, 52°C for 30 sec, 72°C for 30 sec. For a second-round PCR, the product from the first PCR was diluted a hundredth and used as template in the second-round PCR with nested sets of primers. We used a hot start–based multiplex PCR (Solgent, Korea) for the second-round PCR, with the same cycling conditions as in the first PCR. To avoid a plateau phase in the PCR, we determined the second PCR amplification cycle carefully. The second PCR products were resolved on an 8% polyacrylamide gel electrophoresis (PAGE) gel. The band density of each PCR amplicon was measured using the TINA2.0 or AxioVision intensity profiling tool (v. 4.8), both of which revealed very similar results.
In addition, to be more accurate, a quantitative real-time PCR (qPCR)-mediated multiplexing is preferred. However, its prohibitive costs make the qPCR multiplexing technology hardly approachable and affordable at present. Meanwhile, it is important to adjust the efficiency of the PCR reaction for every pair of primers to a similar level if one desires to compare the expression level of one gene with that of another within a sample. However, our gene expression analysis method aims to compare the expression levels of the same gene between different samples. In this case, even if the efficiency of one PCR reaction is relatively low compared with those of the others, it would not greatly matter because this PCR reaction runs equally in a low efficiency among different samples.
Quantitative measurement of gene expression profile (qGEP)
Variation of a blastocyst's GEP from the standard GEP was measured using the term weighted root mean square deviation (wRMSD). We considered each gene expression to be an independent event; therefore, we combined all of the expression measurements of each sample in the calculation of the wRMSD. To minimize the bias that could result from a measurement error of a GEP with a low coefficient of variation (CV), the deviation of each gene expression level from the mean was weighted with the CV of the gene in the group. The wRMSD was obtained with the equation,
where wi, Emi, and Ei are the values obtained from the ith gene of interest for the weight of the mean square deviation of the gene expression, the reference expression level (e.g., the mean expression level in the group), and the expression level of the gene, respectively. The weight (wi) is the proportion of the CV for the expression level of the ith gene to the sum of CV for those of all genes in the group and was obtained with the equation,
Results
We selected genes that were implicated in epigenetic reprogramming in the literature and gene ontology (GO) terms. We especially focused on those genes whose protein products establish repressive epigenetic marks and were classified into four categories: (1) DNA methyltransferases (DMs) group—Dnmt1, Dnmt3a, and Dnmt3b; (2) histone H3K9-specific methyltransferases (HMTs) group—Suv39h1, G9a, Setdb1, and Glp; (3) Polycomb-group proteins (PcGs) group—Bmi1, Eed, Suz12, and Yy1; and (4) histone demethylases (HDMs) group—Jmjd3, Jhdm2a, Jhdm3a, and Lsd1 (see Table S2 for gene information).
We confirmed that each set of primers worked well in RT-PCR of J1 mouse embryonic stem cells (mESCs; see Fig. S1). For multiplex RT-PCR, we designed a two-step PCR where each step used different sets of primers. The first-step RT-PCR (PCR-1) product was produced using all of the 15 primer sets and, after dilution, subsequently used as the template in the second-step, nested PCR (PCR-2) (Fig. 1A). We were convinced that none of the 15 gene transcripts in the PCR-1 reached the plateau phase before 30 cycles of PCR (Fig. S2). A representative result of multiplex PCR is shown in Figure 1B. The band density of the PCR products in each lane was measured by an intensity-profiling tool (Fig. 1C). When primer sets for the genes in each category were removed from the PCR-1 in multiplex PCR using mESC cDNA, the relative amounts of the PCR-2 products of the three remaining category genes were, on the whole, not greatly changed (Fig. 1D), indicating no severe cross-interference of the multiple sets of primers in the multiplex PCR. Application of this assay to different types of mouse cells revealed cell type-specific expression profiles, or “expression signatures,” of the reprogramming-related genes (Fig. 1E).
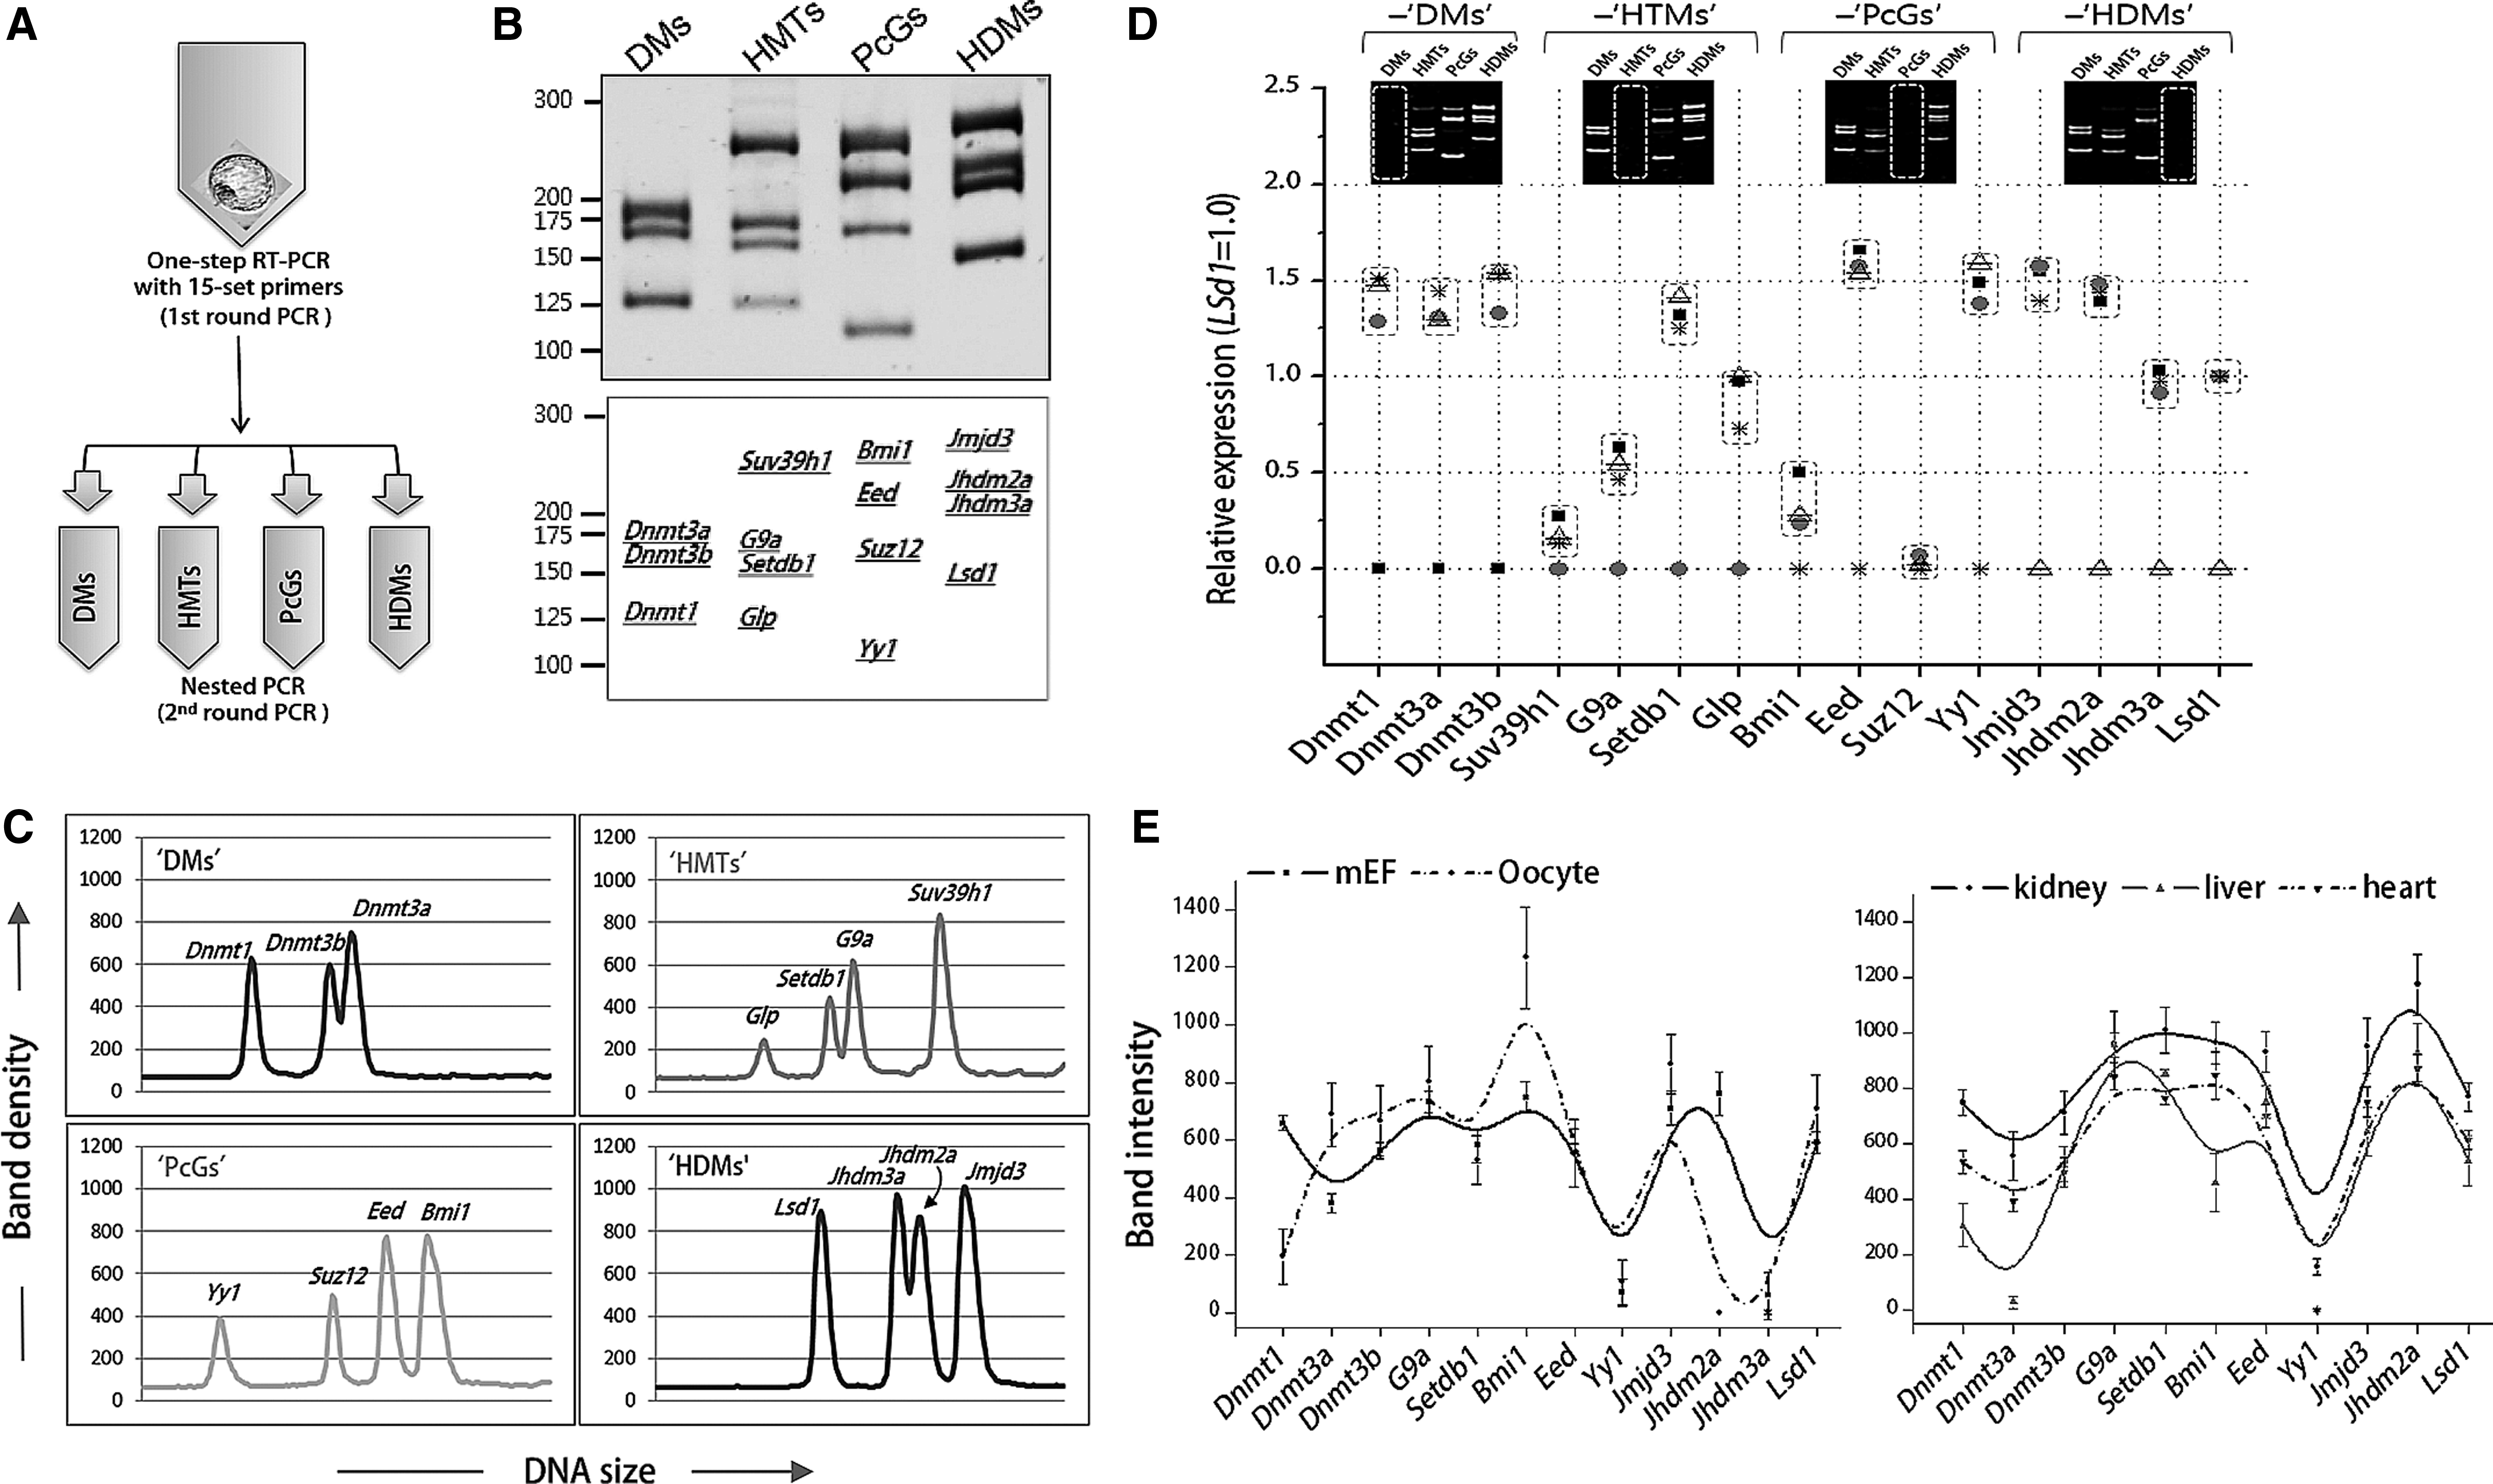
Multiplex reverse transcription-polymerase chain reaction (RT-PCR) of 15 reprogramming-related genes in mouse blastocysts. (
We next examined individual GEPs for blastocysts in three groups of morphologically healthy, mid-expanded mouse blastocysts with different derivative origins: in vivo (n=20), in vitro (IVP, n=27), and SCNT-derived blastocysts (SCNT, n=23). Figure 2A shows representative band-intensity profiles of individual blastocysts, especially for HMTs and HDMs genes, which displayed a larger variance in their expression levels among blastocyst groups. Among the genes, Lsd1 was steadily transcribed with the lowest coefficient of variation in all samples, as illustrated in the raw expression data in Figure S3. Therefore, we used the Lsd1 level as the normalization standard.
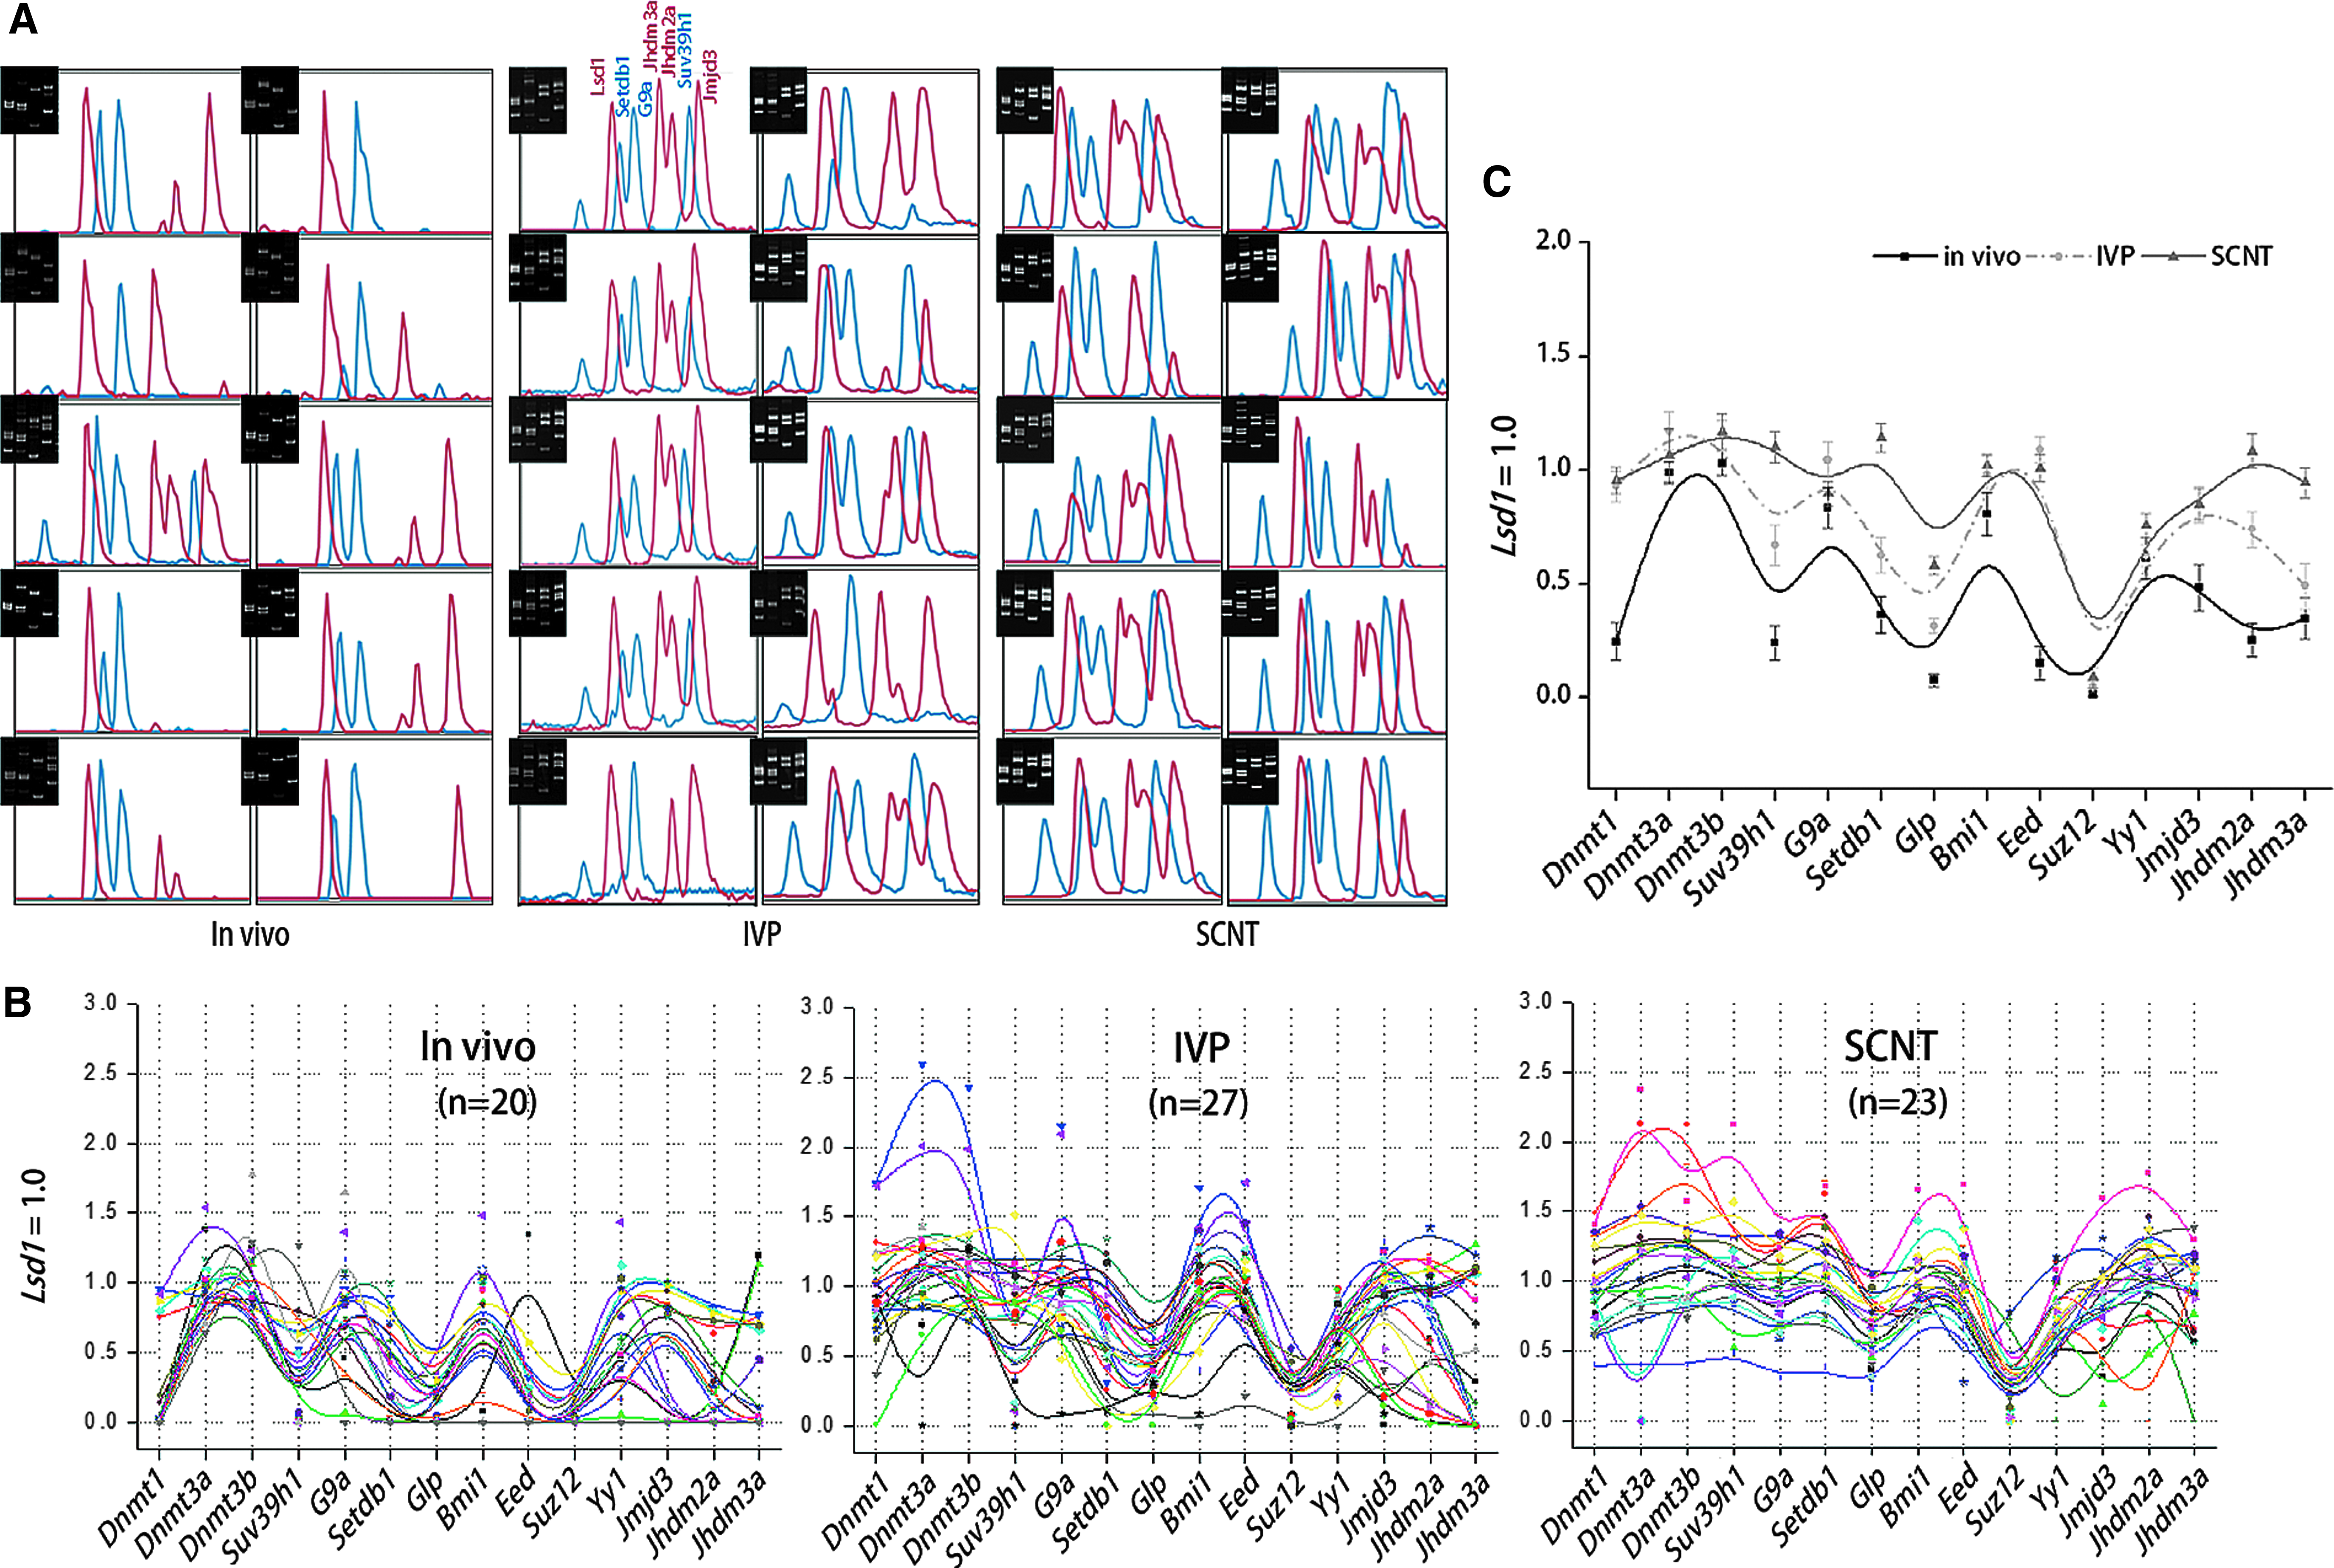
Gene expression profiles of 15 reprogramming-related genes in single mouse blastocysts. (
The normalized expression levels of individual genes for each blastocyst and the mean GEP for each group are presented in Figure 2, B and C, respectively. The mean expression levels of individual genes were, overall, high in SCNT blastocysts compared with those in in vivo and IVP blastocysts (Fig. 2C). The result showed that a broad range of heterogeneity in GEPs was present among different blastocysts within each group and also among different blastocyst groups. The SCNT-blastocyst GEP versus cumulus cell GEP comparison led to the speculation that there was a substantial change in the GEPs during the cleavages of SCNT embryos (see Fig. S4). The different GEPs were confirmed by single-gene PCR using pooled first-round PCR products or blastocyst cDNAs that were freshly prepared as templates (Figs. S5 and S6, respectively).
To assess each blastocyst in terms of how much different its GEP is from what was chosen for the reference, the deviation of each blastocyst's GEP from the mean of each group was estimated using a wRMSD (see the Materials and Methods section for the detailed calculation). In Figure 3A, the GEPs of representative blastocysts with the lowest and the highest wRMSD are shown along with the mean GEP in each group; this demonstrated that the lower the value of the wRMSD, the more similar the GEP of a blastocyst was to the mean GEP. Thus, the wRMSD is a reliable estimator for the difference of GEPs between individual blastocysts. The distribution of wRMSDs in each blastocyst group is presented in Figure 3B, which illustrates similar levels of uniformity in the gene expression patterns among the blastocyst groups, as the mean wRMSDs are in the range of 0.26–0.33.
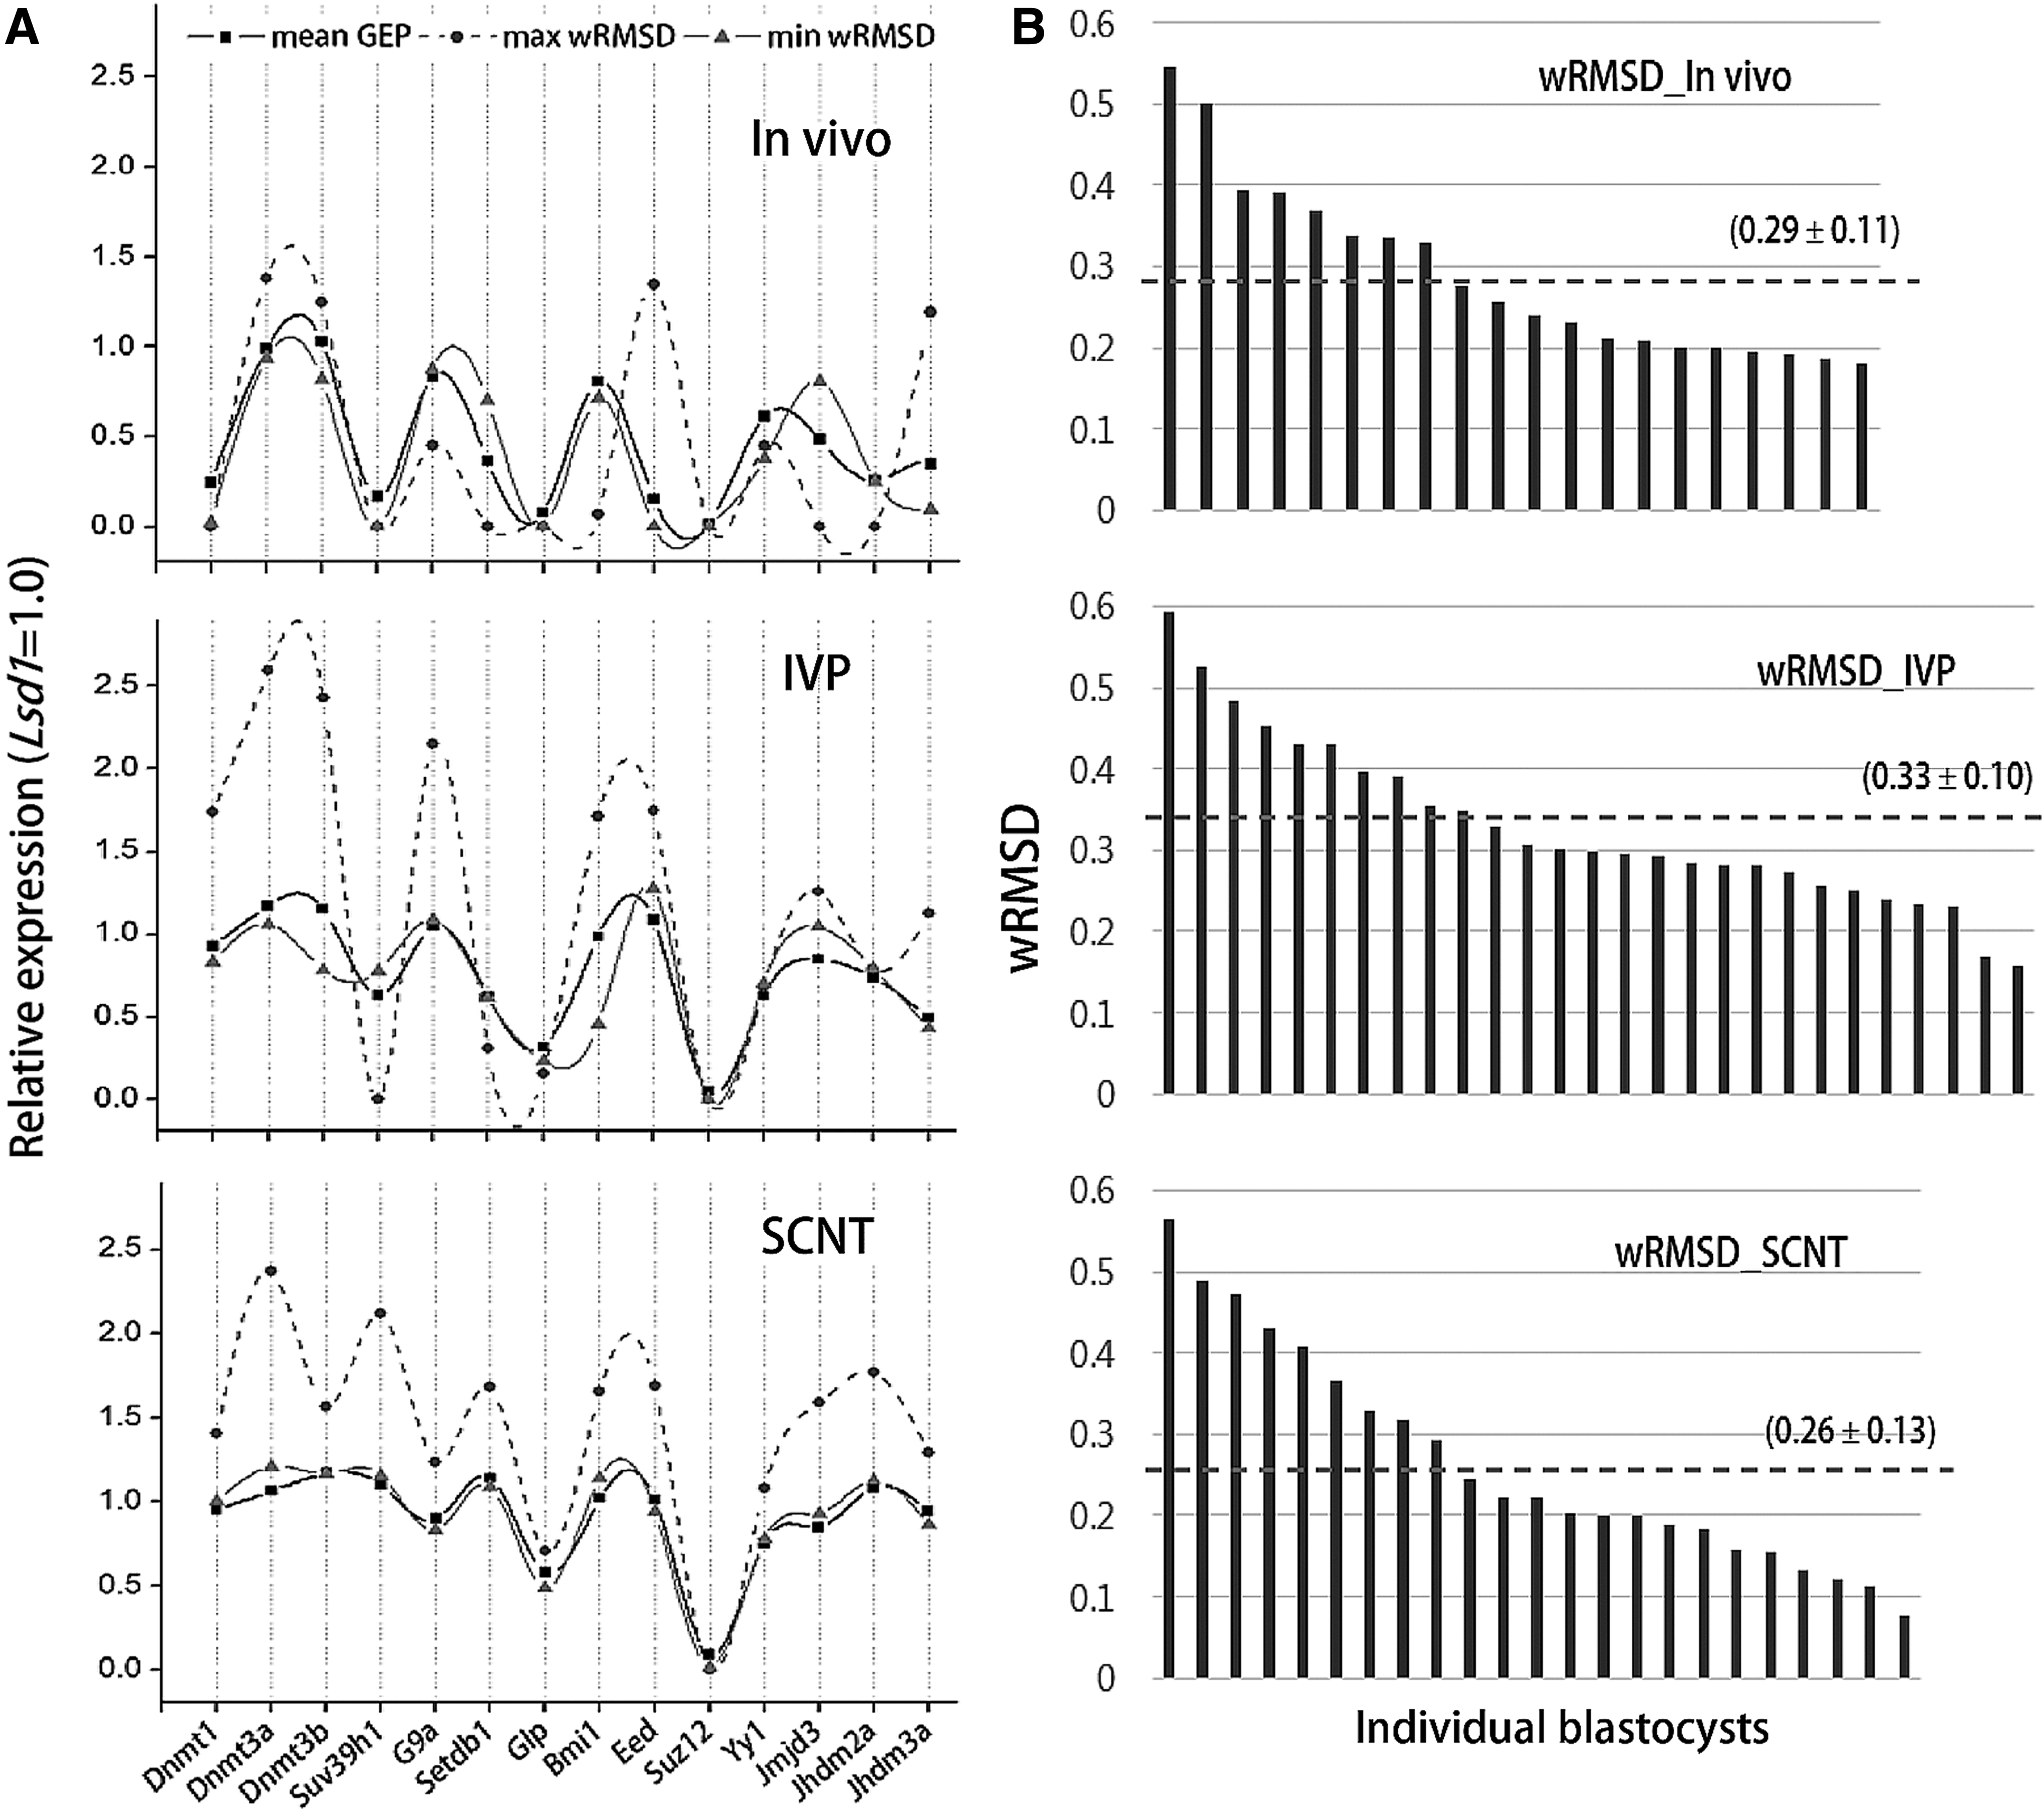
Quantitative analysis of GEP difference in individuals of the same blastocyst group. (
We then measured the difference in the GEPs of IVP and SCNT blastocysts compared to the in vivo blastocysts. The wRMSD distribution of each blastocyst's GEP in the IVP and SCNT groups was obtained by calculating the deviations of the gene expression from the mean GEP of the in vivo group instead of the mean values of the same group (Fig. 4A). Notably, wRMSD values less than 0.6 were found in all of the in vivo embryos, whereas 63% and 30%, respectively, of the IVP and SCNT embryos belong to this range (Fig. 4B). The resulting wRMSDs indicated that the GEPs in the IVP and SCNT groups greatly deviated from those in the in vivo group, and that the GEP difference between in vivo and SCNT blastocysts (p=3.783e −11) was larger than the difference between in vivo and IVP blastocysts (p=4.524e −9) (Fig. 4C). From these findings, we concluded that the SCNT blastocyst group was more distal to the in vivo group blastocysts than the IVP blastocyst group was to the in vivo group in terms of the GEPs.
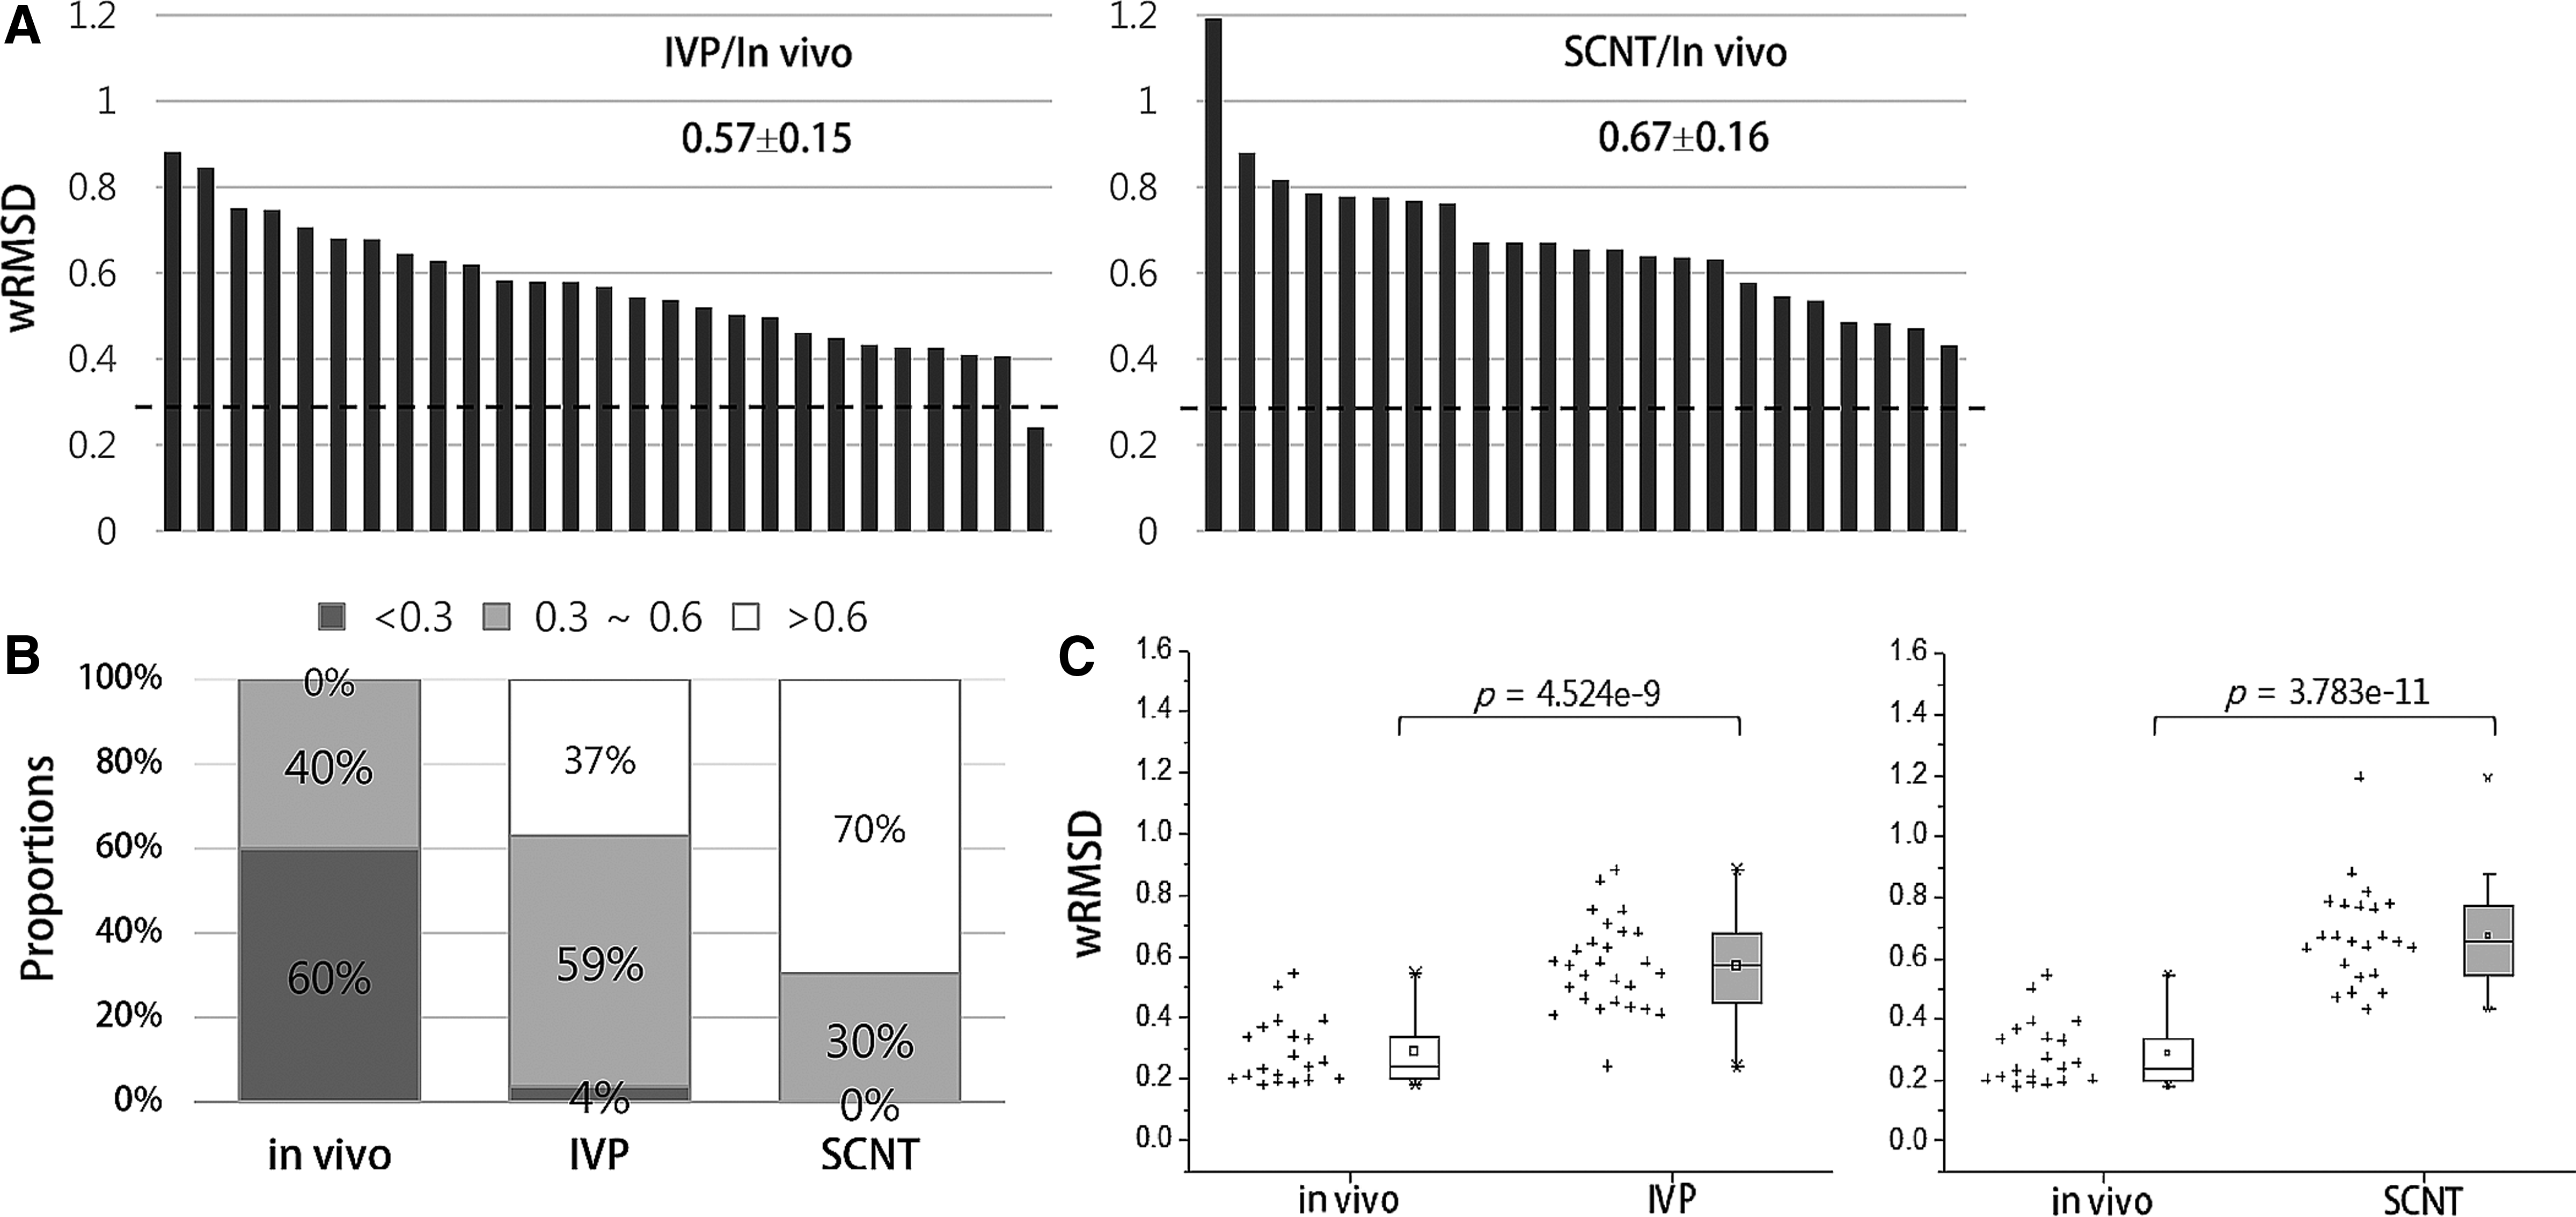
Difference in the GEPs of IVP and SCNT blastocysts compared to the in vivo blastocysts. (
Discussion
Genetically and functionally homogeneous cell populations have distinct expression signatures of their own of a repertoire of genes, and this signature, by extension, could be a reflection of functional identity of the population. By a cue given during differentiation or reprogramming, the biochemical nature of a cell population is changed and so is its expression signature as well. If this signature is about a certain combination of genes that are functionally connected to each other, it could reflect the feature of cell population much better. Our qGEP analysis examined the expression signatures in different biological samples and quantified the difference existing between the signatures. If an embryo group has an expression signature, or mean GEP, that is closer to the signature of a relevant embryo group as a standard, it is expected to have more potential for proper development.
Application of this assay on the three blastocyst groups demonstrated a substantial difference of IVP and SCNT blastocysts from the in vivo group, with the relative GEP difference between in vivo and SCNT blastocysts far larger than that between in vivo and IVP blastocysts. Hence, our qGEP analysis identified the mouse SCNT blastocysts as the inferior-quality group in comparison with the IVP blastocysts. This determination is neither unpredictable nor new to the research field; however, on the ground of the very conformity to the general notion, the qGEP approach is proven to be more reliable. Moreover, the qGEP analysis helps calculate the extent of the difference in GEPs, going beyond the vague belief of IVP embryos being superior to SCNT embryos. Because the results from our qGEP analysis follow the notion that the research field generally accepts, it conversely gives confidence regarding the efficacy of the qGEP approach to measure the embryo quality and to select more efficient embryo derivation protocols.
In addition to measuring the developmental ability of the cloned embryos that are derived by different protocols, the qGEP analysis can assess the effects of environmental factors and genetic modulations on developing embryos. Various culture environmental factors, such as the medium composition, serum supplementation, and gas atmosphere (Gad et al., 2012), and genetic modulations by transgene expressions, short interfering RNAs, and chemical inhibitors can definitely influence the developmental ability of early embryos.
For the qGEP analysis to work in a well-predicted manner, genes that can appropriately reflect the progress of reprogramming are needed, as well as an increased number of genes and samples that can make the analysis system less fallible and more elaborate. The choice of genes could possibly affect the sensitivity of the results. The genes that were chosen in this study were generally known to be implicated in reprogramming, but they were merely a set of examples. With a large set of such genes that are involved in various (i.e., either redundant or totally different aspects of) reprogramming events, a pre-evaluation step is required to sift out the less-significant genes and select the candidate genes that can serve as reprogramming markers during early development. This is achieved by consulting existing expression array data available as well as analyzing a large number of embryo samples. From this, we could identify a new set of marker genes that are resistant to embryonic reprogramming and, at the same time, influence other genes with a far-reaching developmental role. With these marker genes determined, the qGEP analysis would be a more powerful tool to rank different groups of embryos that are derived in different fashions.
Compared with other groups, the in vivo blastocyst group somewhat variably expressed the HMT and HDM category genes, which we repeatedly observed from another set of experiment with in vivo blastocysts (n=24; data not shown). Because transcription of these category genes, including Setdb1, G9a, Suv39h1, and Jmjd3, is (re-)commenced at the blastocyst stage (Canovas et al., 2012; Cho et al., 2012; Dodge et al., 2004; McGraw et al., 2007), this stage could be on the borderline when a part of the embryos express just some of these genes, resulting in a varied pattern of expression of the genes among blastocysts.
The inefficient reprogramming in dedifferentiating cells is possibly owing to a repressive chromatin structure that works as a barrier to the binding of transcription factors. The genes that were chosen here for analysis were all directly or indirectly involved in the establishment of repressive chromatin. Because of their intrinsic nature to act in a genome-wide manner, the aberrant expression of the repressive chromatin modifiers could entail pleiotropic effects over the whole genome. We found that Dnmt1 was expressed at a higher level in SCNT blastocysts than in in vivo blastocysts (Fig. 2C); therefore, it is possible that the increased Dnmt1 activity overflows to otherwise naïve genomic loci. In agreement with this, de novo methylation at CpG islands was observed in Dnmt1-overexpressing cells (Graff et al., 1997; Vertino et al., 1996). Moreover, Setdb1 was recently observed to be localized mostly in the cytoplasm when it was overexpressed, suggesting that an epigenetic surveying system sets a tight limit on the nuclear activity of Setdb1, guarding against the hazardous effect of excess Setdb1 (Cho et al., 2013; Kang, 2014). Therefore, because the activity of the chromatin modifiers should be tightly controlled for proper development, it is essential to measure the (relative) expression of epigenetic modifier genes and quantitate their expression differences in different blastocysts.
Footnotes
Acknowledgments
We thank to M.J. Kang for bovine ear skin fibroblasts and S. Cho for mouse embryos. This work is supported by grants from Next-Generation BioGreen21 Program (PJ00959001), KRIBB internal project, National Research Foundation of Korea (2006-2004082), and NRF-SRC program (2011-0030049).
Author Disclosure Statement
No competing financial interests exist.
References
Supplementary Material
Please find the following supplemental material available below.
For Open Access articles published under a Creative Commons License, all supplemental material carries the same license as the article it is associated with.
For non-Open Access articles published, all supplemental material carries a non-exclusive license, and permission requests for re-use of supplemental material or any part of supplemental material shall be sent directly to the copyright owner as specified in the copyright notice associated with the article.