
Abstract
Abstract
Induced pluripotent stem cell (iPSC) technology has become an important tool for disease modeling. Insufficient data on the variability among iPSC lines derived from a single somatic parental cell line have in practice led to generation and analysis of several, usually three, iPSC sister lines from each parental cell line. We established iPSC lines from a human fibroblast line (HDF-K1) and used transcriptome sequencing to investigate the variation among three sister lines (iPSC-K1A, B, and C). For comparison, we analyzed the transcriptome of an iPSC line (iPSC-K5B) derived from a different fibroblast line (HDF-K5), a human embryonic stem cell (ESC) line (ESC-HS181), as well as the two parental fibroblast lines. All iPSC lines fulfilled stringent criteria for pluripotency. In an unbiased cluster analysis, all stem cell lines (four iPSCs and one ESC) clustered together as opposed to the parental fibroblasts. The transcriptome profiles of the three iPSC sister lines were indistinguishable from each other, and functional pathway analysis did not reveal any significant hits. In contrast, the expression profiles of the ESC line and the iPSC-K5B line were distinct from that of the sister lines iPSC-K1A, B, and C. Differentiation to embryoid bodies and subsequent analysis of germ layer markers in the five stem cell clones confirmed that the distribution of their expression profiles was retained. Taken together, our observations stress the importance of using iPSCs of different parental origin rather than several sister iPSC lines to distinguish disease-associated mechanisms from genetic background effects in disease modeling.
Introduction
M
Human iPSCs are biologically very similar to human ESCs, and likewise these have the potential to differentiate into a plethora of cell types. Using defined protocols, iPSCs can be differentiated into the desired cell types to be studied (Reinhardt et al., 2013). Thus, iPSCs provide a tool to model human disease mechanisms under defined conditions in vitro. Furthermore, iPSCs derived from patients with genetic disorders preserve the entire genetic makeup that may be of importance for disease development. Thus, research using iPSCs has provided an invaluable tool for in vitro disease modeling, biomarker identification, drug discovery, toxicity studies, and cell replacement therapy (Ebert et al., 2009; Kondo et al., 2013; Soldner et al., 2009).
Although iPSCs are technically easy to obtain, the procedure is time consuming, costly, and labor intensive. Reprogramming of somatic cells to iPSCs requires manual selection of a number of ESC-like colonies that appear after 3–4 weeks (Ohnuki et al., 2009; Sommer et al., 2009). The colonies are expanded as individual iPSC lines that are subjected to a series of quality tests to ensure that they are fully reprogrammed and thus constitute true iPSCs (Ohnuki et al., 2009; Sommer et al., 2009). Furthermore, modeling human disease involves subsequent differentiation of individual iPSC lines into the desired cell type(s). The variability between different iPSC lines derived from one and the same parental line (i.e., iPSC sister lines) has been debated and, therefore, several iPSC sister lines derived from each parental primary cell line (i.e., individual) are used routinely. Current practice is to establish two to several isogenic iPSC sister lines that are independently expanded and differentiated into the desired cell type. This strategy has implications for both labor and cost. However, recent studies have observed heterogeneity between iPSC lines derived from different individuals on the basis of mRNA expression arrays and flow cytometry data (Mills et al., 2013; Vitale et al., 2012). These observations stress the importance of including iPSC lines from more than one individual (i.e., biological replicates) for disease modeling.
In this study, we investigated the degree of heterogeneity between iPSC sister lines from one donor using transcriptome sequence analysis. Furthermore, we compared the gene expression profiles of iPSC lines derived from nonrelated individuals. The transcriptome data of the iPSC lines, parental fibroblasts, and an ESC line were analyzed in parallel. Additionally, we assessed markers for the three germ layers after embryoid body (EB) formation. Our findings reveal that the iPSC sister lines are almost identical, but clearly distinct from the ESCs and the iPSCs of different parental origin. Furthermore, the relative differences between stem cell lines are retained after differentiation into the three germ layers.
Materials and Methods
Fibroblasts
Primary fibroblast lines were established from punch biopsies obtained from two healthy individuals (K1, healthy male, aged 38 years; K5, healthy woman, aged 34 years) following standard protocols (Rooney and Czepulski, 1992). Fibroblasts were maintained in HFF Medium [Dulbecco's Modified Eagle Medium (DMEM) high glucose (Sigma) supplemented with 10% fetal bovine serum (FBS; Sigma), 2 mM
Ethical considerations
Written informed consent was obtained from the two donors, and the study was approved by the regional ethical committee of Uppsala, Sweden (D-number 319/2009).
Lentivirus production, reprogramming, and iPSC culture
Lentivirus particles containing a polycistronic construct encoding the reprogramming factors Oct3/4, Klf4, c-Myc, and Sox2 (Sommer et al., 2009) were made in HEK293T cells. Briefly, 7 × 10⁵ HEK293T cells were seeded onto a 6-cm culture dish in 5 mL of HFF medium and transfected the next day with 2 μg of pEF1α-StemCCA/LoxP, 1.5 μg of psPAX2 (Addgene, plasmid #12260), and 0.5 μg of pMD2.G (Addgene, plasmid #12259) using FuGene HD Transfection Reagent and the associated protocol (Promega). Medium was replaced the next day; virus particles were harvested 24 and 48 h later, respectively, and combined.
Approximately 150,000 primary fibroblasts were seeded onto a 10-cm culture dish in HFF Medium and left to recover overnight. Next day, the medium was changed to HFF Medium supplemented with 1 μg/mL Polybrene, and 2 mL of lentivirus supernatant was added. Medium was replaced with fresh medium the next day and thereafter changed every day. On day 7, cells were harvested with TrypLE Express, and 50,000 cells were seeded onto a 10-cm dish preseeded with mitomycin C–treated human foreskin fibroblasts [HFFC; CRL2429, American Type Culture Collection (ATCC)]. After overnight recovery, medium was replaced with hESC Medium (KnockOut® DMEM supplemented with 20% serum replacement, nonessential amino acids,
Human iPSCs (hiPSCs) and human ESCs (hESCs; line ESC-HS181) were cultured on dishes coated with HFFC in hESC Medium supplemented with 10 ng/mL bFGF. iPSCs were passaged either manually or enzymatically using collagenase IV (Gibco). Alternatively, cells were transitioned to feeder-free culturing on Matrigel™ (BD Bioscience) in mTeSR™1 (Stem Cell Technologies) with Dispase passaging following manufacturer's recommendations.
iPSC quality assurance
Genome integrity of iPSCs was assessed using conventional G-banding of metaphase chromosomes (Meisner et al., 2008). Expression of pluripotency markers was confirmed using a TaqMan® Human Stem Cell Pluripotency Low Density Array (TLDA; Life Technologies) and by immunostaining of iPSC colonies. Array analysis was performed using total RNA isolated from iPSCs cultured on Matrigel® using TRIzol® and a PureLink® RNA Mini Kit (Life Technologies). RNA quality was checked using an RNA nano6000 chip on a Bioanalyzer 2100 (Agilent). One microgram of total RNA was converted to cDNA using a SuperScript VILO cDNA Synthesis Kit (Life Technologies), subsequently mixed with TaqMan® Gene Expression Master Mix, and loaded onto the TLDA array following the manufacturer's protocols. The TLDA was run on a 7900HT Real-Time PCR System (Applied Biosystems), and data were processed with RQ Manager® 1.2.1 software. The cycle threshold (Ct) values obtained were used to calculate expression of markers relative to expression of 18S rRNA (ΔCt values).
Marker expression was compared across cell lines using Genesis (Sturn et al., 2002). Immunostaining of hiPSC colonies was performed using standard protocols utilizing the following primary and secondary antibodies: Mouse immunoglobulin G (IgG) α-NANOG (Sigma), rat IgM α-SSEA3 (Life Technologies), mouse IgG α-SSEA4 (Life Technologies), mouse IgM α-TRA-1-60 (Life Technologies), mouse IgM α-Tra-1-81 (Life Technologies), α-mouse IgG AlexaFluor488, α-mouse IgM FITC, α-rat IgM AlexaFluor555, and α-rabbit IgG AlexaFluor555. Photographs were taken using an LSM510 Confocal Microscope (Zeiss) and processed using ZEN software (Zeiss).
Proliferation Analysis of iPSCs
Proliferation of iPSCs was analyzed using a Click-iT® EdU Flow Cytometer Assay Kit (Life Technologies). Approximately 1 × 10⁶ cells were used per replicate and incubated with 5 μM EdU for 16 h. The next day, cells were processed following manufacturer's recommendations. iPSCs were additionally stained for cell-surface markers stage-specific embryonic antigen-4 (SSEA4) and TRA-1-60 using antibodies described above. A fixable live/dead stain was included. Fixed cells were run on an LSR II Flow Cytometer (BD Biosciences), and data were analyzed using FlowJo™ software.
In vitro differentiation assay
EBs were formed in hESC medium without bFGF from approximately 1 million iPSCs and ESCs cultured on HFFC using AggreWell™ 400 Plates (Stem Cell Technologies) following associated protocols. EBs were cultivated in hESC medium without FGF for 1 week. Subsequently, EBs were plated to six-well culture dishes or gelatin-coated microscope cover slips and cultured for additional 3 weeks in KnockOut® DMEM supplemented with 20% FBS, nonessential amino acids,
RNA library preparation and sequencing
Total RNA was prepared from iPSCs, ESCs, and fibroblasts, respectively, as described above and used for transcriptome analysis. Input RNA was quality controlled by the RNA 6000 Pico Chip on a Bioanalyzer (Agilent Technologies), only RNA integrity number (RIN) values above 9 were accepted. The RiboMinus Eukaryote Kit was used for removal of ribosomal RNA (rRNA), followed by fragmentation of the remaining RNA with RNase III according to manufacturer's protocols. RNA libraries were then constructed using the AB Library Builder Whole Transcriptome Core Kit (Life Technologies) and amplified (12–15 cycles). The whole transcriptome RNA libraries were sequenced on the 5500W SOLiD System (75-bp read length, Life Technologies).
Processing and analysis of RNA sequencing data
Sequence reads were mapped to the human reference (hg19) using the LifeScope Whole Transcriptome analysis pipeline. For each sequenced sample, the number of reads aligned to any gene annotated in the National Center for Biotechnology Information (NCBI) reference sequences (RefSeq) (Pruitt et al., 2007) was counted using the Python package Htseq (Anders et al., 2015). Reads mapping in ambiguous regions, e.g., when reads are aligned to two different overlapping genes, were excluded from further analysis.
Global comparison of RNA sequencing data of different stem cell lines (iPSC-K1 A-C, iPSC-K5B, and ESC-HS181) was carried out using GraphPad Prism v6 as follows. Data sets [number of reads per gene relative to the gene length (RPKM)] were normalized and subsequently log2 transformed to obtain normally distributed data sets. Genes with a low number of reads (<25 percentile) were excluded from subsequent analysis. Analysis of variance (ANOVA) was performed on all remaining transcripts (n = 16,254) after excluding the stem cell markers analyzed by TLDA. We then performed a separate analysis of transcripts for these stem cell markers.
Differential expression analysis was performed using the R package DESeq (Love et al., 2014) using the read counts for each gene as input data. The built-in DESeq normalization of read counts was used to calculate fold ratios for individual genes and for comparison between samples. Subsequently, the biconductor R package GAGE “generally applicable gene set enrichment” was used. The GAGE method uses all of the available gene expression data instead of prefiltering of data (Luo et al., 2009). Gage was applied to identify differentially expressed pathways as well as for Gene Ontology (GO) analysis of differentially expressed GO categories, where q < 0.05 was used as the cutoff. Principal component analysis (PCA) was performed on the 5000 genes having the largest variance in normalized read counts between sequenced samples using in-house R scripts. Euclidean clustering was performed using R.
Results
Reprogramming and iPSC characterization
Primary fibroblast lines (i.e., HDF-K1 and HDF-K5) from two unrelated adult individuals of comparable age were reprogrammed using a polycistronic lentiviral vector (Sommer et al., 2009). After 4 weeks, several ESC-like colonies were picked and expanded. We used morphological criteria to select three sister lines from K1 (clonal replicates) and one line from K5 (biological replicate) for quality assessment. The hESC line ESC-HS181 was used as a reference (Adewumi et al., 2007). The four iPSC lines and the ESC line were morphologically similar (Fig. 1). All iPSC lines showed a normal karyotype at passage 25 after reprogramming (data not shown). We analyzed expression of markers for pluripotency using immunofluorescent staining against NANOG and the cell-surface proteins TRA-1-60, TRA-1-81, SSEA-3, and SSEA-4. All lines stained positive for the five markers (Fig. 1). Next, we examined stem cell marker expression using the TLDA.
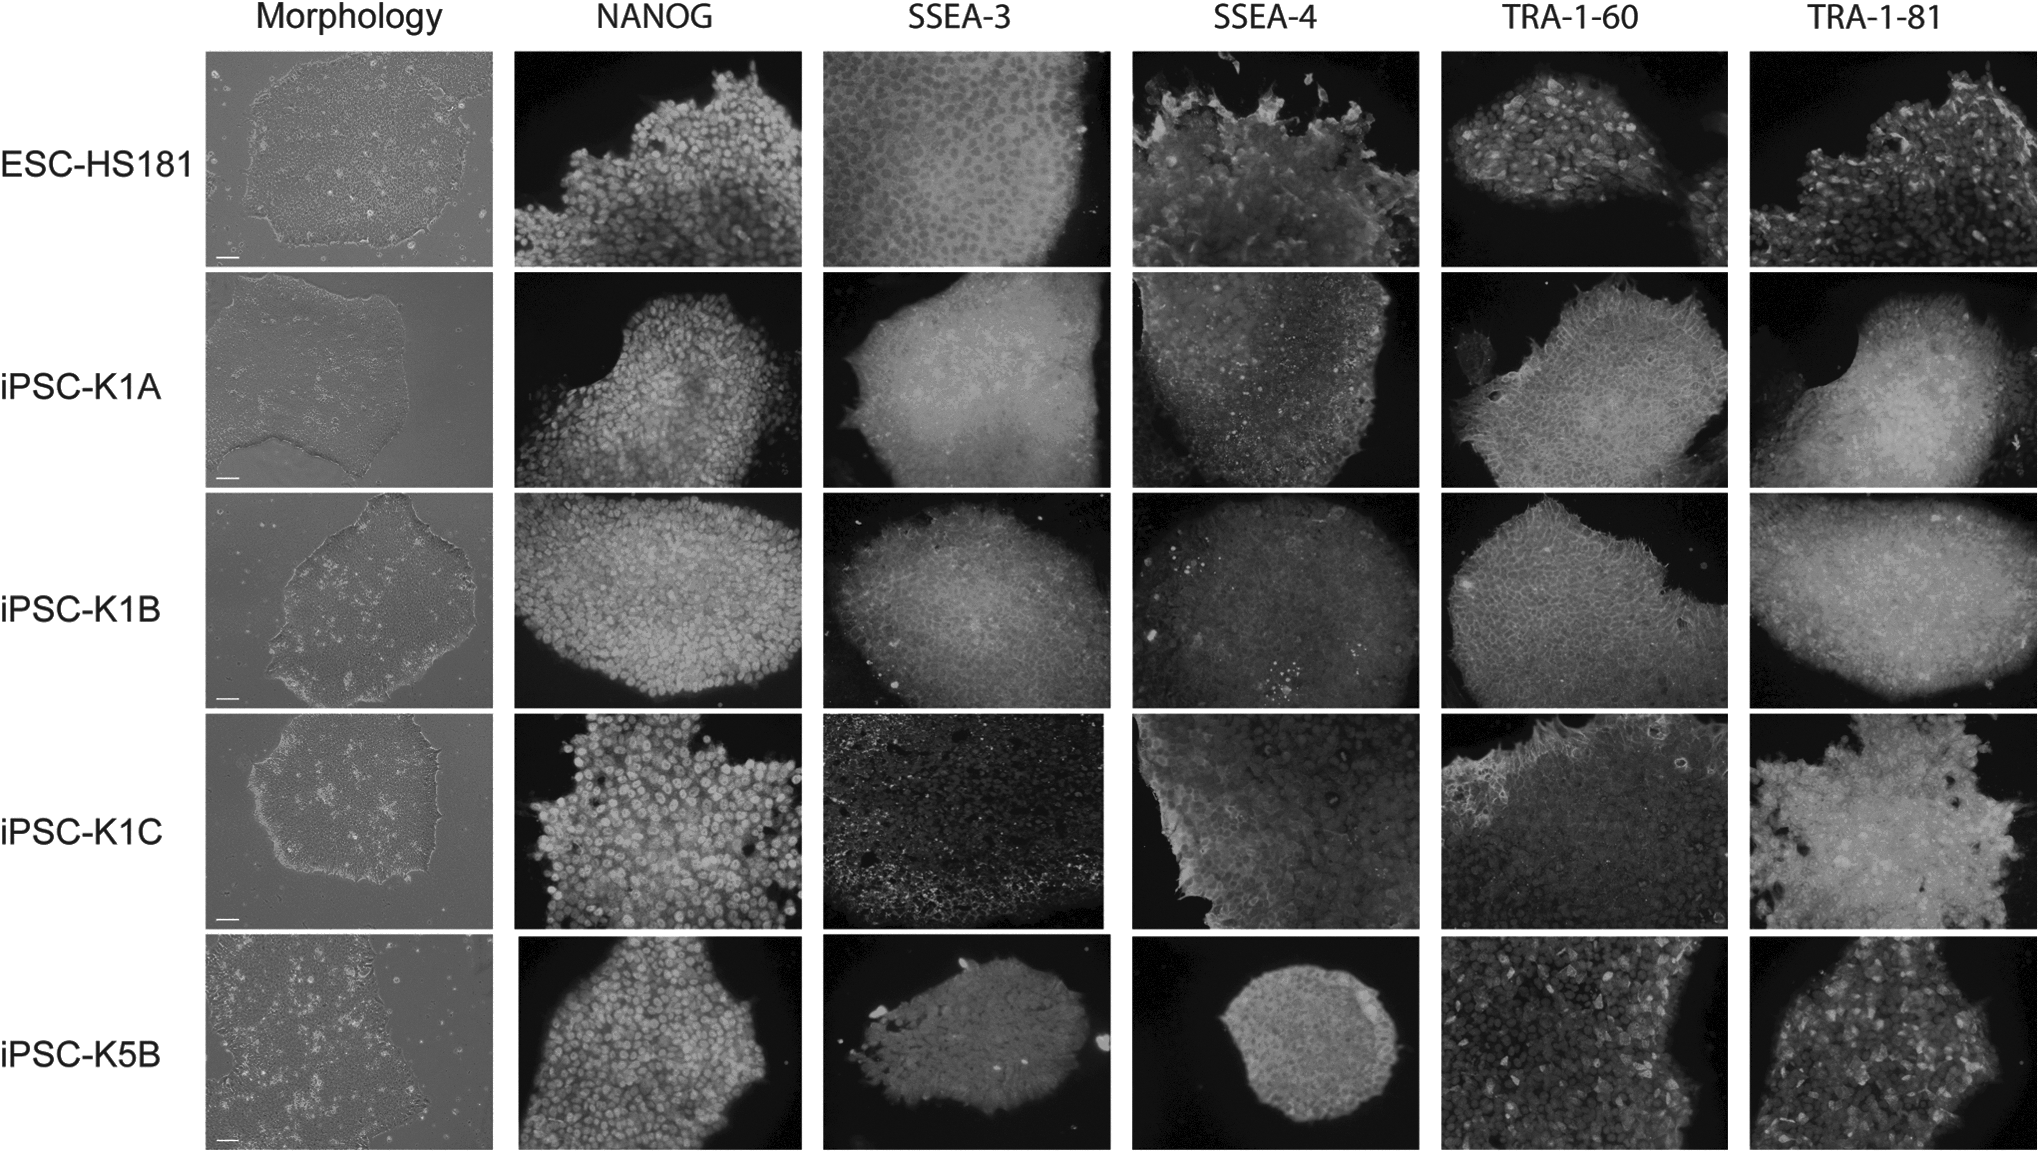
Morphology and expression of pluripotency markers in iPSC lines. The four iPSC lines (iPSC-K1A, B, C and iPSC-K5B) are morphologically similar to the ESC line (ESC-HS181; left panel) and they all stained positive for the same pluripotency markers (remaining panels). Colonies were stained for NANOG, TRA-1-60, TRA-1-81, SSEA3, SSEA4, and DNA [4',6-diamidino-2-phenylindole (DAPI)], respectively. Magnification, 100 × ; bar, 100 μm.
We constructed a heat map of 47 markers for undifferentiated or pluripotent stem cells using data from the TLDA (Adewumi et al., 2007). All iPSC lines expressed the 47 markers at levels comparable to ESC-HS181 (Fig. 2). Furthermore, hierarchical cluster analysis of the TLDA data showed that the iPSC sister lines derived from HDF-K1 (i.e., iPSC-K1A, B, C) grouped closely together and formed a cluster together with ESC-HS181, as opposed to iPSC-K5B and to the two parental fibroblast (HDF) lines. This confirmed that the iPSC lines were similar to ESC-HS181 and that they are fully reprogrammed (Fig. 1). In addition, our observations indicate that the iPSC-K1 sister lines are more similar to each other than to the ESC-HS181 and iPSC-K5B lines, respectively.

Two-way cluster analysis of a hESC line (ESC-HS181), four iPSC lines (iPSC-K1A, B, C and iPSC-K5B) and their parental fibroblast lines (HDF-K1 and HDF-K5) with respect to gene expression. Total RNA from the iPSC, ESC, and HDF lines was analyzed using a TLDA. Data are presented as a heat map showing normalized relative expression (ΔCt values) of 47 markers for undifferentiated and pluripotent cells or markers associated with stemness, respectively (Adewumi et al., 2007). Hierarchical cluster analysis was performed using Genesis (Sturn et al., 2002) on the three iPSC-K1A, B, and C sister lines, the iPSC-K5B and ESC-HS181 lines, as well as the parental HDF-K1 and HDF-K5 lines. The levels of gene expression relative to 18S rRNA are indicated by change from dark (high expression, low ΔCt) to light (low expression, high ΔCt).
EB differentiation assay
Next, we carried out EB differentiation assays to evaluate the capability of the four iPSC lines and the ESC line to differentiate into cell types of the different germ layers in vitro. EBs were formed using an AggreWell™400 plate, and all lines formed EBs with similar efficiency and quality within 24 h. The EBs were harvested and allowed to differentiate spontaneously for 4 weeks and subsequently analyzed by immunofluorescent staining (Fig. 3). Cells corresponding to the three germ layers were detected by staining against smooth muscle actin (SMA; mesoderm), α-fetoprotein (AFP; endoderm), and β-III-tubulin (Tuj1; ectoderm). Additionally, total RNA was isolated from 4-week-old EBs for TLDA analysis of markers representing the three germ layers. The analysis confirmed that all EBs expressed markers of the three germ layers without any detectable bias toward a specific germ layer. We further compared the EBs to their parental iPSC lines to evaluate the fold changes in expression of markers on the TLDA panel. As expected, the results show that markers of all three germ layers are strongly upregulated in the EBs (Fig. 4), whereas pluripotency genes and markers for undifferentiated cells are strongly downregulated (data not shown). Importantly, the marker profiles of the three EBs derived from the iPSC-K1 sister lines showed mutually closer similarities, when compared to marker profiles of the EBs derived from iPSC-K5B and ESC-HS181, respectively.
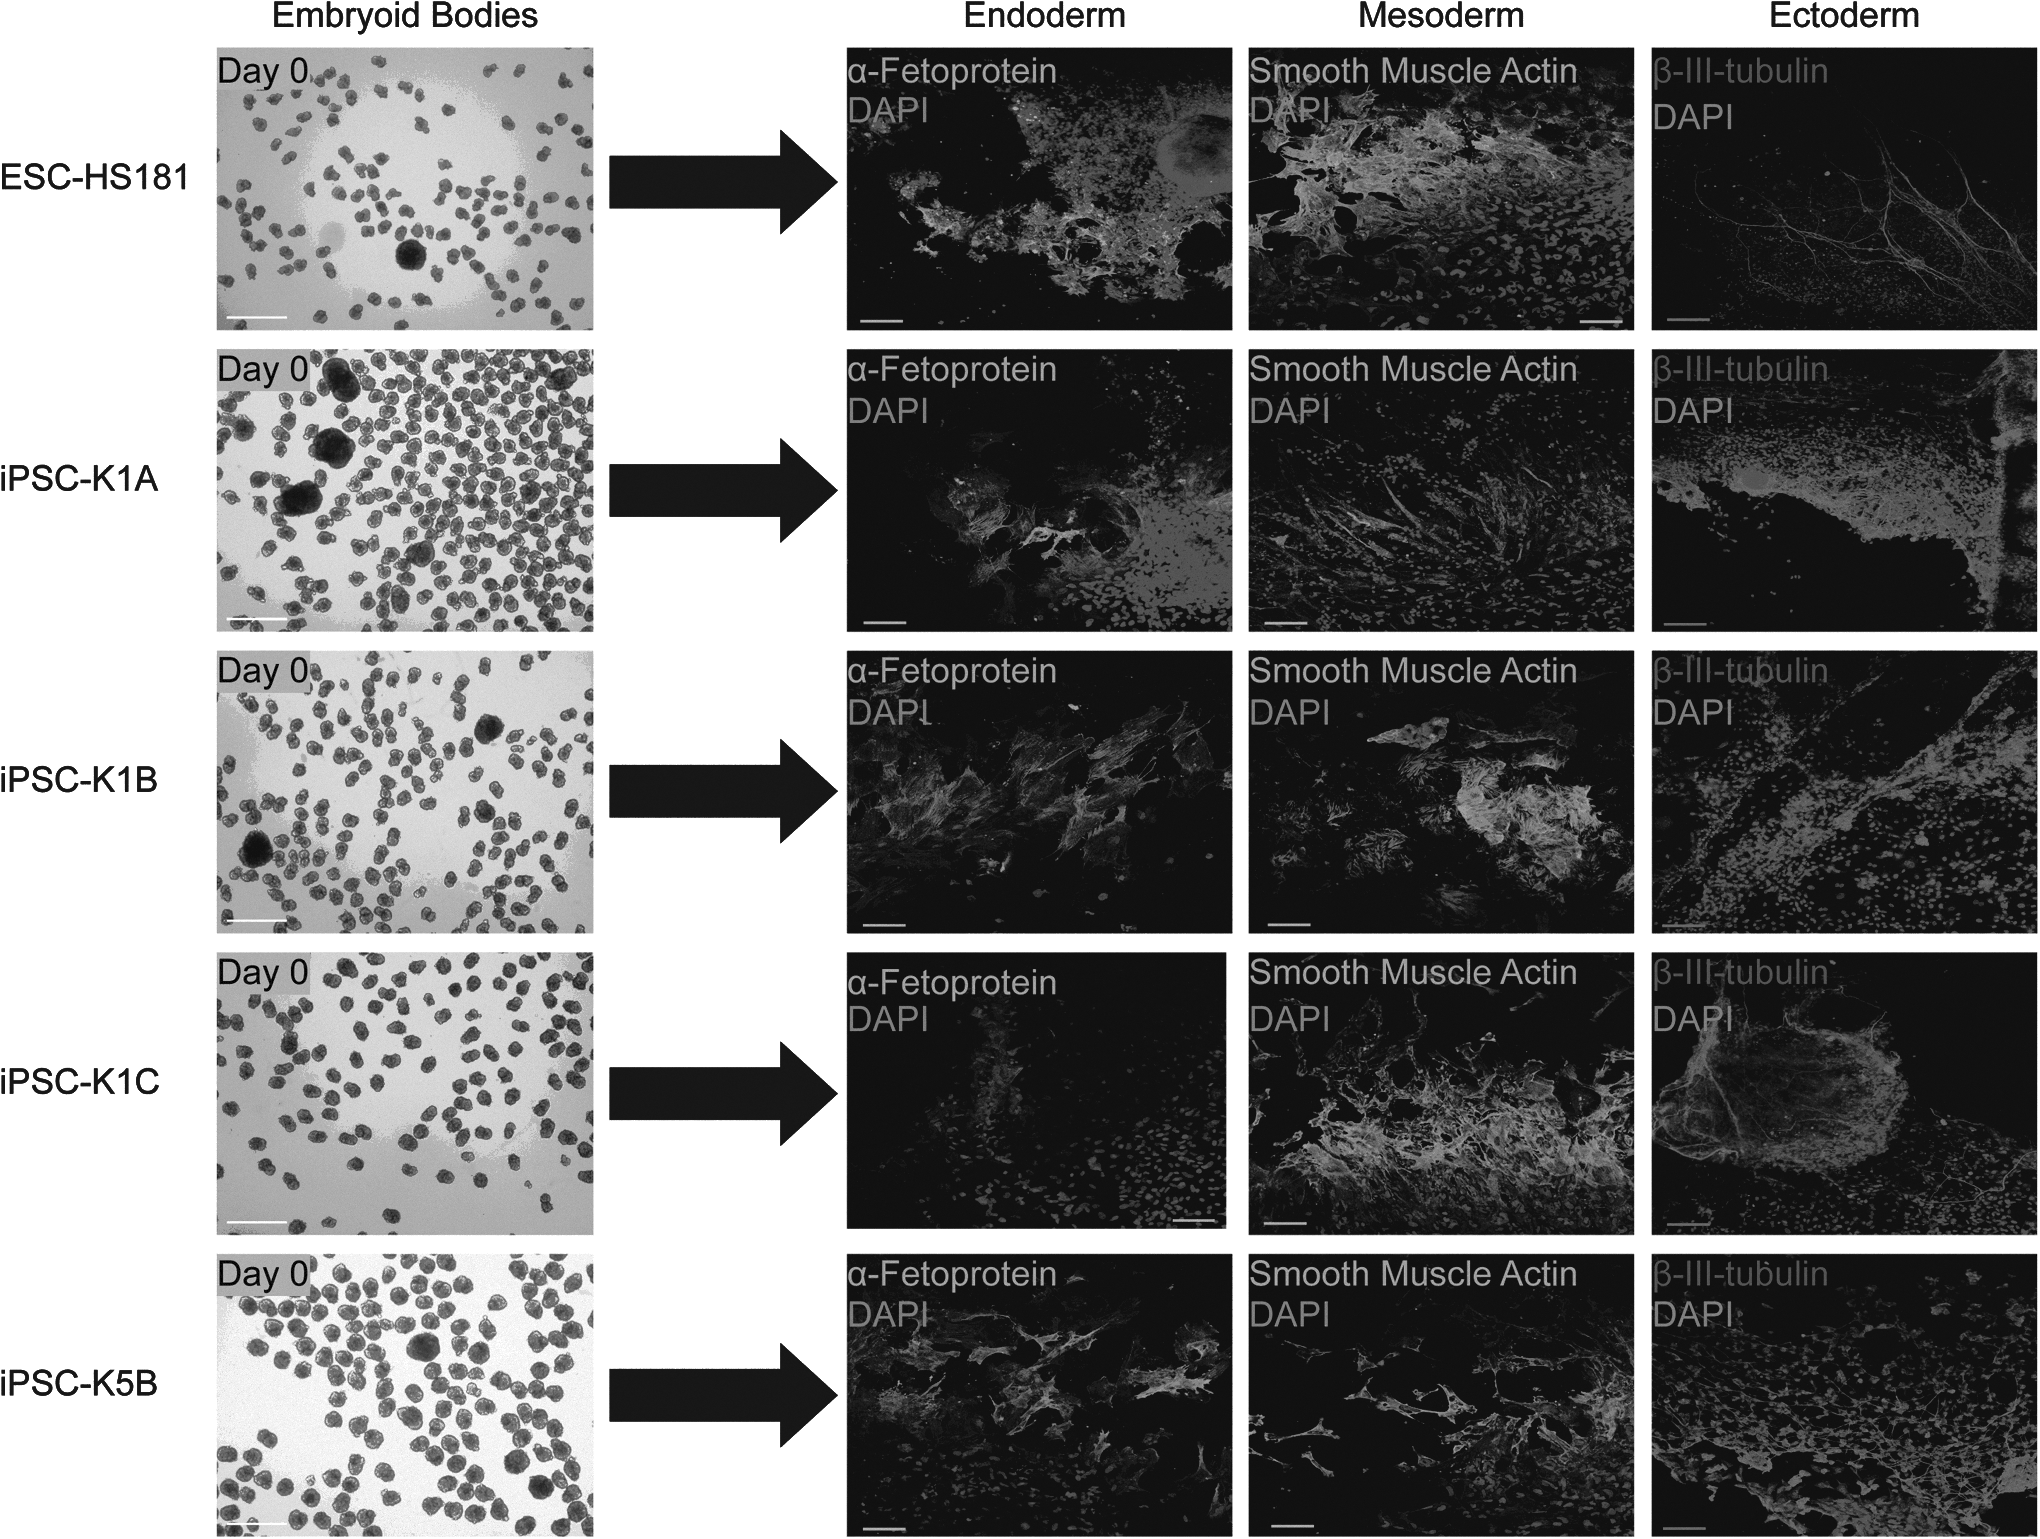
Formation of EBs and germ layer formation. EBs from a hESC line (EB-HS181) and the four iPSC lines (iPSC-K1A, B, C and iPSC-K5B) were differentiated into all three germ layers in vitro for 4 weeks followed by staining of DNA (DAPI) and germ layer markers (endoderm, AFP; mesoderm, SMA; ectoderm, Tuj1). EBs derived from the four iPSC lines and the ESC line stained positive for all germ layer markers. Bar, 100 μm.
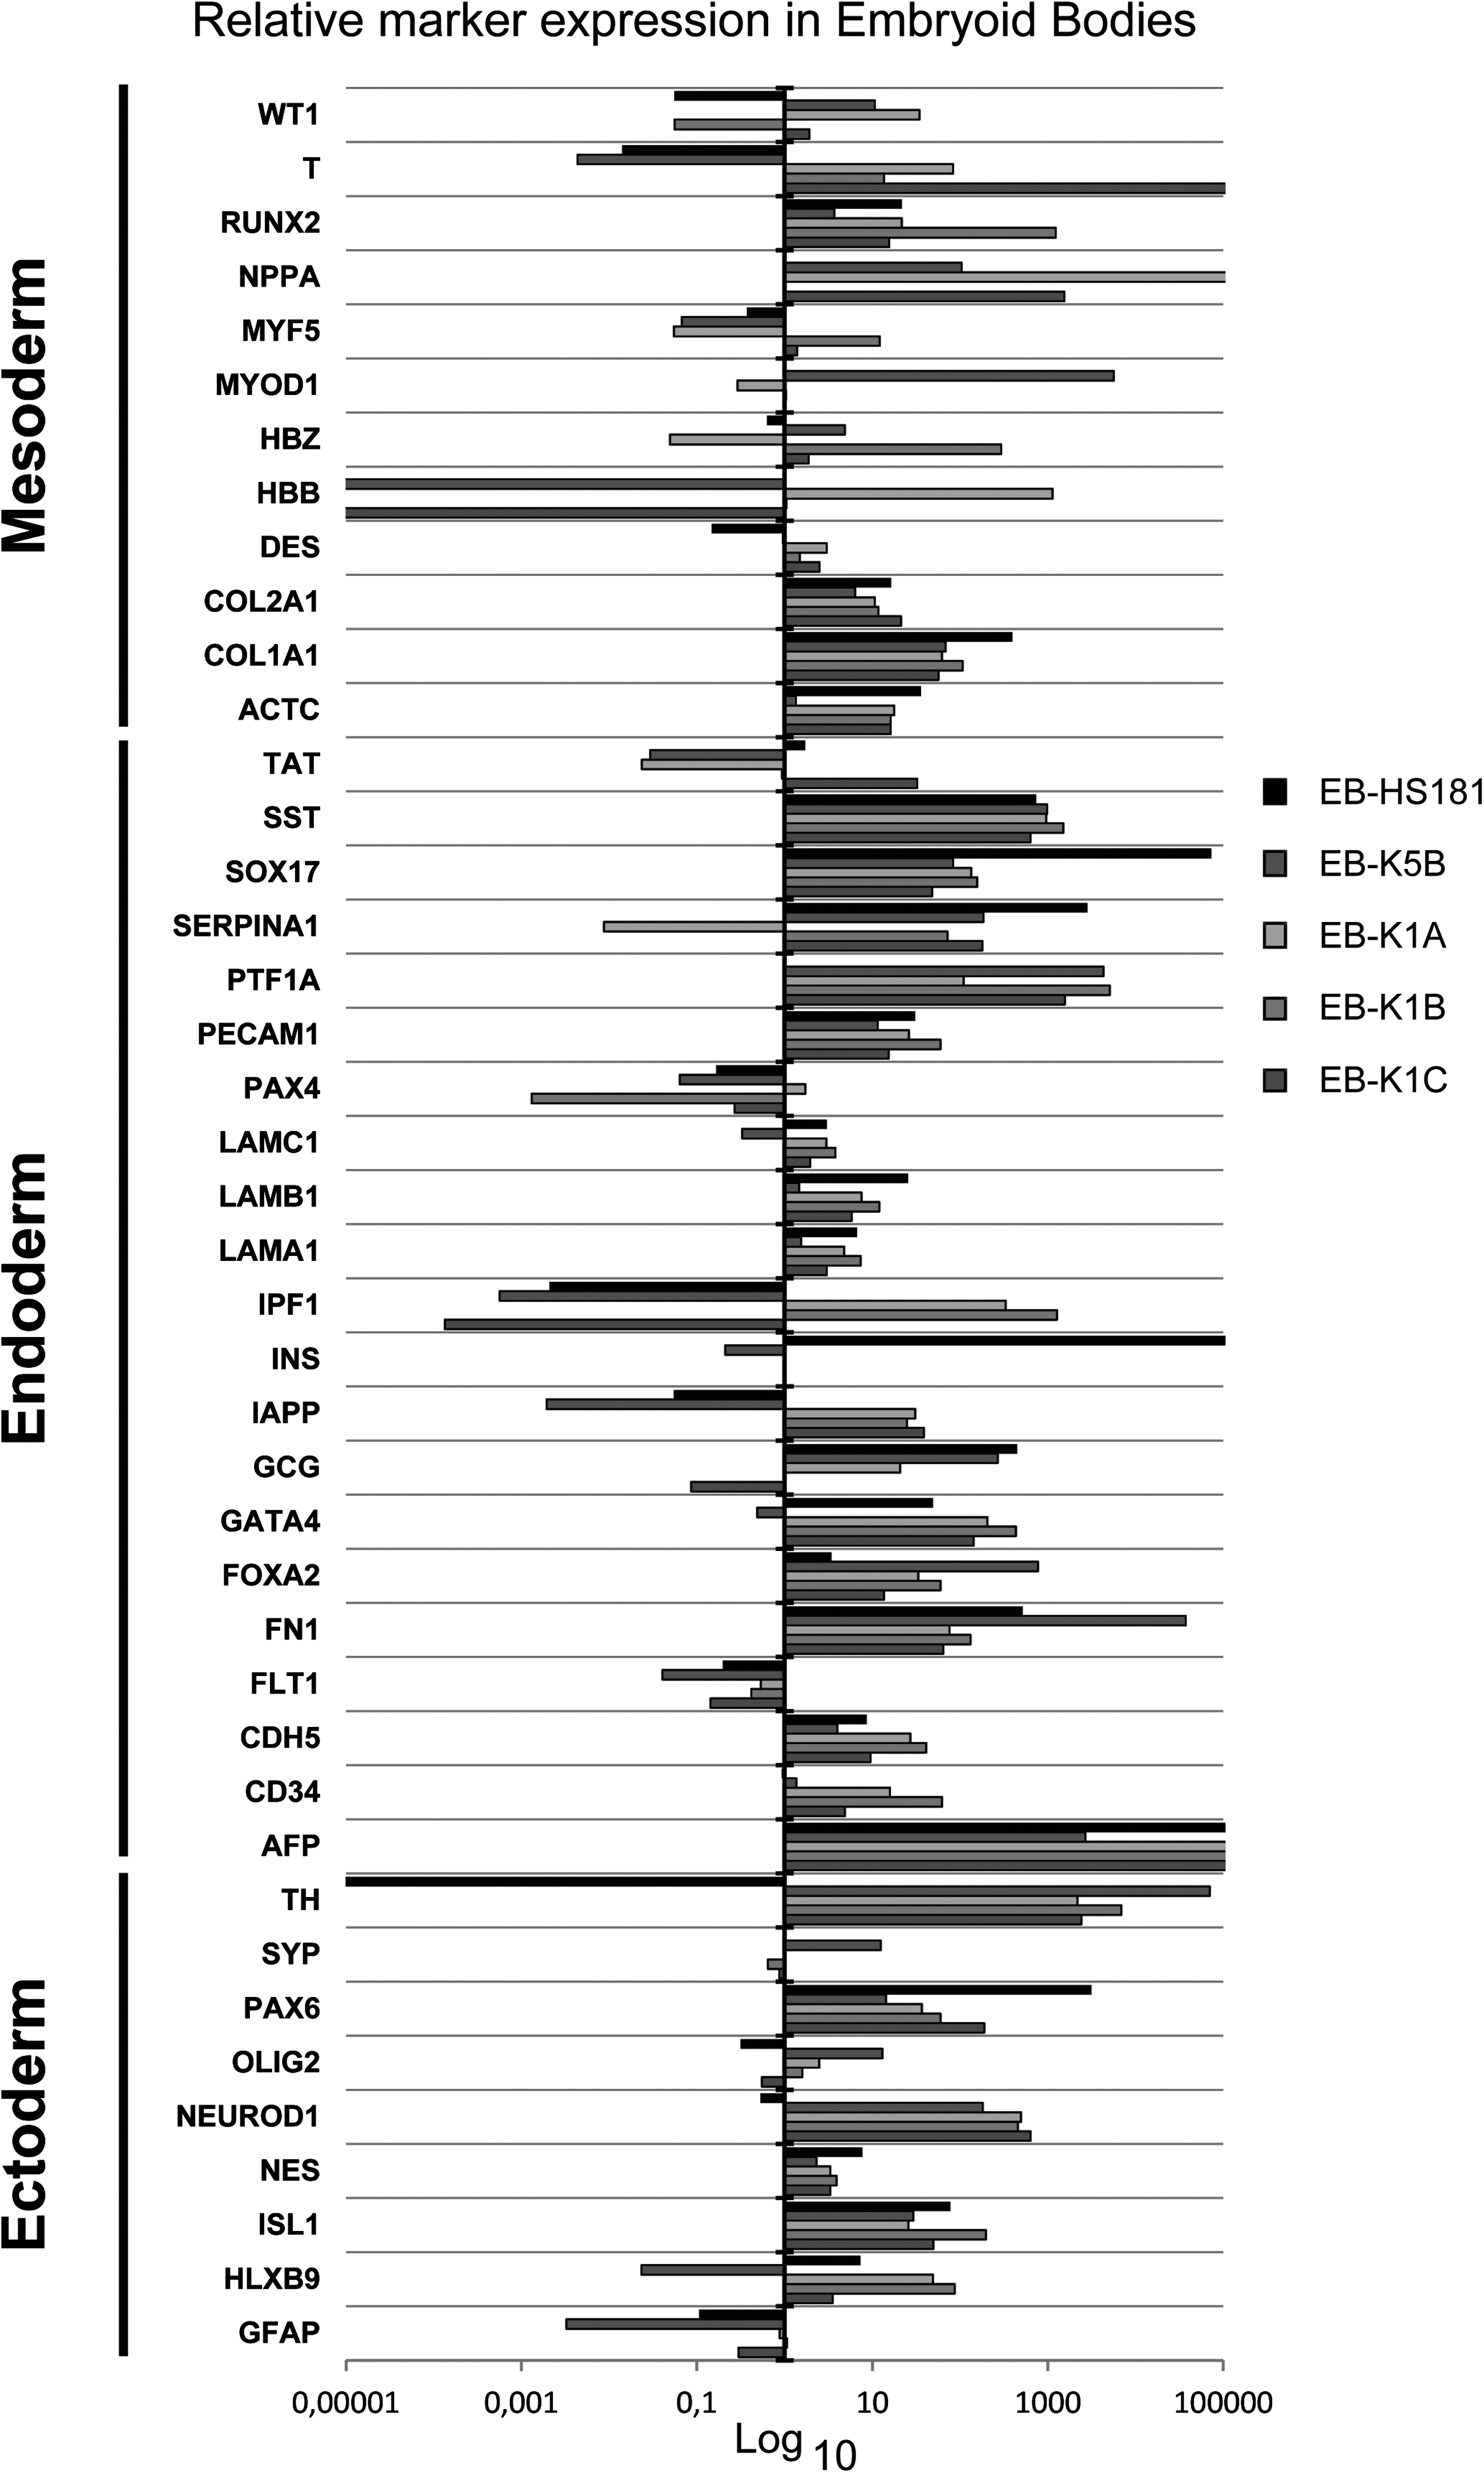
Expression of germ layer markers after in vitro differentiation of a hESC line (EB-HS181) and four human iPSC lines (EB-K5 and EB-K1A-C). EBs were formed from iPSCs and allowed to differentiate for 4 weeks. Total RNA from EBs was subsequently analyzed using TLDA. Relative marker expression in the EBs was compared to the relative expression of markers in the respective parental iPSC line (ΔΔCt) and plotted on a logarithmic scale, indicating fold changes. Markers representing the three germ layers endoderm, mesoderm, and ectoderm are indicated.
Transcriptome profiling of iPSCs
Subsequently, we performed transcriptome profiling of the four iPSC lines, the two parental fibroblast lines (HDF-K1 and HDF-K5) and the ESC line using RNA deep sequencing on the 5500W SOLiD System. Furthermore, we included replicates of iPSC-K5B using different RNA input concentrations to evaluate possible variability introduced by the sequencing method (i.e., technical replicates). The number of mapped reads of each sample was on average ∼70 million (ranging from ∼40 × 106 to ∼100 × 106 reads). The transcriptome profiles of all cell lines were compared using PCA. The results showed that all stem cell lines cluster together, distinct from the fibroblast lines (Fig. 5A), supporting that the iPSCs were fully reprogrammed. Within the stem cell cluster, the three iPSC-K1 sister lines fall closely together with almost identical profiles. The iPSC line derived from the other donor (iPSC-K5B) as well as the ESC line (ESC-HS181) showed slightly distinct profiles consistent with the TLDA analysis. Furthermore, the PCA showed that the three technical replicates of iPSC-K5B clustered closely together, which confirmed reproducibility using our sequencing platform (Fig. 5A). In contrast to all stem cell clones, the two parental fibroblast lines form a separate and distant cluster.
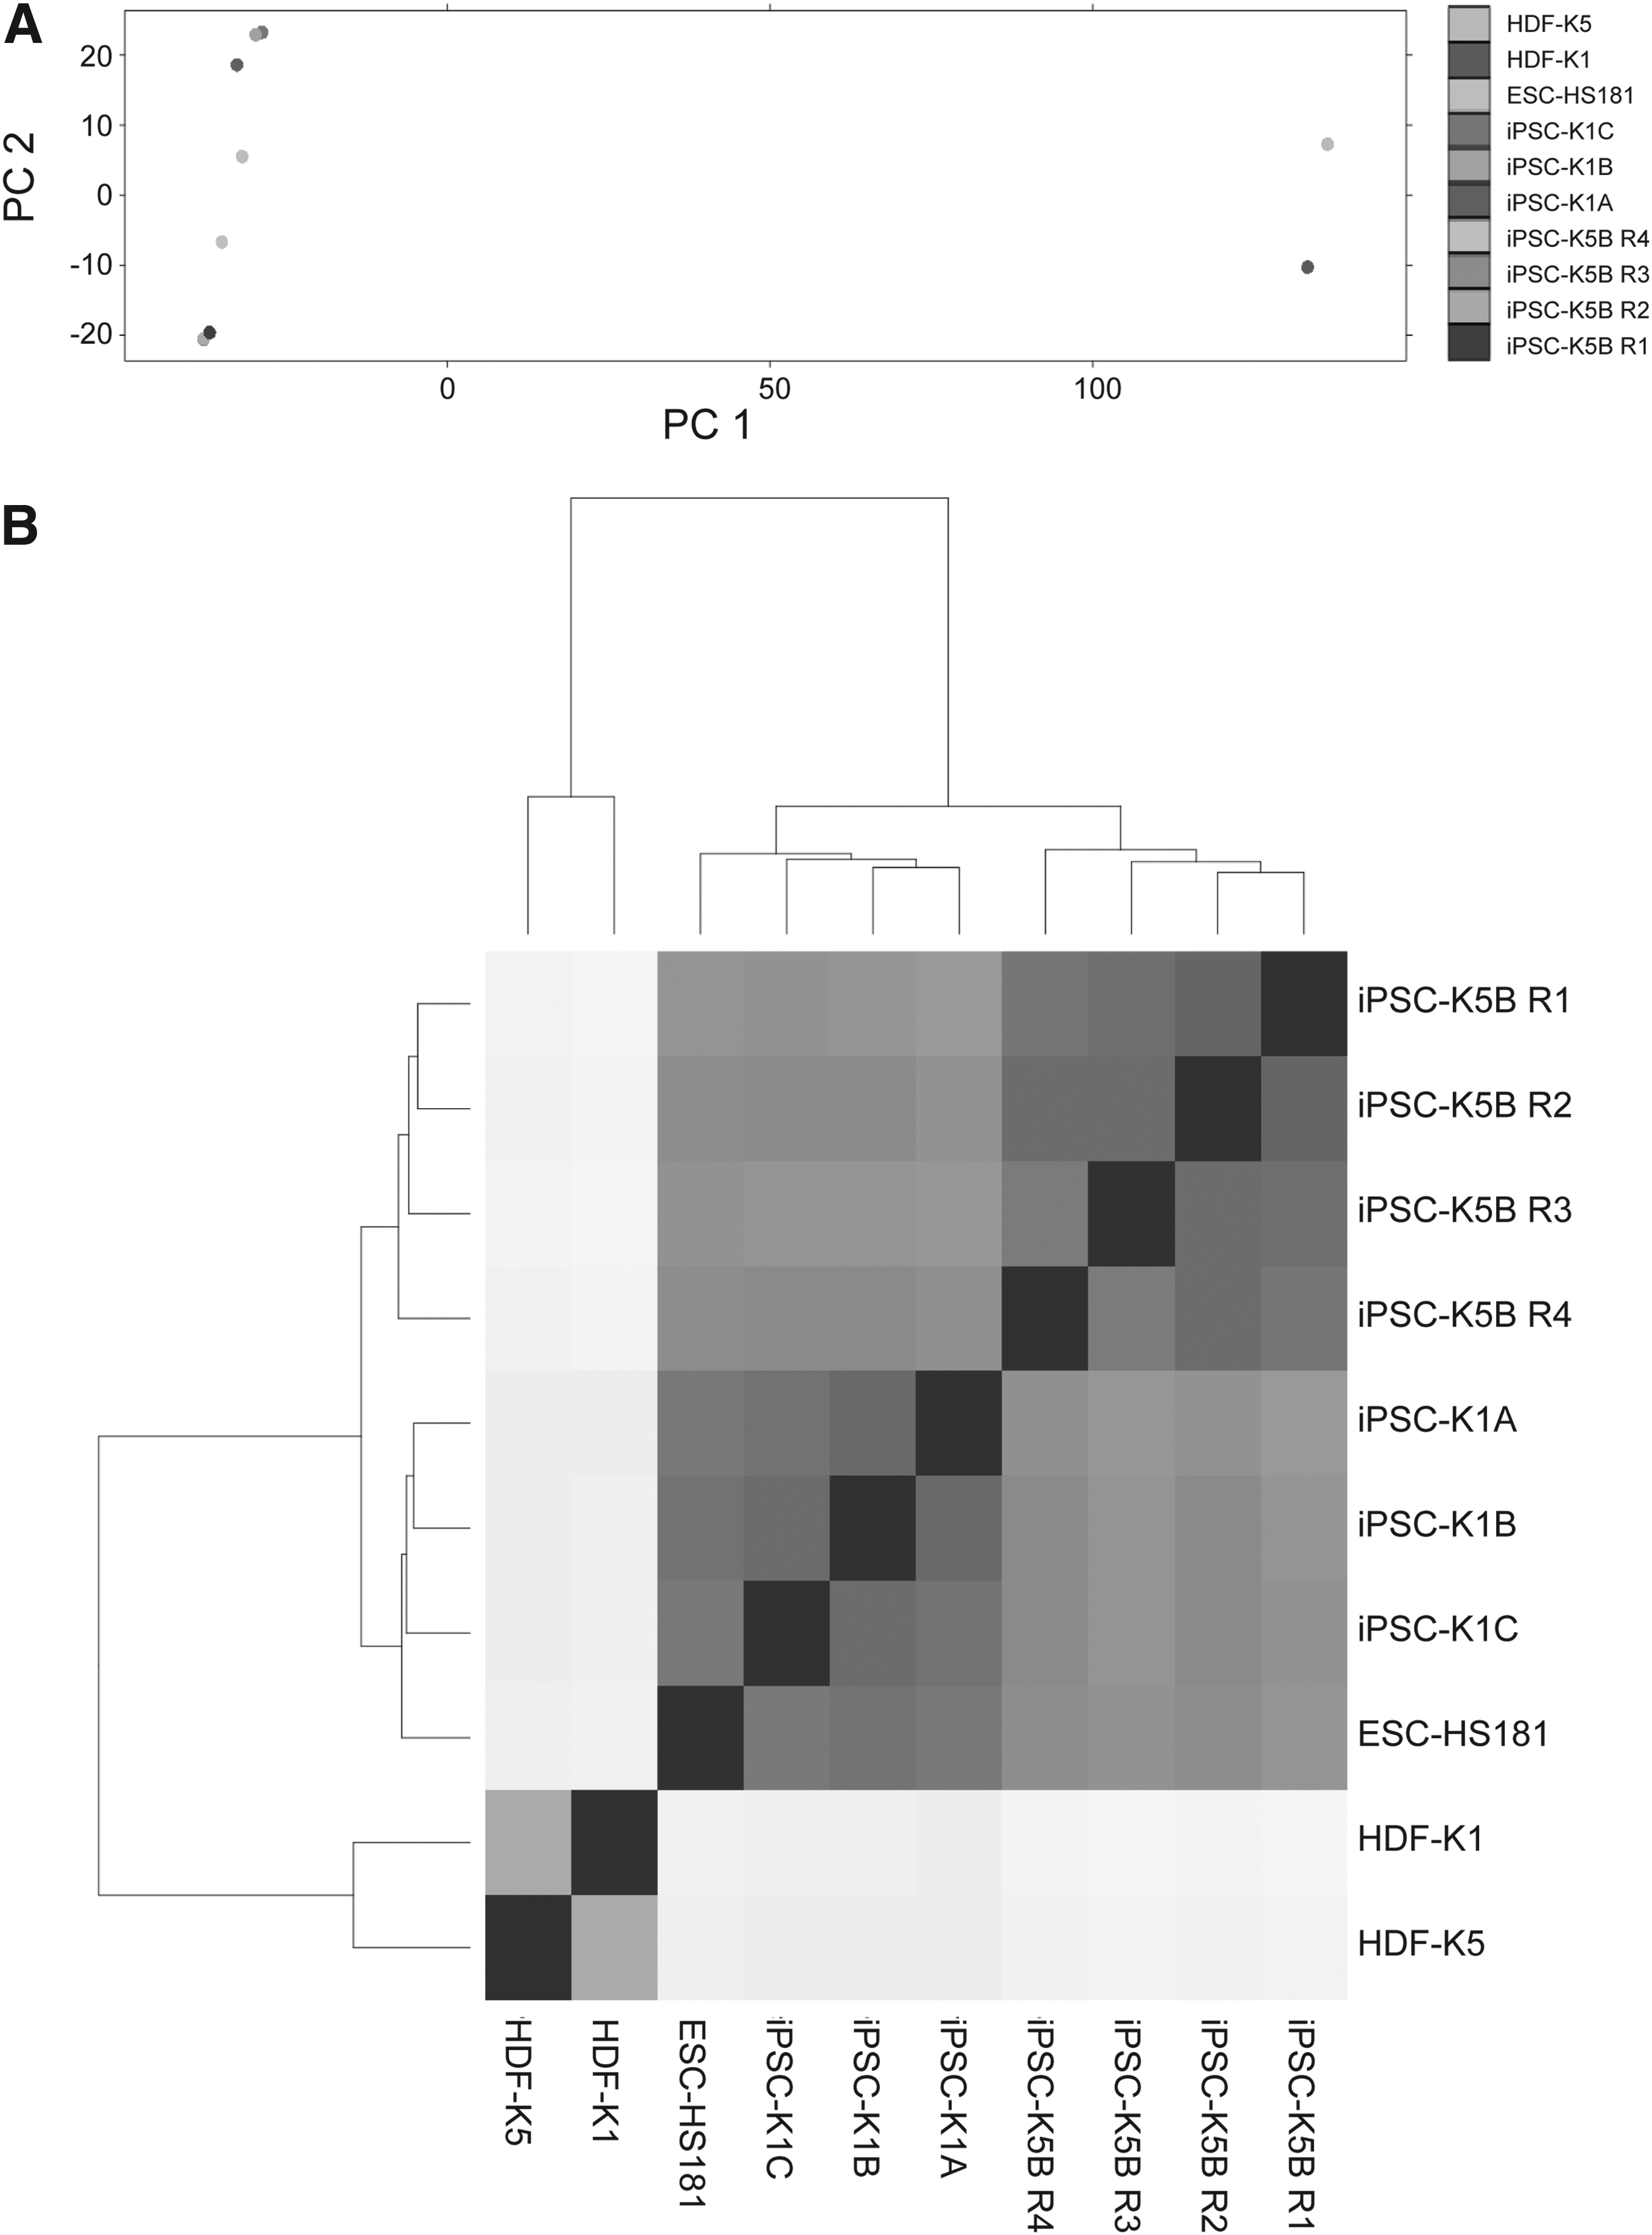
Analysis and comparison of the global gene expression profiles of human iPSC lines, their parental fibroblast lines (HDF), and the hESC line ESC-HS181. (
In addition, and to obtain a more detailed view of the variability between samples, we calculated the Euclidean distance between the different samples. In line with the PCA, the results show that the stem cell lines cluster together with the shortest distance between the three sister lines (iPSC-K1A, B, C) as well as between the technical replicates of iPSC-K5B (Fig. 5B). Again, the fibroblast lines cluster together and distant to the stem cell lines.
Comparative transcriptome analysis
First, we compared transcriptome data between the iPSC-K1 sister lines and their parental fibroblast HDF-K1 line (Table S1; Supplementary Data are available at www.liebertpub.com/cell/), which resulted in 13 differentially expressed Kyoto Encylopedia of Genes and Genomes (KEGG) pathways and 251 significantly differentially expressed GO categories. Similarly, the comparison between iPSC-K5B and its parental line HDF-K5 (Table S2) identified 15 differentially expressed KEGG pathways and 299 differentially expressed GO categories. Importantly, 12 differentially expressed KEGG pathways and 181 GO categories were identified in both analyses (Table S3). The majority of these shared changes in KEGG pathways and GO categories were expected, because reprogramming induces a dramatic switch from somatic cells to pluripotent stem cells. Shared changes were observed for different cellular functions, such as extracellular matrix interaction/adhesion, growth and proliferation (e.g., DNA packaging, replication, ribosomal biogenesis) and several signaling pathways (Table S3). This supports that similar biological changes are induced during reprogramming of the two parental fibroblast lines resulting in comparable and fully pluripotent cell lines (Hansson et al., 2012; Polo et al., 2012).
To identify possible further differences among the three iPSC-K1A, B, and C lines, we compared the expression of genes in KEGG pathways and GO categories in a way so that each iPSC sister line was compared to the two remaining iPSC lines (Table S4). Strikingly, no differentially expressed KEGG pathway or GO categories were identified when comparing data among the three sister clones. We then compared the iPSC-K1A, B, and C lines to the iPSC-K5B replicates and revealed a high number of differentially expressed genes (n > 3000) but no altered KEGG pathway (Table S5). However, the analysis revealed differences in several GO categories associated with gene regulation (Table S6). On the other hand, when comparing the expression of all three iPSC-K1A, B, and C sister lines with the ESC line (Table S7), we identified three significantly differentially expressed KEGG pathways—ribosome biogenesis, RNA transport, and spliceosome pathways. Remarkably, 22 enriched GO categories were found in this comparison, and the majority of these categories are linked to RNA processing (Table S8), implicating an effect on growth. In contrast, the comparison of transcriptome data from the iPSC-K5B line with that of the ESC-HS181 (Table S9) did not show any significantly enriched KEGG pathway or overrepresented GO categories.
The statistical analysis of RNA sequencing data using ANOVA, after excluding stem cell marker transcripts, confirmed that each of the three cell line entities (ESC-HS181, iPSC-K5B, and iPSC-K1A-C) have distinct global expression profiles (p < 0.001). In contrast, ANOVA analysis of transcripts for stem cell markers alone were similar for the three stem cell line entities (p = 0.880), which is consistent with our results from TLDA analysis. In combination, these analyses suggest that the transcriptomes of iPSC lines derived from the two different individuals, i.e., biological replicates, are much more variable than those of the iPSC sister lines.
Proliferation analysis
We then performed a proliferation assay with the iPSC-K1A, B, C and ESC-HS181 lines to assess a possible growth phenotypes associated with the observed differences in KEGG pathways and GO categories. The iPSC lines were 5-ethynyl-2′-deoxyuridine (EdU) labeled and stained for the two core cell-surface markers, SSEA-4 and TRA-1-60, used to distinguish fully reprogrammed iPSCs. We then analyzed the number of cells that were positive for both markers and EdU incorporation (i.e., TRA-1-60+/SSEA-4+/EdU+). Consistent with a generation time of 24 h, over 90% of the ESC-HS181 cells were labeled with EdU (93.7 ± 1.7%). Comparable proportions of the iPSC-K1A, B, and C cells were EdU positive (iPSC-K1A, 92.1 ± 3.9%; iPSC-K1B, 91.4 ± 12.3%; iPSC-K1C, 93.8 ± 12.7). The iPSC-K5B line showed a tendency toward lower EdU incorporation (85.4 ± 3.7%), but this difference was not significant. Taken together, no significant difference in proliferation was detected between the iPSC-K1 sister lines or between any of the other iPSC lines.
Discussion
In this study, we analyzed the transcriptomes of iPSC lines derived from two unrelated donors (K1 and K5), their two parental fibroblast cell lines, and a hESC line (ESC-HS181). From one of the donors (K1), we derived three different iPSC lines (iPSC-K1A, B, and C, i.e., sister clones) and analyzed their transcriptomes. We then compared the transcriptome profiles of the three iPSC sister lines from donor K1, the iPSC line from donor K5, parental fibroblasts, and the ESC line that served as a reference for quality assessment of our iPSC lines. The iPSC lines were generated via lentiviral transduction of the fibroblast lines, and we applied the following criteria to assess whether an iPSC line is fully reprogrammed: (1) ESC morphology, (2) intact genome integrity, (3) expression of marker genes specific for pluripotent and undifferentiated cells at levels comparable to the hESC line (Adewumi et al., 2007), and (4) capability to form EBs with subsequent differentiation into the three germ layers of endoderm, mesoderm and ectoderm. Transcriptome profiling using RNA deep sequencing was used as a highly sensitive method for the detection of subtle differences in iPSC lines. In combination, the methods constitute a stringent approach for the characterization of pluripotent lines. The four iPSC lines were analyzed in depth using these stringent quality criteria after a selection from 15 potentially reprogrammed clones.
Analysis of RNA sequencing data (i.e., transcriptome profiling) from the iPSC lines and their parental fibroblast lines yielded, as expected, a number of differentially expressed pathways associated with each of the two different cell types. Notably, the iPSC lines showed expression of genes that activate the endogenous pluripotency circuitry during reprogramming, consistent with previous observations (Buganim et al., 2012; Muraro et al., 2013; Polo et al., 2012). Further and more detailed analysis of transcriptome data did not reveal any significant differences between the three sister lines when using different algorithms, despite the fact that the lines were cultured separately for more than 20 passages. Interestingly, PCA analysis of the three iPSC-K1 sister lines and the technical iPSC-K5B replicates, respectively, showed that the variation between the transcriptome profiles of the iPSC-K5B replicates appeared to be slightly larger than that of the iPSC-K1 sister lines. This supports the idea that the sister lines are as similar as technical replicates, suggesting that one of the three iPSC-K1 lines may be representative of all three for further studies, e.g., disease modeling.
Importantly, transcriptome analysis revealed that the variability between iPSC lines derived from independent donors was considerable. The two donors were age matched and of different gender, and we initially compared Y and X chromosome–derived transcripts. When comparing the three iPSC-K1A, B, and C lines (male) with technical replicates of iPSC-K5B (female), no significant difference was found in expression of genes located on the sex chromosomes (data not shown). However, when we analyzed the complete transcriptome, the number of differentially expressed genes was considerable. Although this did not reveal any significantly altered KEGG pathway, we identified several altered GO categories, most notably those associated with gene regulation. In contrast, a comparison between the three iPSC-K1A, B, and C sister lines and the ESC-HS181 line showed significant variability in three KEGG pathways associated with growth as well as in 22 GO categories. However, no such variation was detected when comparing iPSC-K5B and ESC-HS181. In conclusion, this suggests that subtle variations in gene expression related to the donor of origin, possibly of functional importance, can be detected using RNA sequencing.
To test for functional significance of our findings from KEGG analysis that suggested a possible growth variation between the three K1 sister lines and the ESC line, we investigated proliferation of the four iPSC lines and the control ESC-HS181 line using EdU incorporation and flow cytometry. However, no significant differences were detected. One explanation could be the discrepancy in sensitivity between RNA deep sequencing and the proliferation assay used. Furthermore, some variability among biological replicates detected by high-resolution RNA deep sequencing may not necessarily be of functional importance or relevant for further in vitro studies.
iPSC-based disease modeling requires cells differentiated to appropriate lineages and, preferably, from a minimum number of iPSC lines. To this end, analysis of differentiated iPSC sister lines should ideally show similar and reproducible results. To clarify this we differentiated the iPSCs to form the three germ layers through EB formation. Analysis of germ layer markers revealed that the proportion of the three germ layers was similar in all five lines after differentiation for 4 weeks. Importantly, and consistent with or RNA sequencing data, the three iPSC-K1 sister line–derived EBs showed the most similar TLDA profiles that were distinct from TLDA profiles of the differentiated iPSC-K5B and ESC-HS181 lines, respectively. This strongly supports that the differences in gene expression after differentiation to the three germ layers reflects the variability detected by RNA sequencing of the five iPSC clones.
There are several potential sources of variability among iPSC lines. First, the genetic background of the donor may cause differences at the iPSC level that could obstruct the identification of disease-associated changes (Hamada et al., 2012). Furthermore, somatic changes in the tissue of origin need to be considered either because of tissue mosaicism in the donor or because of acquired alterations during tissue culture (Abyzov et al., 2012). Second, the parental tissue of origin may influence the epigenetic landscape after reprogramming (Vaskova et al., 2013). Third, the reprogramming process itself involves a number of stochastic events, and only a small fraction of cells reaches a fully pluripotent stage (Bock et al., 2011; Sommer et al., 2013). Thus, a number of intermediate cell stages will appear during reprogramming, and cells may get trapped somewhere along the trajectory toward pluripotency (Bock et al., 2011; Boue et al., 2010; Polo et al., 2012). Consequently, the criteria as well as the methods used to define and demonstrate pluripotency must be considered carefully (Smith et al., 2009).
Variability among iPSC lines derived from different individuals has been investigated in a few previous studies using different techniques. With the use of microarray-based expression analysis and flow cytometry (Mills et al., 2013; Vitale et al., 2012), it was demonstrated that the donor-related variability is generally larger than that of iPSC sister lines. However, these studies observed a higher variability among sister lines than that observed in our study possibly due to the different methods used for transcriptome analysis. On the other hand, studies have used iPSC sister lines for functional analysis with consistent results. For example, Miller and coworkers repeated the analysis of their age-related phenotype seen in an iPSC-based model of progeria with three iPSC sister lines and showed very good reproducibility (Miller et al., 2013). Similar findings are reported on iPSC sister lines when modeling Alzheimer's disease (Kondo et al., 2013), SOD1-positive amyotrophic lateral sclerosis (ALS) (Chen et al., 2014), and Down's syndrome (Mou et al., 2012). In addition, these reports show that the functional variability between cells derived from iPSC sister lines is much smaller when compared to iPSC-derived cells from different, disease-matched individuals (Chen et al., 2014; Kondo et al., 2013; Miller et al., 2013; Mou et al., 2012).
Our results show that stringently selected iPSC lines from different donors and ESCs share strong and cell stage similarities from the analysis of their transcriptome, proliferation, and germ layer formation. Nonetheless, our RNA deep sequencing data indicate that a clear distinction can be made between lines from different donors and that these differences remain after differentiation to germ layers. In disease modeling, such normal variability is important to assess and to distinguish from disease-associated changes. Using RNA sequence analysis, this variability within biological replicates is referred to as transcriptomal space (Prilutsky et al., 2014). We further show that carefully selected iPSC lines from a single donor are almost indistinguishable using transcriptome sequencing and that similarity is retained after differentiation to germ layers. Furthermore, we confirmed the importance of using biological replicates, i.e., iPSC from different donors, rather than several sister lines from few donors.
Conclusions
Our study shows that iPSC lines derived from a parental fibroblast line are virtually identical with respect to transcriptomes, growth, and capability of germ layer formation. In addition, the sister clones show transcriptome profiles that are clearly distinct from iPSC lines of different parental origin. We further show that RNA sequencing may be used as a sensitive tool for quality assessment of pluripotency in addition to the identification of variation between iPSC lines. This study has important implications for iPSC-based disease modeling, as recent studies have reported on variability among iPSC clones derived from the same parental cell line. This has prompted researchers to include several iPSC sister clones with a considerable extra workload to avoid effects of outliers. Still, our study stresses that the iPSC lines must undergo stringent quality assessment according to established criteria (Boue et al., 2010; Cao et al., 2012; Smith et al., 2009; Vitale et al., 2012) for the identification of fully pluripotent iPSC lines and further studies.
Footnotes
Acknowledgments
We thank the donors of fibroblast biopsies, Prof. O. Hovatta for the pEF1alpha-StemCCA plasmid and for ESC-HS181, and F. Hikmet Noraddin for expert technical assistance. The research leading to these results has received funding from the Swedish Research Council (K2013-66X-10829-20-3 and 621-2009-4629), the European Research Council ERC Starting grant 282330 (to L.F.), AstraZeneca, Science for Life Laboratory, Uppsala University, and the Borgström Foundation (to J.S.). The SOLiD next-generation sequencing service was provided by the Science for Life Laboratory, Genome Center, Uppsala. Imaging and Flow Cytometry were performed by the Science for Life Laboratory BioVis Platform, Uppsala. The computations were performed on resources provided by SNIC through Uppsala Multidisciplinary Center for Advanced Computational Science (UPPMAX) under Project b2013214.
Author Disclosure Statement
The authors declare that no conflicting financial interests exist.
References
Supplementary Material
Please find the following supplemental material available below.
For Open Access articles published under a Creative Commons License, all supplemental material carries the same license as the article it is associated with.
For non-Open Access articles published, all supplemental material carries a non-exclusive license, and permission requests for re-use of supplemental material or any part of supplemental material shall be sent directly to the copyright owner as specified in the copyright notice associated with the article.