
Abstract
Abstract
Alcohol is an important compound used in food, agriculture, and medicine. In this study, we investigated the effect of alcohol on oocyte quality in mice by exposing animals for different duration times during an estrous cycle. Cumulus-oocyte complexes were collected from mice after pregnant mare serum gonadotropin- and human chorionic gonadotropin-induced superovulation. Ovulation number, E2 level in serum, and parthenogenetic embryo development in vitro were evaluated. Mitochondrial gene expression, mitochondrial membrane potential, and reactive oxygen species (ROS) levels in the cumulus were also assessed. The results showed that acute exposure to alcohol did not affect ovulation time (p > 0.05). Blasocyst formation rate in vitro was significantly improved after 1 and 2 days of alcohol exposure (p < 0.01). Mitochondrial membrane potential was significantly increased after 1–4 days of alcohol exposure (p < 0.05), but it decreased after 5 days (p < 0.05). ROS levels remained relatively low after 2, 3, and 4 days of exposure (p < 0.05), and they significantly increased after 6 days (p < 0.05). In addition, alcohol altered the expression of mitochondrial and nuclear genes in the cumulus. Taken together, our data suggest that acute exposure to alcohol affects oocyte quality by influencing the function and gene expression in the cumulus. These results underscore potential implications for the development of human reproductive therapeutics.
Introduction
A
Chronic consumption of alcohol can damage neurons of the hypothalamus, which can also adversely impact pituitary and gonad functions (Zimatkin and Phedina, 2015). Alcohol diminishes the release of gonadotropin-releasing hormone by blocking transforming growth factor β (Srivastava et al., 2014). Consequently, a dysfunctional hypothalamus can disrupt the normal functioning of the pituitary and ovaries (Wieczorek et al., 2015). The reports cited earlier suggest that alcohol can disrupt gonad function through complex mechanisms. Since alcohol consumption can directly impact several organs of an individual, its adverse effect on the parental reproductive system could cause abnormal development of the embryo after fertilization.
Moreover, paternal alcohol consumption may alter the expression of genes that could be transferred to the offspring. It has been shown that maternal alcohol consumption can cause abnormal gene expression and histone acetylation in the embryo during gestation (Pan et al., 2014; Zhang et al., 2014). In addition, studies suggest that abnormal development of an embryo could be caused by alcohol consumption during gestation and gametogenesis in mice (Ding et al., 2015). The cumulus directly contacts the oocyte through gap junctions, and, therefore, the state of the cumulus may reflect oocyte quality (Sun et al., 2015). In this study, the effects of acute alcohol consumption over a relatively short period (one estrous cycle) on oocyte quality and cumulus gene expression were investigated in mice.
Materials and Methods
Animals
This study was approved by the Northwestern University Research Ethics Committee in China. ICR mice (4 weeks old) were purchased from the Laboratory Animal Center at Xi'an Jiaotong University in China. Mice were raised under standard conditions (light/dark cycle: 12 h/12 h) and provided with food and water ad libitum for at least 7 days before the study. All handling procedures were carried out according to the guidelines of the Experimental Animal Holding Unit of FMMU (2006731019). Mice were anesthetized by using 0.5% sodium pentobarbital and humanely euthanized by cervical dislocation. All regents were purchased from Sigma, unless otherwise stated.
Mice grouping and alcohol exposure
Mice were randomly divided into 6 groups (5 mice/group), and alcohol was intraperitoneally injected into mice according to a previously reported method (Rifas et al., 1997). Group 1 mice were injected with 25% alcohol (v/v) in phosphate-buffered saline (PBS) for 1 day at a dosage volume of 15 μL/g body weight. Groups 2, 3, 4, 5, and 6 were injected with alcohol for 2, 3, 4, 5, or 6 days, respectively (Fig. 1). For each group, control mice were injected with PBS according to the regimen for alcohol injections.
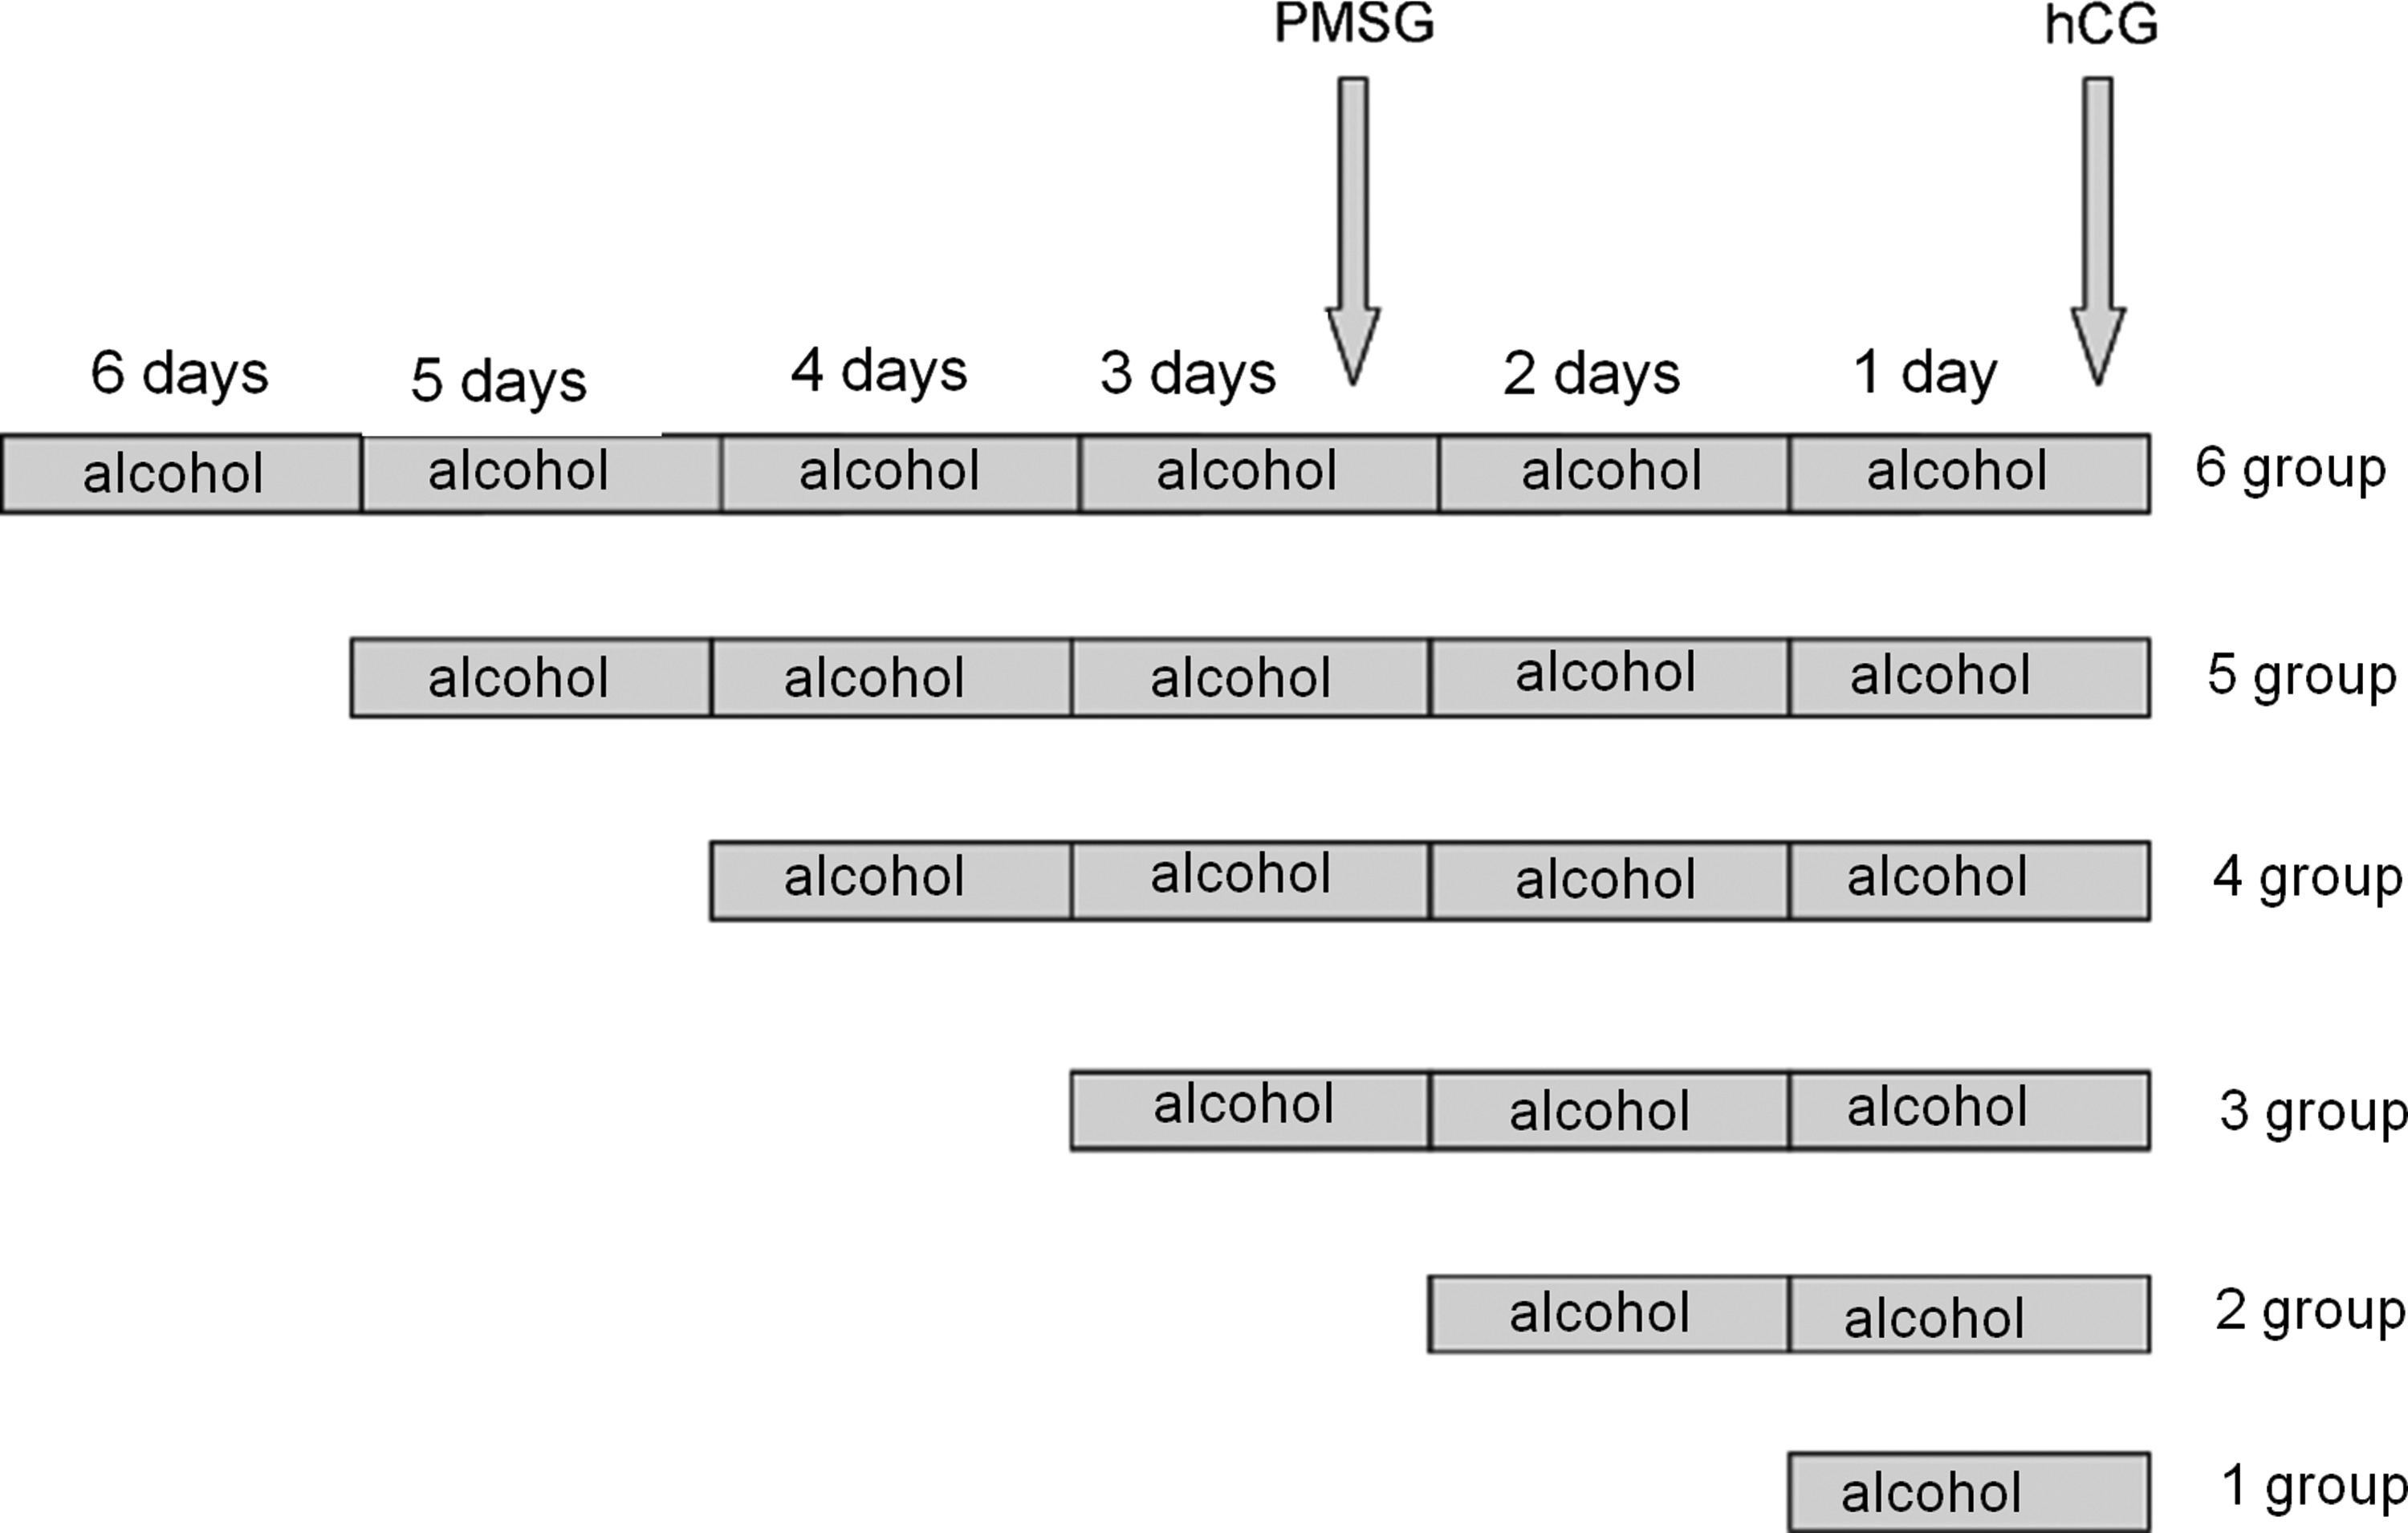
Method of alcohol exposure in mice. The mice were divided into 6 groups for receiving alcohol exposure, and the corresponding groups were injected with alcohol from 1 to 6 days, accordingly. Superovulation was induced by PMSG and hCG injection at intervals of 48 hours in the alcohol-treated and control groups. hCG, human chorionic gonadotropin; PMSG, pregnant mare serum gonadotropin.
Identification of estrous cycle, alcohol consumption, and change in estrous cycle
Detection of the estrous cycle in mice was performed according to a previous report (Byers et al., 2012). Morphological changes in vulvae and vaginal smears were used to identify the estrous cycle stages (diestrus, estrus, proestrus, and metestrus). During the estrous cycle, the estrus stage is easily identified. The estrus stage was an important point in the estrous cycle for subsequent experiments. One estrous cycle was defined as the time needed for two continuous estrus stage Mice in the estrus stage were randomly divided into 2 groups (5 mice/group; control and alcohol-treated groups). For the alcohol-treated groups, mice were injected with 15 μL alcohol per gram body weight by using 25% ethanol diluted in PBS. In the control group, 15 μL/g PBS was injected in mice. The vulvae and vaginal smears were observed visually under a light microscope.
Determining oocyte ovulation time in mice during alcohol exposure
To determine whether alcohol influences ovulation time, mice were injected intraperitoneally for 3 days according to the method used for group 3, and the control group was injected with PBS. The mice were superovulated by injecting pregnant mare serum gonadotropin and human chorionic gonadotropin (hCG) at 48 hour intervals in the alcohol-treated and control groups, and then sacrificed by cervical dislocation after an hCG injection at 9, 10, 11, 12, 13, 14, or 15 hours, respectively. Ovulated cumulus-oocyte complexes (COCs) were recovered by tearing the oviduct (Yan et al., 2013). Oocytes and the cumulus were isolated by treatment with hyaluronidase (300 IU/mL), after which the oocytes were rinsed in M2 medium and the cumulus was washed three times in PBS to remove hyaluronidase. The numbers of total and viable oocytes were counted and recorded.
Artificial activation and culture of oocytes
Artificial activation of oocyte was performed by treatment with cytochalasin B and Srcl2+ for 6 hours (Yan et al., 2010). The activated oocytes were then washed three times and incubated in Chatot-Ziomek-Bavister (CZB) medium. The rate of embryo cleavage and the numbers of morulae and blastocysts were recorded by using a stereomicroscope after 24 and 108 hours, respectively.
Detection of E2 levels in serum
Blood was collected from the heart when COCs were collected from the mice. The serum was separated from the blood cells and preserved at −20°C for further use. The E2 levels were detected by using an Estradiol ELISA Kit (Joyee Biotechnics, Shanghai, China) according to the manufacturer's instructions on a microplate reader (Infinite F50; Tecan, Switzerland).
Total RNA extraction, reverse transcription PCR, and quantitative PCR (qPCR)
The extraction of total RNA was performed according to a previously reported method (Yan et al., 2013). Briefly, the cumulus dispersed from COCs by hyaluronidase was lysed with TRIzol Reagent (15596-026; Invitrogen, USA) at 0°C. Chloroform was added to the lysis solution at a ratio of 5:1, vortexed for 15 seconds, incubated for 10 minutes, and finally centrifuged at 10,000 g per minute for 10 minutes. The supernatant was collected; isopropanol was added at a volume equal to the TRIzol Reagent, vortexed for 3 seconds, and finally centrifuged at 10,000 g per minute for 10 minutes. The supernatant was discarded, and the pellet was rinsed and washed in 75% ethanol to remove isopropanol. DNA contamination in the total RNA was identified by glyceraldehyde-3-phosphate dehydrogenase amplification by using polymerase chain reaction (PCR).
Reverse transcription PCR (RT-PCR) of the DNA-free total RNA was performed by using a RT-PCR Kit (DRR037S; TaKaRa, Tokyo, Japan) according to the manufacturer's instructions. For quantitative PCR (qPCR), the expression level of the β-actin gene was used as a standard to normalize the quantification of other genes. Oligodeoxynucleotide primers were designed and synthesized based on highly conserved sequences (Table 1). All components were added to the reaction system (total volume 10 μL), and qPCR was carried out by using the SYBR Premix Ex TAqTMII Kit (DRR820A; TaKaRa) according to the manufacturer's instructions. The reaction conditions were as follows: 40 cycles of denaturation at 94°C for 1 second, annealing at 59°C for 10 seconds, and extension at 72°C for 10 seconds. The melting curve was analyzed to assess the primer specificity after PCR amplification. PCR data analysis was within the log-linear phase of the amplification curve obtained for each primer according to the comparative threshold cycle method. Results were obtained from three independent experiments.
Detection of mitochondrial membrane potential by Jc-1
COCs from alcohol-treated and control groups were exposed to Jc-1 solution (Cotterill et al., 2013). Briefly, both sets of COCs were treated with Jc-1 (1 μg/mL) for 30 minutes at 37°C and washed in M2 medium. The samples were measured at 488 nm (for green fluorescence) and 590 nm (red fluorescence) by using a confocal laser-scanning microscope (Olympus FV1000, Japan). The ratio of orange and green fluorescence was analyzed by Image-Pro Plus 6.0 (Ipp).
Detection of reactive oxygen species in the cumulus
Reactive oxygen species (ROS) was detected in the cumulus by using a previously reported method (Friques et al., 2015). Briefly, 2′,7′-dichlorofluorescin diacetate (DCFH-DA) was diluted in M2 medium (10 μM) and COCs were incubated in the medium at 37°C for 30 minutes. COCs were then washed three times and stained with Hoechst 33342 (5 μg/mL) for 10 minutes, which was used as a reference. The samples were measured at 488 nm (green fluorescence) and 405 nm (blue fluorescence) by using a confocal laser-scanning microscope (Olympus FV1000). The optical density was measured by using Ipp software. The optical density for the control group was set at 100%, and the relative optical density was obtained by comparing the treated groups with the control group.
Statistical analysis
All experiments were independently repeated three times. Data were presented as the mean ± standard deviation. Statistical analysis was conducted by using t-tests in SPSS 13.0 software. Statistical significance is indicated as *p < 0.05 and **p < 0.01 compared with the control.
Results
Alcohol does not influence the estrous cycle and ovulation time of mice
Mice in estrus stage were selected and injected with alcohol. Mice in the control and alcohol-treated groups exhibited similar changes in the estrus stage. The vulvae were observed to be pale with some clear mucus, pale red with clear mucus, deep red with thick mucus, during diestrus, proestrus, and estrus stages, respectively. The vaginal smears showed leukocytes with few epithelial cells, leukocytes and epithelial cells with nuclei, epithelial cells without nuclei, and large numbers of leukocytes during diestrus, proestrus, and estrus stages, respectively (Fig. 2). The estrous cycles in both groups lasted for 5 days, which corresponded to the time required for two continuous estrus stages.
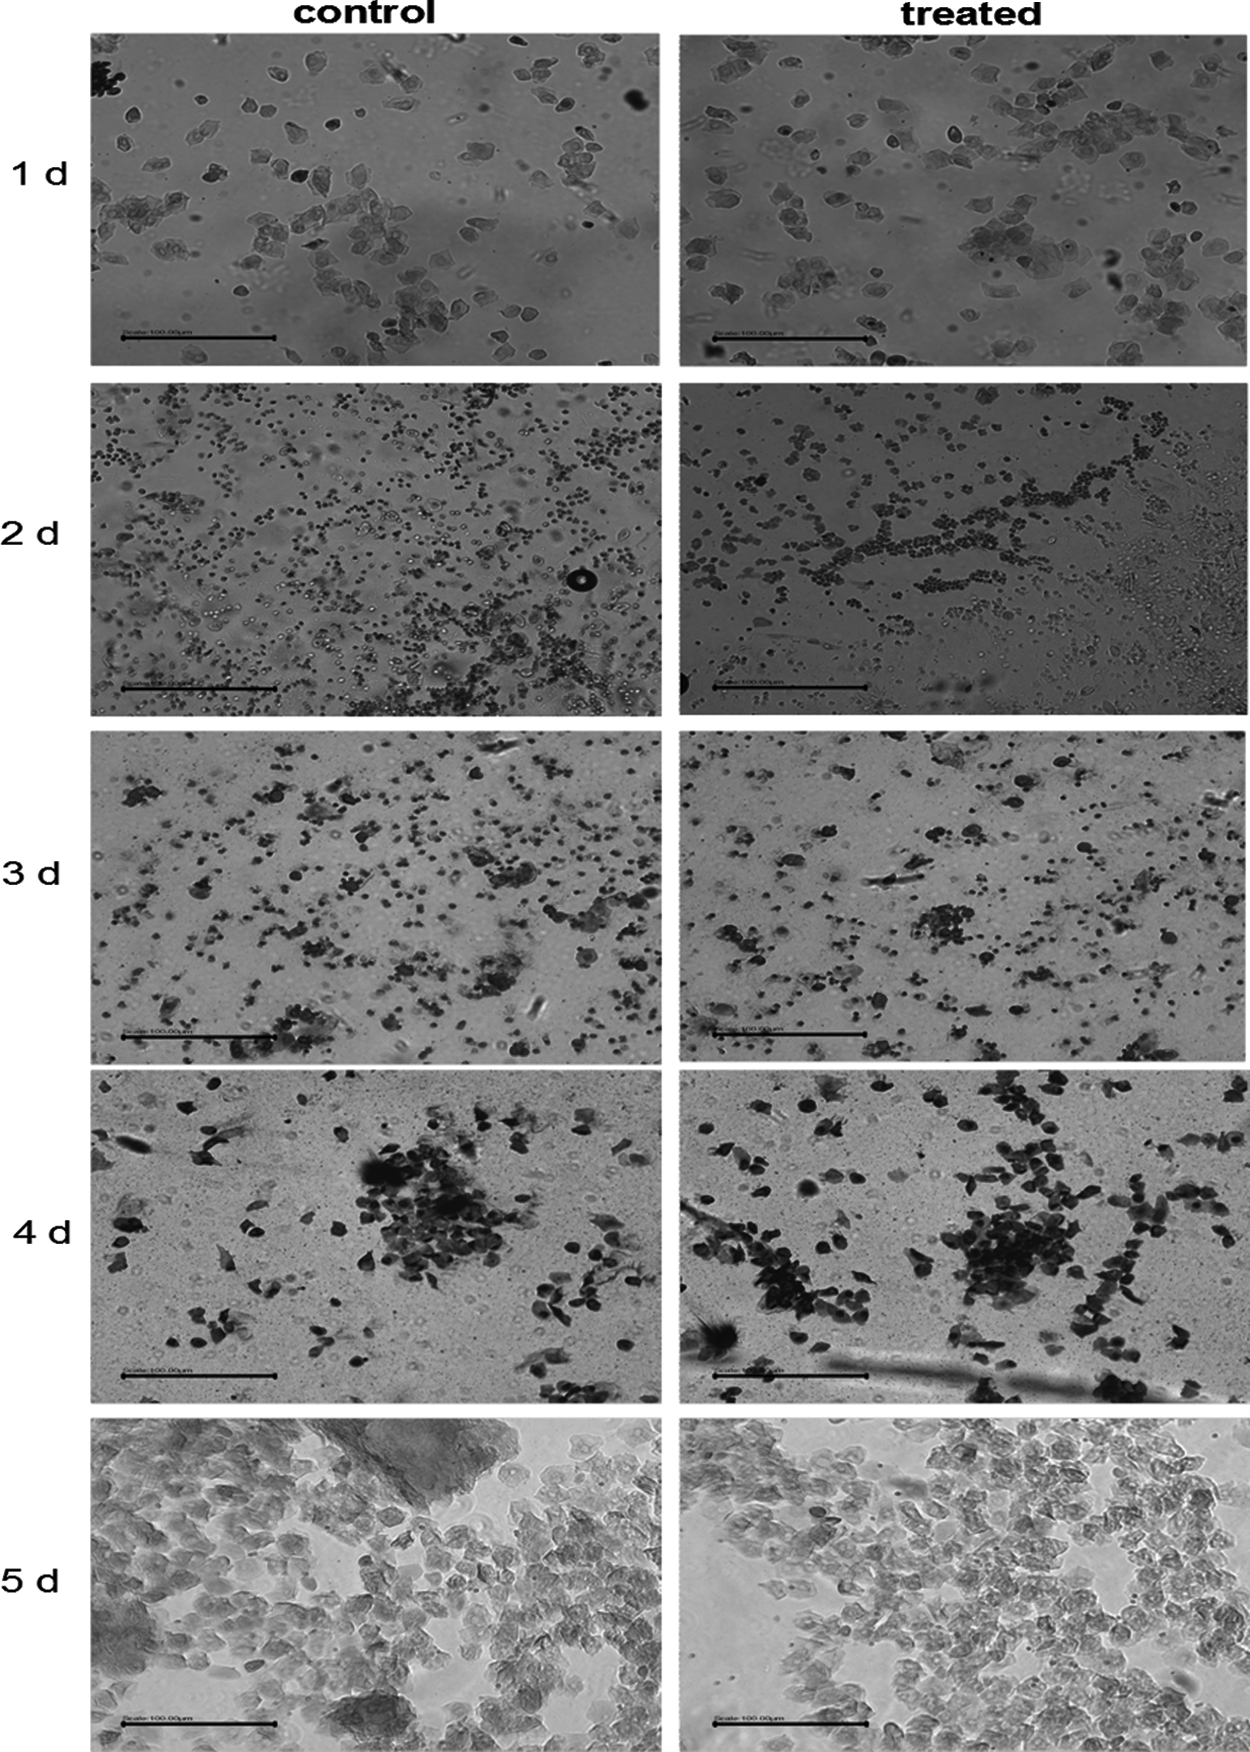
Estrus cycle with/without alcohol. Mice in estrus stage were injected with alcohol (alcohol-treated group) or phosphate-buffered saline (control group). The vaginal smears were prepared daily for 5 days. It was estrus stage (1 and 5 days), diestrus (1 and 2 days), and proestrus (4 days) (bar: 100 μm).
Alcohol does not influence the ovulation time in mice
Ovulation is an important step after maturation of the follicles. We found that alcohol did not affect ovulation time in either the control or alcohol-treated groups. Mice were found to predominantly ovulate at 11, 12, and 13 hours after the hCG injection in both groups (Fig. 3A). However, the number of released oocytes was higher at 12 hours in the treatment group than in the control group (p < 0.05) (Fig. 3B). Collectively, these results indicate that ovulation mainly occurred between 10 and 13 hours after the hCG injection in both groups.
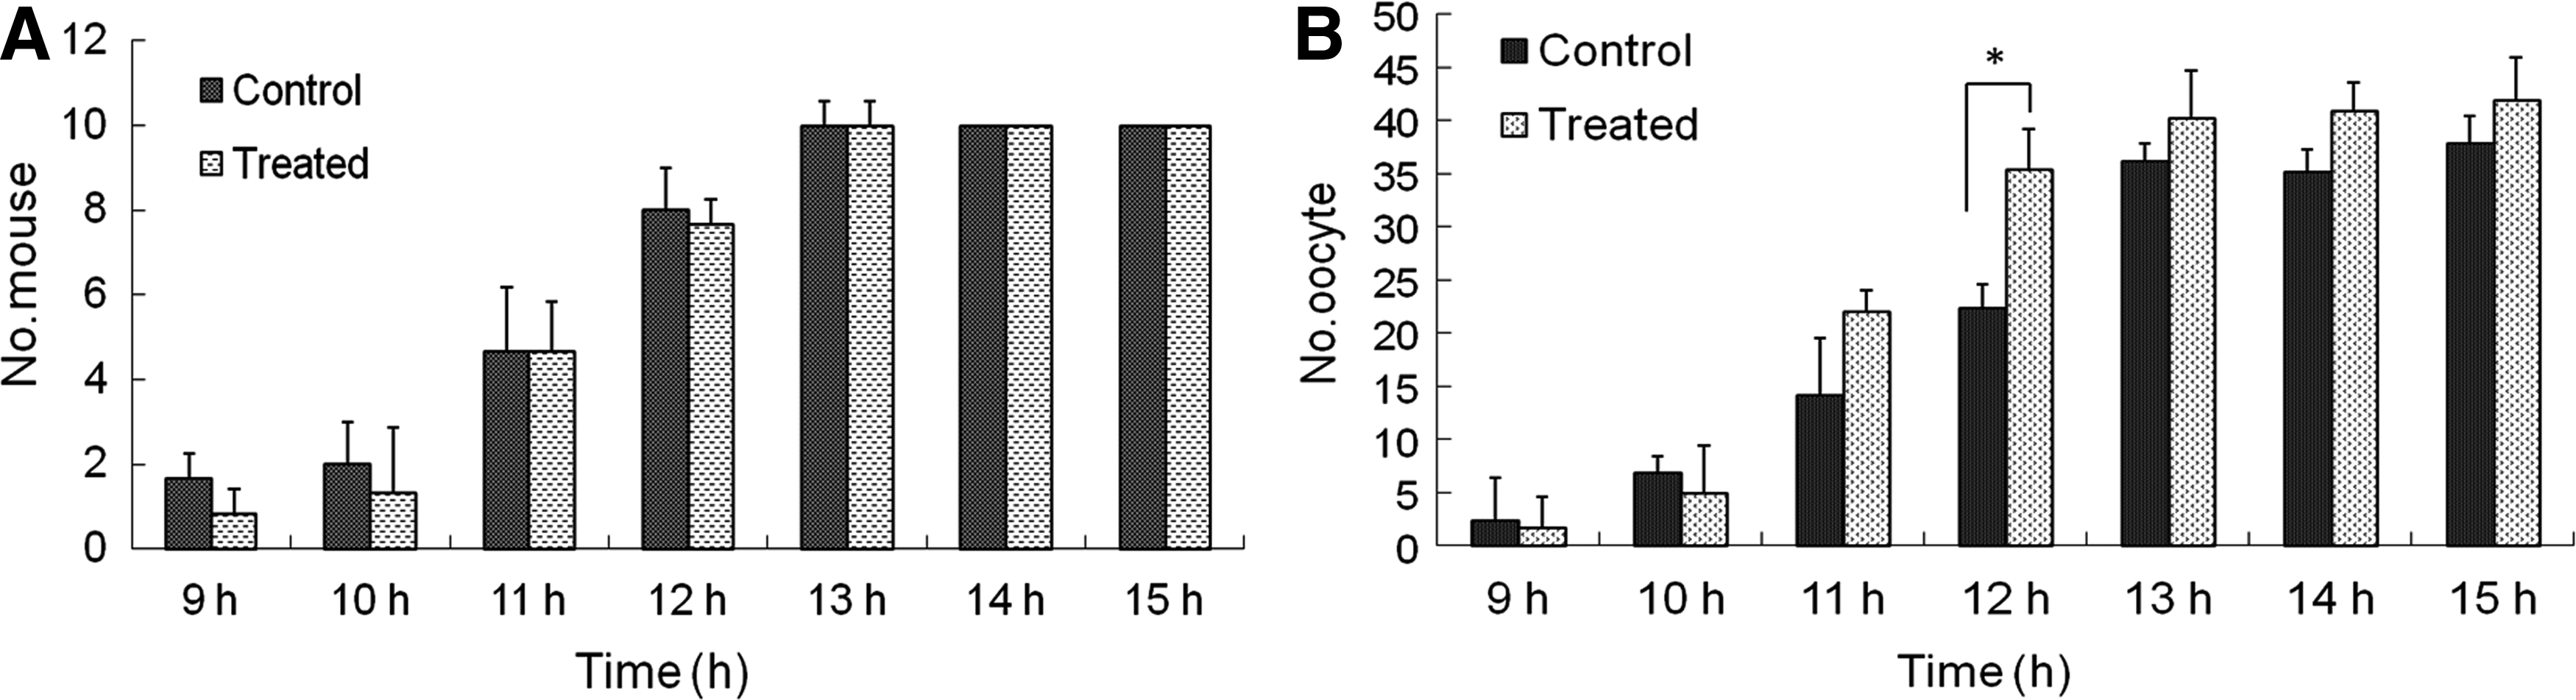
Ovulation and number of oocytes for mice treated with/without alcohol. The number of ovulated mice was recorded at 9, 10, 11, 12, 13, 14, and 15 hours after hCG injection in the control and alcohol-treated groups
Alcohol influences the number of released oocytes
The average number of oocytes released was significantly higher at the 3 time point than in the control group (p < 0.05) (Fig. 4A). In contrast, the number of released oocytes was significantly lower at the 4 and 5 time points compared with the control group (p < 0.05) (Fig. 4A) Moreover, the 4-day treatment group exhibited a significantly lower average number of viable oocytes compared with the control group (p < 0.05) (Fig 4B). During artificial activation, the number of non-viable oocytes was significantly higher at the 3 time point than in the control group (p < 0.05) (Fig. 4C).
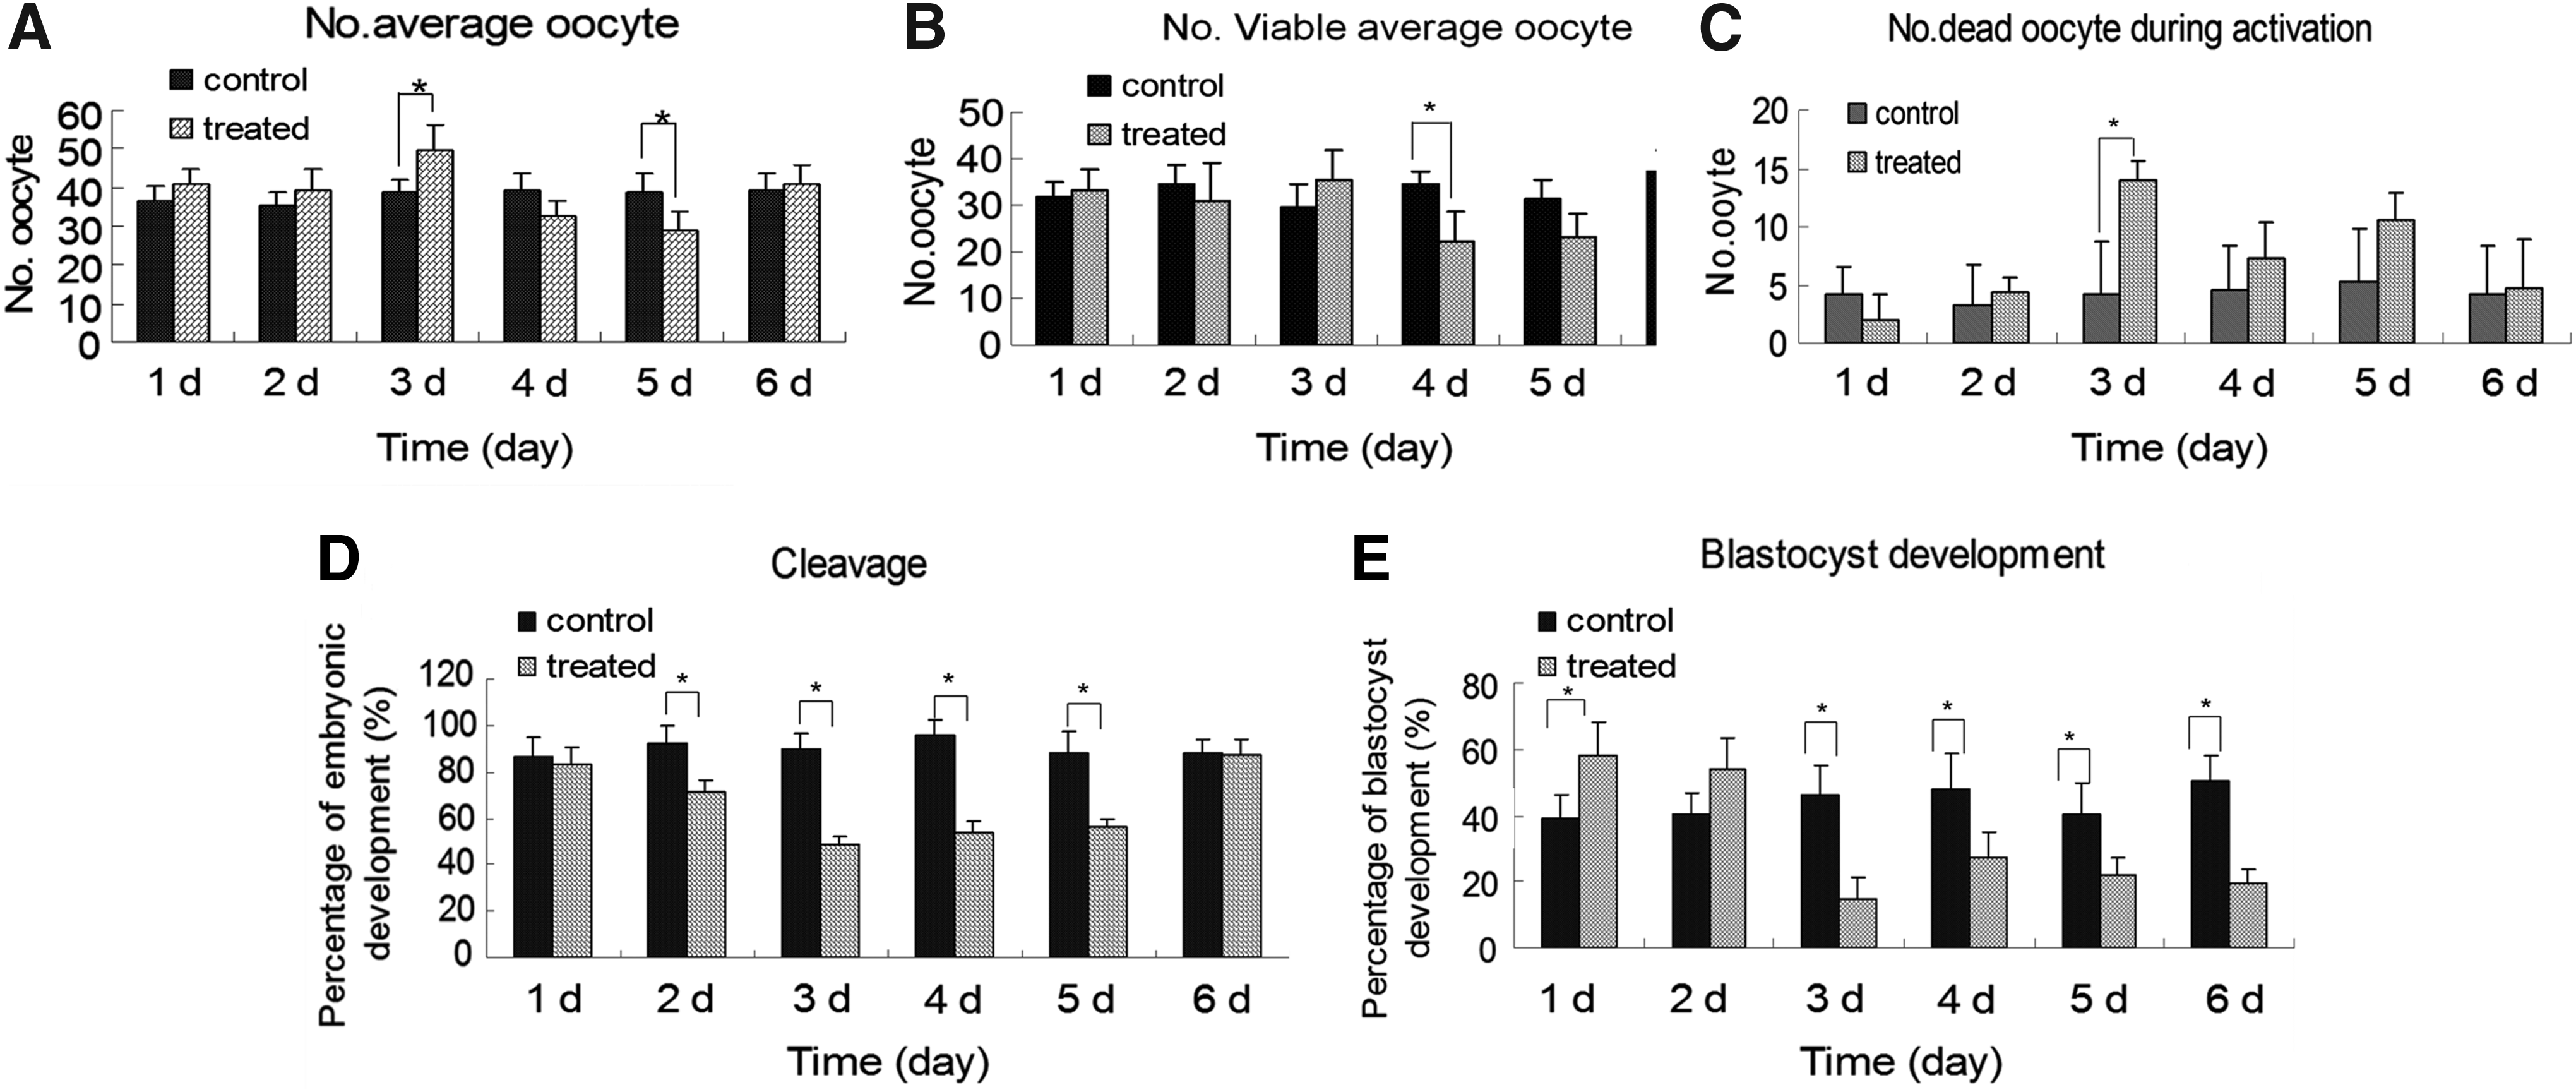
Ovulated oocyte and embryo development in vitro in mice treated with or without alcohol. The numbers of total oocytes
Alcohol improves oocyte competence after short exposure times
The cleavage of oocytes gradually decreased in mice treated with alcohol from days 1 through 5 compared with the respectively control mice. Cleavage was particularly lower in mice treated with alcohol for 2, 3, 4, and 5 (p < 0.05) (Fig. 4D). However, there was no significant difference in cleaved oocytes between control mice and mice treated with alcohol for 6 days (p < 0.05) (Fig. 4D).
Based on the cleavage of oocytes, the blastocyst rate was significantly higher in mice treated with 1 or 2 days (p < 0.05). However, it was significantly lower in the mice treated with alcohol for 3 to 6 days compared with the control groups (p < 0.05) (Fig. 4E).
E2 level in the serum
E2 is mainly synthesized by p450arom activity in the cumulus (Kato et al., 2013). There were no significant differences in serum E2 levels between the control and the alcohol-treated groups. However, E2 levels in serum were significantly higher in mice treated with alcohol for 5 days compared with the control group (p < 0.01) (Fig. 5). These results demonstrate that alcohol can increase serum E2 levels in mice.
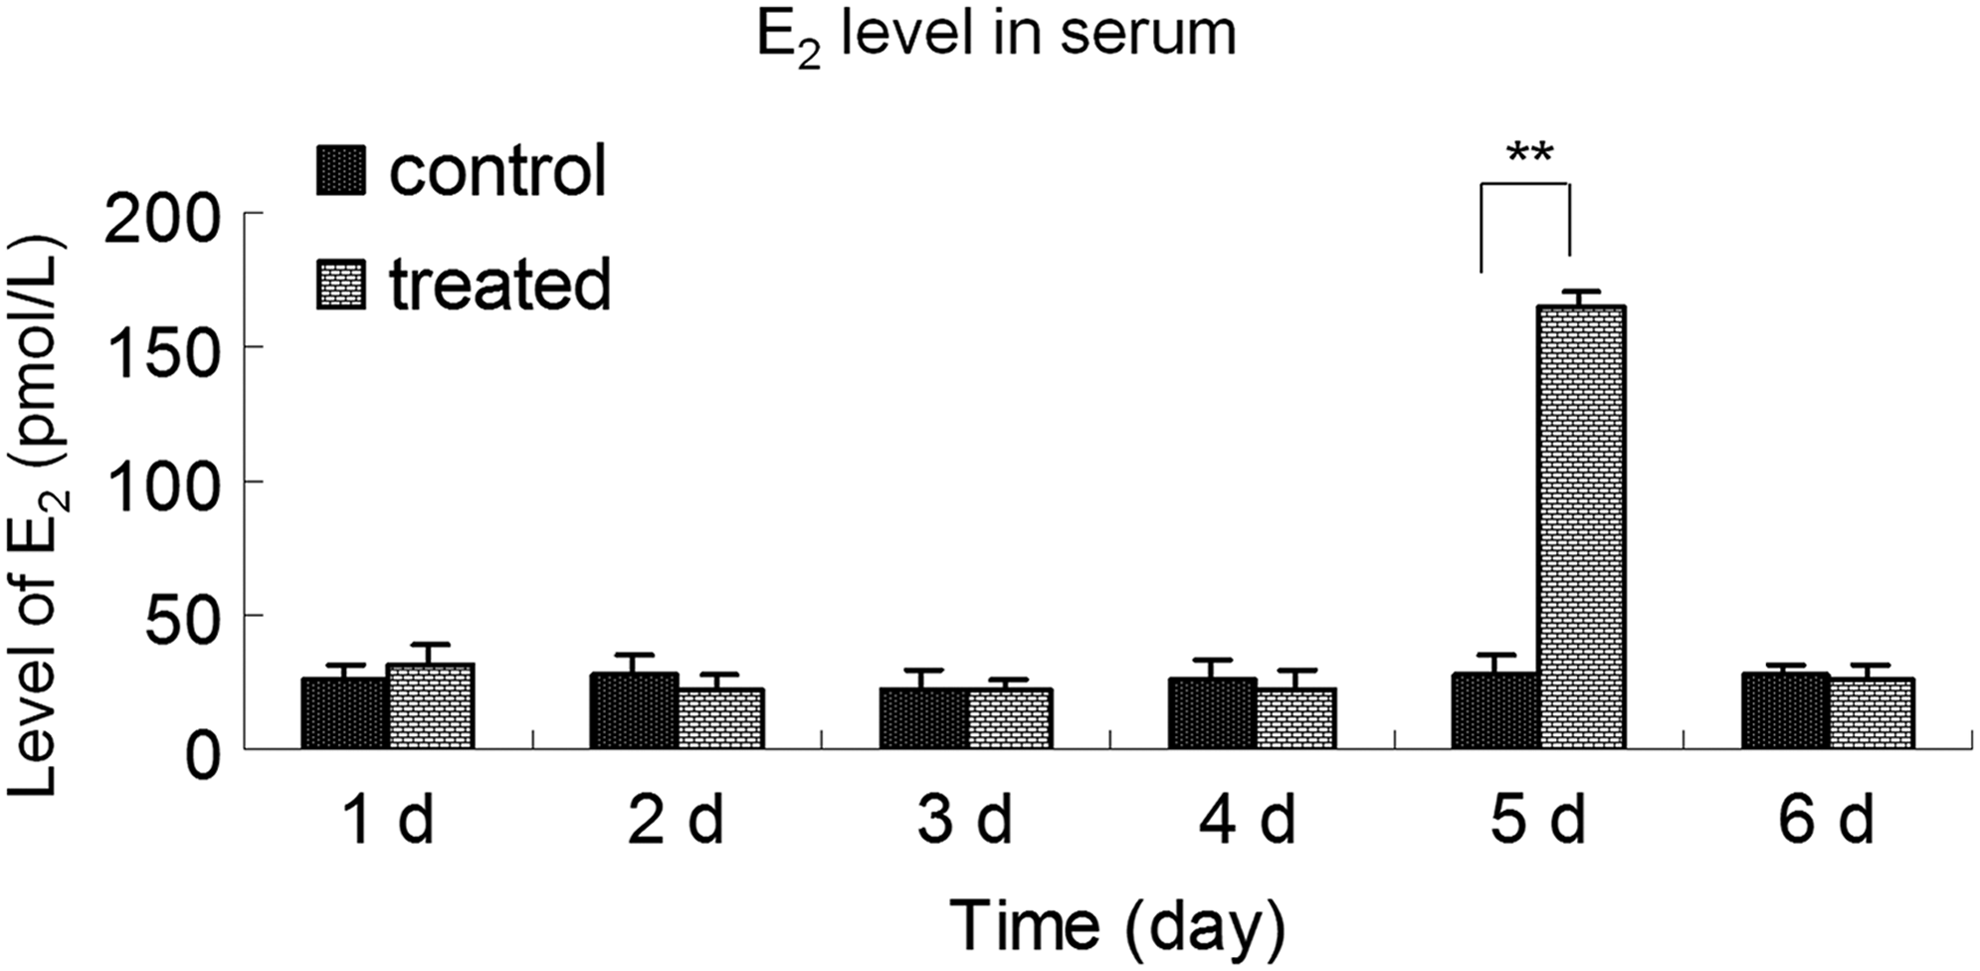
E2 level in serum from control and alcohol-treated groups. The levels of E2 in the serum of mice injected with alcohol from 1 to 6 days are shown. The data shown represent three independent experiments (mean ± SD; **p < 0.01).
Expression levels of genes in the cumulus
The expression levels of BAX and BCL2 were detected by qPCR, as shown in Figure 6A. The expression levels of BAX and BCL2 remained relatively low during the 6 days of alcohol treatment, except for day 2 of treatment (p < 0.05) (Fig. 6A). The expression levels of BAX in alcohol-treated groups 2 and 6 were higher than controls (p < 0.01) (Fig. 6B). There was no significant difference in expression levels of BCL2 and BAX in mice treated with alcohol for 2 days (p < 0.05), and the expression of BCL2 was significantly lower than that of BAX in mice treated with alcohol for 6 days (p < 0.05) (Fig. 6A, B).
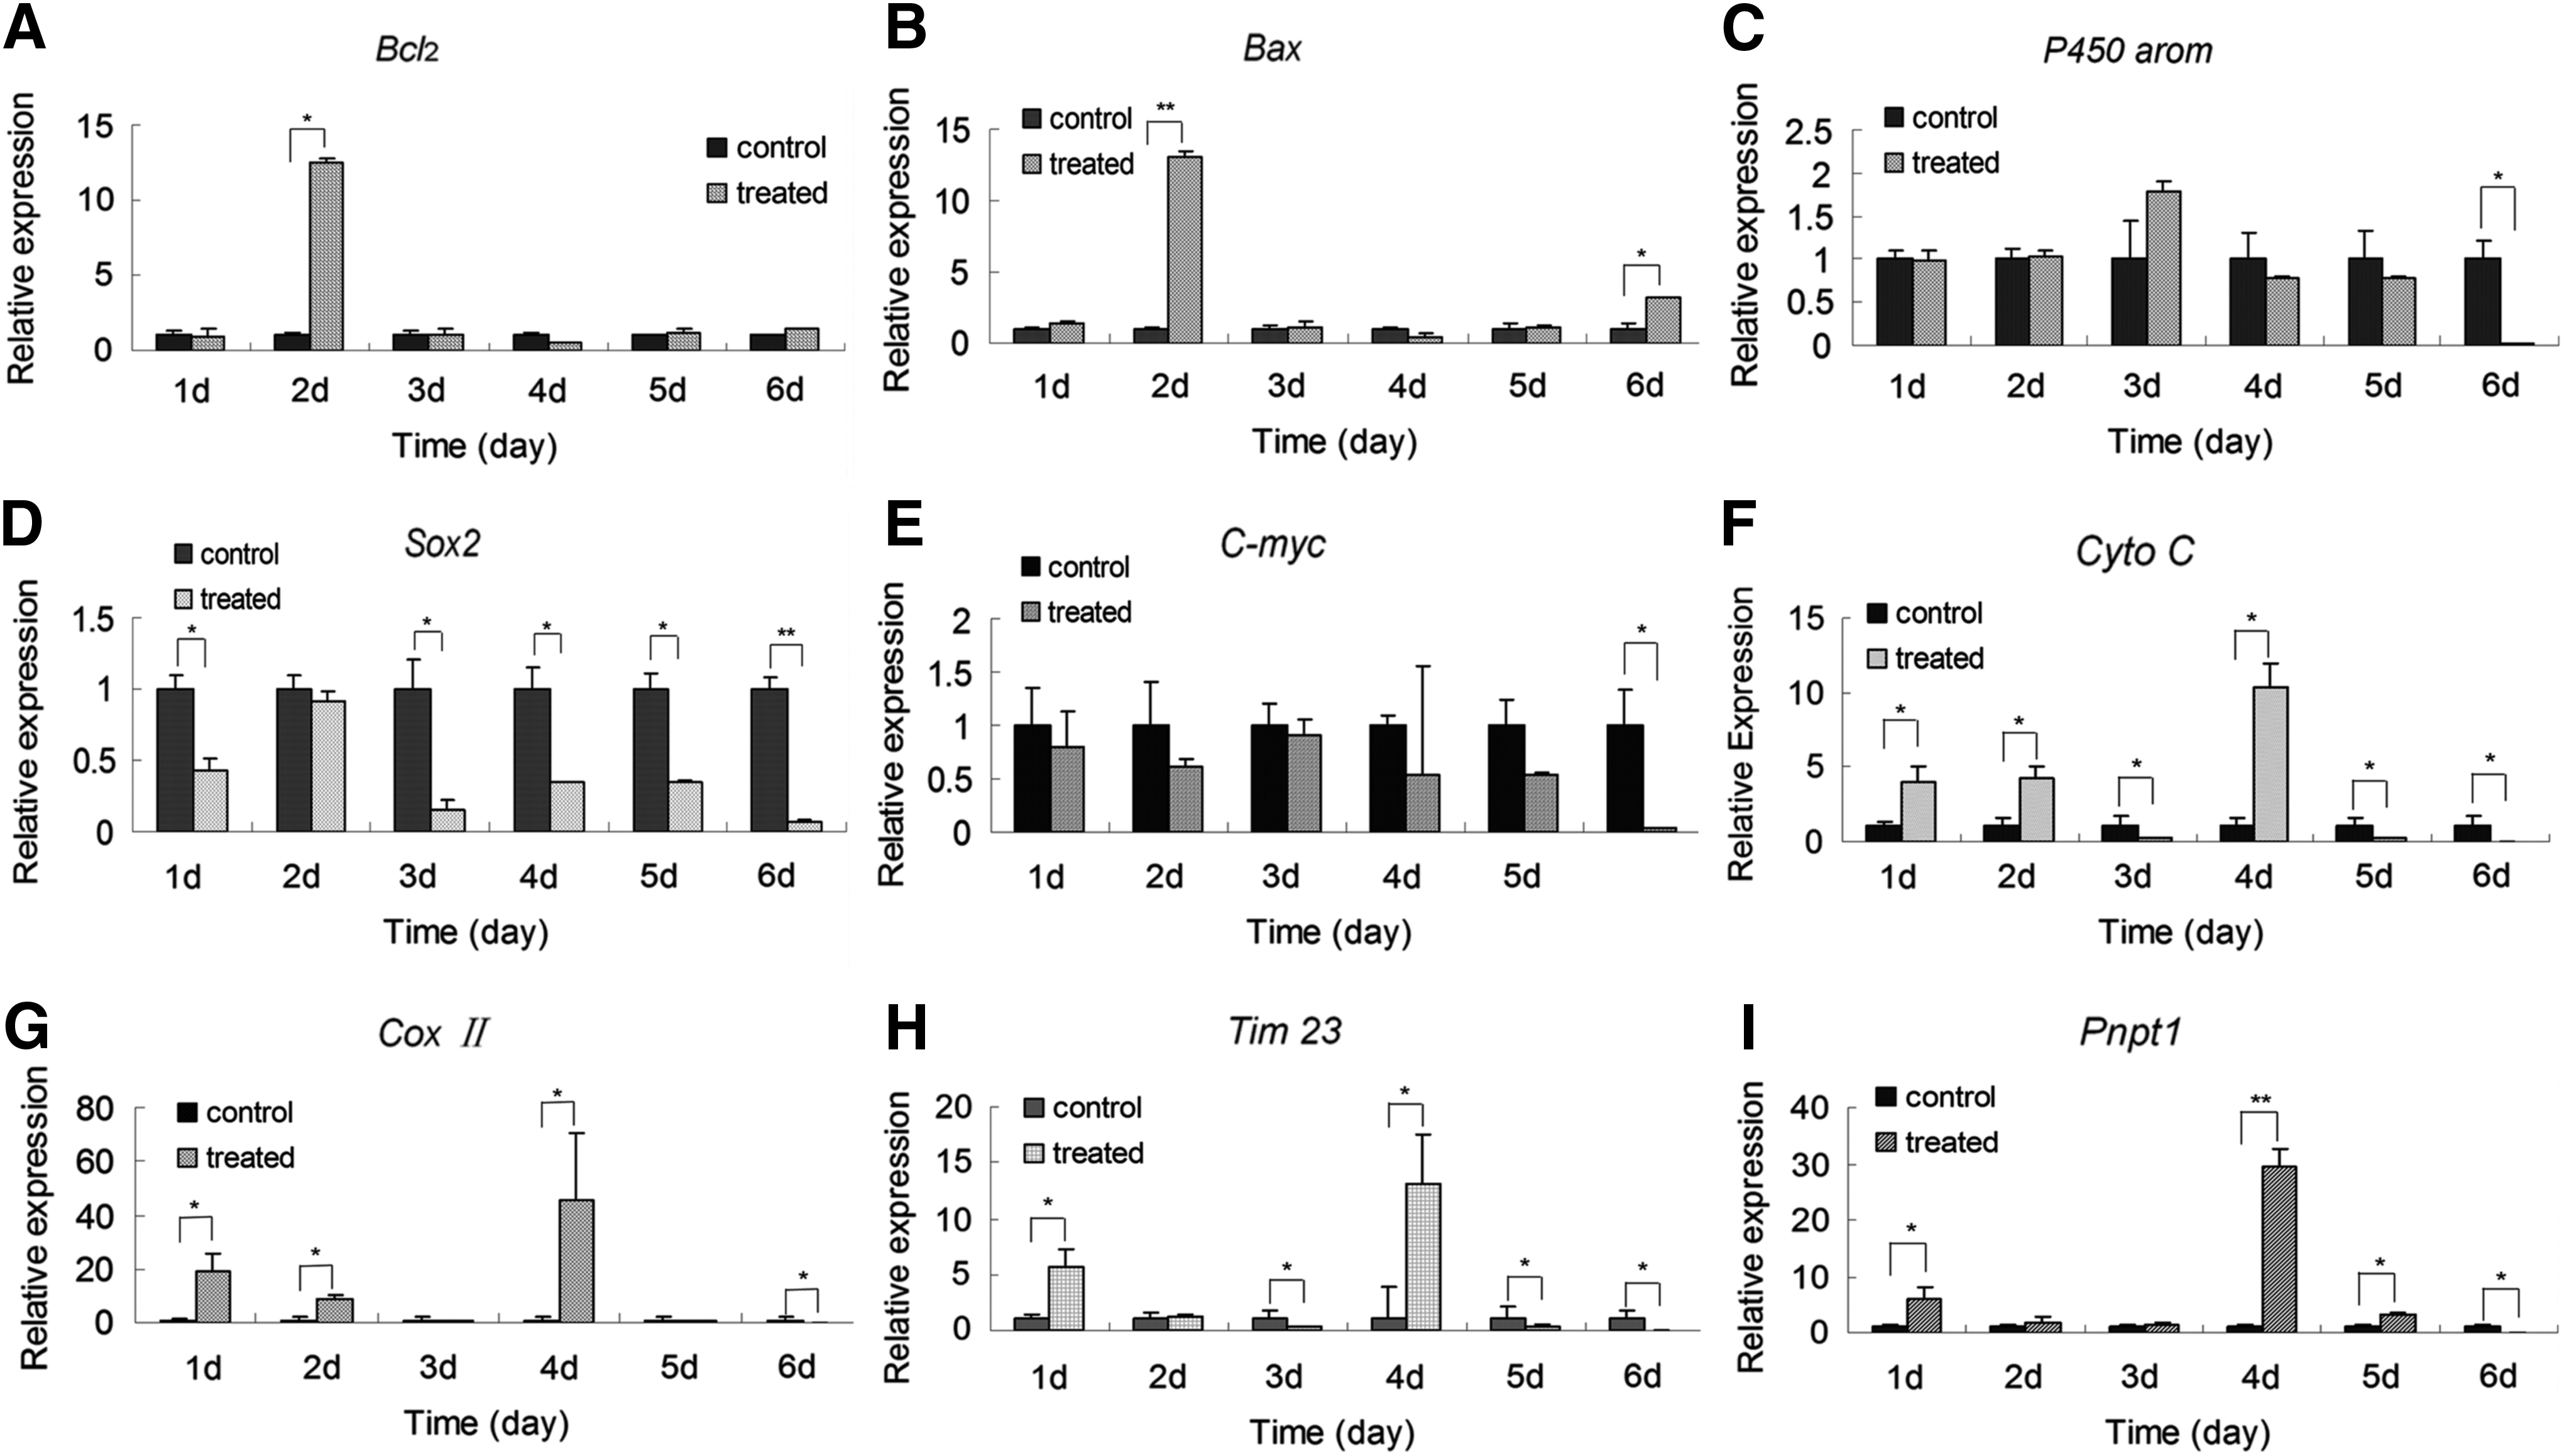
The effects of alcohol on the expression of genes in the cumulus. Expression of Bax
The expression levels of P450AROM, SOX2, and CMYC were also determined. The expression levels of P450AROM in the alcohol-treated groups were not significantly different from the levels in control mice (p > 0.05) (Fig. 6C), whereas SOX2 expression was significantly lower in alcohol-treated mice compared with control mice (p < 0.05) (Fig. 6D), except for mice treated for 2 days (p > 0.05). The expression levels of CMYC were significantly lower in mice treated for 6 days compared with control mice (p < 0.05) (Fig. 6E).
Alcohol regulates mitochondrial gene expression
The normal expression of nuclear and mitochondrial genes is necessary to maintain mitochondrial function (Pershina et al., 2014). Therefore, the expression levels of nuclear genes (TIM23 and PNPT1) and mitochondrial genes (CYTOC and COXII) was evaluated by qPCR. The expression levels of CYTOC and COXII were significantly higher in the mice treated with alcohol for 1, 2, and 4 days compared with the control groups (p < 0.05) (Fig. 6F, G). In addition, the expression of TIM23 and PNPT1 was significantly higher in the mice receiving alcohol for 1 or 4 days (p < 0.05) compared with the control groups (Fig. 6H). PNPT1 expression was significantly elevated in mice after 1, 4, and 5 days of alcohol administration (p < 0.05), but it was significantly lower in mice receiving 6 days of alcohol compared with control mice, respectively (Fig. 6I).
Alcohol regulates ROS production in the cumulus
The accumulation of ROS can impact mitochondrial functions (Liu et al., 2015). 7′-Dichlorofluorescein (DCF) fluorescence intensity is directly correlated with ROS content in the cumulus (Friques et al., 2015). Therefore, we next analyzed the green fluorescence of DCF by confocal microscopy (Fig. 7A). ROS levels were significantly decreased in mice treated with alcohol for 2 and 3 days compared with the control group (p < 0.05). However, ROS levels were significantly increased in mice treated for 6 days compared with control mice (p < 0.05) (Fig. 7B).

Alcohol could influence mitochondrial membrane potential and ROS levels. Mitochondrial membrane potential and ROS levels were obtained by confocal microscopy with the same fluorescence intensity. For identification of ROS levels, green and blue fluorescence from DCF staining identified the mitochondria and Hoechst 33342 was used to label the nucleus
Alcohol disrupts membrane potential in mitochondria
Mitochondrial membrane potential was detected by using the JC-1 probe on a confocal microscope (Fig. 7C). Mitochondrial membrane potential was significantly higher in mice treated with alcohol for 1, 3, and 4 days compared with control groups (p < 0.05) (Fig. 7D). These results demonstrate that alcohol can disrupt mitochondrial membrane potential.
Discussion
Various forms of alcohol are consumed as a beverage often daily in many countries. Alcohol is also used as a sterilization solution in hospitals and laboratories (Deluca et al., 2015; Saitman et al., 2015). Consequently, alcohol is very important in our day-to-day lives. Recent reports have highlighted several ways in which alcohol can impact human health, including its effects on the cardiovascular, nervous, and reproductive systems (Chang et al., 2015; Pan et al., 2014). To investigate the effects of alcohol on oocyte quality, mice were injected with alcohol during the estrous cycle. The estrous cycle was determined to last for 5 days by vaginal smear (Fig. 2). Other studies have focused on assessing the effects of long-term exposure to alcohol. Mice exposed to chronic or moderate doses of alcohol exhibited decreased oocyte quality (Cebral et al., 2000). Oocyte impairment was observed after 3 days of alcohol exposure in this study, which was is in agreement with previous reports (Cebral et al., 2000).
We also demonstrated that alcohol does not influence ovulation time, but 3 days of alcohol exposure increased the number of released oocytes during superovulation After 3 days of alcohol exposure, parthenogenetic embryonic development improved. Alcohol is metabolized by alcohol dehydrogenase and aldehyde dehydrogenase in the cell. Consequently, acetyl coenzyme A is produced during the process, which is involved in several cellular biological activities (Patananan et al., 2015). Therefore, alcohol exposure for short durations can be beneficial for oocyte quality. Oocyte development is follicular in mammals, and, therefore, follicles are important for oocyte competence. The cumulus directly connects to the oocyte by gap junctions, and the biological state of the cumulus is important for oocyte competence (Uyar et al., 2013). The cumulus can synthesize many proteins, hormones, messenger RNAs, and other factors that support oocyte growth.
The expression levels of many genes are used to predict oocyte and embryo quality (Hammond et al., 2015). Testosterone is synthesized in follicular membrane cells, which is converted to E2 in the cumulus by P450AROM. E2 maintains secondary sexual characteristics and influences oocyte development (Newman et al., 2008). Therefore, expression levels of P450AROM could reflect the levels of E2 (Kato et al., 2013). Alcohol can influence the levels of E2 in serum by affecting the expression of P450AROM. It has been reported that alcohol can significantly increase the level of free E2 (Schliep et al., 2015).
In this study, the expression level of the P450AROM gene was not affected by alcohol. SOX2 is known to be expressed in both the cumulus and oocyte (Yan et al., 2013), but it is not currently known how SOX2 in the cumulus impacts oocyte quality. It was recently shown that the cumulus could be efficiently reprogrammed into induced pluripotent stem cells (iPS) by transduction of SOX2 and OCT4 (Mao et al., 2014). In this study, SOX2 levels were significantly decreased during alcohol intake between treated and control groups for each treatment duration, with the exception of mice treated for 2 days, which might be related to oocyte quality; however, the underlying mechanisms remain unclear. BAX and BCL2 function as pro- and anti-apoptotic factors in cells, respectively, and their expression levels maintain the balance of normal cellular activities (Fernandes et al., 2015).
The expression level of BAX was higher than BCL2 in mice treated with alcohol for 6 days, which was related to ROS accumulation (Zhang et al., 2015). ROS are catabolites produced during oxygen-induced phosphorylation of mitochondria. ROS are also an important molecular signal for maintaining normal functions in the cell, but excessive ROS can trigger detrimental oxidative stress (Considine et al., 2015). The ROS level was low in mice treated with alcohol for 2 and 3 days (Fig. 7B), which was related to the expression level of mitochondrial genes (Fig. 6F–I). Alcohol can induce ROS production and accumulation, which can damage DNA and impair mitochondrial functions (Liu et al., 2015).
In this study, the expression of mitochondrial genes was significantly elevated in mice treated with alcohol over several days compared with control groups, which could be related to concomitant elevated levels of ROS. Cells can trigger a series of mechanisms to reduce ROS levels. During this process, the mitochondrial membrane potential can be elevated (Fig. 7D), which plays a key role in oxidative phosphorylation (Cavalheiro et al., 2004). Furthermore, changes in mitochondrial functions and gene expression in the cumulus are related to the capacity of parthenogenetic embryonic development in vitro. Oxidative phosphorylation is a main mechanism for providing energy to the cumulus (Ge et al., 2015). Previous reports have shown that alcohol consumption can impair oocyte competence (Cebral et al., 2000).
In conclusion, this study found that alcohol intake over various time periods can induce mitochondrial dysfunction during an estrus cycle. The process observed is relatively complex, and, therefore, exploration of the mechanisms involved will require further investigation.
Footnotes
Acknowledgments
This work was supported by the National Natural Science Foundation of China (Grant No. 30900155), the Research Foundation of Education Bureau of Shaanxi Province, China (Grant No. 09JK785), and the Natural Science Foundation of Shaanxi Province, China (Grant No. 2014JM3062).
Author Disclosure Statement
The authors declare that no conflicting financial interests exist.