
Abstract
Abstract
Scaffolds produced by electrospinning act as supports for cell proliferation and differentiation, improved through the release of neurotrophic factors. The objective of this study was to develop aligned and random nanofiber scaffolds with and without nerve growth factor to evaluate the potential of mesenchymal stem cells (MSCs) for neural differentiation. Nanofiber morphology, diameter, degradability, cell morphology, adhesion, proliferation, viability, cytotoxicity, and neural differentiation were performed to characterize the scaffolds. The expression for nestin, β-III tubulin, and neuron-specific enolase was also evaluated. The scaffolds demonstrated a satisfactory environment for MSC growth, being nontoxic. The MSCs cultivated on the scaffolds were able to adhere and proliferate. The evaluation of neural differentiation indicated that in all groups of scaffolds the MSCs were able to upregulate neural gene expression.
Introduction
T
MSCs from human deciduous teeth pulp have a higher proliferation rate and ability to form colonies, compared with MSCs from bone marrow (BM). Furthermore, they are able to express nestin and glial fibrillary acidic protein, markers of neural precursors, and glial cells, respectively (Miura et al., 2003). Such cells have great potential for neural differentiation, a fact that might be related to their neural crest origin, and they demonstrate neuroprotective characteristics when applied to neurological injuries (Wang et al., 2010).
However, when related to the nervous system, the use of these cells requires further alternatives, mainly related to their application site. Neural tissue engineering (TE) has recently attained positive outcomes associating MSCs with specific devices produced from biomaterials (Carrier-Ruiz et al., 2015; Wang et al., 2016).
In this context, these biomedical devices should act as supports for cells, which will remain longer at the site of application, improving the process of regeneration (Lee and Arinzeh, 2011). This cellular support or scaffold may comprise polymer matrices composed of nanofibers produced by the electrospinning technique. The fibers produced by electrospinning can reach the nanometer scale, resulting in a large surface area, which enhances cell adhesion and proliferation. Moreover, these scaffolds provide an essential three-dimensional (3D) environment for cell survival and differentiation (Martins et al., 2007).
The MSCs applied to the injury site on the nanofiber scaffolds may also release neurotrophic factors suitable for tissue regeneration. To intensify the process, these growth factors can be incorporated together with the scaffolds through a variation of the ES technique called emulsion electrospinning (Chew et al., 2005; Li et al., 2010).
Other approaches also demonstrate good outcomes using growth factors to improve the process of regeneration in vitro (Cho et al., 2010; Prabhakaran et al., 2009).
Due to its relevant biological characteristics related to the nervous system, the nerve growth factor (NGF) was the bioactive molecule selected for this study. NGF plays a central role in the development, maintenance, and survival of neurons. One of the biological effects of NGF is to stimulate cell proliferation and neuronal differentiation by modulating axonal growth, which is why it has been associated with potentially therapeutic approaches (Sofroniew et al., 2001). Besides NGF incorporation, the topographical features of scaffolds, such as alignment, can direct MSCs to a neural fate. All these mechanisms together may help in restoring the original neural structure and this hypothesis is the basis for this in vitro research (Gu et al., 2011).
Studies of MSC differentiation on two-dimensional (2D) surfaces are becoming limited because they cannot represent the real stem cell niche. Due to their physicochemical properties, the nanofiber scaffolds are better able to mimic the 3D cellular environment provided by the extracellular matrix (ECM), as some authors have recently reported (Jiang et al., 2012; Larsen et al., 2006). The interaction between MSCs and an extracellular microenvironment plays an important role in controlling differentiation through chemical, electrical, and physical signals. MSCs can sense different stimuli on scaffold surfaces (chemical and topographical cues) and respond with appropriate signaling (Ilie et al., 2012). Accordingly, these nanofiber matrices mimic the size scale and the architecture of natural ECM, leading the cells to more physiological behaviors when compared with 2D substrates.
Therefore, the aim of this work has been to develop scaffolds with aligned and nonaligned nanofibers with and without NGF incorporated and then evaluate MSC behavior and neural differentiation on these devices. The use of growth factors in association with TE is still considered a recent approach. The hypothesis is that the incorporation of NGF into aligned nanofiber scaffolds can best stimulate MSC differentiation, improving its future clinical application and accelerating new tissue formation.
Materials and Methods
Isolation of stem cells and cell culture
Mesenchymal stem cells (MSCs) were isolated from human exfoliated deciduous teeth pulp. The samples of deciduous teeth were obtained in partnership with the Post-Graduate Program of Odontopediatrics from the Federal University of Rio Grande do Sul. Fresh dental pulp was harvested from deciduous teeth in resorption from six donors (n = 6). Patients' guardians signed a consent form approved by the ethics committee of the Federal University of Rio Grande do Sul under number 19,273. Immediately after collection, the teeth were immersed in 1 mL MSC culture medium, consisting of DMEM/Hepes (Sigma-Aldrich), 10% bovine fetal serum (Invitrogen), 1% penicillin/streptomycin (Invitrogen), and 0.45 μg/mL gentamicin. The dental pulp was carefully separated from the tooth tissue in a laminar flow and digested in a 0.2% solution of collagenase type I (Invitrogen), as described by Bernardi et al. (2011). The cells from one tooth were seeded onto a well of a 12-well plate. The medium was replaced after 24 hours to isolate adherent cells and thereafter it was refreshed once every 3 days to allow further growth; the cells were maintained at 37°C in a humidified atmosphere containing 5% CO2 until they reached 90% confluence.
After reaching confluence, the cells were detached with trypsin-EDTA 0.5% solution (Sigma-Aldrich) and reseeded at a density of 3000 cells/cm2 until they reached the third passage, when they were cryopreserved for further use in the experiments. For this, the MSCs were detached with trypsin-EDTA 0.5% solution (Sigma-Aldrich), centrifuged, and resuspended in cryopreservation medium (90% fetal bovine serum [FBS] and 10% dimethylsulfoxide [DMSO]) at a concentration of 1 × 10⁶ cells/mL. The MSCs were maintained under −20°C for 1 h and then under −80°C for 24 h. The MSCs were then stored in nitrogen before their use in the experiments. At the moment of their use, the MSCs were thawed and expanded until they reached the fifth passage for use in the experiments described below.
Dental pulp stem cells from human exfoliated deciduous teeth characterization
Immunophenotypic profile
The immunophenotypic profile of dental pulp stem cells (DPSCs) from human deciduous teeth was performed immediately after cell dissociation with trypsin/EDTA and posterior incubation with specific monoclonal antibodies. The cells were counted, resuspended in phosphate-buffered saline (PBS) buffer at 106 cells/mL, and incubated with the following human antibodies: anti-CD14, anti-CD34, anti-CD44, anti-CD45, anti-CD73, anti-CD90, anti-CD146, anti-CD184, anti-Stro-1, and anti-HLA-DR (Becton Dickinson, San Diego, CA). The antibodies were conjugated with fluorescein isothiocyanate or phycoerythrin. After 30 minutes incubation in the dark, the cells were washed with PBS 1 × to remove unbound antibody excess. Appropriate isotype controls were used, and exclusion of dead cells was performed by incubation with 7-Aminoactinomycin D (7AAD). The analyses were performed by a FACSAria III flow cytometer (Becton Dickinson) and analyzed by FACSDiva software, version 6.0. The graphs were generated in the WinMDI, version 2.8.
Cell differentiation in vitro
The cells were evaluated at the fifth passage of cell culture for their capacity to differentiate into osteoblasts, condrocytes, and adipocytes through induction medium, previously described by Bernardi et al. (2011).
Adipogenic differentiation
The cells were cultivated for 2 weeks in IMDM containing 20% human plasma, dexamethasone (10−7M), insulin (2.5 μg/mL), indomethacin (5 μM), rosiglitazone (5 μM), and sodium heparin (10 units/mL). The deposits of lipid droplets were observed under an optical microscope after Oil Red O staining.
Chondrogenic Differentiation
For chondrogenic differentiation, the cells were cultivated in a differentiation medium for 30 days. The inducing medium consisted of DMEM supplemented with 15 mM Hepes, 6.25 μg/mL insulin, 10 ng/mL TGF-β 1, and 50 nM solution of ascorbic acid 2-phosphate. The chondrogenesis was made apparent by Alcian Blue staining.
Osteogenic differentiation
The DPSCs from the human deciduous teeth were cultivated for 3–4 weeks in a supplemented medium containing fetal bovine serum (10%), dexamethasone (10−8M), ascorbic acid 2-phosphate (5 μg/mL), and β-glycerophosphate (10 mM). The deposition of mineralized matrix was observed by Alizarin Red S staining.
Nanofiber production
The aqueous phase consisted of 0.1% bovine serum albumin (BSA) 5% in PBS with the addition of 1 μg/mL NGF (only for the scaffolds containing NGF incorporated). This was added to the organic phase consisting of poly(lactic-co-glycolic acid) (PLGA) 15% (w/w), 0.2% Span-80, and 1,1,1,3,3,3-hexafluoro-2-propanol (HFIP) to produce an emulsion (Chew et al., 2005; Li et al., 2010).
BSA was used to stabilize the GF when in contact with the organic solvent. The emulsion produced was placed in a homemade machine between electrodes with the application of 22 kV at the positive electrode and 2 kV at the negative electrode using two needles of 0.80 mm inner diameter and a flow rate of 0.002 mL.h−1 in each one. The two needles optimized the production process. For alignment of the fibers, the scaffolds were collected on a rotating (20 cm diameter) aluminum platform. The speed used to perform the electrospinning was 2500 rpm (tangential velocity of 26.18 m/s). The platform was positioned 15 cm from the needles.
The same conditions were applied for random scaffolds, except for the receiving plate. The temperature and humidity variables, 20 ± 2°C and 30% ± 5%, respectively, were constantly monitored throughout the procedure. All the procedures can be visualized in Scheme 1. The scaffolds produced had a thickness of ∼30 μm and were fixed in round 15 mm diameter glass coverslips using PLGA polymer solution dissolved in HFIP 15% (w/w). Subsequently, the scaffolds were placed in culture plates of 24 wells for sterilization through ultraviolet light for 1.5 hours in a vertical laminar flow hood (30 minutes for each side and 30 minutes when placed on the culture plates).
Following this, four different types of scaffolds were produced by the emulsion ES technique: randomized nanofiber scaffolds control (RC), randomized nanofiber scaffolds with NGF (RN), aligned nanofiber scaffolds control (AC), aligned nanofiber scaffolds with NGF (AN), and cells cultivated directly on tissue culture plates (TCPs) called control.
Physicochemical properties of nanofiber scaffolds
Nanofiber morphology
The assessment of nanofiber morphology was performed by scanning electron microscopy (SEM) model JEOL—JSM 6060. The images were obtained using accelerating voltage of 10 kV and a magnification range of 1000–20,000 × after sample metallization with a thin layer of gold.
Nanofiber diameter
The average fiber diameter was determined by SEM through the measurement of 30 fibers for each image using the ImageJ software 1.38 × . For each group, three scaffolds produced on different days were evaluated. Three different fields for each scaffold were selected to obtain the images.
Scaffold Degradability
The degradability test was conducted simulating physiological conditions at 37°C in 1 × PBS, pH 7.4. Approximately 30 mg of scaffolds from each group (n = 3) was submerged in 10 mL PBS buffer at 120 rpm, at 37°C. The degradability was evaluated at different times: 0 (scaffolds not subjected to degradability), 7, 14, and 28 days. The molecular weights of the degradation products were determined by gel permeation chromatography (GPC) on a chromatograph GPCmax VE2001 (Viscotek) equipped with triple detector (refractive index, viscosity, and light scattering). After each point, the samples were kept in an incubator for 24 hours to allow water excess evaporation and then 10 mg of each sample was dissolved in 4 mL THF, filtered through PVDF filter with a pore diameter of 0.45 mM, and analyzed at 45°C, eluent THF, and a flow rate of 1 mL.min−1.
Biological analysis
Besides the scaffold groups, an additional group was used for the following assays: cells cultivated directly on the wells, used as the control group. Tests for every primary culture of DPSCs from human exfoliated deciduous teeth were performed in triplicate. The cells cultivated with DMEM 10% FBS and 1% penicillin/streptomycin were maintained in a humidified incubator at 37°C and 5% CO2 during the following experiments.
Cell adhesion
Cell adhesion on the scaffolds was performed through DAPI staining (4′,6-diamidino-2-phenylindole), a cell nuclear marker. The DPSCs, from human exfoliated deciduous teeth, were seeded at a density of 30,000 cells for each scaffold (RC, RN, AC, and AN) and the control group (n = 6). After 6 hours incubation, the cells on the scaffolds and wells were fixed with 4% paraformaldehyde and stained with 5 μg/mL of DAPI in PBS for 1 minute. Several washes with PBS 1 × were then performed to remove excess dye. Analyses were performed using an inverted microscope (Olympus SV1000), and images were acquired from nine random points of the scaffolds with 400 × magnification. DAPI counterstaining was used to calculate the average cell number for each scaffold.
Cell viability
Cell viability on the scaffolds was assessed by the colorimetric assay MTT (3-(4,5-methylthiazol-2-yl)-2,5-diphenyl-tetrazolium bromide (Sigma-Aldrich) 6, 24, 48, and 72 hours after seeding a total of 45,000 cells per well or scaffold (n = 3). The medium was changed every three days. After each specific period of time, the cells were incubated with 0.25 μg/mL MTT for 2 h. Four hundred microliters of DMSO was then added per well to dissolve the formed crystals. Absorbance was measured at 560 and 630 nm. The results were calculated by the absorbance label subtraction (560–630 nm) and expressed as the average absorbance for each group. The absorbance measure was performed with the equipment Wallac EnVision (PerkinElmer).
Cytotoxicity
Cytotoxicity was assessed by measurement of enzyme lactate dehydrogenase (LDH), which is found in almost all organs and tissues of the body. Its activity is due to the catalytic action, in which there is the conversion of pyruvate to lactate. It is an intracellular enzyme and its presence in the extracellular environment may be indicative of cell damage. Increasing the concentration of this enzyme is proportional to the increase in cell death. The test (Labtest kit) was performed to the following period of time: 4, 7, 14, and 21 days of cell culture (n = 4). The cells cultivated fed directly on the wells were used as the negative control and the cells cultivated directly on the wells and treated with Triton X-100 (Sigma-Aldrich), 1% (v/v) for 10 minutes, were used as the positive control. Triton X-100 causes cell death, permitting maximum LDH release. Absorbance was measured using the Wallac EnVision equipment (PerkinElmer).
Cell proliferation
Cell proliferation was assessed on the fourth and seventh day after cell seeding (30,000 cells per scaffold/well) by immunofluorescence with the antibody Ki-67, a marker for the antigen KI-67, which is a nuclear protein that is associated with cellular proliferation and which appears in all phases of the cell cycle (n = 3). Five random fields of each scaffold were used to evaluate cell proliferation. The experiments were performed in triplicate. The total number of cells in each field was counted through DAPI counterstaining. The average number of Ki-67-positive cells over the total number of cells represents the proliferation rate for each group (% Ki-67-positive cells). The calculation of the proliferation rate is shown below:
Proliferation rate (% Ki-67-positive cells) = (Average Ki67+ cells/Average DAPI stained cells) × 100.
Neural differentiation on scaffolds
Based on the protocol described by Arthur et al. (2008), the cells were treated for 3 weeks in order for them to differentiate into neural cells (n = 4). Twenty-four hours before cell seeding, the scaffolds and wells were coated with Geltrex® (Invitrogen) diluted in DMEM-F12 (Sigma-Aldrich). The scaffolds and wells were washed with phosphate-buffered saline (PBS) and then DMEM-F12 before the cells were added. The cells were reseeded at a density of 45,000 cells per scaffold (RC, RN, AC, AN) and 10,000 cells per well (control group). After 24–48 hours, differentiation begun. At the first week of induction, the cells were treated with Neurobasal A (Invitrogen) medium supplemented with GlutaMAX (Invitrogen), 1 × B27 (Invitrogen), epidermal growth factor (EGF) (20 ng/mL), basic fibroblast growth factor (bFGF) (40 ng/mL), and 1% penicillin/streptomycin.
In the second week, the cells were treated with DMEM/F12 medium supplemented with ITS 1 × (Sigma-Aldrich), bFGF (40 ng/mL), and 1% penicillin/streptomycin. The all transretinoic acid (0.5 μM) added to medium of the second week characterized the medium used in the third week of treatment. As negative controls, the MSCs on all the groups of scaffolds and cells directly seeded on the wells (control) were cultured with DMEM with 10% FBS and 1% penicillin/streptomycin during the same period. The cells on the scaffolds/wells were lysed with TRIzol (Invitrogen) and stored at −80°C for RNA isolation and real time-polymerase chain reaction (RT-PCR) analysis for neural genes.
Cell morphology
The morphology of the MSCs on the scaffolds was observed by fluorescence microscopy (Nikon Inverted microscope Eclipse -Ti series). The cells were plated at a density of 45,000 cells per scaffold or directly on the wells for control. After 21 days of culture with DMEM and neural induction medium (two independent groups), the scaffolds were washed with PBS 1 × , fixed with 4% paraformaldehyde for 30 minutes, and then subsequently made permeable with 0.1% Triton X-100 for 10 minutes. Staining was then performed with 50 mg/mL rhodamine-conjugated phalloidin for 40 minutes to identify cytoskeleton actin filaments. After phalloidin staining, the samples were washed with 1 × PBS and stained with 0.5 mg/mL DAPI for 1 minute. Through fluorescence microscopy, photomicrographs of representative images from the different samples were obtained at 100 × magnification. In addition, the control group was evaluated through phase-contrast microscopy after 21 days of neural induction.
RNA extraction and quantitative real-time RT-PCR analysis
The total RNA from the test and control groups was extracted using the TRIzol Reagent (Sigma-Aldrich). RNA samples (n = 4) were quantified by the spectrophotometer (NanoDrop). The cDNA was synthesized using the M-MLV Reverse transcriptase kit (Invitrogen), according to the manufacturer's instructions. PCR was performed, as described by the manufacturer using the Platinum SYBR Kit (Invitrogen). The final reaction contained 17 μL SYBR green/enzyme reaction mix, 2 μL primer mix, and 1 μL cDNA, in a total volume of 20 μL. PCR conditions were 50°C for 2 min, 95°C for 10 min, followed by 40 cycles of 95°C for 15 s, and 60°C for 1 min. The product size for each primer set was confirmed by gel electrophoresis. GAPDH was used to normalize the transcript levels of target genes. All the results were repeated in three independent experiments and performed in duplicate. The primers of each gene are described in Table 1.
NSE, neuron-specific enolase; GAPDH, glyceraldehyde-3-phosphate dehydrogenase.
Statistical analyses
The results are presented as means and standard deviations. Cell viability and proliferation, cytotoxicity, and degradation of scaffolds were assessed by ANOVA for repeated measures with two classification criteria: nanofiber orientation and group (considering NGF presence). The fiber diameter was evaluated by One-way ANOVA, and analyses of cell adhesion were assessed by ANOVA (One and Two Way). Gene expression analyses were conducted using Two-way ANOVA. The Bonferroni test was used as post hoc for all the analyses. A 5% significance level was used for the decision criteria. The results were generated by SPSS 20 version.
Results
Characterization of DPSCs from human deciduous teeth
The MSCs from human deciduous teeth were isolated, cultivated, and characterized successfully. The cells showed typical MSC morphology, characteristic of plastic adherence and a mean positivity of over 92% for the surface markers CD29, CD44, CD73, and CD90 and less than 3% for CD34, CD45, CD184, HLA-DR, and STRO-1. Table 2 shows the percentage expression of each marker for the three samples.
Expression in percentage for each marker (n = 3). Results below 0.1% were considered 0.0.
DPSCs, dental pulp stem cells; SD, Standard deviation.
All samples were able to differentiate into the three analyzed mesodermal cell lineages (osteogenic, adipogenic, and chondrogenic). Photomicrographs of a representative sample of the DPSCs from human exfoliated deciduous teeth after the differentiation assay are shown in Figure 1.

MSC differentiation potential into the three mesodermal lineages. Differentiation of MSCs in the following lineages:
Nanofiber morphology and diameter
SEM analysis showed that all the scaffolds presented smooth well-formed fibers distributed, aligned, or randomly with interconnected pores. Beading formation was not observed in any of the samples (Fig. 2). The average diameter ± standard deviation of the nanofibers was 610 ± 174 nm for RC (random nanofiber scaffolds), 585 ± 109 nm for RN (random nanofiber scaffolds with NGF), 548 ± 78 nm for AC (aligned nanofiber scaffolds), and 543 ± 128 nm for AN (aligned nanofiber scaffolds with NGF). The average fiber diameter in all the groups was not statistically different (p > 0.05 for all comparisons, One-way ANOVA).

Nanofiber morphology. Scaffold morphology evaluated by SEM micrographs:
Scaffold degradability
Although there is no statistical difference between the groups, molecular weight loss was more evident in the first 7 days for the aligned nanofiber scaffolds AC and AN (Fig. 3). Within 28 days of incubation, the scaffold degradation rate was similar to all the groups, demonstrating a similar pattern of degradation (Table 3).

Scaffold degradability. Molecular weight loss of the nanofiber scaffolds assessed for periods of 7, 14, and 28 days by GPC analysis (n = 3). GPC, gel permeation chromatography.
Cell adhesion
Cell adhesion was assessed according to scaffold topography (random or aligned) and the presence or absence of NGF (One-way ANOVA). The control group is MSCs seeded on the wells.
Analysis considering the topography of the scaffolds showed MSCs adhere more to RC than to AC. MSC adhesion was similar among control, RN, and AN groups.
When the presence or absence of NGF was evaluated, MSC adhesion on AN was more effective compared to AC (p = 0.028, One-way ANOVA). An adhesion pattern was equal to the control (p > 0.05). Random nanofiber scaffolds (RC and RN) showed a similar adhesion pattern to the control (p > 0.05 for both). When all the groups were assessed together (Two-way ANOVA), these differences could not be detected. Figure 4 shows MSC adhesion for all the groups.
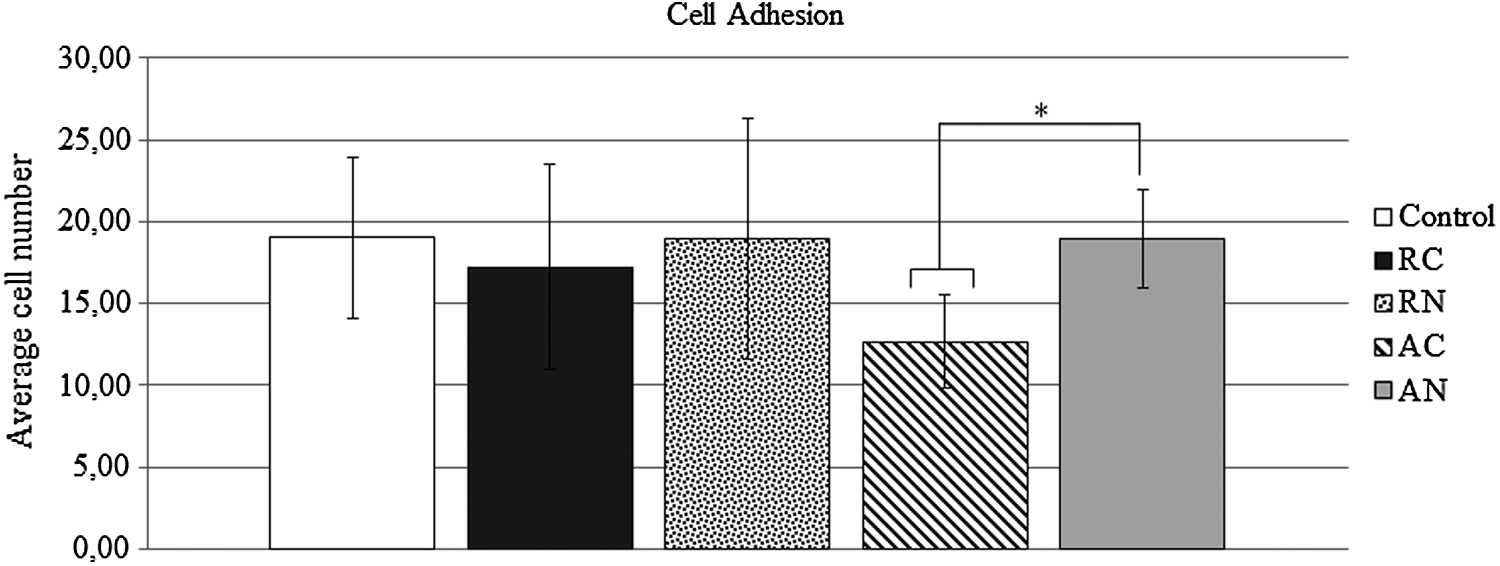
Cell adhesion assay. The bars represent the average number of adherent cells per scaffold or control (MSCs cultured on wells). A significant difference between the AN and AC groups was detected (*p < 0.05 One-way ANOVA, n = 6).
Cell viability
At the first point of evaluation (6 hours), MSC average absorbance on the scaffold groups (RC, RN, AC, and AN) and the control was very similar (p > 0.05 for all comparisons). After 24 hours, all the groups showed a trend of increased cellular metabolism, although not statistically detected. Within 48 hours, a decrease in absorbance was observed for the scaffold groups. After 72 hours, the average absorbance on the scaffold groups remained the same in relation to 48 hours and different from the control group (p < 0.05). Figure 5 shows the time course of formazan accumulation in each group after 6, 24, 48, and 72 hours of MSC cultivation.
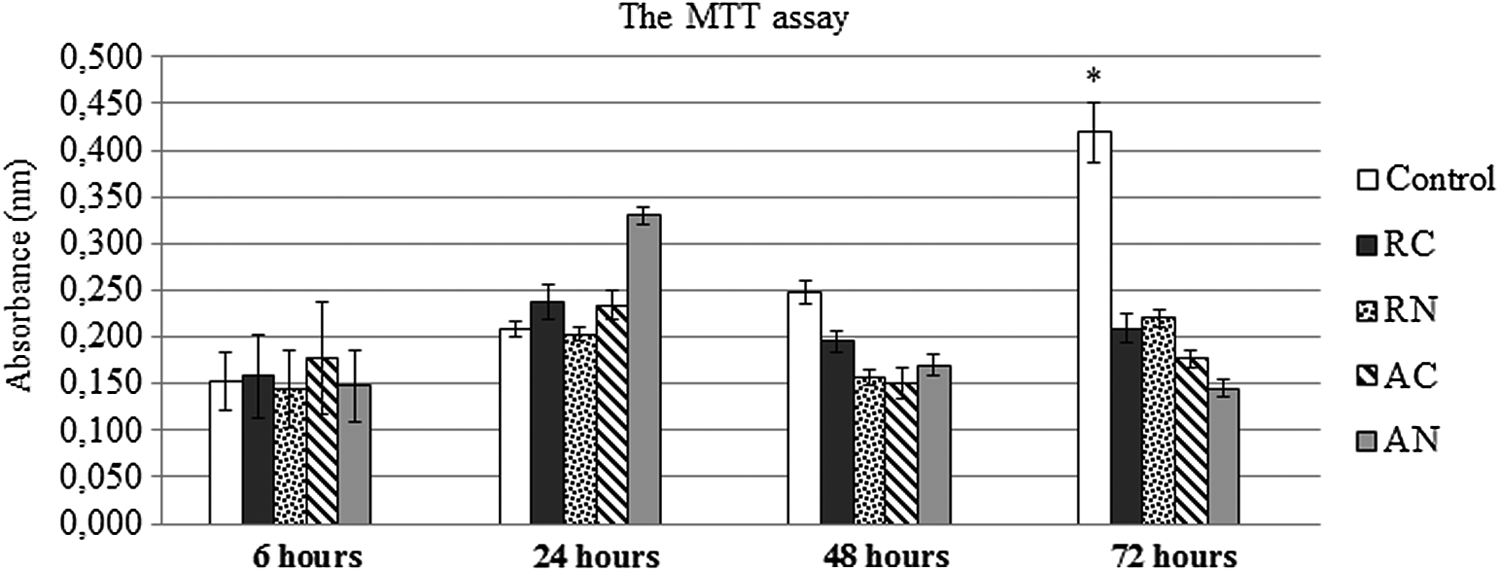
The MTT assay. After 6, 24, 48, and 72 hours of cultivation, the MSCs were assessed for cell viability. Absorbance value corresponds to metabolically active cells (viable cells). At 72 hours, a significant difference between the scaffold groups and control was detected (*p < 0.05 for all the comparisons, Repeated measures test, n = 3).
Cytotoxicity
LDH concentrations measured for 21 days of cell culture are presented in Figure 6. LDH dosages for all the scaffold groups were similar to the negative control throughout all the periods evaluated (4, 7, 14, and 21 days) (p > 0.05 for all comparisons). Furthermore, all the matrices showed LDH dosages much lower than the positive control (MSCs treated with TritonX-100 for 10 minutes) (p < 0.05), which represents the maximum release of LDH, representing total cell death. In addition, the positive control group showed a significant increase (p < 0.05) in LDH dosage during the evaluated period.
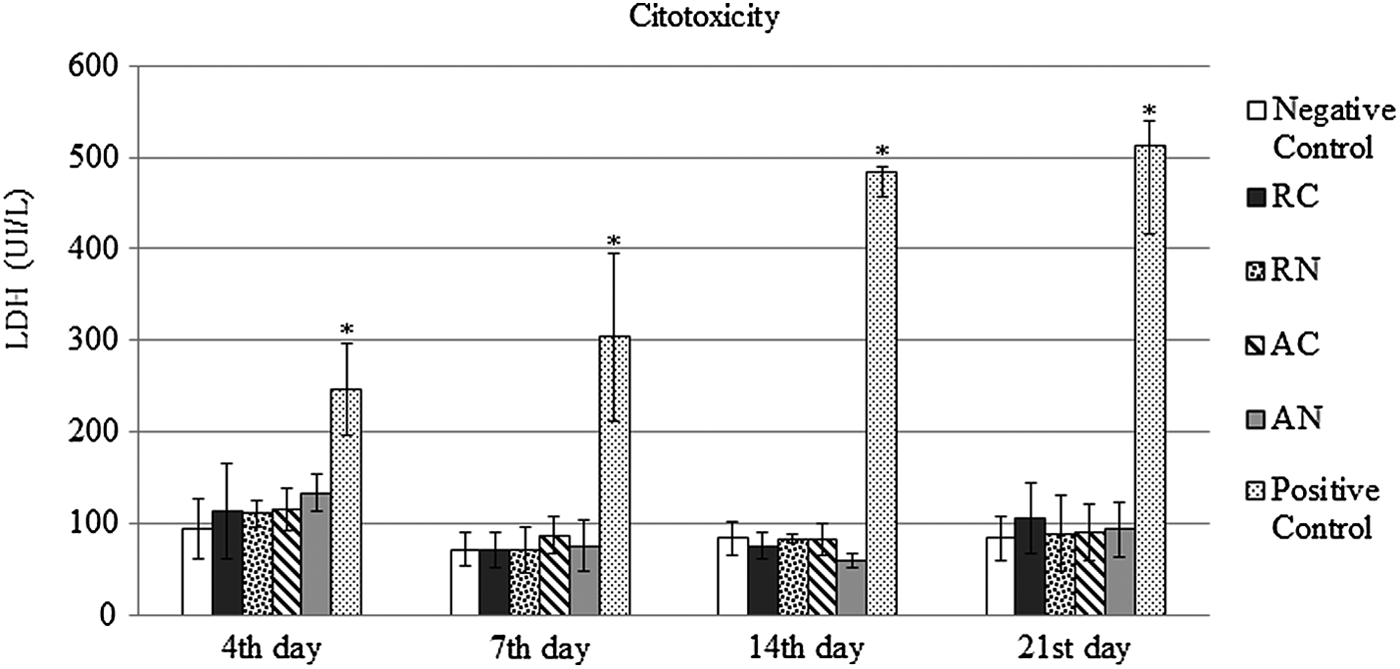
Cytotoxicity. MSCs evaluated after 4, 7, 14, and 21 days of seeding. Data are presented as media ± standard deviation of absorbance of LDH dosage (n = 4). A significant difference between Positive Control (MSC culture supernatant after Triton treatment) and all the other groups was detected (*p < 0.05, Repeated measures test, n = 4). LDH, lactate dehydrogenase.
Proliferation
MSC proliferation rate between the scaffold groups and the control group was similar at both points evaluated (4 and 7 days). Although a decrease in MSC proliferation rate was observed on the seventh day for RN and AN groups, it was not significant (p > 0.05), as shown in Figure 7.
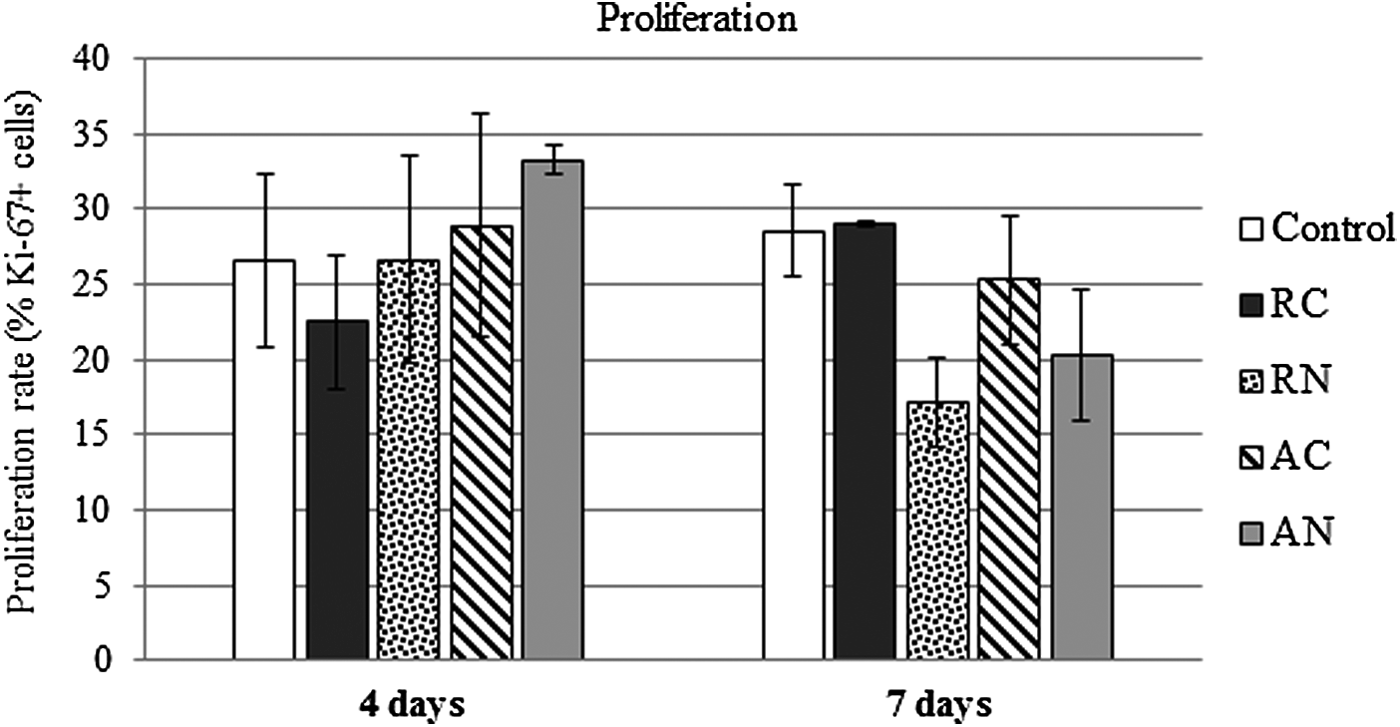
Proliferation. Cell proliferation after 4 and 7 days of seeding MSCs. Data are presented as media ± standard error of proliferation rate in percentage (average cell number of Ki67-positive cells per number of DAPI-positive cells, n = 3). p > 0.05 (Repeated measures test, n = 3).
Neural differentiation
Cell morphology
During the neural induction procedure (MSCs treated for differentiation for 21 days with neural induction medium), the cytoplasm in the flat cells initially retracted toward the nucleus and formed a contracted multipolar cell body, which left membranous processes much like peripheral extensions. Over the subsequent days, most of the cells gradually lost their mesenchymal appearance and obtained a more neural appearance. The MSCs under neural induction on the scaffolds were evaluated using a fluorescence microscope, as shown in Figure 8. After induction, a reduction in cell numbers was observed for all the groups, as observed in Figure 8B, D, and F. The MSCs cultivated on the aligned scaffolds in a conventional medium show clear-cell elongation along the nanofiber alignment (Fig. 8E).
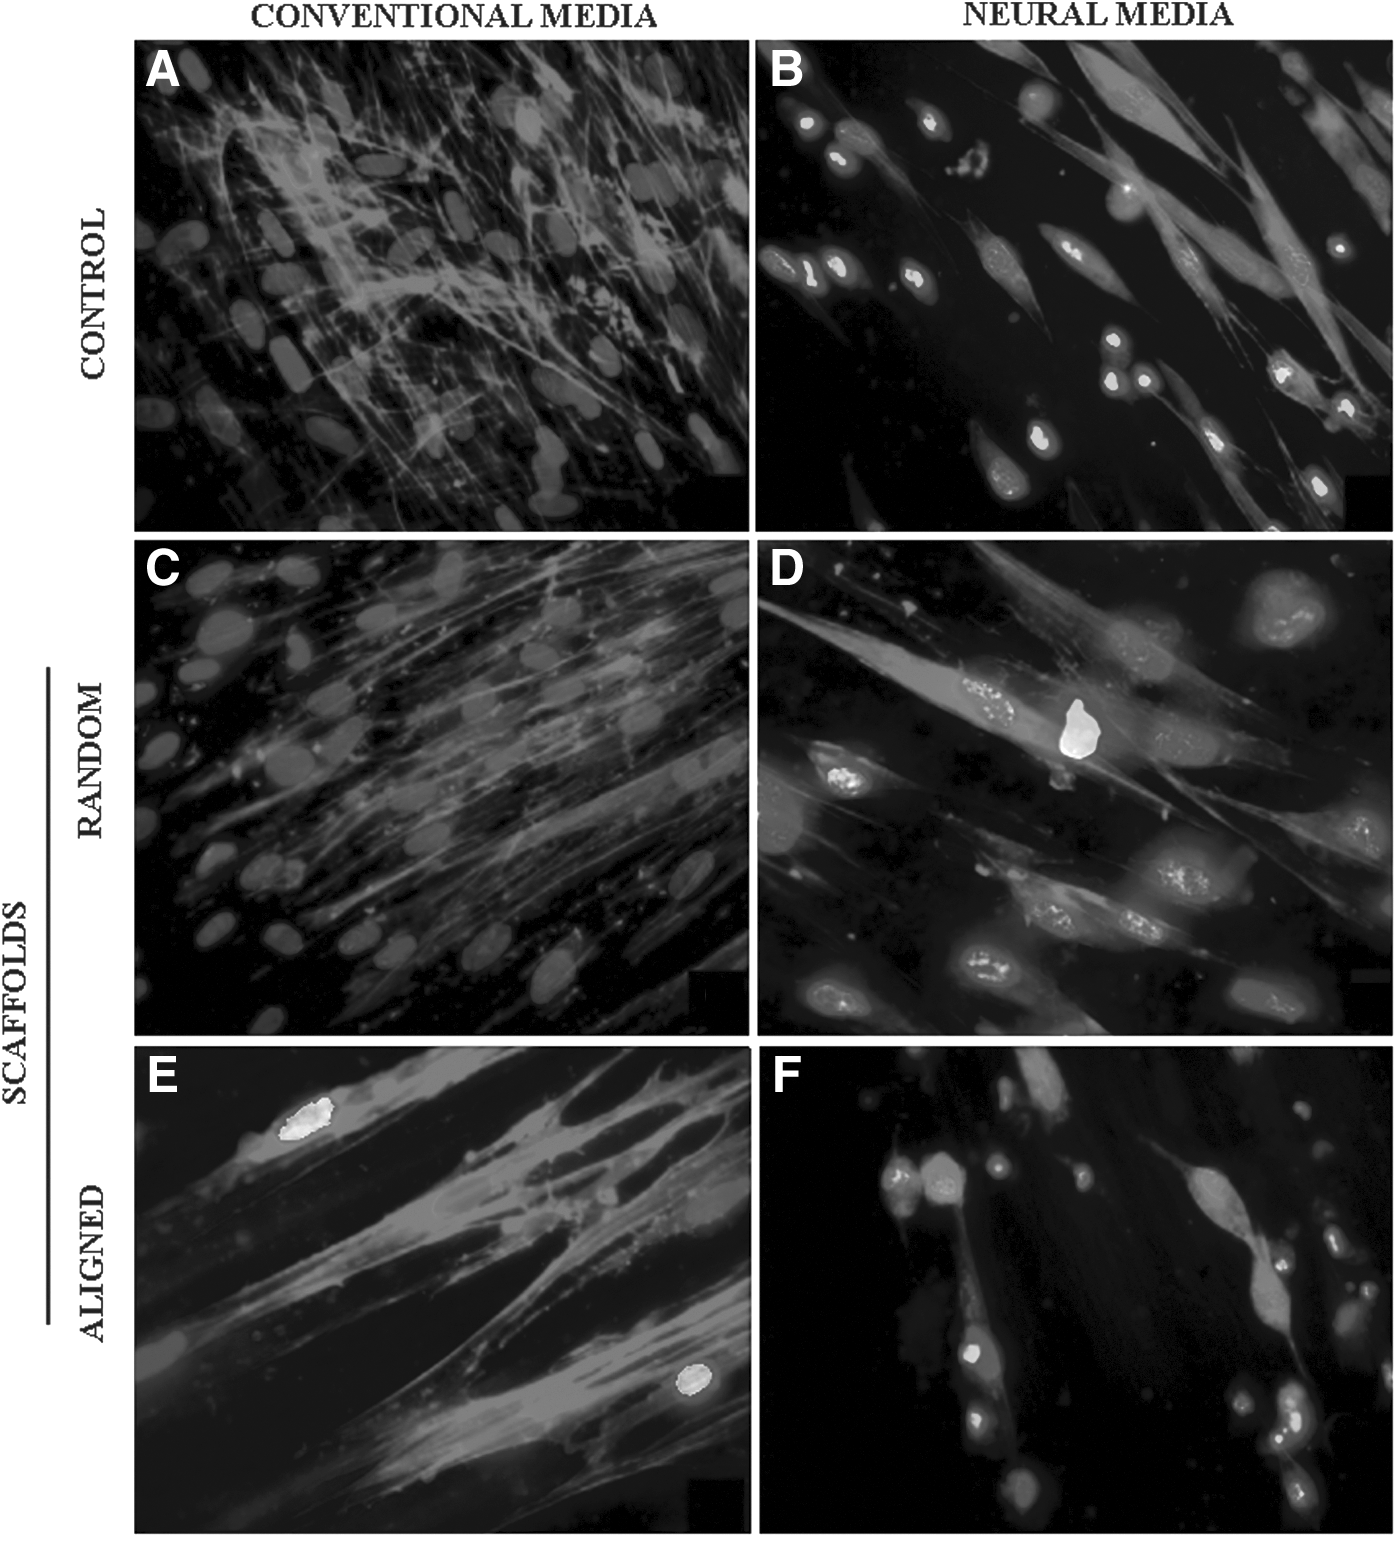
MSC morphology after 21 days of cultivation. MSCs cultivated on tissue plates with conventional medium and with neural induction medium
Gene expression
After 21 days of neural induction, according to the protocol adapted from Arthur et al. (2008), the MSCs induced on TCPs showed increased expression of NSE gene (p < 0.01), while nestin and β-III tubulin gene expression was unchanged.
When the MSCs were cultivated on the nanofiber matrices with conventional media and tested for gene expression, the following results were detected:
Nestin: a similar upregulation of gene expression was observed for all the scaffold groups (1.6-fold). β-III tubulin: the gene was downregulated in all the scaffold groups (1.64 ± 0.28-fold), except for RC, which remained unchanged. NSE: gene expression was upregulated (1.45 ± 0.15-fold) in the aligned scaffolds. It was unchanged for the other groups.
When the MSCs cultivated on scaffolds were treated with neural induction medium and compared to the MSCs on TCPs under the same induction protocol, the following gene expression was detected:
Nestin: the gene expression was upregulated in all the groups (1.82 ± 0.46-fold). This upregulation was most evident in the RN scaffolds (2.47-fold). B-III tubulin: the expression was downregulated in all the groups (1.67 ± 0.15-fold). NSE: the expression was downregulated in all the groups (1.61 ± 0.25-fold). This downregulation was similar in the RC, RN, and AC scaffolds and even more pronounced in the AN scaffolds (1.92 × ). Table 4 includes the data described above. It is noted by the results previously mentioned that the only significant increase was the NSE gene expression of MSCs cultivated on TCPs under neural induction (Fig. 9).
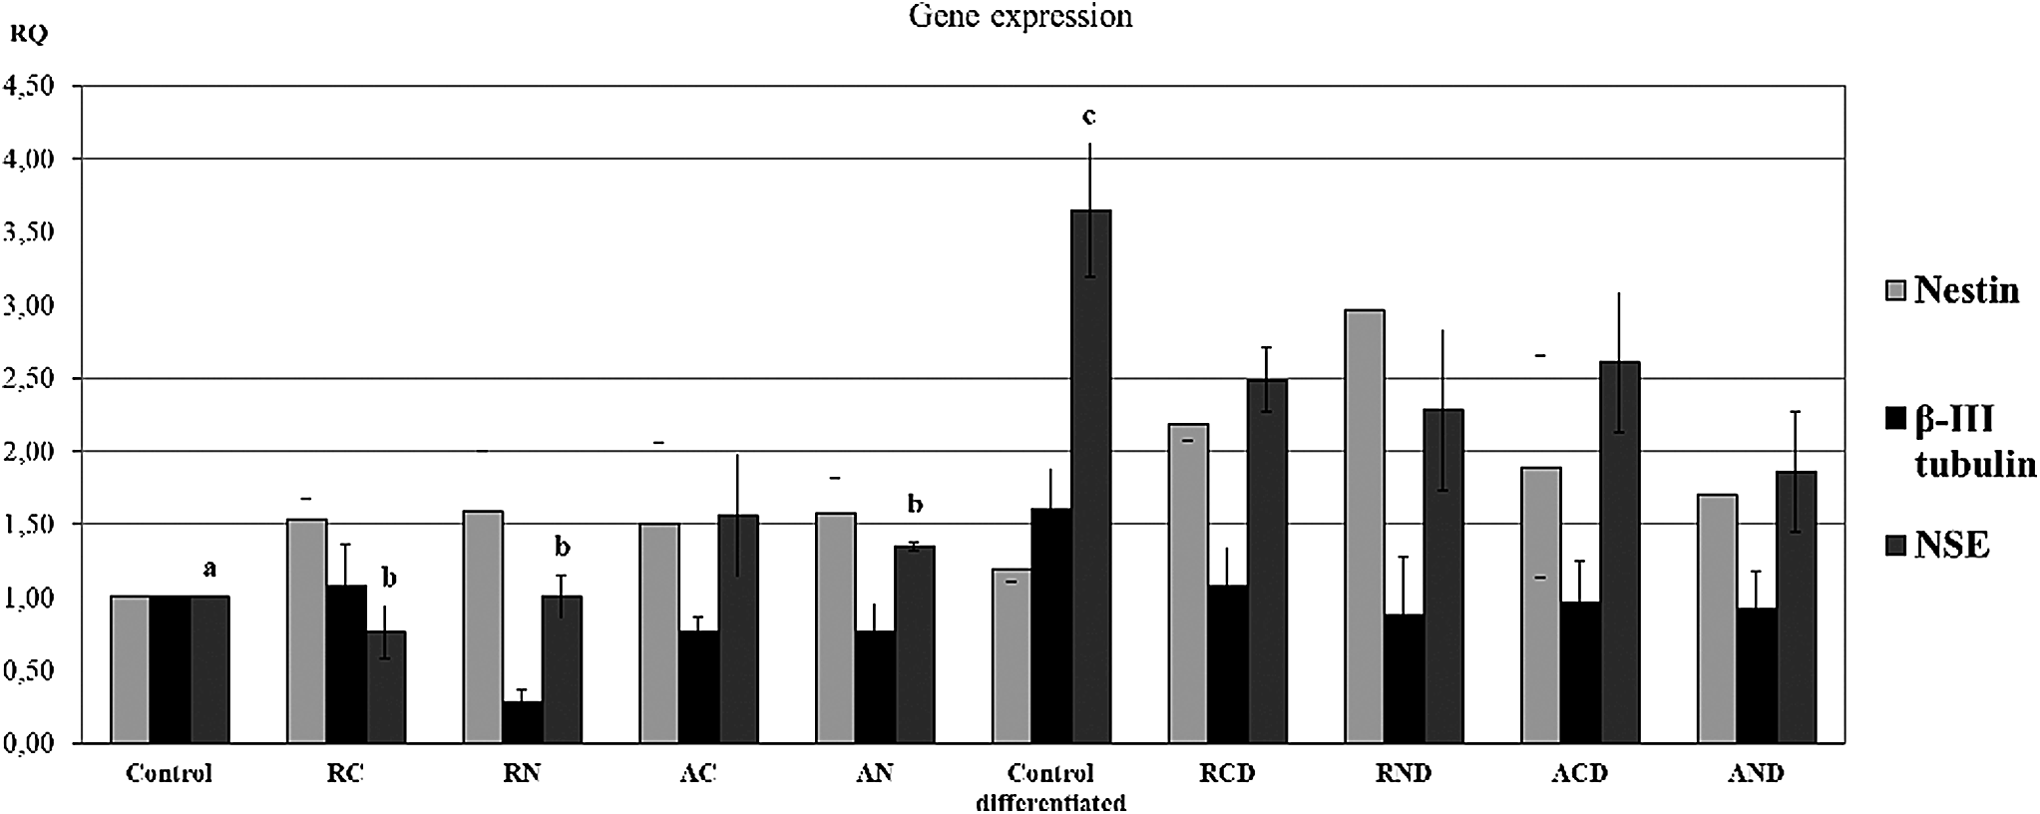
MSC gene expression on the scaffolds and control groups. Real-time polymerase chain reaction analysis of total RNA isolated from MSCs exposed to neural medium (control differentiated) and conventional medium (control) on TCPs. MSCs cultivated on the scaffold groups with conventional medium: RC, RN, AC, and AN. MSCs cultivated on the scaffold groups with neural induction medium: RCD, RND, ACD, and AND. Nestin, NSE, and β-III tubulin were the tested genes, and data were expressed in average RQ values. NSE expression was significantly upregulated after neural induction for the differentiated control group in comparison to the control (c × a, p < 0.05), RC, RN, and AN groups (c × b, p < 0.05), Two-way ANOVA, n = 4. TCPs, tissue culture plates.
Upregulated (↑); Downregualted (↓); Upregulated, p < 0.01 (↑*); Unchanged (—).
Discussion
In this study, MSCs were isolated from the dental pulp of human exfoliated deciduous teeth. This source of MSCs has become quite feasible because it is not invasive and the material is usually discarded after the natural process of exfoliation. The protocol described by Bernardi et al. (2011), used to obtain the MSCs, was reproduced successfully. The MSCs were isolated and characterized in accordance with the criteria established by the International Society for Cell Therapy, presenting plastic adherence and characteristic immunophenotypic profile, shown by high expression of mesenchymal markers and low or absent expression for hematopoietic lineage markers (Dominici et al., 2006). All MSC samples analyzed by flow cytometry differentiated into the three mesodermal lineages, showing multipotency characteristics. Therefore, the cells hereby studied under the experimental conditions used met the criteria required for consideration as mesenchymal stem cells.
The fiber morphology and diameter results showed homogeneous fibers produced in a nanometric scale (nanofibers) for all the scaffold groups (randomized or aligned). This was possible by controlling many factors inherent for the ES technique, such as polymer solution concentration, flow rate, applied voltage, needle diameter, distance between the needle and the collector plate, and different types of receiving plates. The control of environmental factors, such as humidity and temperature, was also essential for obtaining fibers with homogeneous characteristics.
The average diameter of the nanofibers represents an important factor for evaluating cell behavior. Some studies report the influence of fiber diameter in adhesion, migration, cell differentiation, and activation of cells associated with the inflammatory process (Christopherson et al., 2009; Saino et al., 2011; Wang et al., 2010). Therefore, it can be concluded that in this study cell behavior has not changed by variation in the diameter of the nanofibers, but possibly because of other variables. Furthermore, the average diameter achieved by the nanofibers produced in this study was 567 ± 121 nm, which is similar to the fiber diameters presented by the ECM (100–600 nm). This similarity with the ECM nanofibers allows adaptation, organization, and maintenance of cellular functionality (Ye and Mahato, 2008).
Devices produced by TE techniques for lesion repair of the nervous system consider criteria regarding the biomaterial degradation profile. Two of these criteria are, first, remain intact until the axons can fill the empty space left after injury and, second, degrade gradually with minimal reaction and swelling. High degradation rates could leave regenerating axons vulnerable. Low degradation rates can lead to nerve compression and/or immune reactions (Gu et al., 2011).
The graph in Figure 3 demonstrates that the degradation process started before the seventh day for all the groups. In this period, molecular chain breaking started, leading to a decrease in molecular weight. The average degradation rate observed for all the scaffold groups after 28 days of incubation was similar, being about 41%. This high degradation rate could be associated with the addition of the aqueous solution to the polymeric solution, increasing the polymer hydrophilicity. It is important to observe that the in vivo degradation rate tends to increase due to other factors provided by the microenvironment (Wu and Ding, 2004).
There are many complex factors that can influence the time for nerve regeneration, but it is known that nerve degeneration occurs in a short period after the injury, 24–48 hours for peripheral nerve injury, for example (Stoll and Müller, 1999). The early degradation of the scaffold, therefore, could be advantageous because it could possibly help to attenuate the extensive and progressive damage caused immediately after fiber damage.
Scaffolds for in vivo application should exhibit certain characteristics such as the promotion of physical support and the maintenance of scaffold activity for a few days.
The growth factor incorporated into the scaffold (NGF) will possibly provide the trophic support by its release during the polymer hydrolysis and the degradation process, assisting cell survival and axonal maturation.
To proliferate, migrate, and differentiate, the MSCs must first adhere to their substrate. Therefore, the adhesion is the first step in the development of new tissue. Several key proteins in the cell adhesion process demonstrate significant adsorption for the nanofiber scaffolds. After adsorption, these molecules interact with the MSCs through integrin receptors (Zanatta et al., 2012). In the present study, the MSCs were capable of adhering to all the substrates produced. The best MSC adhesion performed on aligned scaffolds containing NGF (AN) when compared to their respective controls (AC) (p = 0.028) could be related to increased bioactivity and supposed hydrophilicity caused by the presence of the growth factor.
There are several mechanisms where integrins and growth factors cooperate to control cell behavior. Staniszewska et al. (2008) reported specific binding of an integrin subtype (α9β1) to NGF and other neurotrophins. The interaction of this integrin with its ligand (NGF) induced activation of a protein involved in focal adhesion, which in turn stimulated cell scattering (Staniszewska et al., 2008). Thus, in the aligned nanofiber scaffolds with NGF, it is clear that in some way the presence of the growth factor improved the MSC interaction with the substrates produced.
Although a tendency to lower cell adhesion on the aligned scaffolds in comparison with the random scaffolds (AC vs. RC) was observed, it was not statistically significant. In a study evaluating the cellular behavior of monocytes, Cao et al. (2010) observed higher cell adhesion on random nanofiber scaffolds in relation to aligned nanofiber scaffolds. The justification for such behavior was the large gap observed between the aligned fibers, which decreased the nanofiber surface area, hindering initial cell adhesion (Cao et al., 2010). Therefore, based on these study results, it can be inferred that the high contact surface of the randomized scaffolds (RC and RN) and the presence of NGF into the aligned scaffolds (AN) promote the best environment for MSCs. Although the MSC adhesion on the scaffold groups was similar to the TCPs, it is important to mention that scaffolds have 3D characteristics, which best represent the native environment of MSCs.
An important step for the development of scaffolds for TE is to evaluate their biocompatibility. In this study, the MSCs cultivated on the nanofiber scaffolds showed similar viability throughout the evaluated period. The MSCs grown on the scaffolds showed lower absorbance when compared to the control in the final time period evaluated (72 hours), possibly indicating cell number increase only for the control group. This behavior was not significant in the other periods evaluated. It was not possible to observe a clear trend of increased absorbance in the scaffold groups over time.
Qi et al. (2011) showed that during the MTT assay, a portion of the dissolved formazan is absorbed by the nanofibers, leading to a false-negative result for cell viability. During the 3 days of analysis, the dye percentage absorbed by the nanofibers resulted in a variation of 35.6%–50.2% from the real value of the cell viability. Furthermore, in the aforementioned study, the MTT viability assessment data did not relate to the positive results observed for cell morphology analysis by SEM. The author suggests a correction method based on the quantification of the MTT formazan dye sorption. Thus, in the present study, conducted under very similar conditions to the experimental study cited above, there may be an increased number of metabolically active cells present in the scaffolds, but it was possibly not efficiently detected by the MTT assay. It is important to consider this hypothesis, as the results of the cell viability were not consistent with the satisfactory results obtained for the MSC adhesion on the scaffolds, which were very similar to the control.
It is necessary to consider time for MSC growth, which can be modified by the environment. Bernardi et al. (2011) described a period of about 72 hours to double the MSC population when cultivation was carried out in standard conditions. Therefore, considering that the main goal of this study is to evaluate MSC behavior in a different environment (scaffolds and not TCPs), the MSC process of adaptation on scaffolds could take longer when compared to standard conditions. This could be the explanation for the observation of only a slight increase in cell number during the period of the experiment. Another study to be mentioned is from Steffens et al. (2013), in which similar cell behavior on scaffolds produced by ES technique was observed. In their study, the increase of cell number until the seventh day of cultivation was also not expressive.
MSC proliferation rate assessed by Ki-67-positive cells was very similar between the groups in the first period of analysis. In the second period, a trend of decrease in the proliferation rate was observed for the scaffold groups containing growth factors. Although not significant for the sample studied, this behavior would indicate a certain commitment to cell differentiation, whereas NGF present in the nanofibers can influence neuronal differentiation (Cho et al., 2005). This behavior is already expected for cells that are committed to differentiation rather than to their proliferation rate (Arthur et al., 2008).
Therefore, it could be suggested that MSC proliferation decrease possibly relates to NGF incorporation into the scaffolds and could indicate commitment to cell differentiation. Moreover, when NGF was absent, the cells were able to maintain their proliferation rate similar to that observed for the TCPs. In addition, the devices produced were adequate for cell cultivation as they showed LDH levels very similar to the negative control. This fact reinforces the hypothesis that the scaffolds showed nontoxic characteristics and that the MSCs need a certain time to adapt to the scaffold surface before their population starts to increase.
In this study, the MSCs derived from human exfoliated deciduous teeth underwent neural differentiation using the protocol adapted from Arthur et al. (2008). They were capable of responding to the protocol in a similar manner as suggested by the morphology and increased NSE gene expression (present in mature neurons) and maintenance of nestin and β-tubulin III expression.
Studies carried out to assess MSC differentiation on scaffolds with nanofibers produced by emulsion ES into neural lineages are not frequent. Thus, comparison of the results obtained from similar studies is quite limited. Çapkın et al. (2012) also evaluated MSC neural differentiation on aligned and randomized nanofiber scaffolds. The MSCs were treated for 14 days, and the induction medium was basically composed of growth factors (EGF and bFGF). The neural differentiation potential of two distinct sources, MSCs from BM and Adipose tissue-derived stem cells, was verified and the BM MSCs showed the best results. In that study, an increase of immunofluorescence staining of the oligodendrocytes (O4) on the aligned nanofiber scaffolds was shown. Despite the differences, the study was also able to show the MSC ability to differentiate into neural precursor cells on different types of nanofiber scaffolds (Çapkin et al., 2012). MSC neural differentiation on TCPs, which is normally considered standard to show cellular behavior, was not investigated by Çapkin et al.
It is important to note that the two-dimensional culture on TCPs, although normally showing more homogeneous and better controlled results, is not an ideal control. It does not have several characteristics inherent for the produced 3D devices, which mimic in some aspects the natural ECM (Larsen et al., 2006). In this study, it was observed that the MSCs cultivated on the nanofiber scaffolds can change the expression of the analyzed genes in comparison to TCPs. Although these differences are not significant for the sample studied, it is possible that the interaction between the MSCs and the nanofiber scaffolds can increase or decrease the expression of the neuronal genes analyzed as a result of physical and chemical signals present in these 3D devices (Ilie et al., 2012).
The MSCs cultivated on the scaffolds showed a similar upregulation for nestin gene expression. Nestin is an intermediate filament protein expressed in dividing cells during the initial phases of the development of the central nervous system, the peripheral nervous system, and the other types of tissue. During the process of differentiation, the expression of nestin tends to decrease followed by replacement of more specific intermediate filaments (Michalczyk and Ziman, 2005). Therefore, enhanced nestin expression can indicate a greater number of neural precursors, still in an earlier stage of differentiation. This effect is even more evident when the MSCs undergo differentiation through specific neural medium, especially in RN scaffolds.
It seems that the growth factor plays a synergistic effect with differentiation medium, particularly related to nestin gene expression. Although the cells show a more immature development stage, increase in this gene expression indicates response to neurotrophic induction stimuli, which subsequently may be converted to the increased expression of early and mature neuronal markers, such as β-III tubulin and NSE (Abrous et al., 2005).
For aligned scaffolds not treated with induction medium, the MSCs showed upregulation in the NSE gene expression, which is normally expressed in mature neuronal cells. This increase may be related to the stimulus provided by the surface alignment of the nanofibers. Some studies have investigated the role of topographical cues and their role in MSC differentiation into neural lineages (Çapkın et al., 2012). It is known that substrate characteristics can lead to cellular responses detected by cytoskeleton changes, which trigger cell signaling, which can generate different MSC behavior, such as cell differentiation (Zhang and Kohn, 2012). Thus, a part of the MSCs cultivated on the aligned scaffolds in this study might possibly be initiating the process of neural differentiation.
The MSCs from human exfoliated deciduous teeth cultivated on the TCPs showed a differentiation pattern consistent with a population of neuronal cells at an advanced stage of maturation. This pattern is presented by NSE upregulated gene expression in relation to the control (3.65 × ), unchanged for the nestin gene (1.20 × ) and slightly upregulated for the β-tubulin III gene (1.60 × ). When MSCs were cultivated on the scaffolds, they did not show this same behavior. However, the signaling pathways generated by the gene receptors from the MSCs on more complex surfaces (scaffolds) are different from those on two-dimensional surfaces (TCPs), influencing cell behavior and differentiation. TCPs do not mimic natural ECM in many aspects (Larsen et al., 2006). Thus, it can be inferred that the different groups of scaffolds produced are able to promote a microenvironment suitable for MSC differentiation into neural lineage cells. Even though these results are consistent with those previously reported in the literature, it is possible that a larger sample size or even a greater induction time can detect these differences more clearly.
Even though there is indication by morphology and expression of neuronal genes that at least a proportion of the MSC population responds to differentiation, it must be considered that these criteria cannot be used alone to define the fate of the MSCs as a neural cell. As the results show a greater propensity of induced MSCs to neuron precursors, more criteria should be evaluated to consolidate data, such as assessing glial lineage gene expression and evaluating the functionality of these differentiated cells through electrophysiological assays as a future perspective. These criteria are important to determine the effectiveness and safety of the protocols tested, as most of the studies do not present a complete evaluation in relation to the functionality of these cells, vital for their future clinical application (Reh, 2002).
Conclusion
In the present study, scaffolds of aligned and random nanofibers, with and without NGF incorporated, were successfully produced and characterized according to their morphology, orientation, and physicochemical properties. MSCs from human exfoliated deciduous teeth were characterized and cultivated on all the scaffolds. They interacted successfully with these artificial matrices, during cultivation for the 21 days. The MSCs undergoing neural differentiation cultivated on all the scaffold groups presented different morphology in comparison with the controls and showed a decrease in the cell numbers.
It was possible to observe an orientated organization of the MSCs on the aligned nanofiber scaffold groups, both under neural induction and their respective controls. Through gene expression evaluation, it was observed that the MSCs responded to neural induction in all the groups of produced scaffolds. The influence of the presence of NGF in the scaffolds was observed in the RN group through neural induction by upregulation of the nestin gene. In addition, the alignment influence was demonstrated by upregulation of the NSE gene on the scaffolds with aligned nanofibers under conventional culture conditions.
These data suggest that the association between MSCs and scaffolds is an appropriate candidate for further evaluation for neural TE strategies, using animal models, which could open an innovative approach for the treatment of nervous system lesions.
Footnotes
Acknowledgments
The authors would also like to acknowledge the support of the National Council of Technological and Scientific Development (CNPq), FAPERGS (Fundação de Amparo à Pesquisa do Estado do Rio Grande do Sul), and Stem Cell Research Institute.
Author Disclosure Statement
The authors declare there are no conflicts of interest.