
Abstract
Abstract
Mesenchymal stem cells (MSCs) are a promising resource for stem cell therapy for the treatment of different neurodegenerative disorders. In particular, dental MSCs, given their origin from neural crest and their proneness toward neuronal differentiation, may be more suitable for transplantation. However, if MSCs can undergo spontaneous transformation and give rise to tumor is still debated. Data about transcriptional regulation of oncogenes in MSCs following in vitro expansion are not available. In this work, we compared gene expression levels of oncogenes in gingival-derived MSCs at passage number 10 and 41. We found that the expression of 22 oncogenes was abolished in gingival MSCs at passage number 41 compared to those at passage number 10, and this may indicate a greater safety of high number passage MSCs.
Introduction
M
MSCs can be isolated from different tissues: bone marrow (BM) (Gnecchi and Melo, 2009), adipose tissue (Ghorbani et al., 2014), dental tissue (Huang et al., 2009). In particular, different population of MSCs were isolated from dental tissues: postnatal dental pulp stem cells, stem cells from human exfoliated deciduous teeth, periodontal ligament stem cells, dental follicle progenitor cells, alveolar bone-derived MSCs, stem cells from apical papilla, tooth germ progenitor cells, and gingival MSCs (GMSCs) (Liu et al., 2015). MSCs are receiving a lot of attention because they seem a promising therapeutic approach for stem cell therapy in the treatment of different neurologic diseases. Indeed, MSCs are able to differentiate toward neuronal cells and secrete various cytokines and growth factors with anti-inflammatory and neuroprotective effects (Glavaski-Joksimovic and Bohn, 2013; Laroni et al., 2015; Martens et al., 2013; Xiao and Tsutsui, 2013).
It was reported that cranial neural crest cells are involved in the formation of dental mesenchyme, dental papilla, odontoblasts, dentine matrix, pulp, cementum, periodontal ligaments, mandible, the articulating disc of temporomandibular joint, and branchial arch nerve ganglia (Chai et al., 2000) and the progenitor cells from the oral mucosa lamina propria may be derived from neural crest cells (Davies et al., 2010). In particular, it was observed that around 90% of GMSCs are derived from neural crest cells and 10% are from the mesoderm and those derived from neural crest possessed a better ability to differentiate toward neural cells compared to mesoderm-derived GMSCs (Xu et al., 2013).
Given that dental stem cells origin from neural crest, they could possess properties similar to neural crest cells; indeed, they express neural cell markers and may be more prone to neurogenesis compared to BM-MSCs (Huang et al., 2009; Isobe et al., 2016; Martens et al., 2013). Interestingly, also, undifferentiated dental and oral-derived stem cells expressed neural markers at basal levels, even if not exposed to neural induction media. In particular, several types of dental MSCs were reported to express mature neuronal markers such as bIII-tubulin, nestin, neuronal nuclear antigen (NeuN), microtubule-associated protein 2 (MAP2), and tyrosine hydroxylase (Heng et al., 2016).
It was reported that GMSCs, compared to BM-MSCs, showed a faster proliferation rate and even at higher passages maintained MSC features, a stable morphology and a normal karyotype (Fawzy El-Sayed and Dorfer, 2016; Tomar et al., 2010).
However, given that the first step before MSC transplantation is their expansion in vitro, it is known that long-term culture increased the risk of acquiring an altered phenotype and genetic abnormalities; one of the main concerns of stem cell therapy is the possible formation of tumor.
It was reported that several MSCs derived from animals can undergo spontaneous transformation in culture (Miura et al., 2006; Tolar et al., 2007). However, the question if human MSCs can transform and give rise to tumor is still controversial. Some studies indicating MSC transformation after long-term culture (Rosland et al., 2009; Rubio et al., 2005) were retired because MSCs used in these studies were contaminated with tumor cells. However, while some studies reported that human MSCs seemed to be genetically stable, did not show chromosomal abnormalities after long-term culture, and are not tumorigenic (Aguilar et al., 2007; Bernardo et al., 2007), others showed that MSCs can undergo transformation during culture expansion and give rise to tumor after infusion (Berger et al., 2008; Pan et al., 2014).
In particular, the ability of GMSCs to induce tumor formation in vivo was tested. With this aim, GMSCs at passage 6 and 12 were injected subcutaneously into immunocompromised mice, but no tumor formation was observed in mice when examined for 3 months (Tomar et al., 2010). Furthermore, 6 months after GMSC injection, no signs of tumor growth were found (Santamaria et al., 2016).
However, no data about gene expression levels of oncogenes in GMSCs during in vitro culture are available. The aim of this work was the comparison of the oncogenetic potential of GMSCs after 10 (GMSCs-p10) and 41 passages (GMSCs-p41), evaluating oncogene or tumor marker expression levels, and to establish their safety and the probability of giving rise to tumor after transplantation.
Materials and Methods
Cell culture
GMSCs were isolated from gingival tissue biopsies from five different donors without oral and systemic diseases. The cytofluorimetric characterization of surface markers and differentiation assays were performed as reported by Rajan et al. (2017).
The GMSCs were cultured in monolayer in the medium DMEM-High Glucose (SIGMA-ALDRICH, Co., USA) supplemented with 10% fetal bovine serum (Sigma-Aldrich Co. Ltd) at 37°C in a 5% CO2/95% air humidified atmosphere. Cells were expanded for 41 passages. At this passage, GMSCs changed morphology, acquiring a neuron-like morphology. Cells at passage number 10 and 41 were harvested to perform transcriptomic analysis. The experiment was made in triplicate, using GMSCs isolated from different donors not pooled together.
RNA sequencing and library preparation
Total RNA extraction was performed with Reliaprep RNA Cell Miniprep System (Promega). RNA sequencing libraries were prepared using the TruSeq RNA Access library kit (Illumina, Inc., San Diego, CA) following the manufacturer's instructions. RNA samples (50 ng of total RNA) were fragmented at 94°C for 8 minutes in a thermal cycler. Syntheses of first-strand cDNA were performed using random hexamers and SuperScript II Reverse Transcriptase (Invitrogen) at 25°C for 10 minutes, 42°C for 15 minutes, and 70°C for 15 minutes. To generate the second DNA strand, we have added 20 μL of thawed Second Strand Marking Master Mix and 5 μL of Resuspension Buffer to each sample and incubated at 16°C for 1 hour; the RNA templates were removed and a second replacement strand was generated by incorporation of dUTP (instead of dTTP, to keep strand information) to obtain ds cDNA.
After that, to clean up the blunt-ended cDNA, AMPure XP beads (Beckman Coulter) were used. The 3′ ends of the cDNA were then adenylated to make adaptor ligation easier in the following step; for each sample, we have added 2.5 μL Resuspension Buffer and 12.5 μL thawed A-Tailing Mix; the samples were incubated at 37°C for 30 minutes, 70°C for 5 minutes, and in ice for 1 minute. The step of adaptor ligation was performed adding the following for each sample: 2.5 μL Resuspension Buffer, 2.5 μL Ligation Mix, and 2.5 μL thawed RNA Adapter Index (different for each sample), and incubating at 30°C for 10 minutes. The ligation reaction was stopped by adding 5 μL Stop Ligation Buffer for each sample.
After the ligation of indexing adaptors, libraries were cleaned up with AMPure XP beads. A first PCR amplification step (15 cycles at the following thermal cycling conditions: 98°C for 10 seconds, 60°C for 30 seconds, and 72°C for 30 seconds), adding 5 μL thawed PCR Primer Cocktail and 25 μL thawed PCR Master Mix, was performed to selectively enrich those DNA fragments that have adapter molecules on both ends and to amplify the quantity of DNA in the library. After the validation of the libraries using Agilent Technologies 2100 Bioanalyzer, 200 ng of each DNA library was combined. Fifty microliters Capture Target Buffer and 3.5 μL Coding Exome Oligos were added to the libraries and the first hybridization was performed by 18 cycles in the following conditions: 1 minute of incubation, starting at 94°C, and then decreasing 2°C per cycle.
After that, streptavidin-coated magnetic beads were used to capture probes hybridized to the target regions. After elution from the beads, the enriched libraries undergo a second hybridization step to guarantee high specificity of the capture regions and it was executed as follows: 18 cycles of 1 minute incubation starting at 94°C and decreasing 2°C for each cycle. A second capture step using streptavidin-coated beads was performed, and after that, two heated washes were done to remove nonspecific binding from the beads. Following elution from the beads, the enriched libraries were cleaned up through AMPure XP beads. After that, the second amplification was performed with 5 μL PCR Primer Cocktail and 20 μL Enhanced PCR Mix for 10 cycles at the following thermal cycling conditions: 98°C for 10 seconds, 60°C for 30 seconds, and 72°C for 30 seconds.
Libraries were cleaned up with AMPure XP beads. At the end, libraries were quantified by the qPCR using KAPA Library Quantification Kit—Illumina/ABI Prism® (Kapa Biosystems, Inc., Wilmington, MA) and validated with the Agilent High Sensitivity Kit on a Bioanalyzer. The size of the DNA fragments was measured to be in the range of 200–650 bp and peaked around 250 bp. Libraries were normalized to 12 pM and subjected to cluster, and single read sequencing was performed for 150 cycles on a MiSeq instrument (Illumina, Inc., San Diego, CA), following the protocol instructions. The generated libraries were loaded for clustering on a MiSeq Flow Cell v3 and sequenced with a MiSeq Instrument (Illumina). The cluster density validation has been performed by the software of the instrument during the run.
Data processing
Demultiplex reads into specific sample and groups of the indexes were performed using CASAVA (version 1.8.2; Illumina) software. The software RNA-Seq Alignment version 1.0.0 was used with its default parameters and each sample was mapped against its reference sequences “Homo sapiens UCSC hg19.” In particular, for the Read mapping the TopHat 2 (Bowtie 1) was used. The fragments per kilobase of exon per million fragments mapped (FPKM) values were calculated for each sample using the normalized read counts for each annotated gene: ([1000 × read count] ÷ [number of gene covered bases × number of mapped fragments in million]). Unmapped reads were removed, mantaining only read pairs with both reads aligned to the reference sequence “Homo sapiens UCSC hg19.” The comparison between two different samples was visualized by a scatter plot of the LOG10 of the FPKM.
The statistical analysis on the read counts was performed with the The Cufflinks Assembly & DE package version 2.0.0 to determine the proportion of differentially expressed genes between GMSCs-p10 and GMSCs-p41 for a q-value <0.05.
For gene ontology (GO) analysis, the GO (http://geneontology.org/) and GeneCards (www.genecards.org) websites were used. Then, we investigated genes involved in tumor processes, such as regulation of cell proliferation, differentiation, death, and metabolic process, using the gene query tool in “Ctd Database” (http://ctdbase.org/query.go?type=gene&highlight=gene) (Davis et al., 2017) to evaluate gene–disease associations and the section gene in “NCBI”(https://www.ncbi.nlm.nih.gov/gene) (Brown et al., 2015) to evaluate the diseases where they were involved. We selected those genes with a direct correlation with tumors. To screen those genes that influenced tumors in a negative way, we used the “Tumor suppressor gene database” (https://bioinfo.uth.edu/TSGene/index.html), using the gene query tool (Zhao et al., 2016). To select tumor markers and oncogenes and the tumors in which those genes were involved, we analyzed genes with “Cancer Gene Marker Database” (Pradeepkiran et al., 2015) and “Cancer GeneticsWeb” (www.cancerindex.org/geneweb) (Klonowska et al., 2016).
Immunocytochemistry
GMSCs-p10 and GMSCs-p41 were plated on coverslips of 10 mm diameter (Thermo Scientific, Oberhausen, Germany). When cells reached a confluence of about 80%–90%, they were fixed with 4% paraformaldehyde for about 20 minutes and washed with phosphate-buffered saline (PBS, pH 7.5). Cells were incubated with 3% hydrogen peroxide (H2O2) at room temperature for 15 minutes to block the endogenous peroxidase activity, followed by three washes with PBS. Nonspecific binding sites were blocked incubating cells with horse serum +0.1% Triton X-100 for 20 minutes. Then, cells were incubated overnight at 4°C with primary antibodies against S100 (1:500; Dako), GFAP (1:100; Cell signalling), and ErbB2 (1:500; Dako).
The following day, cells were incubated with the secondary antibody biotinylated (1:200; Vector Laboratories,Burlingame, CA) and streptavidin ABComplex-HRP (ABC-kit from Dako, Glostrup, Denmark). The immunostaining was performed using the peroxidase substrate kit DAB (Vector Laboratories, Burlingame, CA) (brown color, positive staining), whereas the counterstaining was obtained by nuclear fast red (Vector Laboratories) (pink background, negative staining). The immunocytochemical assay was repeated thrice and each experimental group (GMSCs-p10 and GMSCs-p41) was plated in duplicate. Images were captured using light microscopy (LEICA DM 2000 combined with LEICA ICC50 HD camera) with an objective of 40 × .
Results
First of all, genes expressed in GMSCs-p10 and GMSCs-p41 were analyzed through GO analysis to understand in which biological processes they were involved (Fig. 1). The analysis showed that from the total of expressed genes, those involved in common tumor processes were 12,113 in GMSCs-p10 and 1500 in GMSCs-p41. Subsequently, we investigated genes involved in general tumor processes (regulation of cell proliferation, differentiation, death, and metabolic process) using “Ctd Database,” “NCBI,”and “Tumor suppressor gene database” websites. The analysis showed that genes positively correlated with tumor were 10,137 expressed only in GMSCs-p10, 120 expressed only in GMSCs-p41, 282 genes upregulated in GMSCs-p41, and 382 genes downregulated in GMSCs-p41 (Fig. 2A).
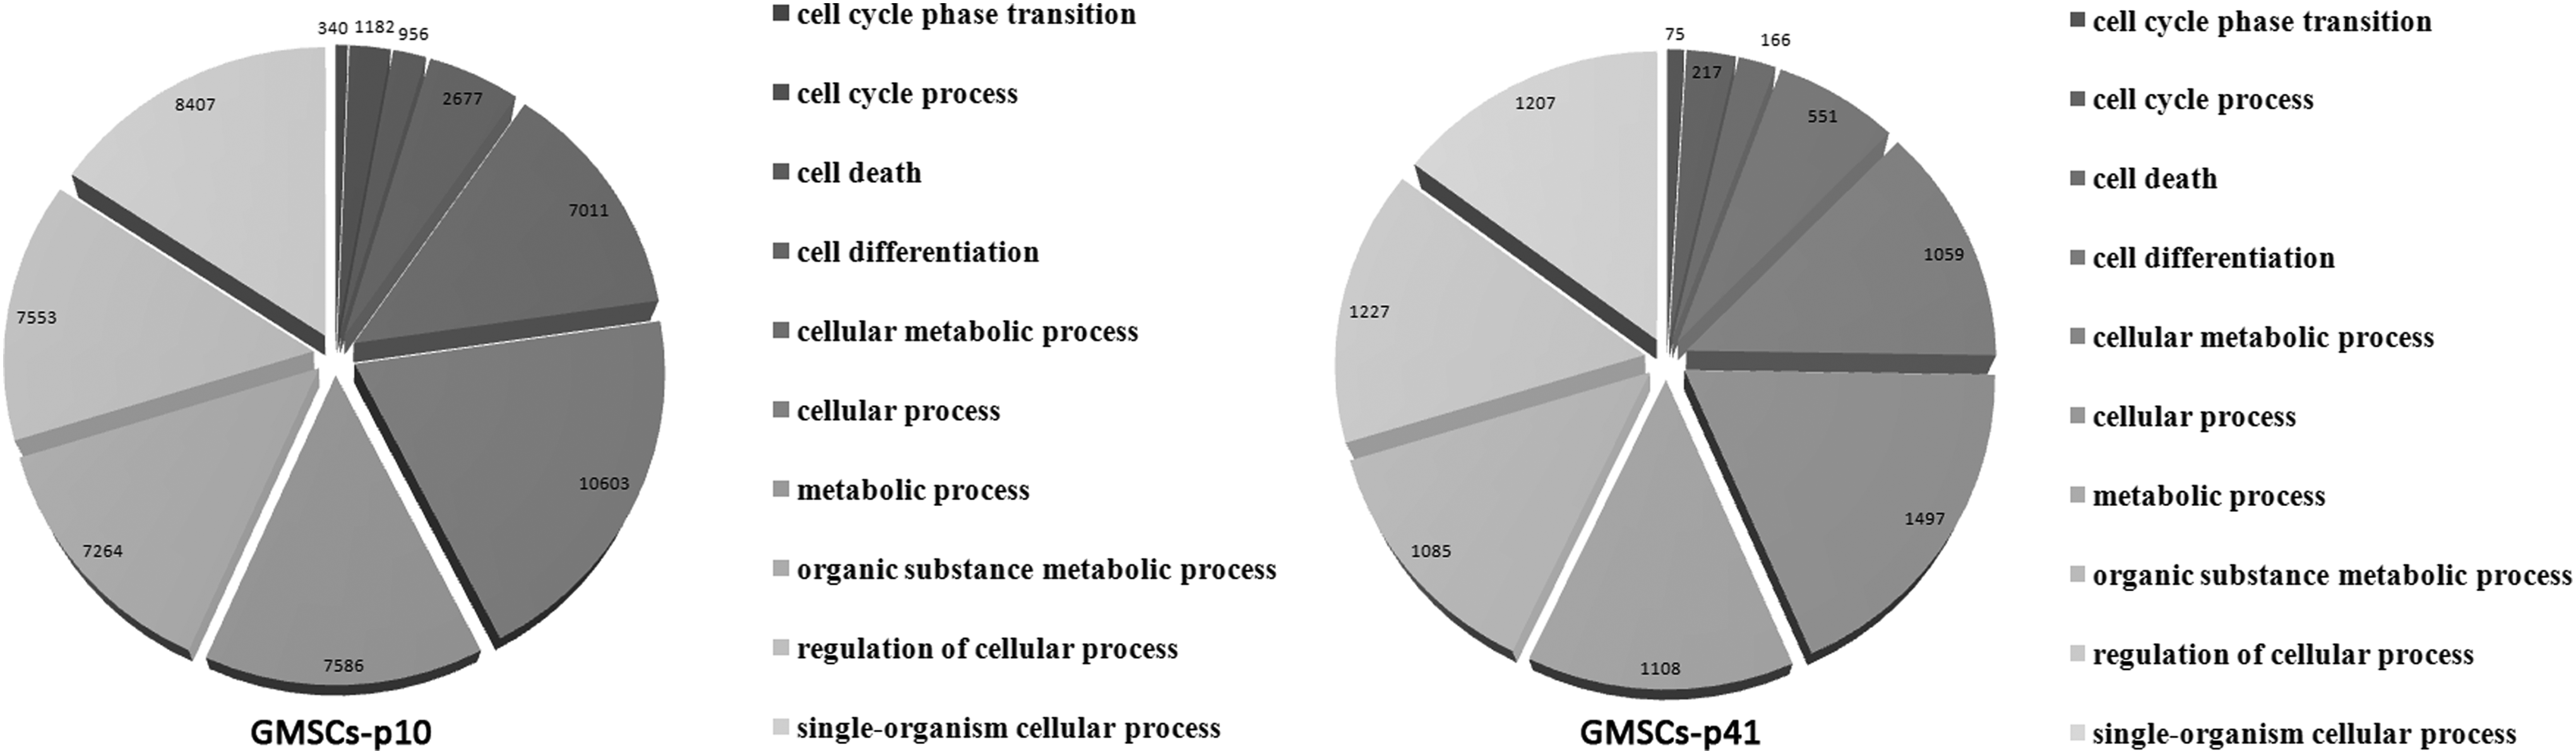
Gene ontology analysis of genes expressed in GMSCs-p10 and GMSCs-p41 and the main biological processes in which they are involved. GMSCs, gingival mesenchymal stem cells.

Genes correlated to tumor process were divided into those influencing tumor in a positive
The GO processes in which they were involved are reported in Table 1, and the main are cellular processes, metabolic processes, regulation of cellular processes, and cell differentiation. Instead, those genes that influenced tumor in a negative way were 607 expressed only in GMSCs-p10, 11 genes expressed only in GMSCs-p41, 51 genes upregulated in GMSCs-p41, and 84 genes downregulated in GMSCs-p41 (Fig. 2B). The GO processes in which genes that negatively correlated with tumor were involved are reported in Table 2, and the most represented are cellular processes and cellular metabolic processes. To understand which genes were tumor markers or oncogenes, we analyzed them with “Cancer Gene Marker Database” and “Cancer GeneticsWeb,” and focused our analysis on these genes. In this work, we only evaluated gene expression levels, so we focalized our attention on those genes reported to be aberrantly expressed in tumors.
GMSCs, gingival mesenchymal stem cells.
Among the genes expressed only in GMSCs-p10, the analysis showed that only 22 genes were tumor markers or oncogenes: CD99, SEPT9, PDGFRA, EGFR, CDK4, PDGFRB, PML, ERBB2, PLAT, ENO2, MUC1, PIP, KIT, S100A1, PDGFA, ALK, ESR1, NTRK1, POMC, CHGA, GFAP, and NTRK2 (fold change ≥0.5 log10, q-value FDR ≥0.5) (Table 3). These genes are associated with the following tumor forms: acute myeloid leukemia, astrocytoma, breast cancer, bladder cancer, colorectal cancer, gastrointestinal tumors, gastrointestinal stromal tumor, glioma and glioblastoma, nonsmall cell lung cancer (SCLC), SCLC, anaplastic large cell lymphoma, malignant melanoma, neuroblastoma, neuroectodermal cancer, neuroendocrine tumors, osteosarcoma, ovarian cancers, pancreatic tumors, prostate cancer, salivary gland cancer, skin cancer, testicular seminoma, epithelial cancer, gastric cancer, and renal carcinoma.
The fold change is expressed considered base GMSCs-p10.
Only one tumor marker was expressed in GMSCs-p41: NTRK3 (fold change ≥0.5 log10, q-value FDR ≥0.5) (Table 3), which codifies for tropomyosin-receptor-kinase (Trk) C and associated with glioblastoma and neuroblastoma.
To confirm next-generation sequencing data, we performed immunocytochemistry of S100, ErbB2, and GFAP. Immunocytochemical analysis showed that S100 and ErbB2 proteins were expressed only in GMSCs-p10, while GFAP was expressed both in GMSCs-p10 and GMSCs-p41 (Fig. 3).
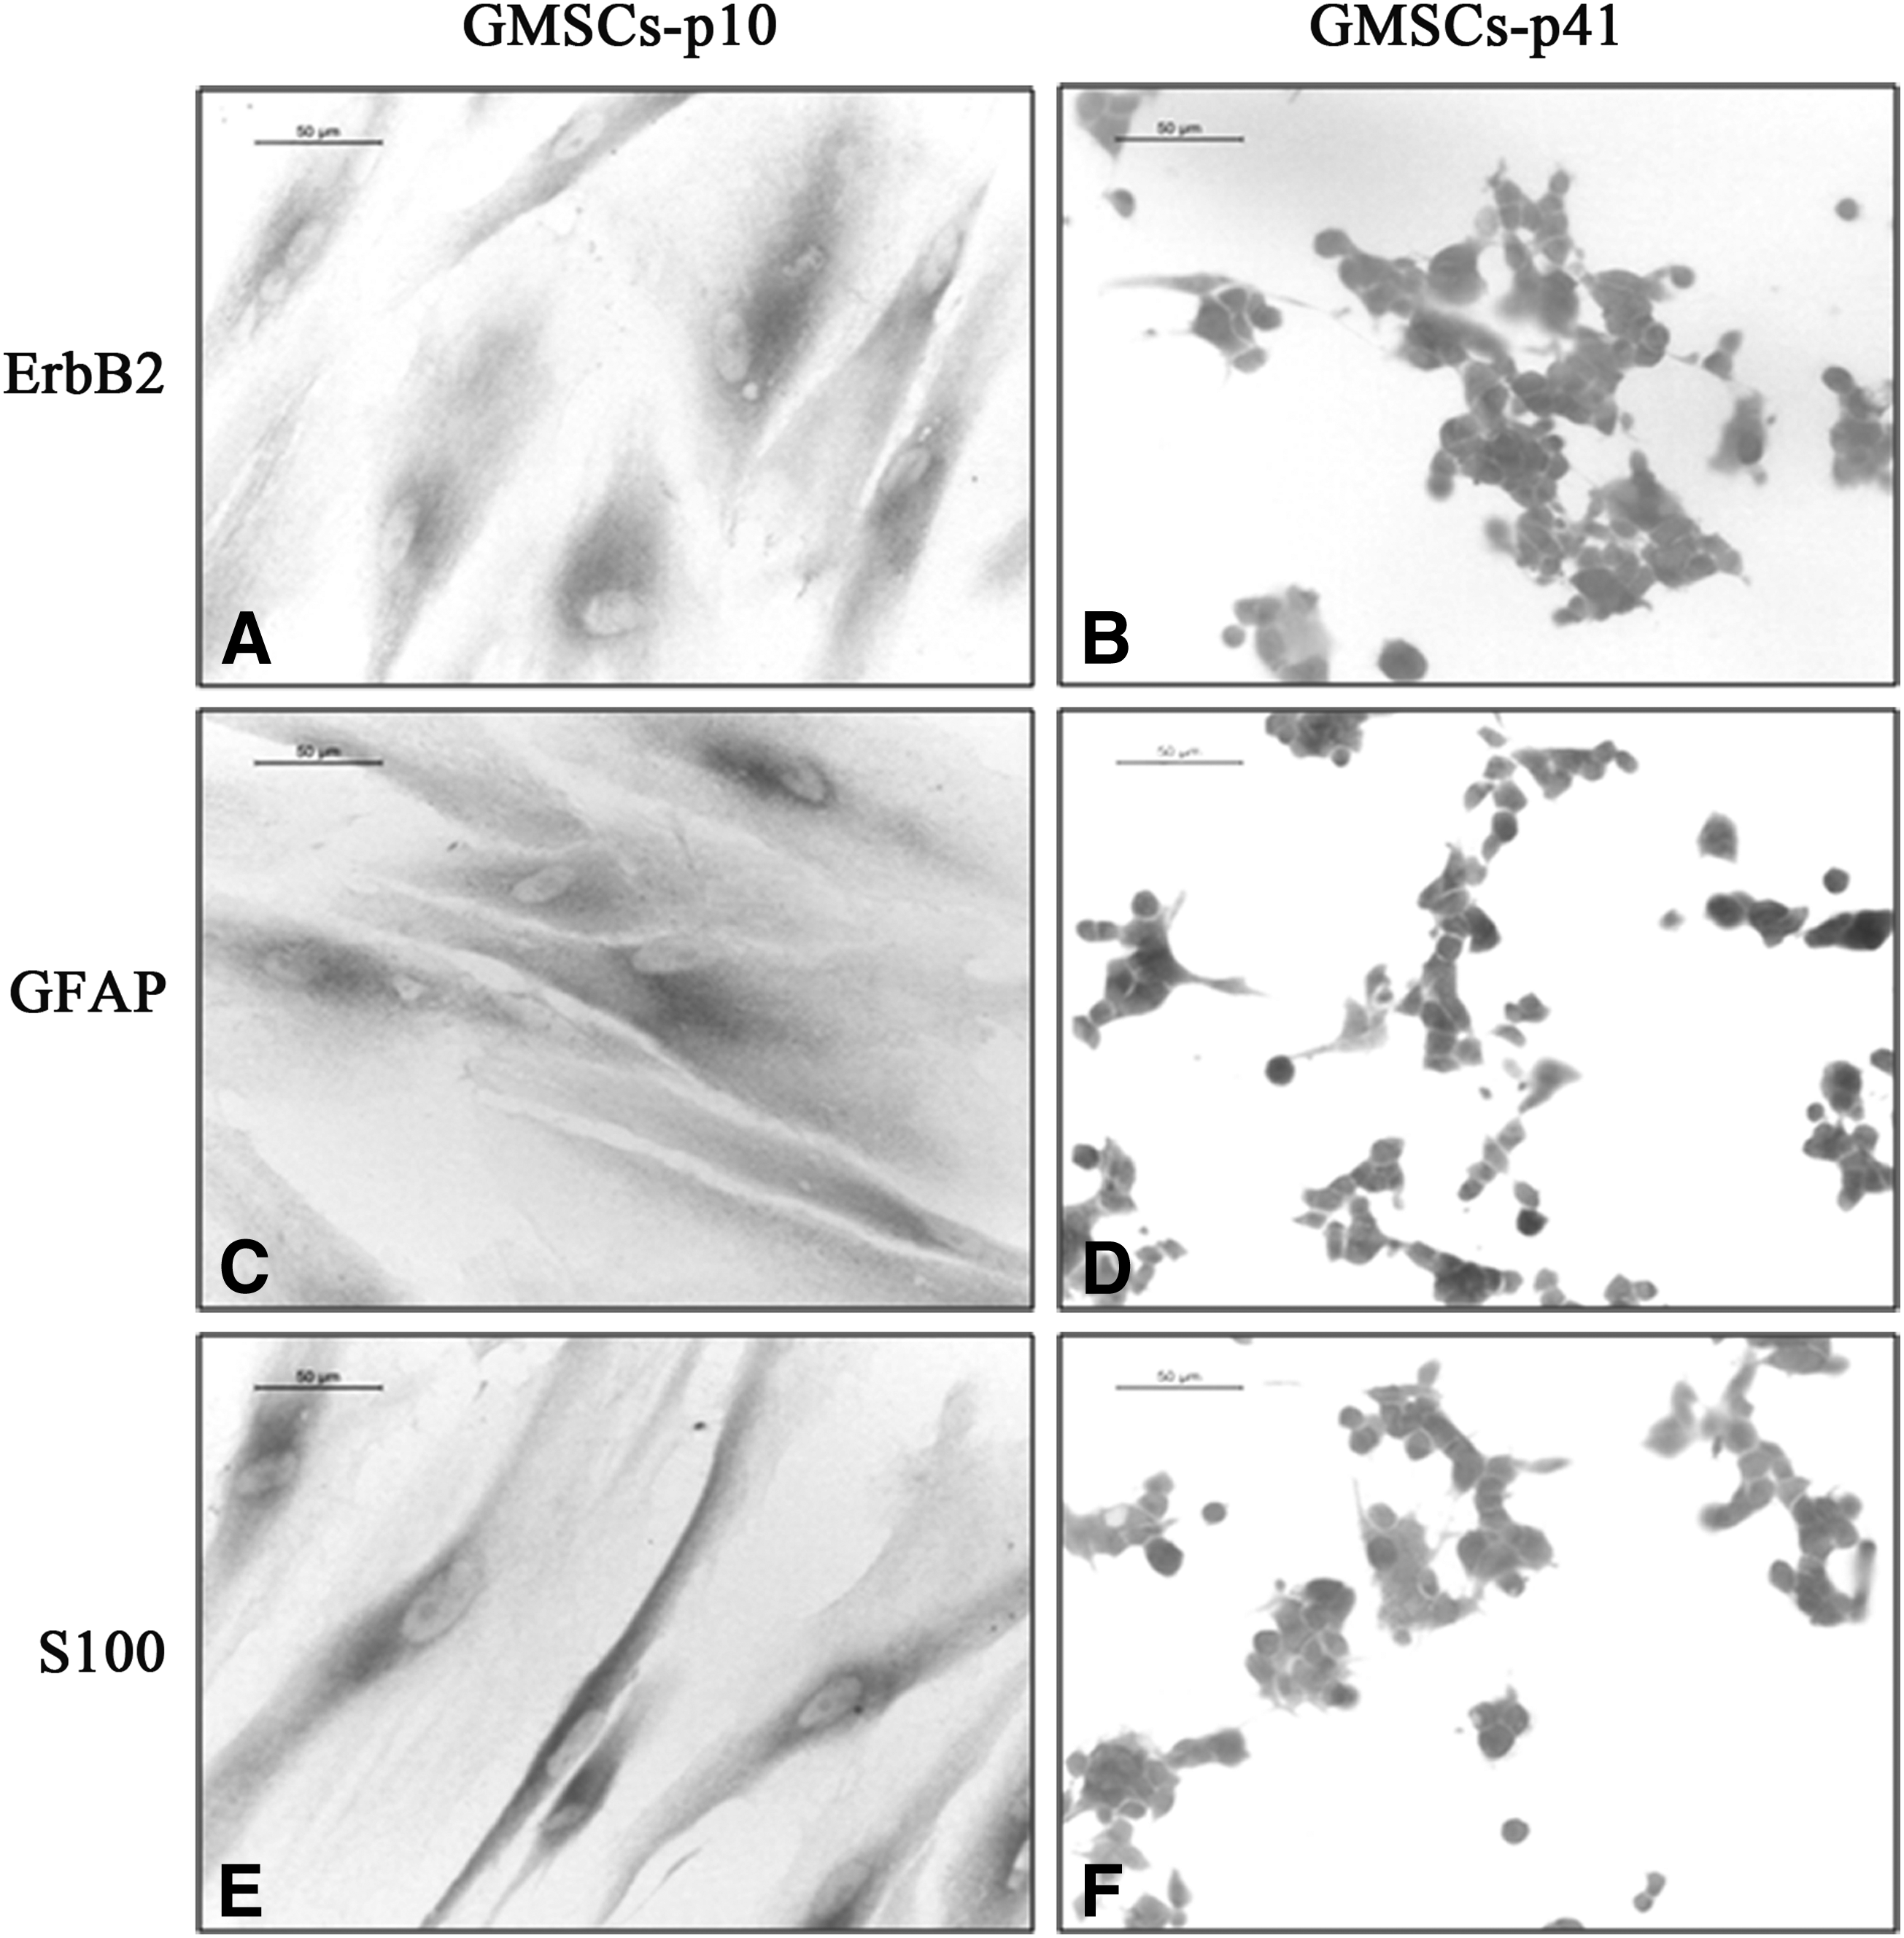
Immunocytochemistry of ErbB2, GFAP, and S100 proteins. ErbB2 protein was expressed in GMSCs-p10
Discussion
Stem cell therapy seems promising to treat different neurodegenerative diseases, where the pharmacotherapeutic options are limited or not available. However, among the risks linked with stem cell administration, one of the main is risks tumor formation, given that stem cells are able to replicate for an extended period of time. Some evidence indicated the accumulation of karyotypic defects such as aneuploidy or copy number defects in MSCs after long-term culture, but after their transplantation in animal models, no tumor growth was observed (Roemeling-van Rhijn et al., 2013; Wang et al., 2013). However, information about oncogene expression in GMSCs is not available.
In this work, we aimed to establish GMSC safety, comparing oncogene and tumor marker expression in GMSCs-p10 and GMSCs-p41. At first, through GO analysis, we selected genes involved in tumor processes and divided them in those influencing the tumor in a positive and negative way, and for each group, we divided genes differentially expressed in GMSCs-p10 and GMSCs-p41. We examined the GO processes for each group and we found that cellular processes and cellular metabolic processes were the most represented. Finally, we focused our attention on tumor markers and oncogenes. Our results showed that 22 genes were expressed only in GMSCs-p10, while only NTRK3 was expressed exclusively in GMSCs-p41.
Trk receptors are a family consisting of 3 transmembrane receptor tyrosine kinases: TrkA, TrkB, and TrkC. TrKA and TrkB are codified by NTRK1 and NTRK2, respectively. Trks bind neurotrophins, and specifically, nerve growth factor binds to TrkA, brain-derived nerve growth factor (BDNF) and neurotrophin (NT)-4 bind to TrkB, and NT-3 binds to TrkC and with a lesser extent also to TrkA and TrkB (Brodeur et al., 2009). The binding of neurotrophins to Trk induces receptor dimerization and consequently the activation of intracellular kinase signaling cascades that regulate important processes in neuronal survival, synapse development, and plasticity (Park and Poo, 2013; Reichardt, 2006). A study demonstrated that embryonic stem cells that expressed TrkA or TrkC, but not TrkB, die when the respective ligand was absent (Nikoletopoulou et al., 2010).
Moreover, it was reported that TrkB and TrkC activation mediate proliferation as well as differentiation of embryonic cortical precursors (Bartkowska et al., 2007). Overexpression of TrkA in neural stem cells increased differentiation into cholinergic neurons (Wang et al., 2015). In particular, TrkC, which we found overexpressed in GMSCs-p41, together with its ligand NT-3, takes part in the development of the nervous system, the survival and proliferation of neural precursor cells, neural differentiation and neuronal survival, and showed an elevated expression during synaptogenesis. Interestingly, neural crest cells, from which GMSCs originate, expressed both the noncatalytic and catalytic TrkC isoforms, and the binding of NT-3 induced their proliferation and neuronal differentiation (Naito et al., 2016).
Moreover, NT-3 throught TrkC receptor induced survival and neuronal differentiation in neural stem cells (Lim et al., 2007). Trks are expressed in neuroblastomas, and in particular, TrkA is highly expressed in biologically favorable neuroblastomas, and high TrkA expression in primary neuroblastomas is strongly predictive of a favorable outcome and associated with favorable clinical features. On the contrary, TrkB and its ligand BDNF are expressed at high levels in unfavorable neuroblastoma cases and their expression is highly correlated with unfavorable biological characteristics, such as invasion, metastasis, angiogenesis, drug resistance, and unfavorable outcome (Brodeur et al., 2009). In our experimental model, we observed the expression of NTRK1 and NTRK2 only in GMSCs-p10. In neuroblastoma, TrkC is expressed mainly in favorable cases (Brodeur et al., 2009).
Moreover, it was demonstrated that MSCs overexpressing TrkC migrated to NT-3-enriched areas, with important implications for MSC transplantation, since TrkC may function as a chemokine receptor, increasing both the number of migrated MSCs and the migration distance (Chen et al., 2013). Given that GMSCs-p41 showed an increased expression of TrkC compared to GMSCs-p10, we can suggest that GMSCs-p41 may present this advantage in cell therapy.
Many cellular processes, such as cell proliferation, differentiation, and migration, are regulated by growth factors that bind and activate cell surface receptors, namely receptor tyrosine kinases. Their activity is strictly controlled and regulated. Overexpression, activity alterations, or aberrant stimulation of these receptors could contribute to their constitutive activation, causing alterations in the physiological activities of cells, and may induce transformation and tumor growth. In a variety of cancers, an aberrant expression or activation of the receptor tyrosine kinases EGFR and PDGFR was reported. EGFR was involved in glioblastoma initiation and progression and receptor overexpression, or gene amplification was observed in a high percentage of glioblastoma cases (Azuaje et al., 2015).
After EGFR activation, downstream signaling cascades, in particular KRAS/BRAF/ERK/MAPK and PI3K/AKT pathways, are able to induce cell proliferation (Normanno et al., 2006). EGFR is a member of the ErbB family of proteins. The family includes also Her2 (Neu, ErbB2), Her3 (ErbB3), and Her4 (ErbB4). These receptors are also expressed in mesenchymal and neuronal cells and are involved in different cancerous processes, including proliferation, epithelial–mesenchymal transition, migration, and tumor invasion, through the modulation of components of the extracellular matrix (Appert-Collin et al., 2015). According to expression data, we observed the expression of ErbB2 protein only in GMSCs-p10.
PDGF family is formed by two receptors, PDGFR α and β, encoded by PDGFRA and PDGFRB, respectively, and four different ligands exist (PDGF-A, -B, -C, and -D). Overexpression of PDGFR or of their ligands, resulting from amplification, is frequent in gliomas, where PDGF signaling causes tumor proliferation and survival (Calzolari and Malatesta, 2010).
Another receptor tyrosine kinase is c-Kit, encoded by KIT gene, that has been involved in cancer development. c-Kit, which binds stem cell factor 1, plays a role in stem cell maintenance and differentiation. Indeed, it is expressed in stem cells and cells with self-renewal potency, and progenitor cells. Deregulation of c-Kit, mainly by overexpression and gain of function mutations, has been detected in several human cancers, even if, in several tumors, c-Kit overexpression was found without mutations (Abbaspour Babaei et al., 2016). Moreover, it was reported that c-Kit signaling may have a role in maintaining the undifferentiated state of MSCs (Suphanantachat et al., 2014).
In our results, only GMSCs-p10 expressed EGFR, ERBB2, PDGFRA, PDGFRB, PDGFA, and KIT, and given that these receptors mediate proliferation signaling and are involved in tumor growth, their absence could indicate a greater safety of GMSCs-p41 cells.
Her2, together with estrogen (ER) and progesterone receptors are usually used for breast tumor subtyping. ESR1 encoded for ERα. ER is a nuclear hormone receptor that, when bound to its ligand, acts as a transcription factor, able to mediate cell growth signaling. Estrogens, binding these receptors, are able to influence breast cancer cell proliferation and invasion (Platet et al., 2004). Moreover, ERα is known to have a role in promoting adipose tissue-derived MSC proliferation and migration (Zhang et al., 2016). In our study, we observed the expression of ESR1 only in GMSCs-p10.
Another protein involved in breast cancer is prolactin-induced protein, encoded by PIP gene. PIP is highly expressed and used as biomarker in breast cancers, where it is able to promote invasion and cell cycle progression, and regulate cell adhesion (Naderi, 2015). In our experimental study, its expression was abolished in GMSCs-p41.
Chromogranin A (CgA) and enolase 2 (ENO2) are considered biomarkers for neuroendocrine tumors (Modlin et al., 2016). ENO2 encoded the protein enolase 2, isoenzyme of the glycolytic enzyme enolase, also known as neuron-specific enolase given that it is found in mature neurons and cells of neuronal origin, where it is an index of neural maturation. It is a tumor marker for SCLC. Increased ENO2 levels in body fluids may indicate malignant proliferation and can be useful in the diagnosis of neuroendocrine tumors (Isgro et al., 2015).
CgA, encoded by CHGA gene, is a member of the granins, acidic proteins present in great quantity in neuroendocrine cells, and in some tumors. CgA is processed in different cell types to give different active peptides, such as vasostatin, pancreastatin, catestatin, and serpinins. CgA could play a role in tumor angiogenesis, vascular structure, and permeability, having protective effects on the endothelial barrier function. Blood concentration of CgA increased in cancer patients, even if high levels are found in patients with neuroendocrine tumors or tumors with neuroendocrine differentiation, and in patients with nonneuroendocrine tumors (Loh et al., 2012).
POMC, encoded proopiomelanocortin, is mainly expressed in the pituitary, hypothalamus, and skin, and is also found in neuroendocrine cells of the lung. It is the precursor of melanocortins, such as melanocyte stimulating hormones and adrenocorticotropin (Millington, 2006). In SCLC patients, high circulating levels of the neuroendocrine marker POMC correlate with a lower survival rate and liver metastasis (Stovold et al., 2013). The absence of CgA, ENO2, and POMC in GMSCs-p41 may indicate a greater safety of these cells and a lower probability of giving rise to neuroendocrine tumors.
Some proteins play a role in cancer causing an abnormal proliferation of cells. The S100 family is formed by calcium binding proteins and have been involved in different stages of tumor formation and progression. In particular, S100A1 has been implicated in the dysregulation of proliferation (Chen et al., 2014). Some data showed that it is overexpressed in breast, ovarian, and renal carcinoma, indicating it could be a marker for these tumors (Funahashi et al., 1998; Hibbs et al., 2004; Li et al., 2007). Moreover, it was suggested that both S100A1 and KIT may be used as markers for the differentiation of common subtypes of renal tumors (Li et al., 2005). Immunocytochemical analysis confirmed next-generation sequencing results, given that only GMSCs-p10 expressed S100 protein, indicating the lack of this tumor marker in GMSCs-p41. Cyclin-dependent kinase (CDK) 4, together with CDK6, plays a role in the regulation of cell proliferation, inducing the progression of cell cycle into the S phase.
During G1 phase, both CDKs are regulated by the interaction with D-type cyclins. CDK4 acts phosphorylating pRB (Kato et al., 1993). pRB binds the E2F transcription factor, limiting the transcription of cell cycle genes, but when pRB is phosphorylated by CDK4/6, it releases E2F, which in turn activates the transcription of genes required for initiation of S phase (Burkhart and Sage, 2008). It is known that this pathway is activated in a variety of cancers, and selective CDK4/6 inhibitors were developed as therapeutic strategy (Sherr et al., 2016). In this work, CDK4 was expressed only in GMSCs-p10.
Tissue plasminogen activator (tPA) is encoded by the gene PLAT and it acts by converting inactive plasminogen into active plasmin. tPA may be involved in tumor invasion and migration, given its role in the degradation of extracellular matrix (Wang et al., 2003). Indeed, t-PA expression was reported in different cancers, where t-PA is also able to induce proliferation. It was showed that tPA, through the proteolytical activation of plasmin, MMP-9, and EGF, induces the activation of the EGFR and increases proliferation through ERK1/2 kinases in pancreatic cancer cells (Hurtado et al., 2007). Mucin 1, encoded by MUC1, is a transmembrane glycoprotein, whose function in healthy tissues is the protection of the epithelia, creating a physical barrier.
Elevated MUC1 expression was observed in different tumor types and is higher during metastatic progression (Horm and Schroeder, 2013). Moreover, an aberrant glycosylated MUC1 is overexpressed in different human epithelial cancers (Lau et al., 2004) and seems to play a role in the progression of the disease. The tumor-associated MUC1 protein showed biochemical features, cellular distribution, and function different from the normal one. MUC1 mediates the production of growth factors such as PDGF-A and PDGF-B inducing proliferation, has a role in metastatic progression, and interacts with other transmembrane proteins, including ICAM-1 and the EGFR (Horm and Schroeder, 2013). On these bases, the absence of both PLAT and MUC1 in GMSCs-p41, involved in tumor proliferation, invasion, and progression, could indicate a greater security of GMSCs-p41.
ALK is a receptor tyrosine kinase initially discovered in anaplastic large cell lymphoma (ALCL) as fusion protein together with nucleophosmin (Morris et al., 1994), where its kinase domain is constitutively activated, inducing oncogenesis, through the activation of the downstream pathways. Indeed, it is able to activate numerous signaling pathways, including PI3K-AKT, MEKK2/3-MEK5-ERK5, JAK-STAT, and MAPK pathways, and was involved in different human tumors (Hallberg and Palmer, 2016). It was reported that ALK is overexpressed in human glioblastoma and the oncogenic pathway that is involved was mediated by the activation of PI3-kinase/AKT. Moreover, ALK depletion reduced tumor growth and increased survival (Powers et al., 2002). Overexpression of ALK was correlated with poor prognosis in patients with neuroblastoma (Passoni et al., 2009).
Moreover, ALK is involved in the transcription of the oncogene MYCN through the pathway ALK/PI3K/PKB/MEKK3/MEK5/ERK5 in neuroblastoma (Umapathy et al., 2014). It was observed that CD99, a cell surface glycoprotein, was expressed frequently in ALK-positive ALCL (Sung et al., 2005). CD99 is involved in leukocyte migration, T cell adhesion, ganglioside GM1 and transmembrane protein transport, and T cell death by a caspase-independent pathway. CD99 could act as an oncosuppressor in osteosarcoma (Manara et al., 2006), but CD99 was shown to be upregulated in astrocytomas, where it can enhance the infiltrative ability (Urias et al., 2014). In this work, we found the absence of these markers in GMSCs-p41.
GFAP codifies for the glial fibrillary acidic protein, a major intermediate filament protein expressed by mature astrocytes and in neural stem cells, and also expressed in astroglial tumors, including astrocytoma and glioblastoma multiforme. GFAP is detectable in the serum of many patients with glioblastoma multiforme and correlates with tumor volume and tumor necrosis volume (Jung et al., 2007). Our next-generation analysis indicated GFAP expression only in GMSCs-p10; however, immunocytochemical analysis showed the expression of GFAP protein in GMSCs at both passages. The expression of GFAP may be explained taking into account the neural crest origin of the cells and their neural differentiation potential considering that dental stem cells may express neuroglia markers even when not exposed to neural induction media (Heng et al., 2016).
SEPT9 encoded a member of the septin family, cytoskeleton proteins, which have a role in different physiological processes, including cytokinesis, chromosome segregation, DNA repair, migration, and apoptosis, but their deregulation has been found in different cancers, suggesting their involvement in tumorigenesis. In particular, SEPT9 was overexpressed in several tumors (Connolly et al., 2011a). DNA hypermethylation in the promoter of SEPT9 is considered a biomarker of colorectal cancer (Rasmussen et al., 2016). Moreover, SEPT9 was overexpressed and may be an oncogene in breast tumorigenesis (Connolly et al., 2011b). In our work, SEPT9 expression was observed only in GMSCs-p10.
The promyelocytic leukemia (PML) protein has been considered a tumor suppressor for a long time, but recent data indicated it may have a more complex role. PML was considered a tumor suppressor given that it was able to regulate the p53 activity and p53-mediated cellular processes. Interestingly, recent findings reported that PML was able to promote cell growth with benefits for tumor cells (Gamell et al., 2014). In particular, a subset of breast cancers showed higher PML levels compared to normal breast epithelium, and higher levels of PML expression were correlated with early tumor recurrence and poor prognosis (Carracedo et al., 2012). In addition, it was observed that PML was able to induce tumor progression and invasion of prostate cancer through the induction of TGF-β signaling (Buczek et al., 2016). However, we found PML gene expression only in GMSCs-p10.
In conclusion, in our study genes associated with different tumor processes, such as cell proliferation and also invasion, and tumor markers were turned off in GMSCs-p41 compared with GMSCs-p10. These data may suggest that long-term cultured MSCs may be safer, but further research on their potential for stem cell therapy are necessary.
Footnotes
Acknowledgments
This study was supported by current research fund 2016, Ministry of Health, Italy.
Author Disclosure Statement
The authors declare that no conflicting financial interests exist.