
Abstract
Abstract
Neural crest-derived mesenchymal stem cells (MSCs) obtained from dental tissues received considerable interest in regenerative medicine, particularly in nerve regeneration owing to their embryonic origin and ease of harvest. Proliferation efficacy and differentiation capacity into diverse cell lineages propose dental MSCs as an in vitro tool for disease modeling. In this study, we investigated the spontaneous differentiation efficiency of dental MSCs obtained from human gingiva tissue (hGMSCs) into neural progenitor cells after extended passaging. At passage 41, the morphology of hGMSCs changed from typical fibroblast-like shape into sphere-shaped cells with extending processes. Next-generation transcriptomics sequencing showed increased expression of neural progenitor markers such as NES, MEIS2, and MEST. In addition, de novo expression of neural precursor genes, such as NRN1, PHOX2B, VANGL2, and NTRK3, was noticed in passage 41. Immunocytochemistry results showed suppression of neurogenesis repressors TP53 and p21, whereas Western blot results revealed the expression of neurotrophic factors BDNF and NT3 at passage 41. Our results showed the spontaneous efficacy of hGMSCs to differentiate into neural precursor cells over prolonged passages and that these cells may assist in producing novel in vitro disease models that are associated with neural development.
Introduction
M
Particularly, neural crest MSCs from dental tissues attained great attention due to minimally invasive procedures to collect the oral tissues, autologous/allogeneic stem cell therapeutic options, and the ability to differentiate into different types of cells in vitro (Miran et al., 2016; Wada et al., 2009). Human dental tissue-derived neural crest MSCs have been isolated from periodontal ligament, dental pulp, gingiva, exfoliated deciduous teeth, dental follicle, and apical papilla (Sanz et al., 2015).
We and other research groups have demonstrated in vivo regenerative efficacy of dental MSCs in multiple sclerosis, dental tissue-associated diseases, muscular dystrophy, neurotrauma, myocardial infarction, and connective tissue damages (Park et al., 2016; Trubiani et al., 2016). Further, proliferation efficacy and differentiation capacity into various cell lineages proposed MSCs and induced pluripotent stem cells as a plausible tool to simulate human diseases, such as amyotrophic lateral sclerosis, frontotemporal dementia, and diabetes in in vitro level, which may provide substantial mechanistic cues regarding their pathophysiology during early developmental stage (Hedges et al., 2016; Madhira et al., 2012; Sanberg et al., 2012). Nevertheless, the application of dental MSCs as an in vitro disease model is yet to be explored.
Adult MSCs, including neural crest MSCs, have high magnitude of self-renewal and longevity capacities, and they possess inherent features that impede them from senescence (Hilton et al., 2008; Rossi et al., 2008). Moreover, adult human MSCs can spontaneously transform after long-term culture in vitro (Shiras et al., 2007). Since the neural crest is derived from the neuroectodermal layer, dental MSCs may spontaneously differentiate into neural precursor cells (NPCs), which may help to study early neural development and to simulate human nerve diseases in vitro by additional manipulations. In this study, we investigated the spontaneous transformation ability of derived MSCs human gingiva (hGMSCs) after prolonged passages. hGMSCs at passage 10 and passage 41 were investigated by using next-generation transcriptomics sequencing and immunocytochemistry to examine the markers associated with NPCs, MSCs, and other differentiated neuronal cell lineages.
Materials and Methods
Ethics statement
The protocol and informed consent from human gingival tissue explants were approved by Medical Ethics Committee at the Medical School, “G. d'Annunzio” University, Chieti, Italy (No. 266/17.04.14). The formal consent form was signed by the donors before collecting the specimen.
hGMSCs culture establishment
Gingival tissue biopsies were obtained from five healthy adult subjects with no gingival inflammation. The gingival explants were completely de-epithelialized with a scalpel for the exclusion of the most of the keratinocytes resident in the gingiva. In brief, the connective tissues were grinded, washed several times with phosphate-buffered saline (PBS; LiStarFish, Milan, Italy), and, subsequently, cultured by using TheraPEAK™MSCGM-CD™ BulletKit serum-free, chemically defined (MSCGM-CD) medium (Lonza, Basel, Switzerland). The culture medium was replaced with the fresh medium, twice a week. At 80% of confluence, spontaneously migrated cells from the explants were trypsinized with Triple Select (LiStarFish) (Trubiani et al., 2016).
In vitro passages
Human gingiva-derived MSCs (hGMSCs) were cultured in Dulbecco's modified Eagle's medium-high glucose medium (Sigma-Aldrich, Co. Ltd.) supplemented with 10% fetal bovine serum (Sigma-Aldrich Co. Ltd.). The cells were cultured in 5% CO2 and 95% air at 37°C. Experiments were performed in cells at passage number 10 (P10) and passage number 41 (P41). The experiment was separately performed in the cells obtained from each subjects. After respective passages, hGMSCs were either fixed for immunocytochemistry or immunofluorescence analyses or harvested for Western blotting and next-generation transcriptomics sequencing.
Immunocytochemistry
Cells on coverslips (10 mm; Thermo Scientific, Germany) were fixed with 4% paraformaldehyde (Santa Cruz Biotechnology, Inc., Dallas, TX) at room temperature for 15 minutes followed by 1 × PBS (pH 7.5) washes. Morphological changes in the cells were assessed by eosin/hematoxylin (E/H) staining by applying a standard protocol. Briefly, cells were fixed with 4% paraformaldehyde for 15 minutes at room temperature. After washing with 1 × PBS, cells were stained with Hematoxylin Harris (Bio-Optica, Italy) followed by Eosin (Bio-Optica). For immunocytochemical staining, paraformaldehyde-fixed cells were incubated with PBS-buffered 3% hydrogen peroxide (H2O2) for 15 minutes at ambient temperature to suppress the endogenous peroxidase activity. Then, cells were blocked with horse serum +0.1% Triton X-100 for 20 minutes at ambient temperature followed by overnight incubation at 4°C with primary antibodies against examined proteins: anti-phospho p53 (dilution 1:100; Cell Signaling Technology) and anti-p21 (dilution 1:100; Millipore).
Cells were washed with PBS and were incubated with biotinylated secondary antibody (1:200; Vector Laboratories, Burlingame, CA) and streptavidin ABComplex-HRP (ABC-kit from Dako, Glostrup, Denmark). The immunostaining was performed with peroxidase substrate kit DAB (Vector Laboratories) (brown color; positive staining) and counterstained with nuclear fast red (Vector Laboratories) (pink background; negative staining). Microscopy was accomplished by using light microscopy (LEICA DM 2000 combined with LEICA ICC50 HD camera). The immunocytochemistry was repeated thrice, and each experimental group was plated in duplicate. All images are representative of three independent experiments.
Immunofluorescence staining and confocal laser scanning microscope analysis
Cells at P10 and P41 were fixed and treated as described by Diomede et al. (2017). Samples were incubated with rabbit primary monoclonal antibody, anti-Nestin (1:100; Sigma-Aldrich, Milan, Italy), anti-GAP43 (1:500; Sigma-Aldrich), and anti-BDNF (1:50; Santa Cruz Biotechnology, Inc.) followed by anti-rabbit Alexa Fluor 568 (Molecular Probes, Life Technologies, Monza, MI, Italy). All samples were incubated with Alexa Fluor 488 phalloidin green fluorescence conjugate (1:200), as a marker of the cytoskeleton actin and with TO-PRO staining to highlight the nuclei. Samples were observed by using a CLSM (Zeiss LSM800; Zeiss, Jena, Germany), equipped with a Plan Neofluar oil-immersion objective (63 × /1.3 NA). Images were collected by using an argon laser beam with excitation lines at 488 nm and a helium-neon source at 543 and 633 nm.
Line profile and co-localization analysis were performed offline on images acquired at a resolution of 1024 × 1024 pixel at 12 bit (4096 gray values) by using Zen2010 software (Zeiss). The immunofluorescence assay was repeated thrice, and each experimental group was plated in duplicate. All images are representative of three independent experiments.
Western blotting
Cells were harvested and lysed in cold extraction buffer (10 mM Tris-HCl, pH 7.4, 0.32 M sucrose, 1 mM EGTA, 5 mM NaN3, 10 mM 2-mercaptoethanol, 2 mM EDTA, 50 mM NaF, protease inhibitor tablets [Roche Applied Science, Monza, Italy]). Cell lysates were centrifuged at 1000 g for 10 minutes at 4°C, and the supernatant was used for cytosolic proteins. Protein concentration was calculated with Bio-Rad Protein Assay kit (Bio-Rad, Segrate, Italy). Bovine serum albumin was used for the preparation of protein standard solution. Proteins were resolved by sodium dodecyl sulfate–polyacrylamide gel electrophoresis (SDS-PAGE) and were blotted by using polyvinylidene fluoride membranes (Immobilon-P Transfer membrane; Millipore).
Membranes were blocked with 5% skimmed milk for 45 minutes at room temperature and were incubated with primary antibodies for overnight at 4°C. The primary antibodies used were: BDNF (brain derived neurotrophic factor) (dilution 1:250; Santa Cruz Biotechnology, Inc.), Iba1 (dilution 1:500; Abcam). Then, the membranes were incubated with appropriate horseradish peroxidase (HRP)-conjugated secondary antibodies (dilution 1:2000; Santa Cruz Biotechnology, Inc.) for 1 hour at room temperature. HRP-conjugated GAPDH (dilution 1:1000; Cell Signaling Technology) or β-actin (1:500; Santa Cruz Biotechnology, Inc.) was used to assess homogenous loading of protein samples. Enhanced chemiluminescence system kit (Luminata Western HRP Substrates; Millipore) was used to visualize the protein bands. Protein bands were acquired, and relative expression of protein expression was quantified with ChemiDoc™ MP System (Bio-Rad) and ImageJ software, respectively. The statistical analysis was calculated from representative blots of three separate experiments.
RNA sequencing and library preparation
Total RNA was extracted with a Reliaprep RNA Cell Miniprep System (Promega). RNA sequencing and library preparation was performed as reported by Rajan et al. (2017). RNA sequencing libraries were synthesized by using TruSeq RNA Access library kit (Illumina, Inc., San Diego, CA) in accordance with the protocol provided by the manufacturer. Then, 50 ng of total RNA samples was fragmented at 94°C for 8 minutes on a thermal cycler. First-strand complementary DNA (cDNA) was synthesized with random hexameres and SuperScript II Reverse Transcriptase (Invitrogen) by using a temperature profile as follows: 25°C for 10 minutes, 42°C for 15 minutes, and 70°C for 15 minutes. Then, the RNA templates were removed to synthesize second-strand cDNA. Second replacement strand was prepared by incorporating dUTP in the place of dTTP. Blunt-ended cDNA was removed from the second-strand reaction mix by using AMPure XP beads (Beckman Coulter).
Subsequently, the 3′ ends of the cDNA were adenylated for adaptor ligation. Once indexing adaptors were ligated at both ends, the libraries were cleaned up with AMPure XP beads. Then, adapter-linked DNA fragments were amplified by using a temperature profile as follows: 98°C for 10 seconds, 60°C for 30 seconds, and 72°C for 30 seconds (15 cycles).
After validation of the libraries, exome capture probes were used to perform the first hybridization step. A 2-plex library pool was prepared (200 ng of each DNA library) before hybridization. The following temperature profile was used for hybridization: 18 cycles of 1 minute incubation, initial temperature of 94°C; 2°C was decreased per cycle. Probes hybridized with the target regions were collected by using magnetic beads coated with streptavidin. Then, the libraries were eluted from the magnetic beads and were processed for the second hybridization step (temperature profile as mentioned earlier for the first hybridization step) to ensure greater region specificity.
Hybridized probes with the target regions were captured by using streptavidin-coated beads, and libraries were eluted from the beads. Before second polymerase chain reaction (PCR) amplification, enriched libraries were cleaned up by using AMPure XP beads. The following temperature profile was used for the second PCR amplification step: 98°C for 10 seconds, 60°C for 30 seconds, and 72°C for 30 seconds (10 cycles). After another wash with AMPure XP beads, the libraries were quantified with KAPA Library Quantification Kit—Illumina/ABI Prism® (Kapa Biosystems, Inc., Wilmington, MA). Agilent High-Sensitivity DNA Kit was used for validation. DNA fragments were noticed in the range of 200–650 bp, and a peak was observed around 250 bp. For each group, two replicates were used.
Libraries were normalized to 12 pM and subjected to cluster, and single read sequencing was performed for 150 cycles on a MiSeq instrument (Illumina, Inc.), according to the manufacturer's instructions. For clustering, the libraries were loaded on a MiSeq Flow Cell v3. Clustered libraries were then sequenced by using a MiSeq Instrument (Illumina).
Data processing and statistics
Reads were divided into specific samples and groups of the indexes by using demultiplexing software tool CASAVA (version 1.8.2; Illumina). Each sample was mapped against its reference sequences “Homo sapiens UCSC hg19” by using RNA-Seq Alignment version 1.0.0 with its default parameters. In particular, TopHat 2 (Bowtie 1) was used for the Read mapping. For each sample, the FPKM (fragments per kilobase of exon per million reads mapped) values were calculated from each annotated gene by using their normalized reads count [(1000 × read count) ÷ (number of gene covered bases × number of mapped fragments in million)]. Unmapped reads were removed, retaining only read pairs with both reads aligned to the reference sequences “Homo sapiens UCSC hg19.”
The samples were comparatively analyzed by using a scatter plot of the Log2 of the FPKM. The median of the number of reads was 16833447, and the percentage of reads was ∼96.48% that aligned the human genome HG-37. The statistical analyses on the read counts were performed with The Cufflinks Assembly & DE package version 2.0.0 to determine the proportion of differentially expressed genes between two samples for a false discovery rate (FDR; Q)-value <0.05. For Western blot, relative expression of proteins was statistically calculated by using the unpaired t-test. p-Value less than 0.05 was considered statistically significant.
Gene ontology enrichment analysis (www.geneontology.org/page/go-enrichment-analysis) and Neural Stem Cell Institute based CORTECON website (http://cortecon.neuralsci.org) were approached to screen marker genes associated with NPCs, MSCs, and other differentiated neuronal cell lineages differentiation/development.
Results
Prolonged in vitro passages induce morphological changes in hGMSCs
We noticed remarkable morphological differences between hGMSCs at P10 and P41. E/H staining showed typical morphology of fibroblast-like spindle-shaped hGMSCs at P10 (Fig. 1A). On the contrary, most of hGMSCs at P41 displayed contracted, spherical-shaped morphology with multipolar and extending processes (Fig. 1B). These results clearly indicate that extensive in vitro passages induce spontaneous differentiation in hGMSCs.
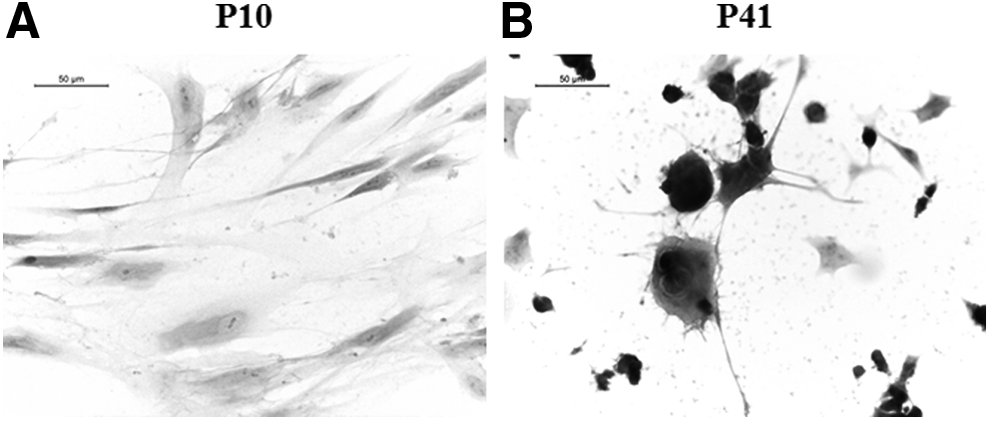
Prolonged in vitro passages induce morphological changes in hGMSCs. Representative E/H staining images of hGMSCs at passage 10 (P10)
MSCs markers are absent in spontaneously differentiated hGMSCs
Next, we analyzed the expression of MSCs markers. Next-generation transcriptomics sequencing data showed that MSCs markers were not expressed in P41 hGMSCs. Transcripts of MSCs markers such as CD13 (also called as alanyl aminopeptidase [ANPEP]), CD44, CD73 (also called as 5′-nucleotidase ecto [NT5E]), CD90 (also called as Thy-1 cell surface antigen [THY1]), CD105 (also called as endoglin [ENG]), CD166 (also called as activated leukocyte cell adhesion molecule [ALCAM]), and major histocompatibility complex HLA-ABC were present in P10 hGMSCs but were absent in P41 hGMSCs. Relative FPKM values of P10 and P41 cells, and Log10-fold change in P41 cells for the expression of MSCs markers are shown in Figure 2A and B, respectively.

MSCs markers are absent in spontaneously differentiated hGMSCs. Next-generation transcriptomics sequencing data showed that transcripts of MSCs markers ANPEP (CD13), CD44, NT5E (CD73), THY1 (CD90), ENG (CD105), ALCAM (CD166), and major histocompatibility complex HLA-ABC were present in P10 hGMSCs but were absent in P41 hGMSCs. Relative FPKM values of P10 and P41 cells, and Log10-fold change in P41 cells for the expression of MSCs markers are shown in
Spontaneous differentiation induces NPCs markers expression and neurogenesis-linked genes expression in hGMSCs
Then, we investigated the expression analysis of genes linked with NPCs differentiation. Next-generation transcriptomics sequencing results demonstrated that hGMSCs at P41 significantly expressed genes associated with NPCs differentiation and neural development. Particularly, gene ontology enrichment analysis revealed significant activation of neuronal differentiation-associated gene ontology processes, including nervous system development, neurogenesis, neuron projection morphogenesis and development, and neuron cell–cell adhesion (Table 1; FDR value <0.005). NGS results showed significant modulation of genes linked with NPCs and neuronal cells development and differentiation (Fig. 3).
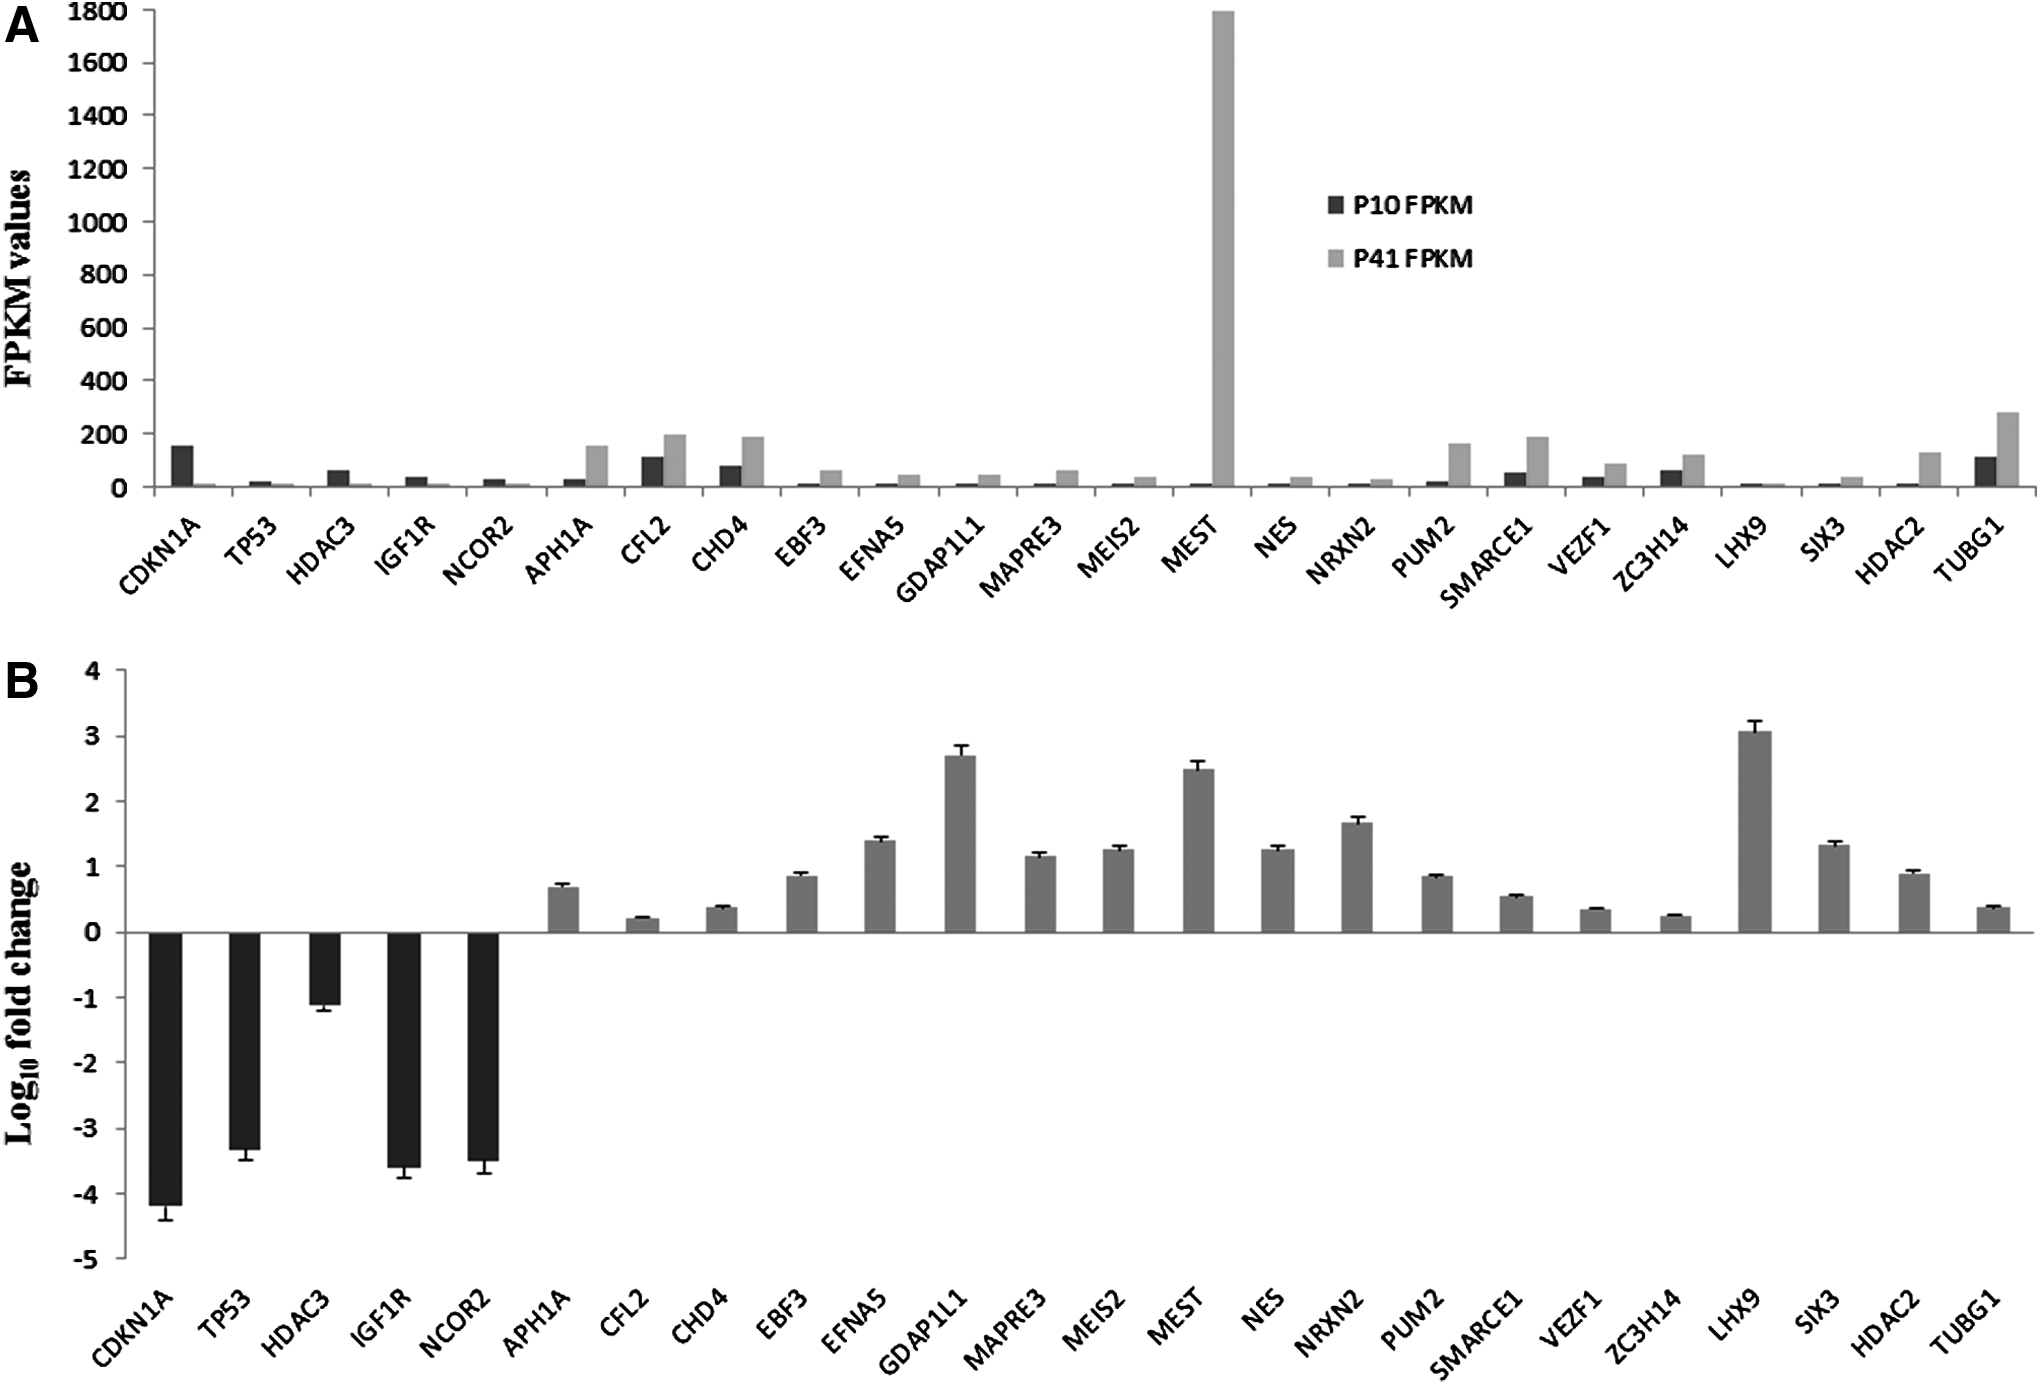
Spontaneous differentiation induces NPCs markers expression and neurogenesis-linked gene expression in hGMSCs. Next-generation transcriptomics sequencing results showed increased expression of NPCs markers and neurogenesis-associated genes in hGMSCs at P41 than at P10. Relative FPKM values of P10 and P41 cells and Log10-fold change in P41 cells for the expression of NPCs markers and genes linked with neuronal cells differentiation are shown in
Significant modulation of genes linked with nervous system development-linked gene ontology processes was observed in hGMSCs at P41. FDR <0.05.
FDR, false discovery rate; hGMSCs, human gingiva derived mesenchymal stem cells.
Specifically, NPCs markers such as Nestin (NES), musashi RNA binding protein 2 (MSI2), Meis homeobox 2 (MEIS2), neurexin 2 (NRXN2), SIX homeobox 3 (SIX3), and gene transcripts linked with neuronal cells development such as ephrin A5 (EFNA5), ganglioside-induced differentiation-associated protein 1 like 1 (GDAP1L1), microtubule-associated protein RP/EB family member 3 (MAPRE3), mesoderm specific transcript (MEST), and LIM homeobox 9 (LHX9) were expressed greater than 1-fold (Log10-fold change) at P41 (Q < 0.05). Other NPCs markers such as aph-1 homolog A, gamma-secretase subunit (APH1A), early B-cell factor 3 (EBF3), pumilio RNA binding family member 2 (PUM2), SWI/SNF-related, matrix-associated, actin-dependent regulator of chromatin, subfamily e, member 1 (SMARCE1), histone deacetylase 2 (HDAC2), and neuronal cells differentiation-linked genes such as cofilin 2 (CFL2), chromodomain helicase DNA binding protein 4 (CHD4), vascular endothelial zinc finger 1 (VEZF1), zinc finger CCCH-type containing 14 (ZC3H14), and tubulin gamma 1 (TUBG1) were expressed greater than 0.2-fold but less than 1-fold in hGMSCs at P41 (Q < 0.05).
Interestingly, genes involved in the suppression of neuronal cells development, including cyclin-dependent kinase inhibitor 1A (CDKN1A), tumor protein p53 (TP53), histone deacetylase 3 (HDAC3), insulin-like growth factor 1 receptor (IGF1R), and nuclear receptor corepressor 2 (NCOR2), were significantly downregulated (more than onefold) in p41 hGMSCs (Q < 0.05). Relative FPKM values of P10 and P41 cells and Log10-fold change in P41 cells for the expression of NPCs markers and genes linked with neuronal cells differentiation are shown in Figure 3A and B, respectively. We have confirmed the results of TP53 and CDKN1A by immunocytochemistry analyses. We have noticed negative staining of proteins p53 and p21 (encoded by genes TP53 and CDKN1A, respectively) in hGMSCs at P41 (Fig. 4B and D, respectively). On the contrary, hGMSCs at P10 showed marked staining of p53 and p21 (Fig. 4A and C, respectively).
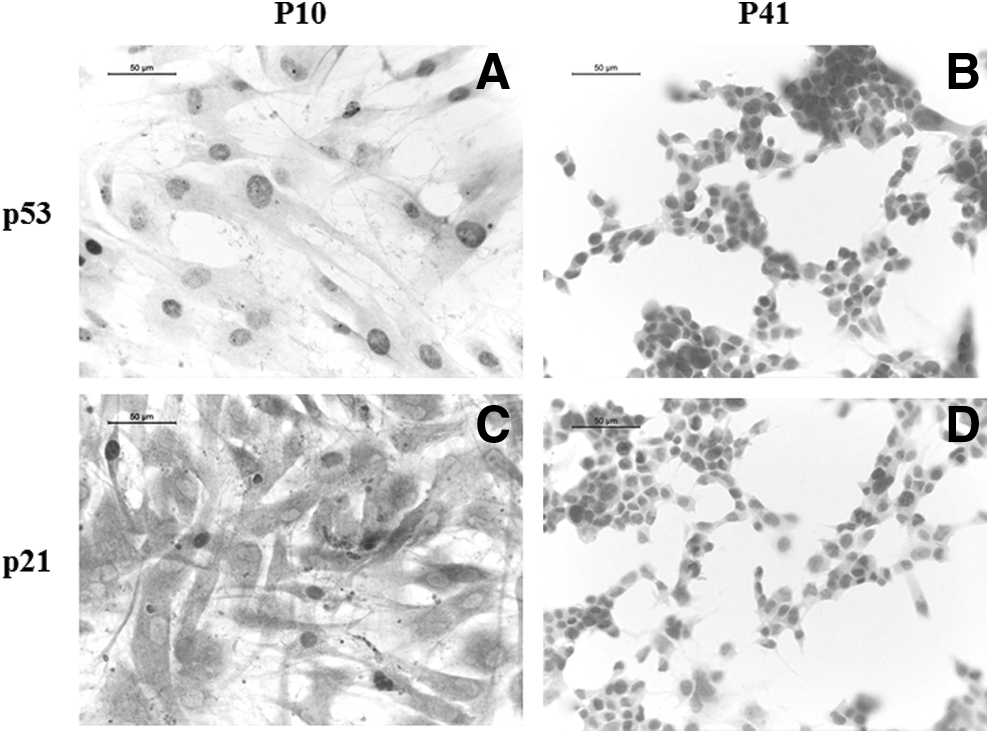
Immunocytochemistry evaluation for p53 and p21. Representative images displayed marked positive staining for negative regulators of neurogenesis TP53 encoded p53
Expression of markers of differentiated neurons, astrocytes, Schwann cells, oligodendrocytes, and microglia
Later, we analyzed the expression of markers of differentiated cells such as neurons, astrocytes, Schwann cells, oligodendrocytes, and microglia in P10 and P41 hGMSCs (Fig. 5). Next-generation transcriptomics sequencing data showed that mature neuron marker disks large MAGUK scaffold protein 4 (DLG4), Schwann cell marker growth-associated protein 43 (GAP43), and oligodendrocyte marker myelin basic protein (MBP) were markedly increased in P41 hGMSCs than in P10 hGMSCs (Q < 0.05). On the other hand, immature neuron marker tubulin beta 3 class III (TUBB3) and microglia marker CD68 were significantly downregulated in P41 cells when compared with P10 cells (Q < 0.05).
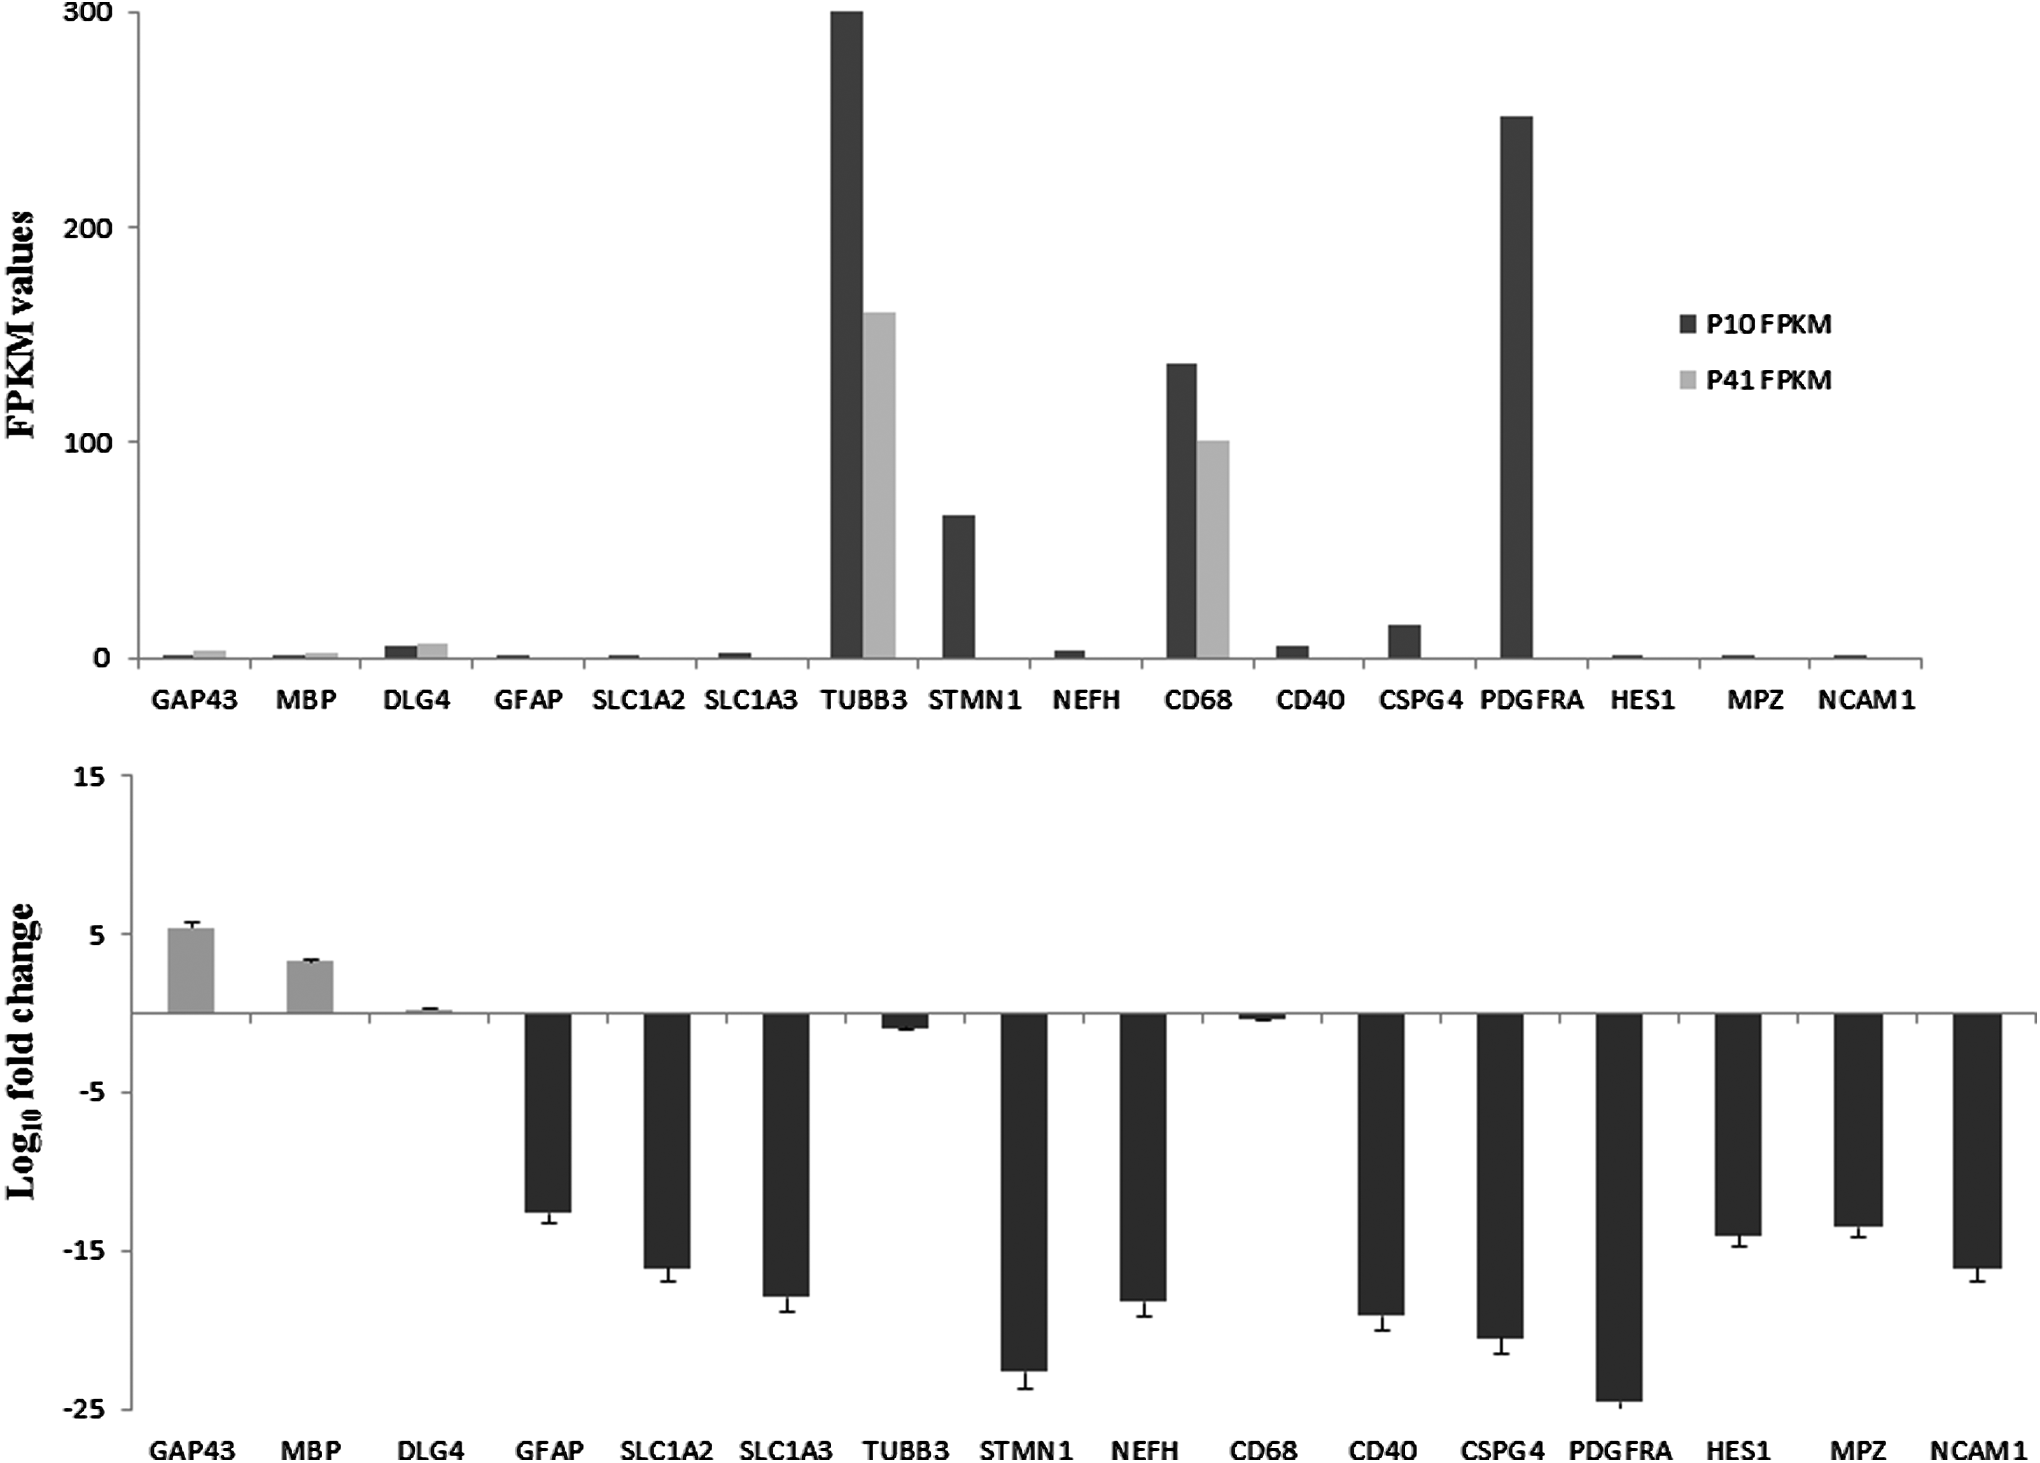
Expression of markers of differentiated neurons, astrocytes, Schwann cells, oligodendrocytes, and microglia. Relative FPKM values of P10 and P41 cells and Log10-fold change in P41 cells for the expression of markers of differentiated cells are shown in
However, several other differentiated cell markers were expressed only in P10 cells but not in P41 cells. Immature neuron marker stathmin 1 (STMN1), mature neuron marker neurofilament heavy (NEFH), radial glial marker hes family bHLH transcription factor 1 (HES1), oligodendrocyte markers chondroitin sulfate proteoglycan 4 (CSPG4), platelet-derived growth factor receptor alpha (PDGFRA), astrocyte markers glial fibrillary acidic protein (GFAP), solute carrier family 1 member 2 (SLC1A2), solute carrier family 1 member 3 (SLC1A3), Schwann cell markers myelin protein zero (MPZ), neural cell adhesion molecule 1 (NCAM1), and microglia marker CD40 were expressed in P10 hGMSCs but not in P41 hGMSCs. Relative FPKM values of P10 and P41 cells and Log10-fold change in P41 cells for the expression of markers of differentiated cells are shown in Figure 5A and B, respectively. To further confirm our results, we have performed immunofluorescence analysis for the expression of Nestin, neurotrophin BDNF, and GAP43. Immunofluorescence data revealed marked cytoskeleton actin reorganization at the periphery of the cell membrane in P41 cells when compared with P10 cells. Mild expression of Nestin, BDNF, and GAP43 was noticed in P10 hGMSCs (Fig. 6A, E and I, respectively). On the contrary, increased levels of Nestin, BDNF, and GAP43 were observed in P41 hGMSCs (Fig. 7A, E and I, respectively; p < 0.0001 vs. P10 cells).
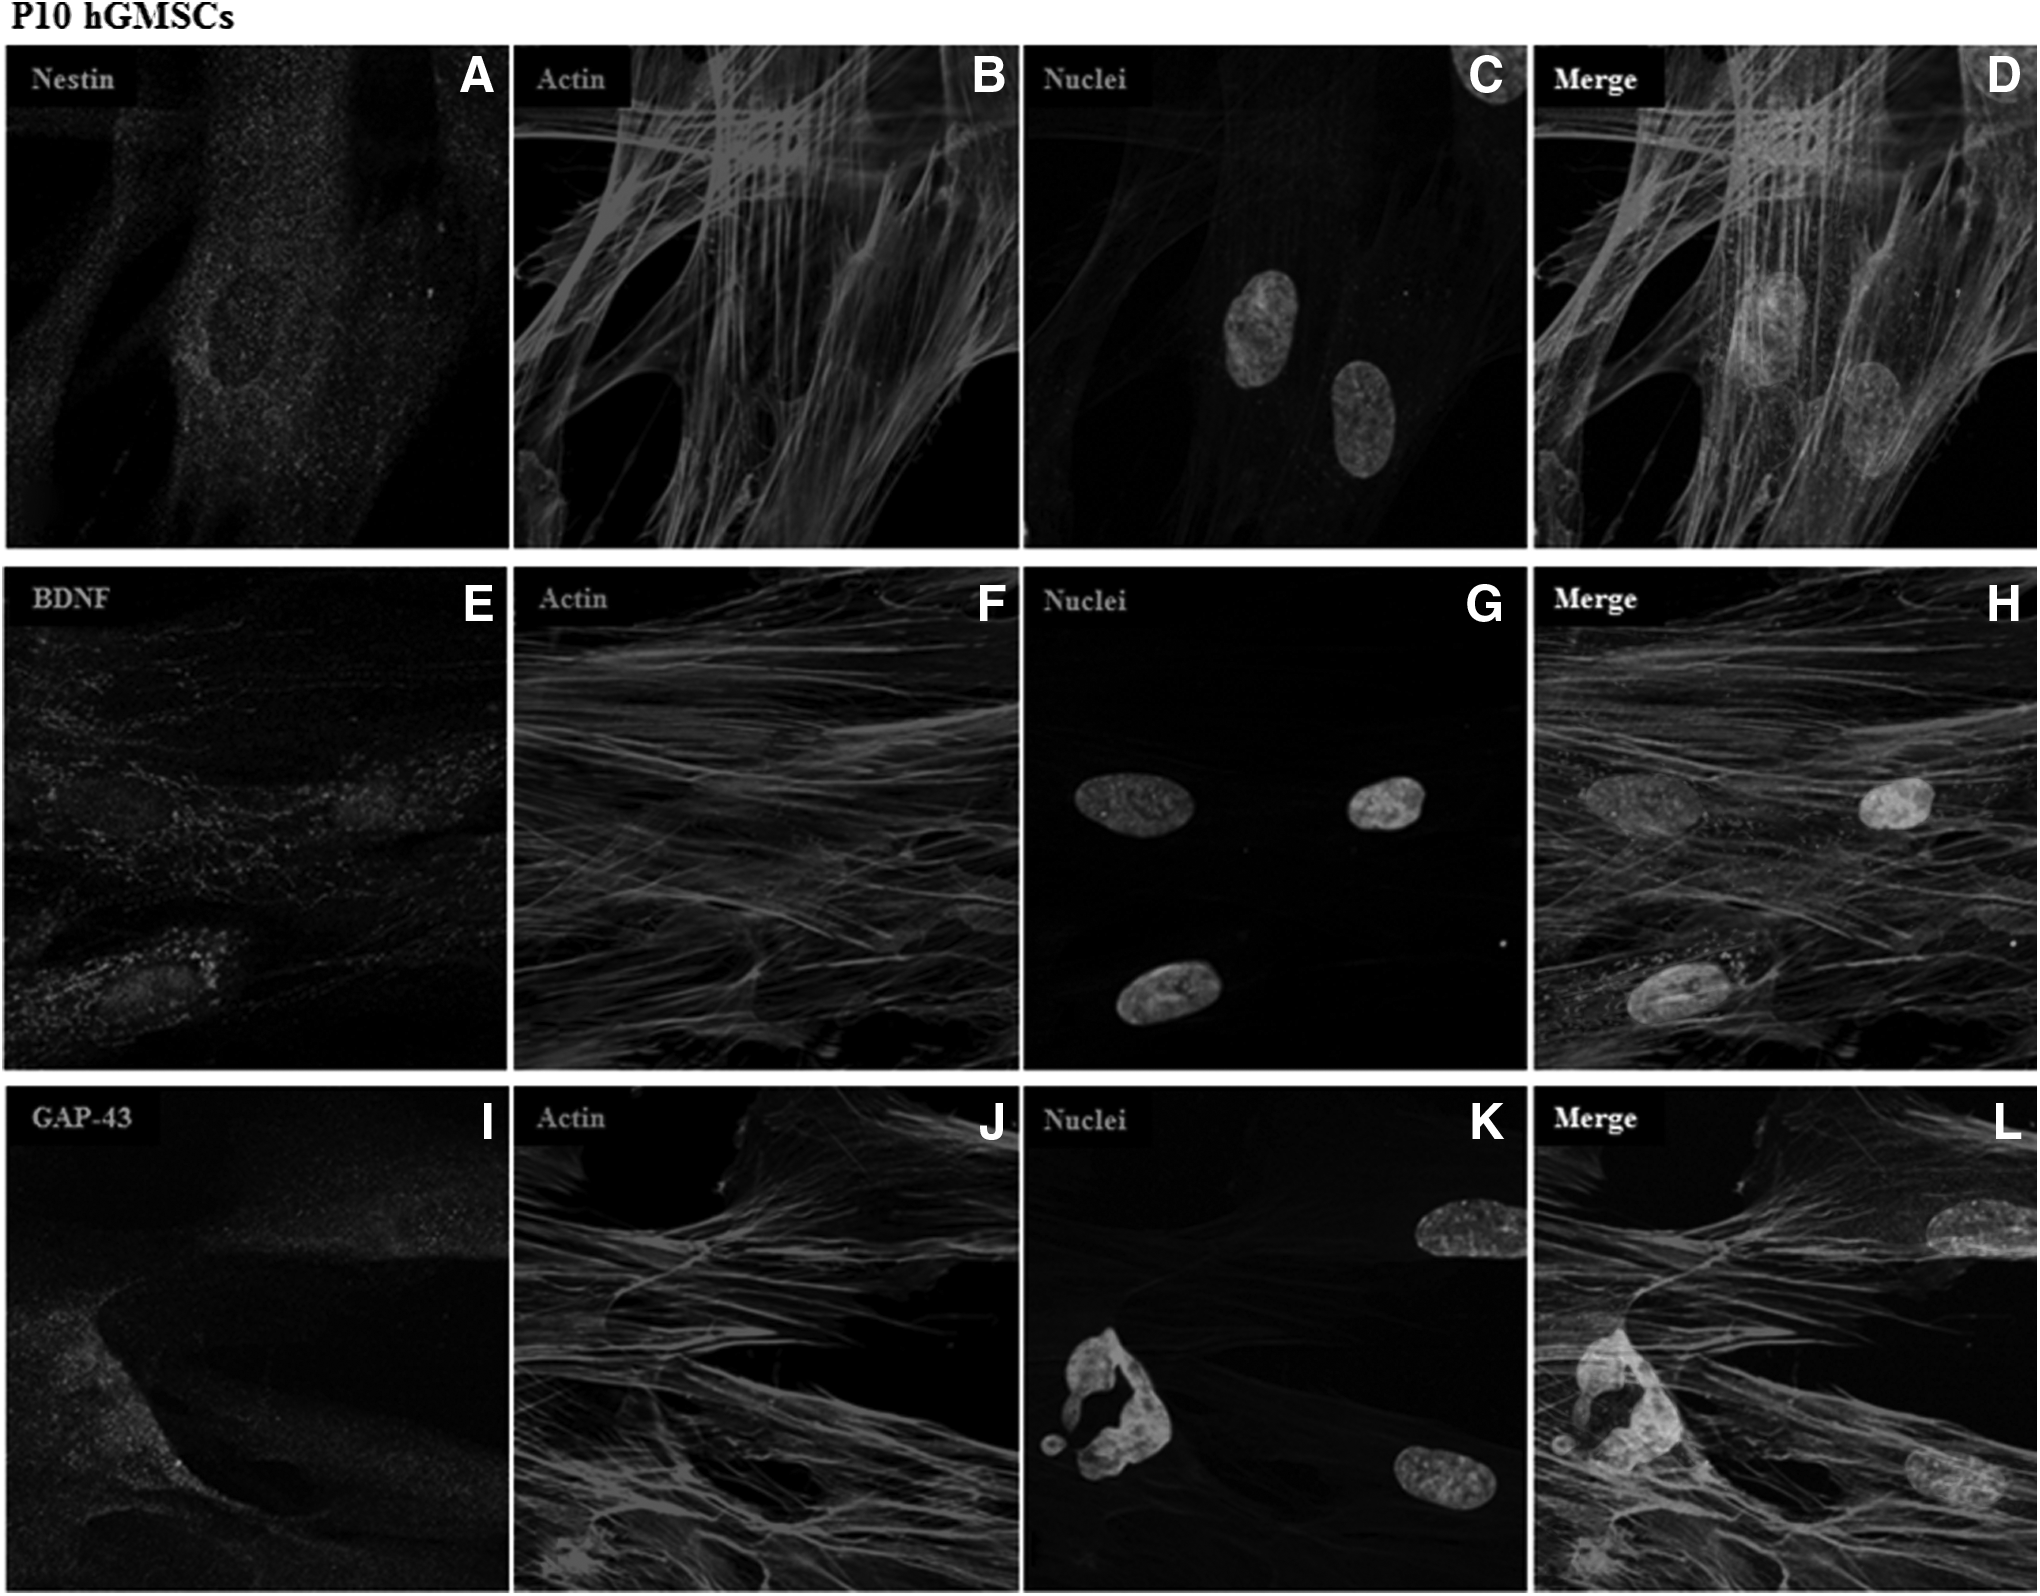
Immunofluorescence expression of Nestin, BDNF, and GAP43 in P10 hGMSCs. Expression and localization of Nestin, BDNF, and GAP43 in P10 hGMSCs. Nuclei stained with TO-PRO in
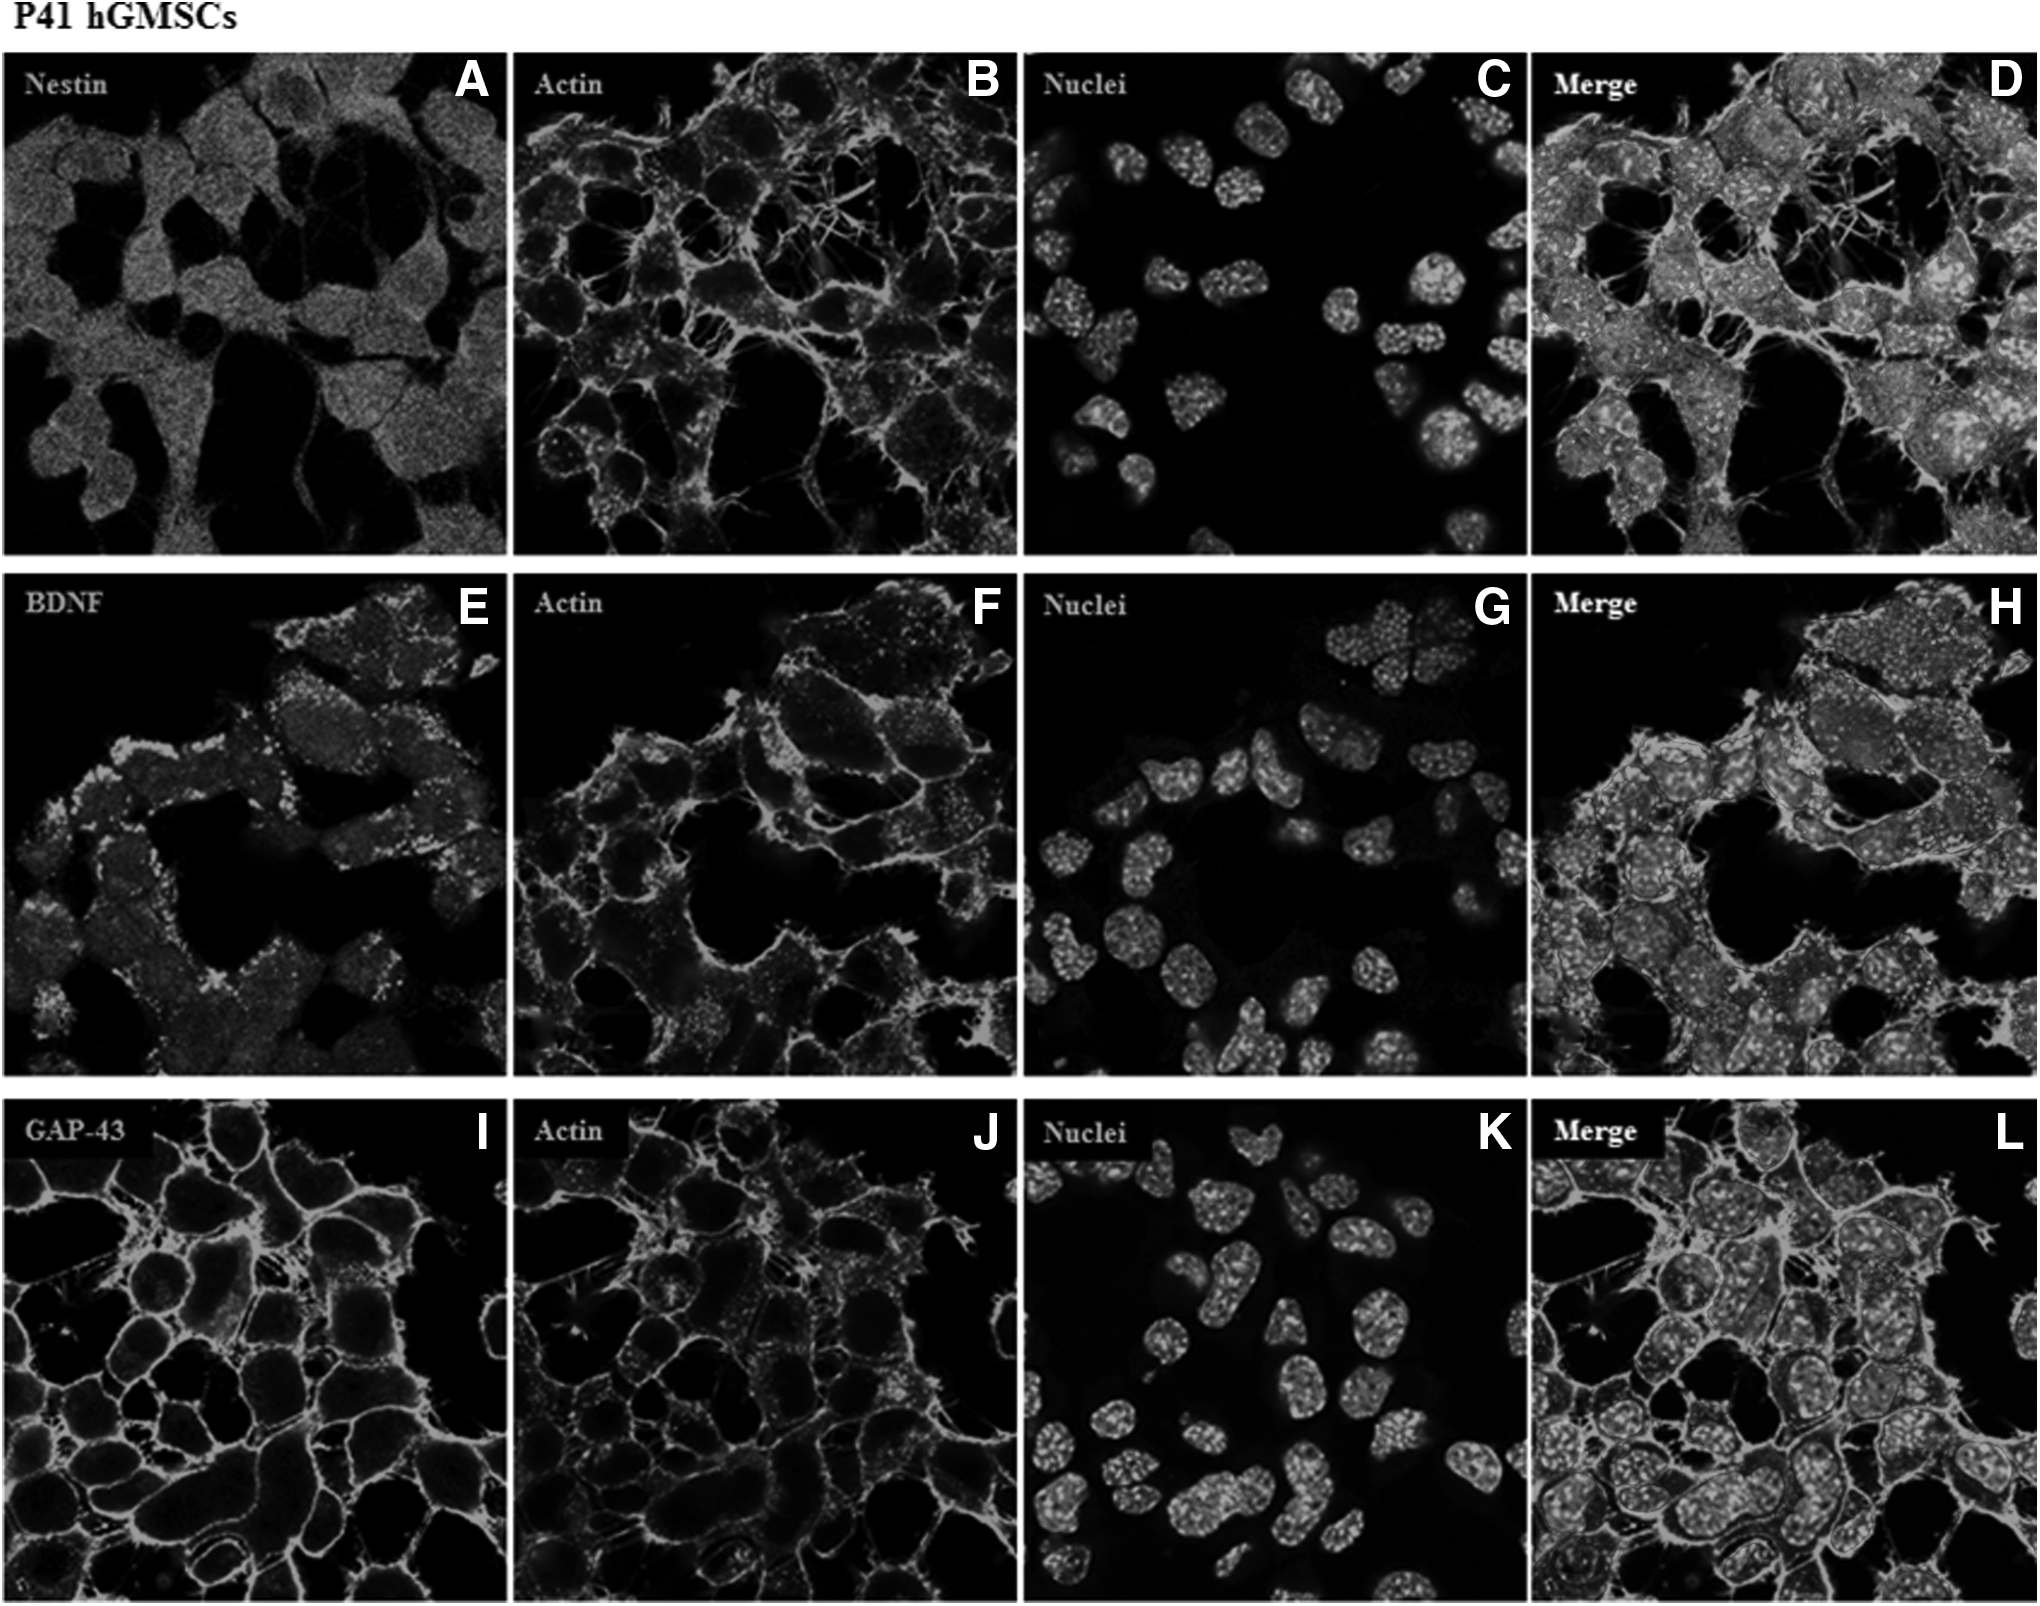
Immunofluorescence expression of Nestin, BDNF, and GAP43 in P41 hGMSCs. Expression and localization of Nestin, BDNF, and GAP43 in P41 hGMSCs. Nuclei stained with TO-PRO in
Moreover, P41 cells appeared with several morphological changes, lower dimension, and different distribution when compared with cells at P10. Densitometric analysis of the percentage of positive staining is shown in Figure 8. In addition, Western blot data displayed significant upregulation of BDNF (Fig. 9A; p = 0.0016) and NT3 (Fig. 9B; p = 0.0018 in P41 hGMSCs). A significant amount of microglial marker Iba1 was noticed only in P41 hGMSCs (Fig. 9C; p = 0.0013), whereas another glial marker xCT transporter was undetectable in both P10 and P41 (data not shown). Altogether, these data suggested that most of the spontaneously differentiated P41 hGMSCs cells were NPCs whereas few cells might have been partially differentiated into neurons, Schwann cells, oligodendrocytes, and microglia.
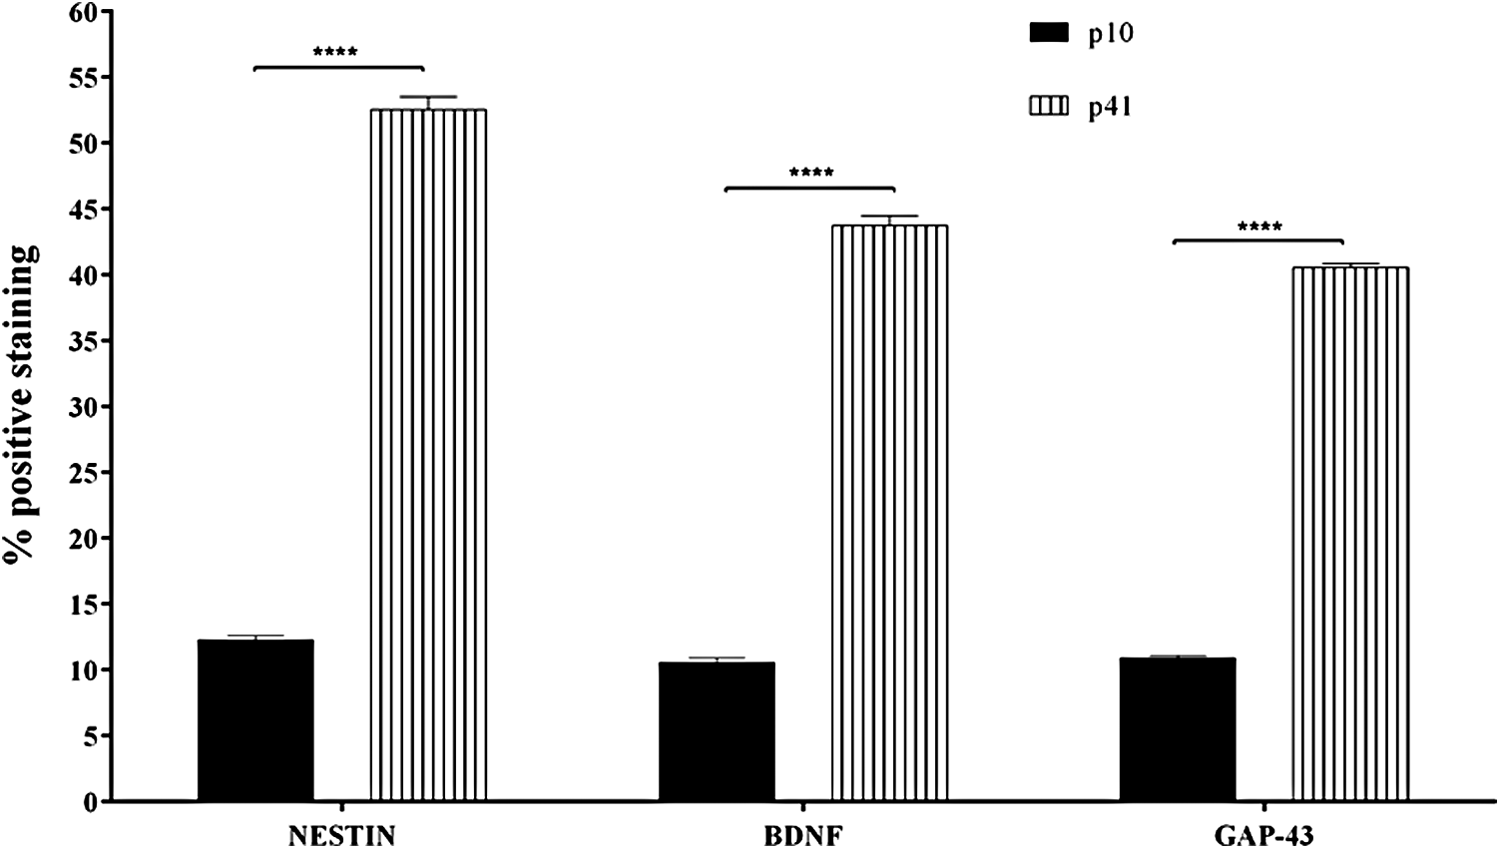
Densitometric analysis of Nestin, BDNF, and GAP43 in P10 and P41 hGMSCs. Densitometric analysis of the percentage of positive staining was quantified by using unpaired t-test. ****p < 0.0001.
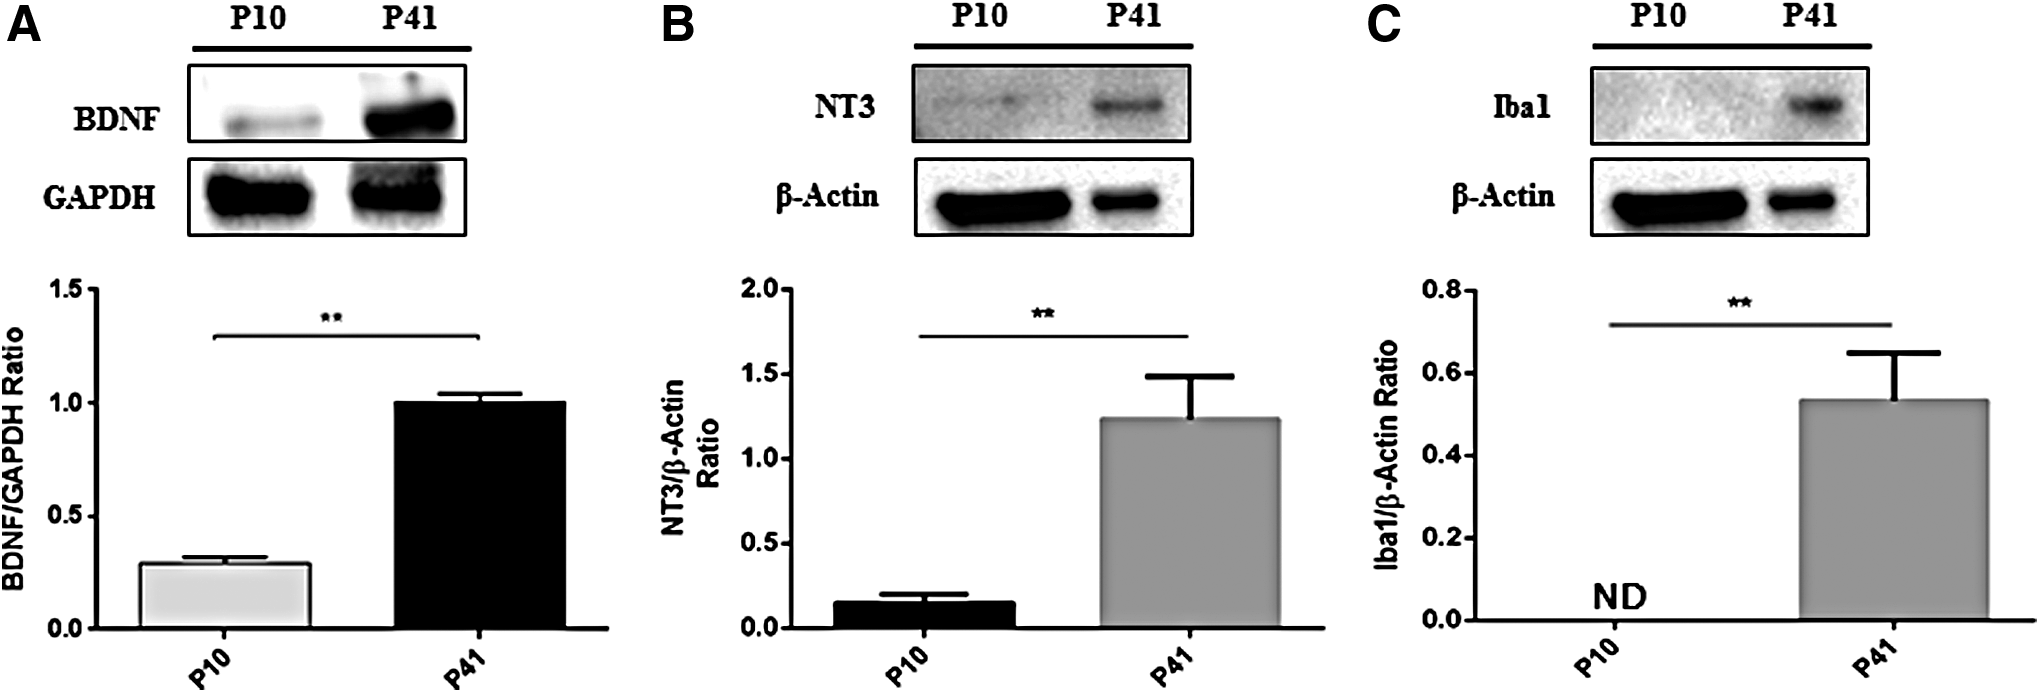
Western blot analysis for BDNF, NT3, and Iba1. Western blot analysis showed significant upregulation of neurotrophic factors BDNF
Spontaneously differentiated hGMSCs express de novo neurogenesis-linked genes
Next-generation transcriptomics sequencing results also showed the presence of de novo genes in hGMSCs at P41. Specifically, neurogenesis-associated genes homeobox A2 (HOXA2), neuritin 1 (NRN1), neurotrophic receptor tyrosine kinase 3 (NTRK3), protocadherin 1 (PCDH1), paired-like homeobox 2b (PHOX2B), proteolipid protein 1 (PLP1), and VANGL planar cell polarity protein 2 (VANGL2) were remarkably expressed (Log10-fold change ≥3) in P41 hGMSCs, but not in P10 hGMSCs (Fig. 10). Relative FPKM values of P10 and P41 cells and Log10-fold change in P41 cells for the de novo expression of genes linked with neurogenesis are shown in Figure 10. These data propose that long-term cultured hGMSCs required the expression of additional novel genes related to neurogenesis to induce the differentiation toward NPCs.
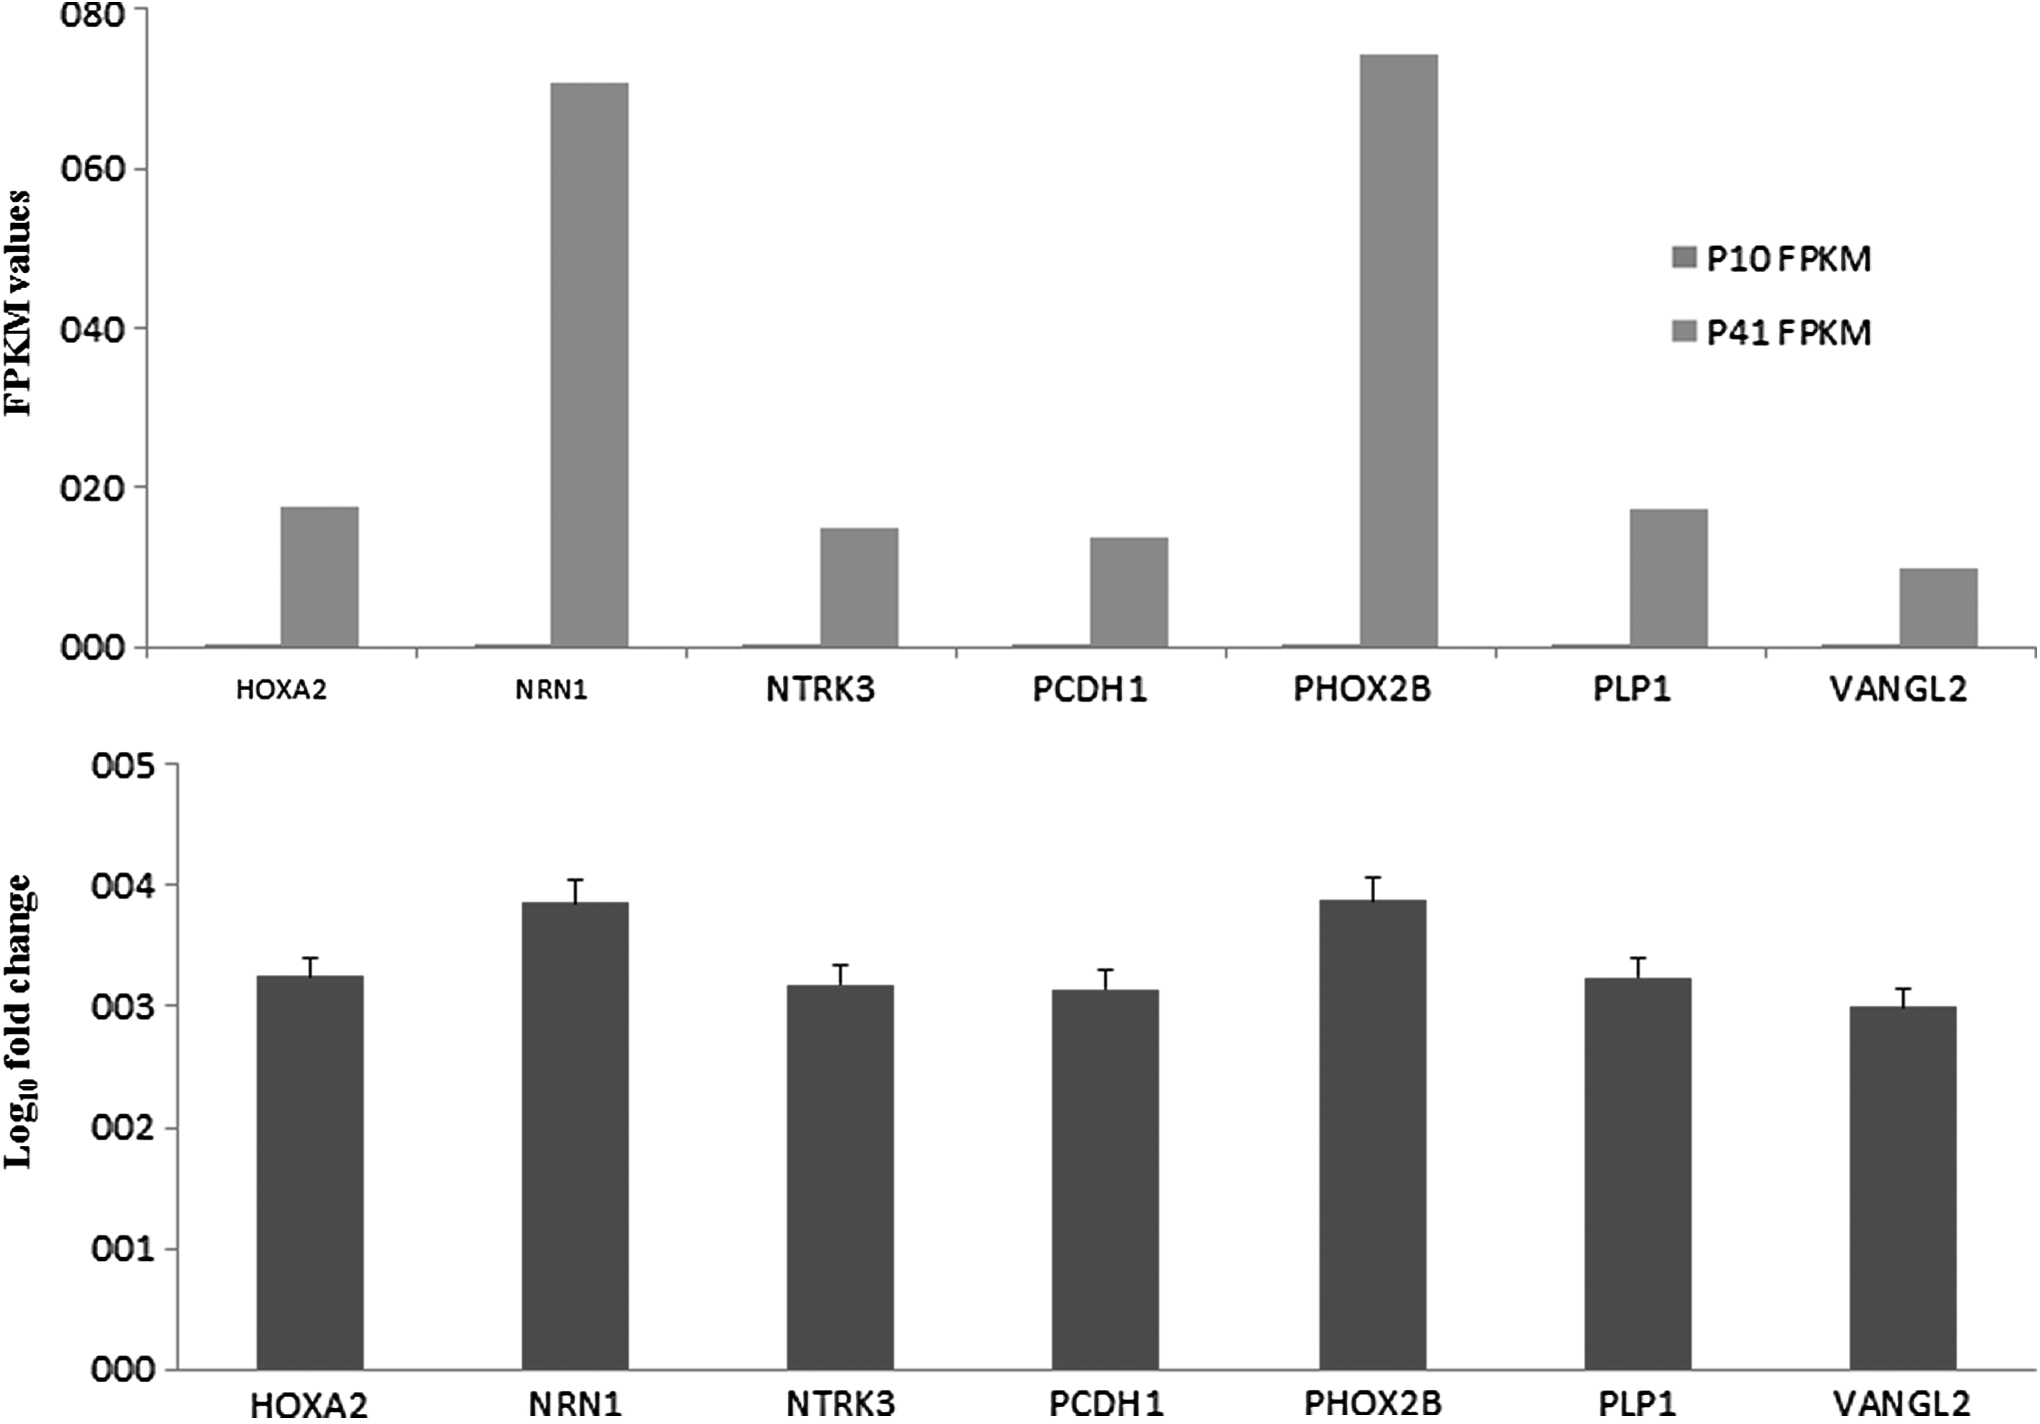
Spontaneously differentiated hGMSCs express de novo neurogenesis-linked genes. Next-generation transcriptomics sequencing results revealed the expression of de novo genes in hGMSCs at P41. Neurogenesis-associated genes HOXA2, NRN1, NTRK3, PCDH1, PHOX2B, PLP1, and VANGL2 were remarkably expressed greater than 3-fold (Log10-fold change) in P41 hGMSCs, but not in P10 hGMSCs. Q < 0.05.
Discussion
Human oral tissues, including periodontal ligament, dental pulp, gingiva, and exfoliated deciduous teeth, have been successfully explored to harvest MSCs and a growing amount of studies on diverse in vivo models reported the therapeutic efficacy of dental MSCs (Park et al., 2016; Sanz et al., 2015). Adult MSCs have extensive self-renewal, longevity, and differentiation capacities in vitro, which may aid in understanding the pathophysiology of human diseases at the developmental stage (Sanberg et al., 2012). Spontaneous in vitro transformation of human MSCs after extended passages has been previously reported (Shiras et al., 2007).
Considering the neuroectodermal origin of neural crest dental MSCs, in this study, we investigated whether prolonged culture of hGMSCs may spontaneously differentiate into NPCs. We extended the passage upto 41 and compared the morphological and transcriptomics differences with those of P10. hGMSCs at P10 displayed typical MSCs appearance with fibroblast-like and spindle-shape morphology, whereas hGMSCs at P41 exhibited a completely different shape with contracted spherical shape morphology and multipolar and extending processes, suggesting the spontaneous differentiation toward NPCs.
Similar neuron-like morphological changes have been noticed in differentiated MSCs obtained from dental pulp (Zainal Ariffin et al., 2013), amniotic fluid (Tsai et al., 2006), and bone marrow (Munoz-Elias et al., 2003); however, in these studies, neuronal differentiation was induced by means of culturing the MSCs in serum-deprived medium or neural induction medium and not by spontaneous transformation.
Then, we examined the expression of MSCs markers in P10 and P41 hGMSCs. NGS data showed that MSCs markers, including CD13, CD44, CD73, CD90, CD105, CD166, and HLA-ABC, were present in P10 hGMSCs but were absent in P41 hGMSCs. These data suggested that P41 hGMSCs were not MSCs. Next, we evaluated the genes related with NPCs in P10 and P41. Gene ontology enrichment processes analysis showed significant modulation of expression of genes associated with neural progenitor differentiation. Next-generation transcriptomics sequencing results showed that NPCs markers such as NES, MSI2, MEIS2, NRXN2, SIX3, APH1A, EBF3, PUM2, SMARCE1, and HDAC2 were markedly elevated in P41 hGMSCs. Expression of NES and MSI2 has been observed in NPCs (Lendahl et al., 1990; Sakakibara et al., 2001). Meis homeodomain transcription factors regulate cell proliferation and differentiation during development and that MEIS2 is required by subventricular zone progenitors to acquire a general neuronal fate (Agoston et al., 2014).
Indeed, enhanced expression of MEIS2 has been found in human embroyonic neural stem cells and olfactory bulb-derived neural stem cells (Marei et al., 2012). Cell adhesion protein NRXN2 was increased in P41 hGMSCs. NRXN2 upregulation has been noticed in murine NPCs (Gurok et al., 2004). SIX3 expression has been observed in retinal NPCs generated from human pluripotent stem cells (Barnea-Cramer et al., 2016). A regulatory role of APH1A, EBF3, PUM2, SMARCE1, and HDAC2 in neural stem cells and neuronal projection has been previously demonstrated (Kazantseva et al., 2009; MacDonald and Roskams, 2008; Marei et al., 2012; Vessey et al., 2012; Wang et al., 2004). Our data support these studies, suggesting NPCs differentiation ability of hGMSCs over extended passages.
Moreover, marked expression of gene transcripts linked with neuronal cells development such as EFNA5, GDAP1L1, MAPRE3, LHX9, CFL2, VEZF1, ZC3H14, and TUBG1 was noticed in P41 cells. These results are in parallel with the previous findings. Deletion of EFNA5 showed impaired hippocampal neurogenesis in mice (Hara et al., 2010). Bardy et al., in their recent study, selected GDAP1L1 as a potential in vitro neurophysiological biomarker to isolate highly functional live human neurons (Bardy et al., 2016).
Based on this report, we assume that prolonged passages might induce spontaneous neuronal cells-like differentiation in hGMSCs since increased expression of GDAP1L1 was detected in P41. LIM homeobox genes control developmental processes, such as cell fate specification and growth. The role of LHX9 in neuronal development has been reported in mouse embryonic stem cells (Abranches et al., 2009) and in zebrafish embryos (Peukert et al., 2011). ZC3H14 was notably elevated in P41 hGMSCs. RNA regulatory role of ZC3H14 in the nervous system cells of humans and Drosophila melanogaster has been reported earlier (Kelly et al., 2012). The pivotal role of TUBG1 in fetal brain development has been previously reported, (Wise et al., 2000). CORTECON platform for a temporal transcriptome analysis of in vitro human cerebral cortex development suggested that CFL2 and VEZF1 genes might be involved in neuronal differentiation.
Interestingly, we noticed significant elevation of negative regulator of human adipocytes differentiation MEST (Karbiener et al., 2015) and astroglial differentiation inhibitor CHD4 (Sparmann et al., 2013) in P41 hGMSCs. On the contrary, genes involved in the negative regulation of NPCs differentiation and neurogenesis were significantly reduced. Specifically, CDKN1A, TP53, HDAC3, NCOR2, and IGF1R were remarkably suppressed in P41. The negative regulatory role of CDKN1A, TP53, HDAC3, NCOR2, and IGF1R in neuronal proliferation and neurogenesis has been described earlier (Chaker et al., 2015; Meletis et al., 2006; Pechnick et al., 2008; Yang et al., 2014).
Then, we analyzed the expression of differentiated cell markers. We noticed that mature neuron marker DLG4, BDNF, NT3, neurogenesis and Schwann cell marker GAP43, oligodendrocyte marker MBP, and microglia marker Iba1 were markedly expressed in P41 hGMSCs. The crucial role of NT3 in the early differentiation of neural progenitor cells has been already demonstrated (Lim et al., 2007). However, other differentiated cell markers for mature neurons (NEFH), immature neurons (TUBB3 and STMN1), astrocytes (GFAP, SLC1A2, and SLC1A3), microglia (CD68 and CD40), oligodendrocytes (CSPG4 and PDGFRA), radial glia (HES1), and Schwann cells (MPZ and NCAM1) were absent in P41 cells.
These findings suggest that majority of P41 hGMSCs are NPCs whereas some cells might have been transformed toward differentiated cell types such as neurons, Schwann cells, and microglia. Our data also recommend that stringent follow-up must be necessary during extended in vitro expansion of these neural crest-derived dental MSCs for stem cell therapeutic trials.
Lastly, we noticed de novo gene expression in P41 hGMSCs. In particular, NRN1 and NTRK3 were strongly expressed in P41, but not in P10 hGMSCs. The positive regulatory role of NRN1 and NTRK3 in NPCs proliferation and differentiation has been previously reported (Bartkowska et al., 2007; Cantallops et al., 2000). Further, VANGL2, PLP1, HOXA2, PHOX2B, and PCDH1 were noticeably expressed only in P41. The crucial role of VANGL2, PLP1, HOXA2, PHOX2B, and PCDH1 has been demonstrated in neural crest cells differentiation and brain circuit formation (Ciruna et al., 2006; Gavalas et al., 1997; Michalski et al., 2011; Noisa et al., 2014; Yagi, 2003). These results revealed the requirement of new genes activation for spontaneous transformation of hGMSCs into neuronal stem cells.
Conclusions
In summary, our study demonstrated the spontaneous differentiation characteristic of hGMSCs toward neural progenitor cells over extended passages. We propose that hGMSCs might be a compelling in vitro model to study the pathophysiology of nervous diseases during the developmental stage.
Footnotes
Acknowledgments
The authors are grateful to Dr. Ilaria Merciaro, University “G. d'Annunzio,” Chieti and Pescara, for the immunocytochemical experiments. This study was supported by the current research fund 2016, Ministry of Health, Italy.
Authors' Contributions
T.S.R. performed in vitro experiments and wrote the article. D.S. performed NGS experiment and data analysis. F.D. and O.T. performed human GMSCs isolation and characterization. E.M. performed immunocytochemistry analysis. A.P., P.B., E.M., and O.T. designed the study and were involved in revising the article. All authors contributed toward article revision and approved the final draft for submission.
Author Disclosure Statement
The authors declare that no conflicting financial interests exist.