
Abstract
Abstract
In this study, we investigated the effect of glial cell line-derived neurotrophic factor (GDNF), fibroblast growth factor (FGF) 2, and epidermal growth factor (EGF) on the expression of some self-renewal-related microRNAs (miRs) in putative buffalo spermatogonial stem cells (SSCs). The SSCs were cultured on a buffalo Sertoli cell feeder layer, colony formation was observed between 7 and 10 days. The SSC colonies expressed markers specific for undifferentiated type A spermatogonia and pluripotency markers. After 15 days of initial culture, the colonies were subcultured as treatment (supplemented with 20 ng mL−1 GDNF +10 ng mL−1 FGF2 + 10 ng mL−1 EGF) and control groups. The number and area of SSC colonies were significantly (p < 0.05) higher in the treatment group than in the control group. The relative abundance of miR-20b, miR-21, and miR-106a in SSCs supplemented with growth factors was significantly higher (p < 0.001) than that in the control. The results indicate that supplementation of SSC culture medium with growth factors (GDNF, FGF2, and EGF) may promote the expression of miR-20b, miR-21, and miR-106a, which is essential for self-renewal and maintenance of SSCs.
Introduction
S
Among such factors is the glial cell line-derived neurotrophic factor (GDNF) produced by Sertoli cells, which stimulates the self-renewal of SSCs and blocks spermatogonial differentiation (Kubota et al., 2004b; Meng et al., 2000; Nagano et al., 2003; Yomogida et al., 2003). The signaling pathway of GDNF involves the upregulation of transcription factors (ETV5, BCL6B, POU3f1, and LHX1), which are essential for self-renewal (Oatley et al., 2006, 2007). A few recent in vitro studies (Aponte et al., 2008; Kadam et al., 2013; Kanatsu-Shinohara et al., 2003; Kubota et al., 2004a, 2004b) have elucidated the importance of supplementing fibroblast growth factor (FGF) 2 and epidermal growth factor (EGF) along with GDNF for long-term proliferation and maintenance of SSCs.
MicroRNAs (miRs), short single-stranded endogenous RNA molecules (∼22 nucleotides), are critical regulators of multiple biological processes such as self-renewal, differentiation, proliferation, and apoptosis. They control the gene expression by transcriptional and post-transcriptional gene silencing (Hayashi et al., 2008; Niu et al., 2011). Among the wide array of miRs expressed in the SSCs, miR-20, miR-21, and miR-106a are functionally important for their self-renewal and maintenance (He et al., 2013; Niu et al., 2011).
Niu et al. (2011) demonstrated a significant increase in apoptosis of SSCs by inhibiting miR-21 expression. Through proliferation assays, He et al. (2013) demonstrated that mimics of miR-20 and miR-106a induced a 5.1- and 4.8- fold increase in mouse SSCs, respectively, after 5 days of culture as compared with controls. They also observed that the colony numbers of SSCs treated with miR-20 or miR-106a mimic were enhanced after 2 months of transplantation into testes of busulfan-treated mice in comparison with the control mice, which were transplanted with nontreated SSCs.
Although both miRs and growth factors participate in proliferation and maintenance of SSCs, very little is known regarding the crosstalk between these molecules. So far, a single study (Niu et al., 2011) has reported the role of growth factor GDNF in regulating miR-21 expression. From this perspective, this study was designed to evaluate the effect of supplementing combination of growth factors (GDNF, FGF2, and EGF) on the expression of some self-renewal- and differentiation-related miRs in SSCs.
Materials and Methods
Unless mentioned otherwise, chemicals were purchased from Sigma Chemical (St Louis, MO). Plastic wares were procured from Nunc (Rosklide, Denmark), and nylon mesh filters from Millipore (Bedford, MA). The buffalo testis samples were collected from an abattoir, and therefore ethical approval was not required.
Isolation and enrichment of putative buffalo SSCs
Prepubertal buffalo (3–6 months of age) testis samples were collected from a local abattoir. Isolation and enrichment were performed as described previously (Izadyar et al., 2002; Kadam et al., 2013; van Pelt et al., 1996). In brief, minced seminiferous tissue was subjected to two-step enzymatic isolation, followed by filtration through 80- and then 60-μm nylon mesh filters to enrich the SSC population. To separate other contaminating cells, the filtered cells were seeded onto lectin–BSA-coated dishes at a density of 2 × 10⁵ cells/cm2 and were incubated overnight at 37°C in a CO2 incubator (5% CO2 in air). Thereafter, the cells were subjected to discontinuous Percoll density gradient centrifugation (Kadam et al., 2013). The enriched SSCs found in the interface between 28%, 30%, and 32% Percoll suspensions were collected and used for in vitro culture.
In vitro culture of SSCs
The enriched SSCs were seeded onto Sertoli cell feeder layer and cultured in SSC medium [Knockout-DMEM (Invitrogen Corporation, Carlsbad, CA) supplemented with 10% Knockout serum replacer (Invitrogen)] at 37°C in a CO2 incubator (5% CO2 in air). The Sertoli cell feeder layer was prepared as described by Kadam et al. (2013). The SSC colony formation was observed between 7 and 10 days of in vitro culture.
On day 15, the putative SSC colonies were split mechanically with a microblade, and subcultured as treatment and control groups. The treatment group was supplemented with growth factors (20 ng/mL GDNF +10 ng/mL FGF2 + 10 ng/mL EGF) along with SSC medium, whereas the control group was subcultured in SSC medium devoid of growth factors. The medium was replaced every third day with fresh SSC medium supplemented with or without growth factors. The number and area of colonies were measured on 15th day of subculture in both groups.
Alkaline phosphatase activity and immunofluorescence staining
Alkaline phosphatase staining was performed using a commercial kit (catalog no. 86C; Sigma Chemical) according to manufacturer's instructions. For immunofluorescence staining, SSC colonies were fixed in 4% paraformaldehyde in Dulbecco's phosphate-buffered saline (DPBS) for 30 minutes and permeabilized with 0.1% Triton X-100 in DPBS for 30 minutes. After blocking nonspecific sites with 5% BSA, the cells were incubated with fluorescein-labeled DBA (1:100) for 1 hour at room temperature.
For evaluation of PLZF, THY1, UCHL1, OCT-4, SOX-2, and NANOG, the SSC colonies were incubated overnight (16 hours) at 4°C with respective primary antibodies (1:50), and then with either FITC or PE-labeled secondary antibody (1:500). The nucleus was stained with Hoechst 33342 and in negative controls; the use of primary antibody was omitted, and the same staining procedure was used. The colonies were examined under a fluorescence microscope (Nikon, Tokyo, Japan). The various primary antibodies, their sources, and class-specific secondary antibodies used against them are listed in Table 1.
FITC, fluorescein isothiocyanate; Ig, immunoglobulin; PE, phycoerythrin.
Reverse transcription PCR detection of SSC markers
Total RNA was extracted using RNAqueous-Micro Kit (Ambion, Austin, TX). The purity and concentration of RNA were determined by Nanoquant (Teccan, Salzburg, Austria). Superscript III, first strand cDNA synthesis kit (Invitrogen) was used for cDNA synthesis. The primer sequences, annealing temperatures, amplified product lengths, and GenBank accession numbers of the original sequences are given in Table 2.
The RT-PCR reactions were set up in a final volume of 25 μL having 10 × polymerase chain reaction (PCR) buffer, 10 mM dNTPs, 1.0 U of DreamTaq DNA polymerase, 10 pmol μL−1 each of forward and reverse primers, and 4 μL (400 ng) of cDNA. The thermal cycling conditions were 94°C for 3 minutes, followed by a cycling program of 94°C for 30 seconds, X°C (annealing temperature as mentioned for each primer pair in Table 2) for 30 seconds, and 72°C for 30 seconds for 36 cycles, followed by final extension at 72°C for 10 minutes. Reverse transcription-negative PCR and nontemplate control reactions were also performed for the respective genes to ensure complete absence of genomic DNA. The PCR products were visualized on 2% agarose gel for the specific products.
Quantitative real-time PCR analysis for miRNAs and statistical analysis
LNA™ primers for quantitative real-time PCR (qPCR) were designed and obtained through Exiqon website (www.exiqon.com). The miRNAs, target sequences of respective LNA primers, annealing temperatures, accession numbers, and Exiqon catalog numbers are provided in Table 3. qPCR was performed on a CFX 96 I Cycler (Bio-Rad, Hercules, CA) using Exiqon miRCURY LNA Universal RT kit (Exiqon, Vedbaek, Denmark). To brief, 10 μL reaction volume contained 5 μL of ExiLENT SYBR® Green master mix, 1 μL LNA PCR primer mix, and 4 μL diluted cDNA. The thermal cycling conditions consisted of polymerase activation/denaturation at 95°C for 10 minutes, followed by 40 cycles of 10 seconds at 95°C, 1 minute at 60°C, and melting curve analysis.
All primer pairs used were confirmed for their PCR efficiency, and specific products were checked by melting curve analysis. Relative miRNA expression levels were determined using the 2−ΔΔCt method, where ΔCt = Ct target − Ct reference and ΔΔCt = ΔCt target − ΔCt calibrator. miRNA expression data were normalized against expression of external reference UniSp6, and analyzed using CFX Manager (Bio-Rad). The calibrator in each study consisted of cDNA from the corresponding control group. Relative miRNA expression is expressed as n-fold miRNA expression relative to the calibrator. The specificity and integrity of the PCR products were ensured by melting curve analysis.
In all experiments, three trials were performed, each with three replicates. Data are expressed as mean ± SEM. Differences in the means were tested using unpaired t-test. GraphPad prism (version 7) software was used for statistical analysis.
Results and Discussion
In this study, we established a short-term in vitro culture system for the putative buffalo SSCs and studied the effects of crucial growth factors (GDNF, FGF2, and EGF) on the expression of some self-renewal- and apoptosis-related miRs. As the prepubertal testes contain higher population of undifferentiated spermatogonia (Aponte et al., 2006), testes from buffalo calves aged 3–6 months were used for isolation and enrichment of SSCs. The average yield after double digestion was ∼1 × 10⁶ cells/g of testis, and the viability of the isolated cells ranged between 80% and 85%. Undifferentiated spermatogonia were separated from somatic cells by differential plating on DSA- (Datura stramonium agglutinin)-lectin-coated 35 mm dishes.
Further, the population of undifferentiated spermatogonia was enriched through Percoll density gradient centrifugation. Since Sertoli cells provide nutrients and essential growth factors (GDNF and FGF2) for maintenance and self-renewal of SSCs (Meng et al., 2000), the enriched SSCs in this study were cultured on buffalo Sertoli cell feeder layer. Numerous in vitro studies (Aponte et al., 2006; Kadam et al., 2013; Kala et al., 2012; Oatley et al., 2004; Sousa et al., 2002) have already elucidated the importance of Sertoli cell feeder layer in proliferation and colony formation of SSCs. We observed the SSC colony formation between 7 and 10 days of culture, and the area of these colonies increased consistently up to day 15 (Fig. 1). Similar time duration in colony formation and expansion was reported for mice (Kanatsu-Shinohara et al., 2003), goat (Sharma et al., 2016), cattle (Aponte et al., 2008), and buffalo (Kadam et al., 2013; Kala et al., 2012).
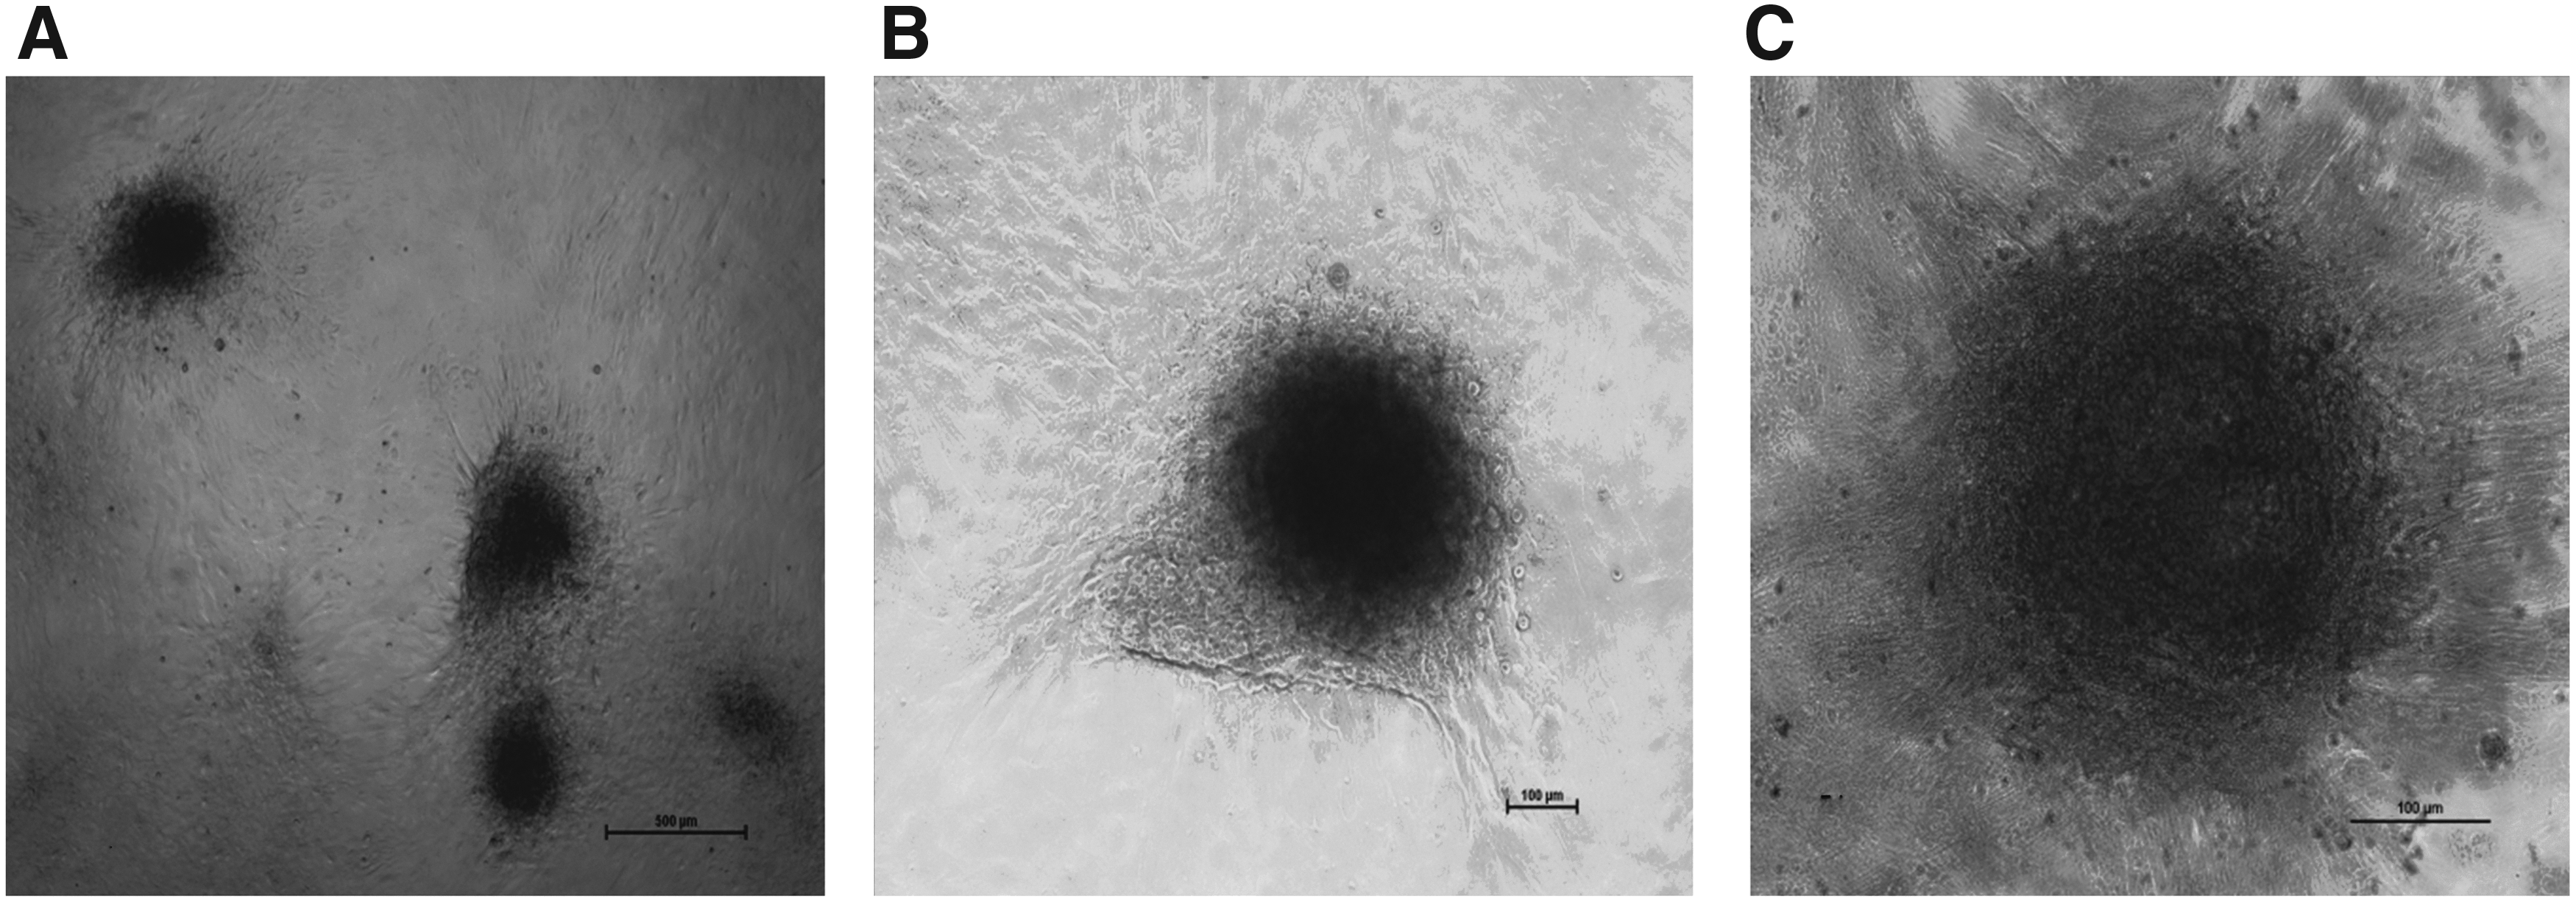
We observed a high alkaline phosphatase activity (Fig. 1) in the cultured SSCs. The SSC colonies expressed the pluripotency markers OCT-4, SOX-2, and NANOG (Fig. 2). The markers DBA, PLZF, UCHL1, and THY1, which are specific for undifferentiated type A spermatogonia (Fujihara et al., 2011; Goel et al., 2010; Herrid et al., 2007; Sharma et al., 2016), were also expressed in the cultured SSCs (Fig. 3). The SSCs were further characterized by examining the expression of self-renewal- and pluripotency-related genes such as BCL6B, ID4, UCHL1, THY1, TAF4B, REX1, STAT3, and Nucleostemin (Fig. 4) through RT-PCR.
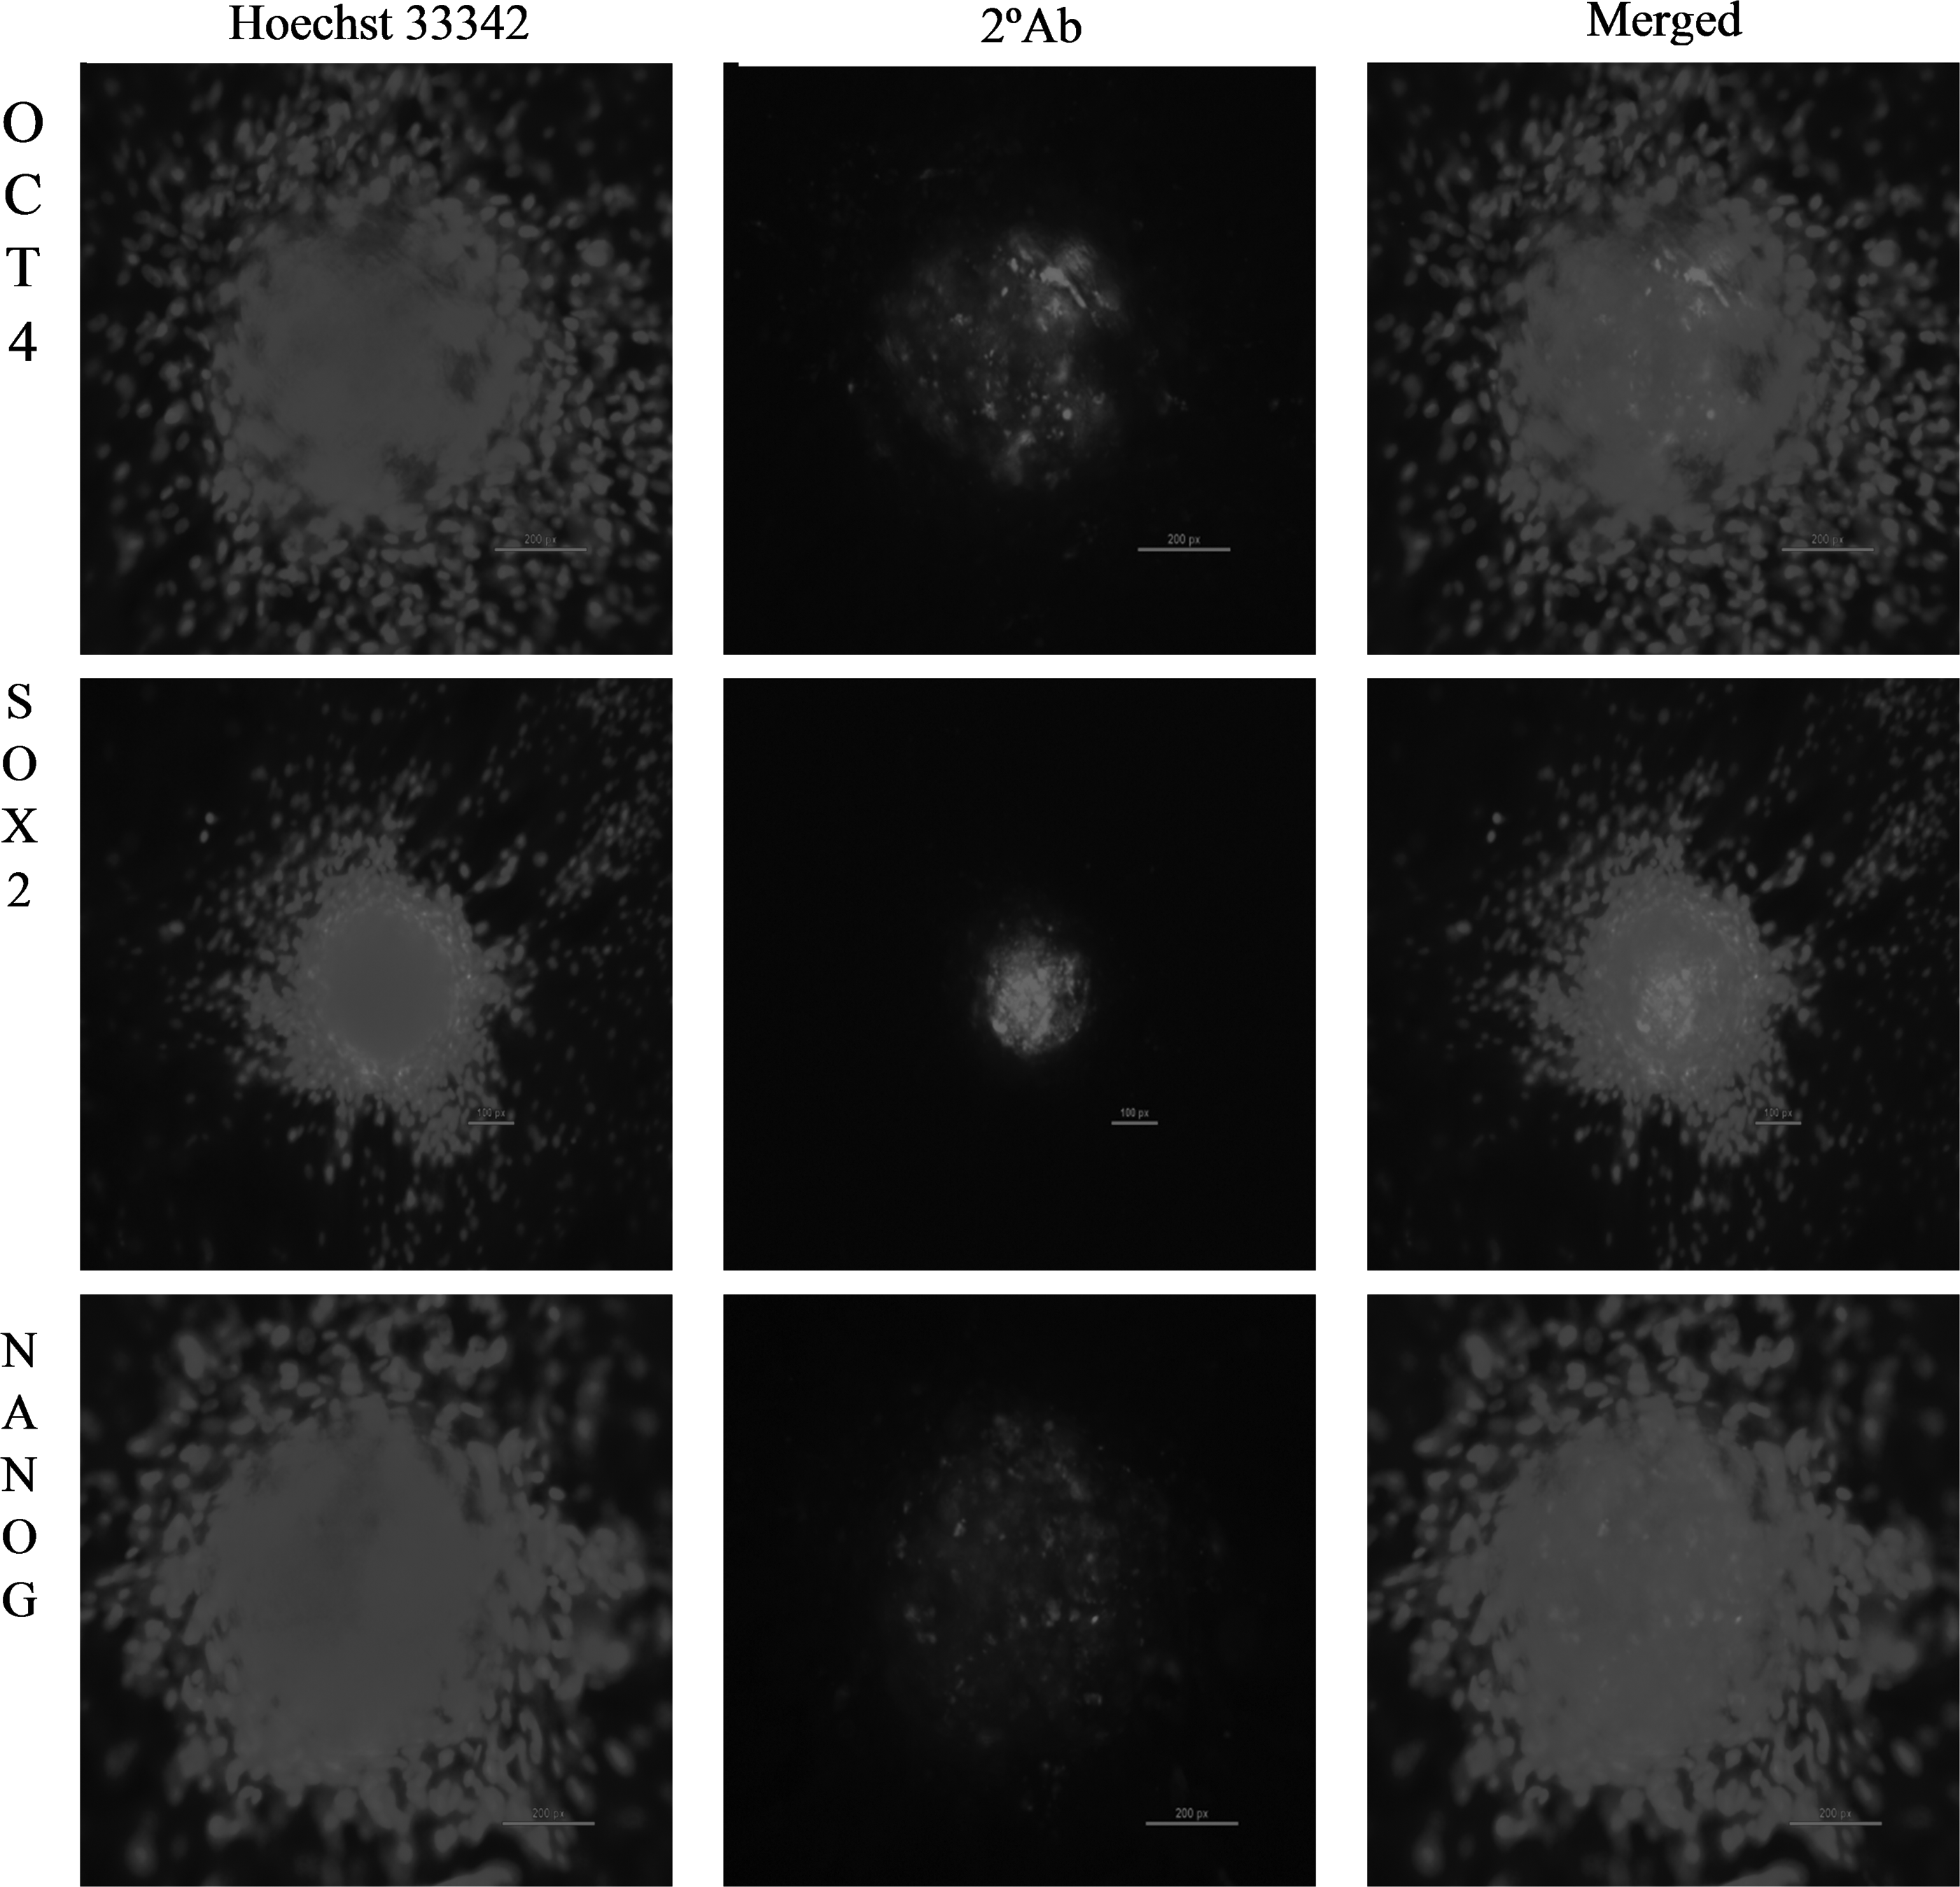
Immunocytochemical analysis of pluripotency markers OCT4 (200 × ; 200 μm), SOX2 (100 × ; 100 μm), and NANOG (200 × ; 200 μm) in putative SSC colonies. Hoechst 33342, nuclear-stained image; 2°Ab, phycoerythrin/fluorescein isothiocyanate-labeled secondary antibody image; merged, merged Hoechst 33342 and 2°Ab images.

Immunocytochemical analysis of markers specific for undifferentiated type A spermatogonia DBA, PLZF, THY1 (200 × ; 200 μm) and UCHL1 (100 × ; 200 μm) in putative SSC colonies. Hoechst 33342, nuclear-stained image; 2°Ab, phycoerythrin/fluorescein isothiocyanate-labeled secondary antibody image; merged, merged Hoechst 33342 and 2°Ab images.

RT-PCR results for various self-renewal- and pluripotency-related markers in SSCs:
The doses and treatment duration of growth factors FGF2 and EGF were chosen on the basis of a previous study by Kadam et al. (2013). The optimum dose of GDNF was determined in our another study (unpublished). After 15 days of subculture, we observed a significantly higher number of SSC colonies in the culture supplemented with growth factors (177 ± 6.11) than in the control (131 ± 11.2). The SSC colonies were larger in the treatment group (96,039 ± 15,066 μm2) as compared with the control (37,898 ± 9696 μm2). Previous studies also reported a significant increase in number (Aponte et al., 2008) and area (Kadam et al., 2013) of SSC colonies with supplementation of growth factors (GDNF, FGF2, and EGF).
In this study, the relative abundance of miR-20b, miR-21, and miR-106a in SSCs supplemented with cocktail of growth factors was significantly higher (p < 0.001) than that in the control (Fig. 5). As these miRs are functionally important for self-renewal and maintenance (He et al., 2013; Niu et al., 2011) of SSCs, their higher expression in treatment group reasons for the increase in number and area of SSC colonies.

Effect of GDNF, FGF2, and EGF on expression of miR-20b, miR-21, and miR-106a. Data are expressed as mean ± SEM. Bars with asterisks indicate significant differences in control (p < 0.001). EGF, epidermal growth factor; FGF, fibroblast growth factor; GDNF, glial cell line-derived neurotrophic factor; miRs, microRNAs.
Although there are no previous reports evaluating the modulatory effect of supplementing combination of growth factors (GDNF, FGF2, and EGF) on the expression of self-renewal-related miRs, a single study (Niu et al., 2011) has demonstrated that GDNF upregulates the expression of miR-21. It is well established that the intrinsic molecular mechanisms of growth factors involve upregulation of transcription factors ETV5, BCL6B, POU3f1, and LHX1, all of which are essential for self-renewal of SSCs (Oatley et al., 2006, 2007). Our results support the notion that apart from upregulating these essential transcription factors, the growth factors (GDNF, FGF2, and EGF) maintain the stemness of SSCs by upregulating the expression of self-renewal-related miRs (miR-20b, miR-21, and miR-106a).
Conclusion
Supplementation of SSC culture medium with a combination of growth factors GDNF, FGF2, and EGF may promote the expression of miR-20b, miR-21, and miR-106a, which is essential for self-renewal and maintenance of SSCs.
Footnotes
Acknowledgments
This work was funded by National Agriculture Innovation Project (NAIP) Grant to M.S.C. (C-2067 and 075) and S.K.S. (C 2-1-(5)/2007). The authors also acknowledge Indian Council of Medical Research (ICMR) and University Grant Commission (UGC) for providing PhD fellowships to A.S. and S.V.L.
Author Disclosure Statement
The authors declare there are no financial conflicts of interest.