
Abstract
Abstract
The embryonic stem cell line derivation from nonpermissive mouse strains is a challenging and highly inefficient process. The cellular reprogramming strategy provides an alternative route for generating pluripotent stem cell (PSC) lines from such strains. In this study, we successfully derived an enhanced green fluorescent protein (EGFP)-transgenic “N9” induced pluripotent stem cell (iPS cell, iPSC) line from the FVB/N strain-derived mouse embryonic fibroblasts (MEFs). The exposure of MEFs to human OCT4, SOX2, KLF4, and c-MYC (OSKM) transgenes via lentiviral transduction resulted in complete reprogramming. The N9 iPS cell line demonstrated all the criteria of a typical mouse PSC line, including normal colony morphology and karyotype (40,XY), high replication and propagation efficiencies, expression of the pluripotency-associated genes, spontaneous differentiation to three germ lineage-derived cell types, and robust potential of chimeric blastocyst formation. Taken together, using human OSKM genes for transduction, we report, for the first time, the successful derivation of an EGFP-expressing iPS cell line from a genetically nonpermissive transgenic FVB/N mouse. This cell line could provide opportunities for designing protocols for efficient derivation of PSC lines from other nonpermissive strains and developing mouse models of human diseases.
Introduction
Pluripotent stem cells (PSCs) provide an attractive model system for studying in vitro development and differentiation. In the past few decades, several breakthroughs in PSC research have revolutionized the field of regenerative cell therapy (Wobus and Boheler, 2005). These include the generation of embryonic stem cell (ES cell, ESC) lines from mice (Evans and Kaufman, 1981; Martin, 1981) and humans (Thomson et al., 1998), the establishment of mouse models of diseases (Guan et al., 2010; Rosenthal and Brown, 2007; Simmons, 2008), germ cell development from ES cells (Wei et al., 2008), and reprogramming of somatic cells to generate induced pluripotent stem cells (iPS cells, iPSCs) (Takahashi and Yamanaka, 2006; Takahashi et al., 2007; Yu et al., 2007).
To study early embryonic development and differentiation, PSC lines with reporter transgenes have also been generated (Sun et al., 2009). Among the wide range of reporter genes available (Cui et al., 1994), green fluorescent protein (GFP) (Shimomura et al., 1962) and its beneficial mutant—the enhanced green fluorescent protein (EGFP) (Cormack et al., 1996)—are the most favorable ones for studies related to cell-specific expression analysis and homing of fluorescently marked cells postengraftment in the recipient (Min et al., 2006).
We earlier generated an EGFP-transgenic GU3 “green” mouse in the FVB/N inbred genetic background (Devgan and Seshagiri, 2003; Devgan et al., 2003). This background was employed as it is highly suitable and efficient for mouse transgenic experiments (Devgan and Seshagiri, 2003; Devgan et al., 2003; Taketo et al., 1991). The EGFP-transgenic GU3 mouse constitutively and ubiquitously expressed EGFP in all of its cell types. Because of this property, it is highly desirable to derive EGFP-transgenic PSC lines from the GU3 mouse. This would provide opportunities to study differentiation of fluorescently labeled PSCs under in vitro culture conditions and the homing mechanisms of their derivatives after in vivo transplantation (Hanson et al., 2003; Min et al., 2002; Molyneaux et al., 2001).
There is an important need for generating traceable PSC lines from transgenic and mutant mouse models that exhibit specific phenotypes associated with cellular development and differentiation. However, in most cases, such mice are generated in strains, such as the FVB/N, that are genetically nonpermissive for ES cell line derivation (Buehr et at., 2003). As a result, only a few ES cell lines have been derived from genetically nonpermissive strains such as NOD (Hanna et al., 2009; Liu et al., 2011), CBA (Brook and Gardner, 1997; Buehr and Smith, 2003; McWhir et al., 1996), ICR (Suzuki et al., 1999), and DDK (Kress et al., 1998). This restricts the potential application of these valuable transgenic and mutant mouse strains for in vitro developmental studies that are dependent on the availability of their PSC lines.
A few earlier reports (Cinelli et al., 2008; Schoonjans et al., 2003), including our own study (Singh et al., 2012), described the derivation of ES cell lines from the nonpermissive FVB/N strain by using different approaches.
The ES cell lines from genetically modified mouse strains are highly valuable for developmental studies. However, the experimental approach for ES cell line derivation from such strains is technically challenging, less efficient, and time-consuming. In this regard, the cellular reprogramming approach can be of great importance to overcome the nonpermissiveness of these mouse strains. The phenomenal discovery of somatic cell reprogramming by the forced expression of four genes, that is, OCT4, SOX2, KLF4, and c-MYC (OSKM), by using viral vectors has led to the derivation of iPS cell lines from mice (Takahashi and Yamanaka, 2006) and humans (Takahashi et al., 2007; Yu et al., 2007). The iPS cell lines can be derived from various somatic cell types, including skin fibroblasts. Therefore, this approach is of immense value for deriving PSC lines from genetically nonpermissive strains.
Cellular reprogramming can be achieved through different methods, including the use of retroviruses, lentiviruses, adenoviruses, and Sendai viruses, which can transfect a wide range of cells (Fusaki et al., 2009; Hotta and Ellis, 2008; Wernig et al., 2008). Special consideration should be given to viral titers used for transduction, as there is a need for employing a different multiplicity of infection for various somatic cell types derived from different mouse strains (Carinhas et al., 2009).
To enhance somatic cell reprogramming efficiency and obtain better-quality iPS cell lines, a number of modifications have been implemented. These include the use of transposons, plasmids, episomes (Yu et al., 2009), purified proteins (Zhou et al., 2009), and small molecules, including epigenetic modifiers (Huangfu et al., 2008). Also, different combinations of viral particles and inhibitors can be employed to generate iPS cell lines (Li et al., 2009; Trokovic et al., 2013).
To overcome the genetic nonpermissiveness of the FVB/N mouse strain for ES cell line derivation, we performed lentiviral transduction of mouse embryonic fibroblasts (MEFs) with human OSKM transgenes to successfully derive an iPS cell line from our EGFP-transgenic GU3 FVB/N mouse (Devgan et al., 2003). To the best of our knowledge, there is virtually no study describing the derivation of an iPS cell line from genetically nonpermissive EGFP-transgenic FVB/N mouse strain.
Materials and Methods
Handling and use of mice
Mice were maintained in the central animal facility of the Institute on a 12-hour light:12-hour dark schedule at 23°C–25°C. All the animal experiments were carried out according to the guidelines on the use of laboratory animals for research set by the Indian National Science Academy (INSA, New Delhi, India) and approved by the Institutional Animal Ethics Committee (IAEC).
Preparation of EGFP-transgenic MEFs
Day 13.5 pregnant EGFP-transgenic GU3 FVB/N female mice were sacrificed and their uterine horns were dissected out under sterile conditions. The uterine horns were washed thrice with Dulbecco's phosphate-buffered saline (DPBS; Invitrogen) and then dissected to take out fetuses. The fetuses were washed twice with DPBS. The head and tail parts of the fetuses were removed by dissection followed by the removal of thoracic and visceral organs. The remaining tissues were given three washes with DPBS and minced into small pieces by using sterile scissors. These pieces were treated with 0.25% Trypsin-EDTA (TE; Invitrogen) at 37°C for 5 minutes. TE action was neutralized by the addition of MEF medium which contained Dulbecco's modified Eagle's medium (DMEM) supplemented with 10% fetal bovine serum (FBS; Invitrogen), 2 mM
The tissue suspension was further dispersed by pipetting multiple times and then centrifuged at 1000 rpm for 3 minutes. The resulting cell pellet was suspended in the MEF medium and plated in T-25 tissue culture flasks. After 48 hours of culture, the MEFs were trypsinized, replated in 35-mm tissue culture dishes, and cultured for an additional 24 hours.
Viral transduction of EGFP-transgenic MEFs
MEFs were transduced with human OSKM transgenes by using lentiviral vector construct pLenti6.3 (Invitrogen). The lentiviral particles from the stock viral suspensions were added to 2 mL of pre-equilibrated MEF culture medium as described in Supplementary Table S1. The medium was added to MEFs at passage 1 (p1), and incubated for 24 hours. As a control, in a parallel experiment, MEFs were also cultured without lentiviral transduction. All experiments dealing with lentiviral particles were performed in a BSL-II biosafety cabinet facility.
Selection and screening of putative iPS cell colonies
Post-24 hours of lentiviral transduction of MEFs, the culture medium was changed with the fresh MEF medium and this was repeated for the next 6 days. After a week, cells were trypsinized and replated over mitomycin C (mitC)-treated MEFs or geltrex (Invitrogen). The cells were maintained in the ES cell culture medium, which contained DMEM supplemented with 15% ESC-qualified FBS (Invitrogen), 2 mM
The colonies were screened based on their morphology and proliferation rates. On day 18, colonies showing iPSC-like morphology were manually picked by using glass Pasteur pipettes and were replated in individual wells of 24-well plates over mitC-treated MEFs. The colonies were allowed to grow until they reached 70%–80% confluence. The colonies were then trypsinized by using 0.25% TE at 37°C for 3 minutes and replated in 35-mm dishes or 6-well plates. The resulting colonies were characterized for their pluripotency.
Maintenance and cryopreservation of the putative iPS cell colonies
The putative iPS cell colonies were grown in 35-mm dishes on a monolayer of mitC-treated MEFs in the ES cell culture medium. After every 48 hours time point, iPS cell colonies attained about 80% confluency and were trypsinized. The cells were passaged at 1:4 to 1:8 ratios and replated on mitC-treated MEFs in 35-mm dishes. Also, cells (∼1.5–2 million) at all passages were cryopreserved (Robertson, 1987; Singh et al., 2012).
Karyotype analysis of the N9 iPS cell line
Karyotyping of the established N9 iPS cell line was performed at p11 by G-banding of metaphase spreads by using a standard Giemsa staining procedure. About 10 metaphase spreads were counted and imaged (Robertson, 1987; Singh et al., 2012).
Genomic integration analysis via genomic DNA polymerase chain reaction (PCR) and expression analysis via reverse transcriptase (RT)-PCR and quantitative PCR (qPCR)
The genomic integration of human OSKM transgenes was assessed via genomic DNA PCR. Genomic DNA was extracted by using a kit as per the manufacturer's (Qiagen) procedure. Later, PCR was carried out with 100 ng of genomic DNA by using gene-specific forward and vector-specific reverse primers (Supplementary Table S2). To assess the expression of human OSKM transgenes, RT-PCR was performed by using gene-specific forward and reverse primers (Supplementary Table S2). The expression of various pluripotency-associated genes in the putative iPS cell clones, including the established N9 iPS cell line, was also analyzed by using RT-PCR.
For RT-PCR, total RNA was isolated by using the Trizol (Invitrogen) reagent. RNA (1 μg) was digested with DNase I (Fermentas) and then converted to cDNA by using RT (Fermentas) enzyme. Afterward, PCR amplification was carried out in a 10-μL reaction mixture containing 50 ng of cDNA. β-Actin was used as the housekeeping gene. For β-actin, PCR was performed under the following conditions: initial denaturation for 94°C for 5 minutes followed by 94°C for 30 seconds, 58°C for 30 seconds, and 72°C for 40 seconds for 30–35 cycles, with a final extension of 72°C for 10 minutes. The primer sequences and annealing temperatures of the genes are mentioned in Supplementary Table S2. All the PCR experiments included −RT control (without the addition of RT enzyme) and no template control (without the addition of cDNA).
The amplified PCR products were subjected to electrophoretic separation on 1.2% agarose gels containing ethidium bromide. The gels were imaged under ultra-violet light by using Alpha digidoc software (Abbey and Seshagiri, 2017).
The qPCR was carried out to assess the expression levels of various lineage-associated genes during the differentiation of the N9 iPS cell line. The qPCR was performed by using 10 ng of cDNA and Platinum SYBR Green master mix (Invitrogen). The qPCR was carried out by using ABI 7300 real-time PCR system (Applied Biosystems) and Step One Plus real-time PCR system (Applied Biosystems) and data were analyzed with SDS software and StepOne version 2.2.2 software, respectively. The fold changes of the analyzed genes at different days of culture were calculated with respect to the housekeeping gene β-actin (Abbey and Seshagiri, 2017; Verma et al., 2017).
Alkaline phosphatase staining for quantitation of iPS cell colonies and confirmation of pluripotency
For alkaline phosphatase (AP) staining, the cultured iPS cells were washed with DPBS two times and fixed for 10 minutes with 4% paraformaldehyde (PFA; Sigma). The cells were then washed thrice with 30 mM Tris-maleate buffer (pH 9.0; Sigma) and treated with the chromogenic solution, containing 0.4 mg/mL naphthol AS-MX-phosphate (Sigma), 1 mg/mL fast red TR salt (Sigma), and 0.5 mM MgCl2 (Sigma) in Tris-maleate buffer, until the color developed. The staining solution was then removed, DPBS was added to the cells, and images were taken (Singh et al., 2012).
Immunostaining of the N9 iPS cell line for the expression analysis of pluripotency-associated genes
The N9 iPS cell line was cultured in 4-well plates on 0.1% gelatin-coated glass coverslips. For staining, the cells were fixed for 10 minutes with 4% PFA. The fixed cells were washed with DPBS and then permeabilized for 5 minutes with 0.2% Triton X-100 (Sigma). The cells were washed with DPBS and blocked with 1% bovine serum albumin (Sigma) for 2 hours at room temperature. The cells were then incubated with mouse antibodies for OCT4 (Santa Cruz Biotechnology) or SSEA1 (a kind gift from Prof. P.W. Andrews, University of Sheffield, United Kingdom) for 2 hours at room temperature in a humidified container.
The cells were washed twice with DPBS and incubated with Alexa Fluor 647-conjugated anti-mouse IgG antibody (Invitrogen) for 1 hour at room temperature. The cells were washed twice with DPBS and incubated with 4′6-diamidino-2-phenylindole dihydrochloride (DAPI; Sigma) for 10 minutes at room temperature. The cells were then washed twice with DPBS, mounted in prolong gold antifade (Invitrogen), and imaged with Zeiss LSM 880 confocal laser scanning microscope (Carl Zeiss) using Zen 2.1 software (Verma et al., 2017).
Differentiation of the N9 iPS cell line via embryoid body formation
The differentiation of the N9 iPS cell line was performed via the formation of embryoid bodies (EBs) by the hanging drop method as described earlier (Abbey and Seshagiri, 2017; Verma et al., 2017). The EBs were generated in FBS- or knockout serum replacement (KSR)-containing differentiation medium. The differentiation medium contained DMEM supplemented with 20% FBS or KSR, 2 mM
For EB formation, about 400 individually dispersed N9 iPS cells were allowed to aggregate in hanging drops (20 μL) placed on the lids of 94-mm bacteriological dishes. After 48 hours (on day 2), the EBs were collected and plated in suspension cultures in 60-mm bacteriological Petri dishes for an additional 3 days. On day 5, the EBs were plated in 60-mm tissue culture dishes and 24-well plates. The cultureware was coated with gelatin and geltrex for plating of FBS- and KSR-cultured EBs, respectively. The proliferation and differentiation patterns of EBs were assessed daily.
The FBS-cultured EBs were immunostained with cTNI (Millipore) antibody, whereas the KSR-cultured EBs were immunostained with antibodies against NES (Millipore), DCX (Invitrogen), TAU (Biosource), and GAD1 (Santa Cruz Biotechnology) as per the protocol described in the Section Immunostaining of the N9 iPS cell line for the expression analysis of pluropotency-associated genes. The nuclear staining was performed with either DAPI or propidium iodide (PI; Sigma). The imaging was performed with Zeiss LSM (Carl Zeiss) and Leica TCS SP5 (Leica Microsystems) confocal microscopes by using Zeiss LSM Image Browser software and Leica application suite advanced fluorescence lite software, respectively.
Morphological and real-time assessment of cardiac and neural differentiation of the N9 iPS cell line
The EB outgrowths containing contracting cardiac clusters were video-recorded by using a CCD-camera (JVC) attached to the side-port of the IX70 inverted microscope (Olympus). The recordings were taken by using the VCR (JVC) with the SP mode VHS-videotapes and were later converted to the digital mode (Abbey and Seshagiri, 2017). For neural differentiation experiments, the area of EB outgrowths was measured by using Image Pro software as described earlier (Verma et al., 2017).
Teratoma generation from N9 iPS cell line and histological analysis of teratoma tissue sections
About 1 million N9 iPS cells at p10 were harvested and dispersed by trypsinization, suspended in DPBS, and injected subcutaneously in the immunocompromised nude mice. Mice were allowed to develop teratomas for about 6 weeks. Mice with well-developed teratomas were euthanized, and the teratomas were surgically excised. They were immediately fixed with 10% buffered formalin, processed, and sectioned by using a microtome to obtain 5-μm-thick sections. These sections were subjected to hematoxylin and eosin (HE) staining, imaged, and tissue histology was analyzed (Robertson, 1987).
Chimeric embryo generation from the N9 iPS cell line
The embryos at the eight-cell stage were collected from pregnant CD-1 wild-type female mice. Zona pellucida removal of the embryos was achieved by treating them with Acid-Tyrode's solution (Hogan et al., 1994; Robertson, 1987). To allow aggregation, N9 iPS cells (15–20) and zona pellucida-free noncompact eight-cell stage embryo were placed together in the individual micro-wells, created in 35-mm Petri dishes by using a darning needle (BLS Ltd.). They were cultured in 1:1 mixture of ES cell and M16 culture media overlaid with mineral oil. After 24 hours, healthy aggregated embryos showing positive EGFP expression were transferred to pseudopregnant CD-1 females. The uterine C-sections were performed at day 19 to assess for chimerism in the developing pups.
Microarray analysis of N9 iPSC line, GS-2 and D3 ESC lines, and MEFs
Whole transcriptome profiling of the N9 iPS cell line, GS-2 (Singh et al., 2012) and D3 (a kind gift from Dr. A. Wobus, Leibniz Institute of Plant Genetics and Crop Plant Research, Gatersleben, Germany) ES cell lines, and GU3-derived EGFP-transgenic MEFs was performed by taking two biological replicates for each cell line. The total RNA was isolated by using Trizol reagent and purified by using Qiagen columns. The microarray experiment was performed by using Affymetrix Gene Chip Mouse Gene 1.0 ST Array at the Asuragen microarray core facility at the United States. Using AltAnalyze v2.0.7 software (Emig et al., 2010), raw data were processed with standard RMA and DABG filtering options and quality-controlled by using array Quality Metrics (Kauffmann et al., 2009).
Differential gene- and exon-level expression analyses were performed for multiple pair-wise comparisons by using moderated unpaired t-test and MiDAS, respectively. For gene level, log2-fold change with Benjamini-Hochberg adjusted p-value <0.05 was considered significant. For exon level, splice index >1 ( = log2-fold) with MiDAS p-value <0.05 was considered significant. Hierarchical clustering of samples was performed on log2 differentially expressed genes (DEGs) across the pair-wise comparisons by using single linkage and Euclidean metric. Identification of genes that were commonly upregulated or downregulated in one condition versus others was done by using the online tool Venny (Oliveros, 2007). Gene ontology and pathway analyses for differentially expressed genes were performed by using DAVID v6.7 functional analysis tool (Huang et al., 2009). Only annotations with p-value <0.05 were considered significant.
Statistical analysis
All data are presented as the mean ± standard error of the mean (SEM) of each group. The p-values for assessing the statistical significance were calculated by using one-way ANOVA with GraphPad Prism software.
Results
Derivation of an iPS cell line from EGFP-expressing MEFs
We attempted to derive an iPS cell line from our EGFP-transgenic GU3 FVB/N strain-derived MEFs (Fig. 1A, B) by using Yamanaka factors. Using lentiviral transduction, 70 clones showing iPSC-like morphology were obtained by day 16. The representative images of these clones on postlentiviral transduction days 11, 16, and 18 are shown in Supplementary Figure S1, I(A–C). No such clone was generated in the untransduced control MEFs, as shown in Supplementary Figure S1, I(D). A total of 12 clones were cultured post 3 passages. The clones were maintained in the standard ES cell culture medium over mitC-treated MEFs, where they propagated efficiently.
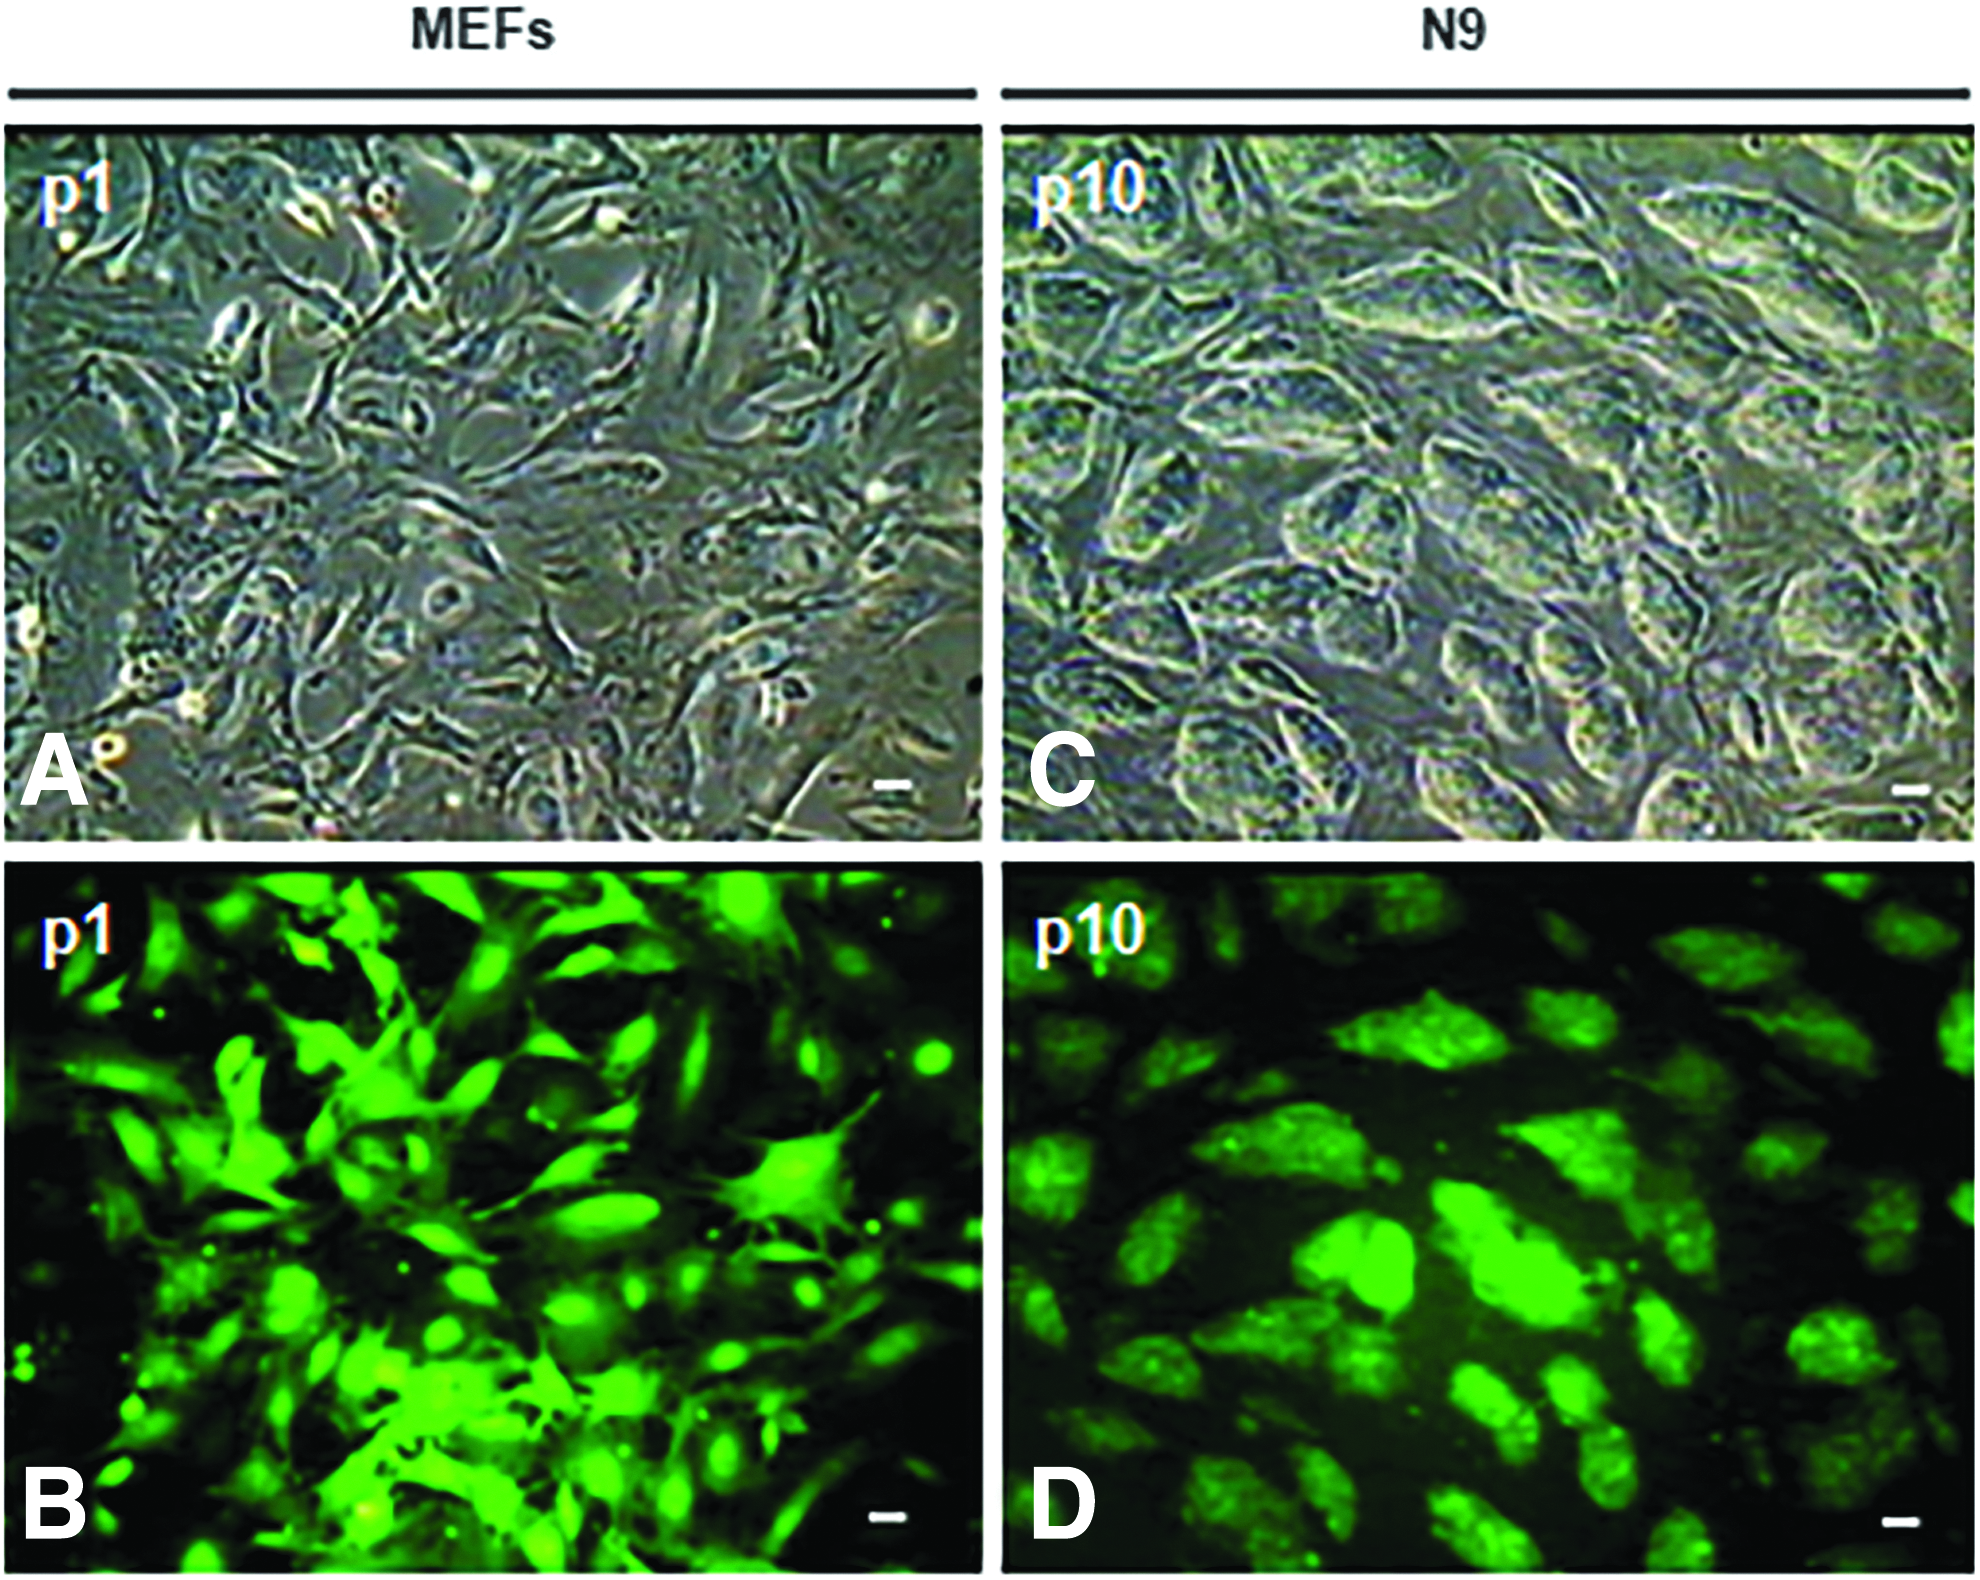
Morphological assessment of FVB/N MEF-derived N9 iPS cell line. Shown are the representative phase contrast
The putative iPS cell clones were selected based on their morphology and replication efficiency. A total of 11 clones were cultured continuously for 10 passages, whereas the rest of the clones were cryopreserved. One of the clones was characterized thoroughly for pluripotency and was successfully established as the EGFP-expressing iPS cell line designated as the “N9” iPS cell line (Supplementary Fig. S2 and Supplementary Tables S3 and S4).
Propagation and culture of the established N9 iPS cell line
The established N9 iPS cell line could generate several thousand colonies without any replication crisis during passaging. The colonies at all passages showed the constitutive and persistent expression of EGFP as judged by direct fluorescence. The iPS cell colonies were of high quality as judged by their morphology (Fig. 1C, D). The N9 iPS cell line was maintained in culture continuously for 27 passages, and cells at all individual passages were cryopreserved (Supplementary Fig. S1, II). The N9 iPS cell colonies had distinct boundaries and contained about a few hundred cells, and colony morphology was similar to that of the GS-2 and D3 mouse ES cell lines cultured routinely in our laboratory (Singh et al., 2012; Verma et al., 2017).
The N9 iPS cell line showed excellent expansion efficiency. When subcultured at 1:4, 1:8, or 1:16 passage ratios, it showed an expected increase in cell counts as quantitated based on the AP staining. The positive AP staining also confirmed the pluripotent nature of the N9 iPS cell line (Fig. 2).

Assessment of colony-forming efficiency of the N9 iPS cell line.
Genomic integration and expression analyses of human and mouse genes during reprogramming
The genomic integration of human OSKM transgenes was analyzed during reprogramming. Expectedly, genomic integration of all the four transgenes was observed on day 18 of the reprogramming process (Supplementary Fig. S3, I). The expression levels of the integrated human OSKM transgenes were also examined. OCT4 was expressed at a low level, whereas the other transgenes were not expressed. A549, a human alveolar basal epithelial cell line, was used as the positive control (C) for the expression of OCT4 transgene (Supplementary Fig. S3, II).
Moreover, the temporal pattern of expression of mouse Oct4, Sox2, c-Myc, and Klf4 genes was analyzed. It was observed that Oct4 and Sox2 were expressed at high levels at day 18 post-transduction, whereas the expression of c-Myc and Klf4 decreased during the reprogramming process. The established N9 iPS cell line expressed all of these genes at levels similar to that of the D3 ES cell line (Supplementary Fig. S3, III).
Characterization of the pluripotent nature of the N9 iPS cell line
The N9 iPS cell line expressed key pluripotency-associated genes, including Oct4, Sox2, Rex1, Nanog, Utf1, and Esg1 as determined by the RT-PCR analysis (Fig. 3, I). Importantly, the N9 iPS cell colonies expressed pluripotency-associated proteins OCT4 and SSEA1. The OCT4 staining was specifically observed in the nuclei (Fig. 3, IIA–C), whereas the SSEA1 immunostaining was exclusively observed in the plasma membranes of the iPS cells (Fig. 3, IID–F). The N9 iPS cell line showed a normal male karyotype with 40,XY set of chromosomes (Supplementary Fig. S4).
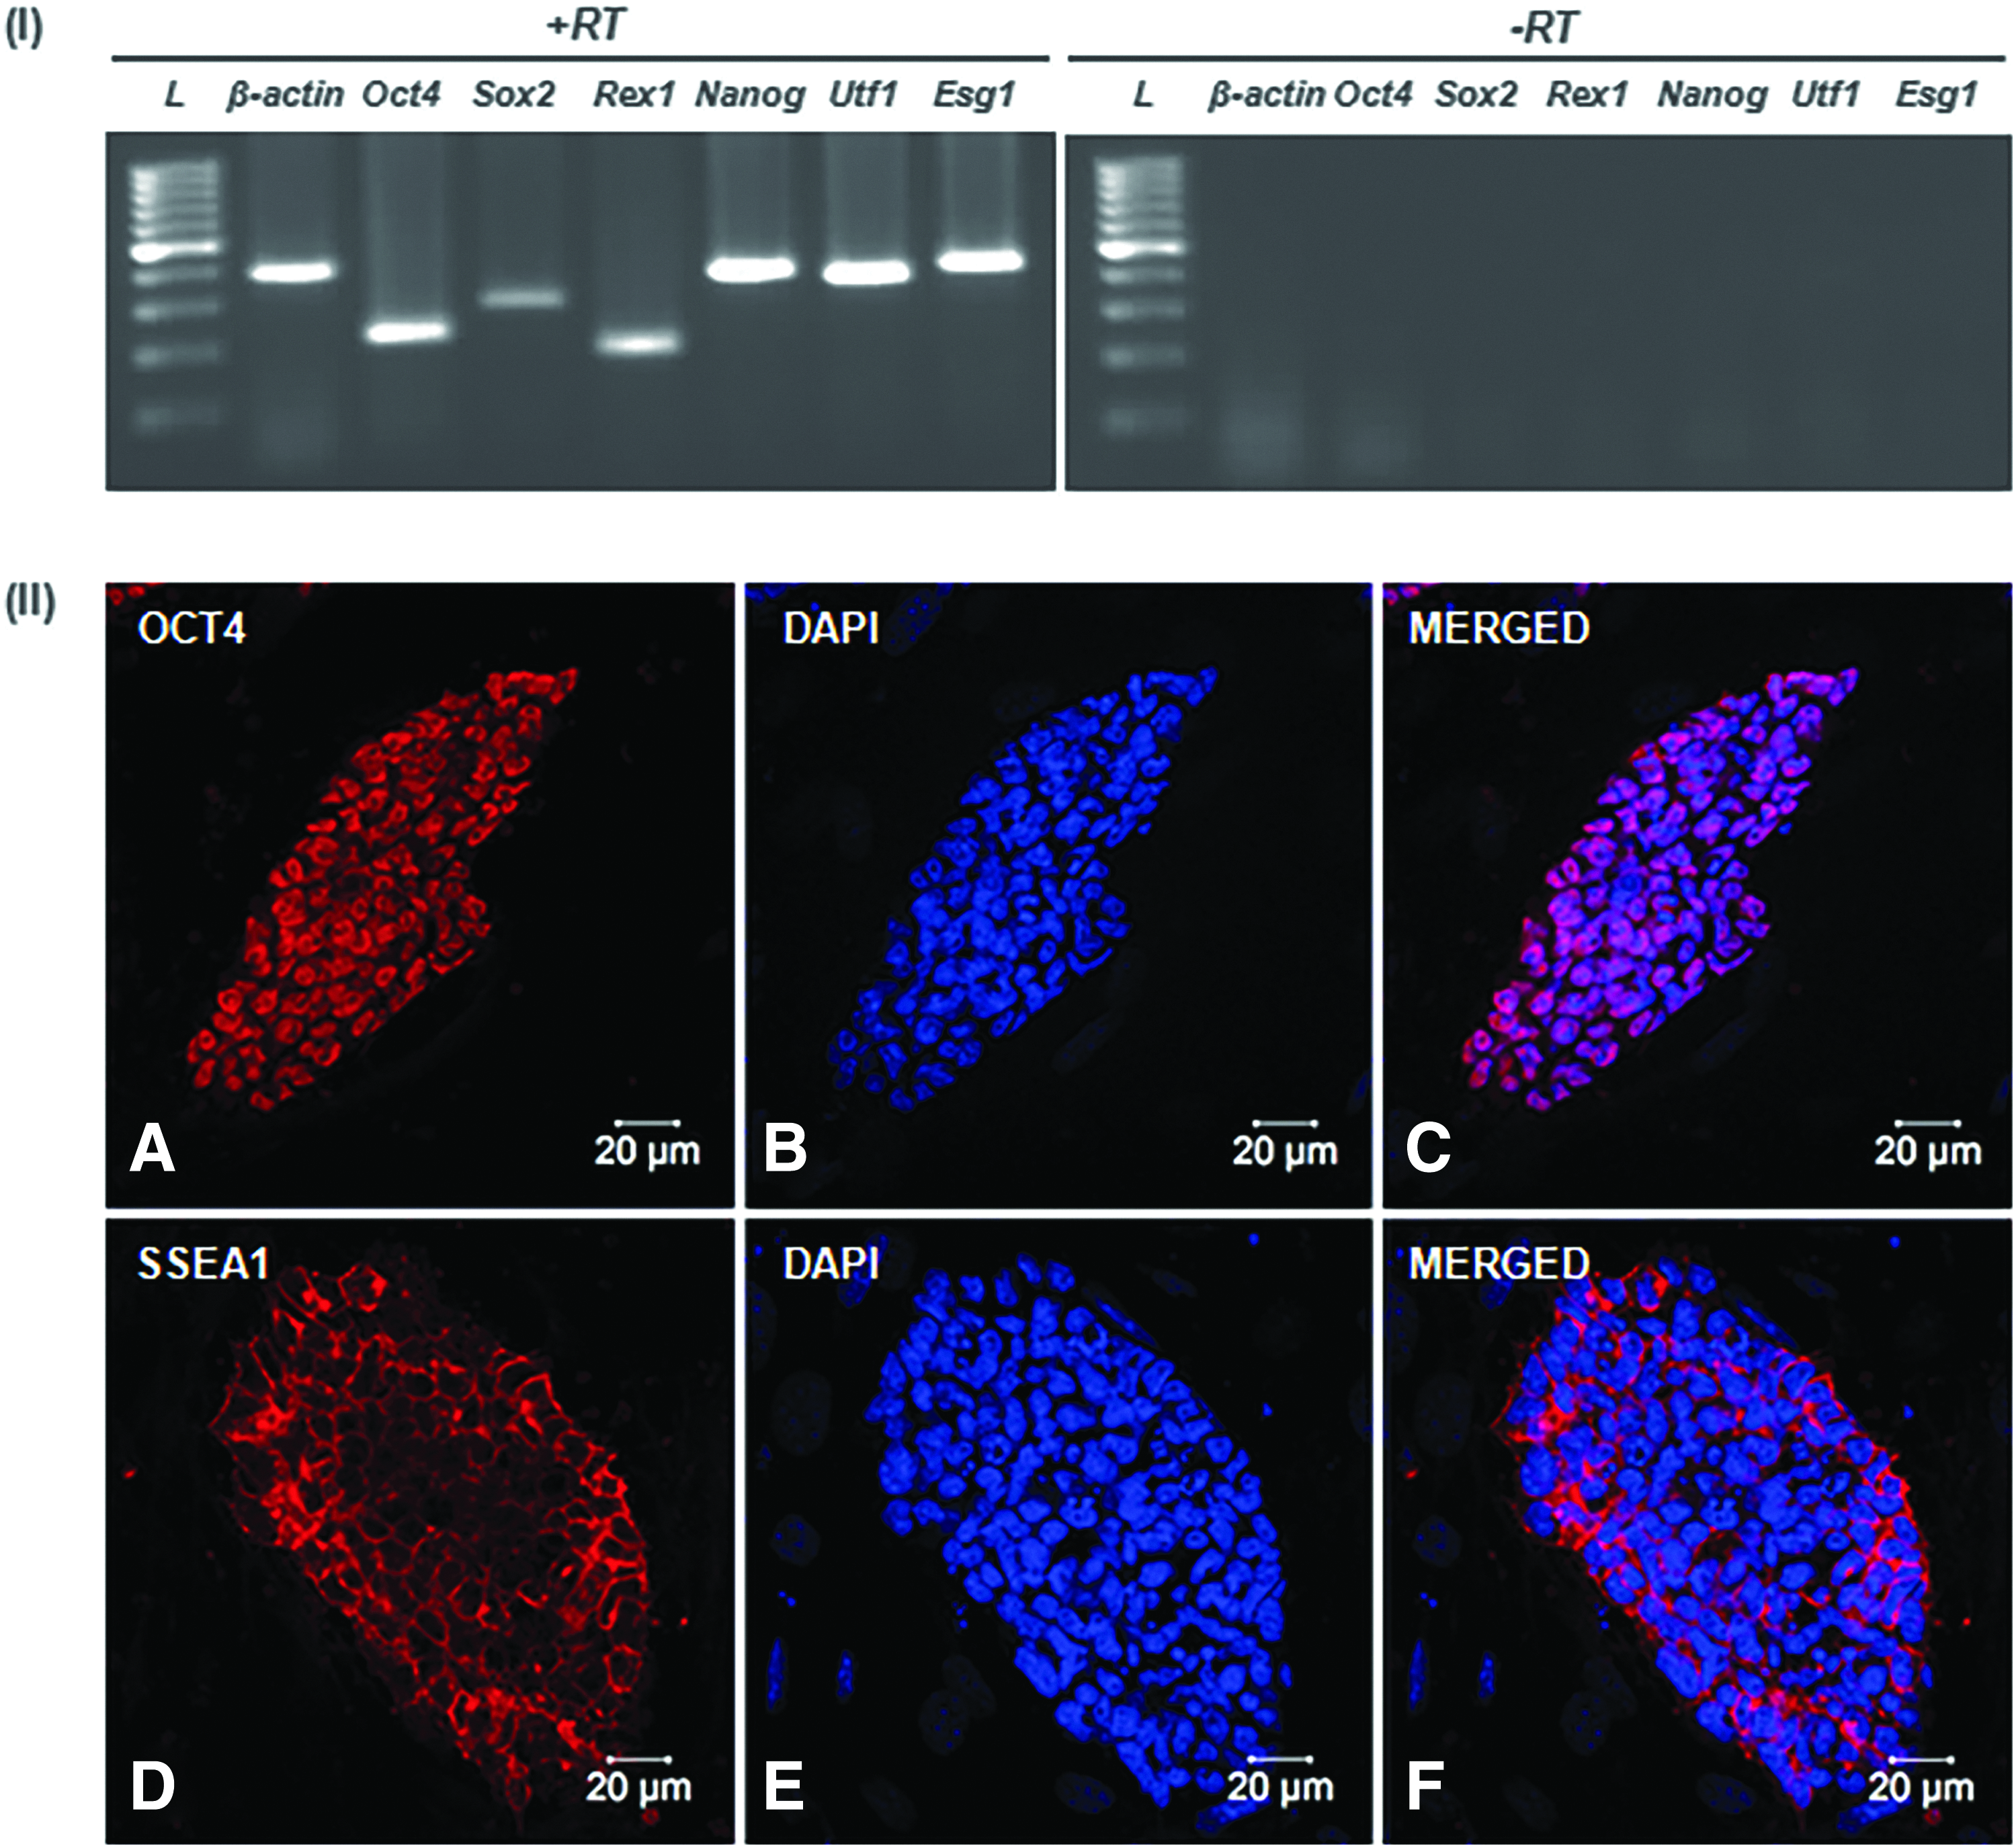
Expression analysis of pluripotency-associated genes in the N9 iPS cell line.
In vitro differentiation analysis of the N9 iPS cell line
The N9 iPS cell line exhibited excellent in vitro differentiation potential. EBs were generated in the serum-containing medium as well as serum-free KSR medium. All the EBs constitutively expressed EGFP (Fig. 4, IA–D and IIA–D). On day 5, EBs were plated on gelatin- or geltrex-coated cultureware. In both serum-containing and serum-free media, EBs exhibited extensive outgrowths post-attachment (Fig. 4, IE, IIE). In the serum-containing medium, EBs contained differentiated cell types derived from all the three germ lineages.
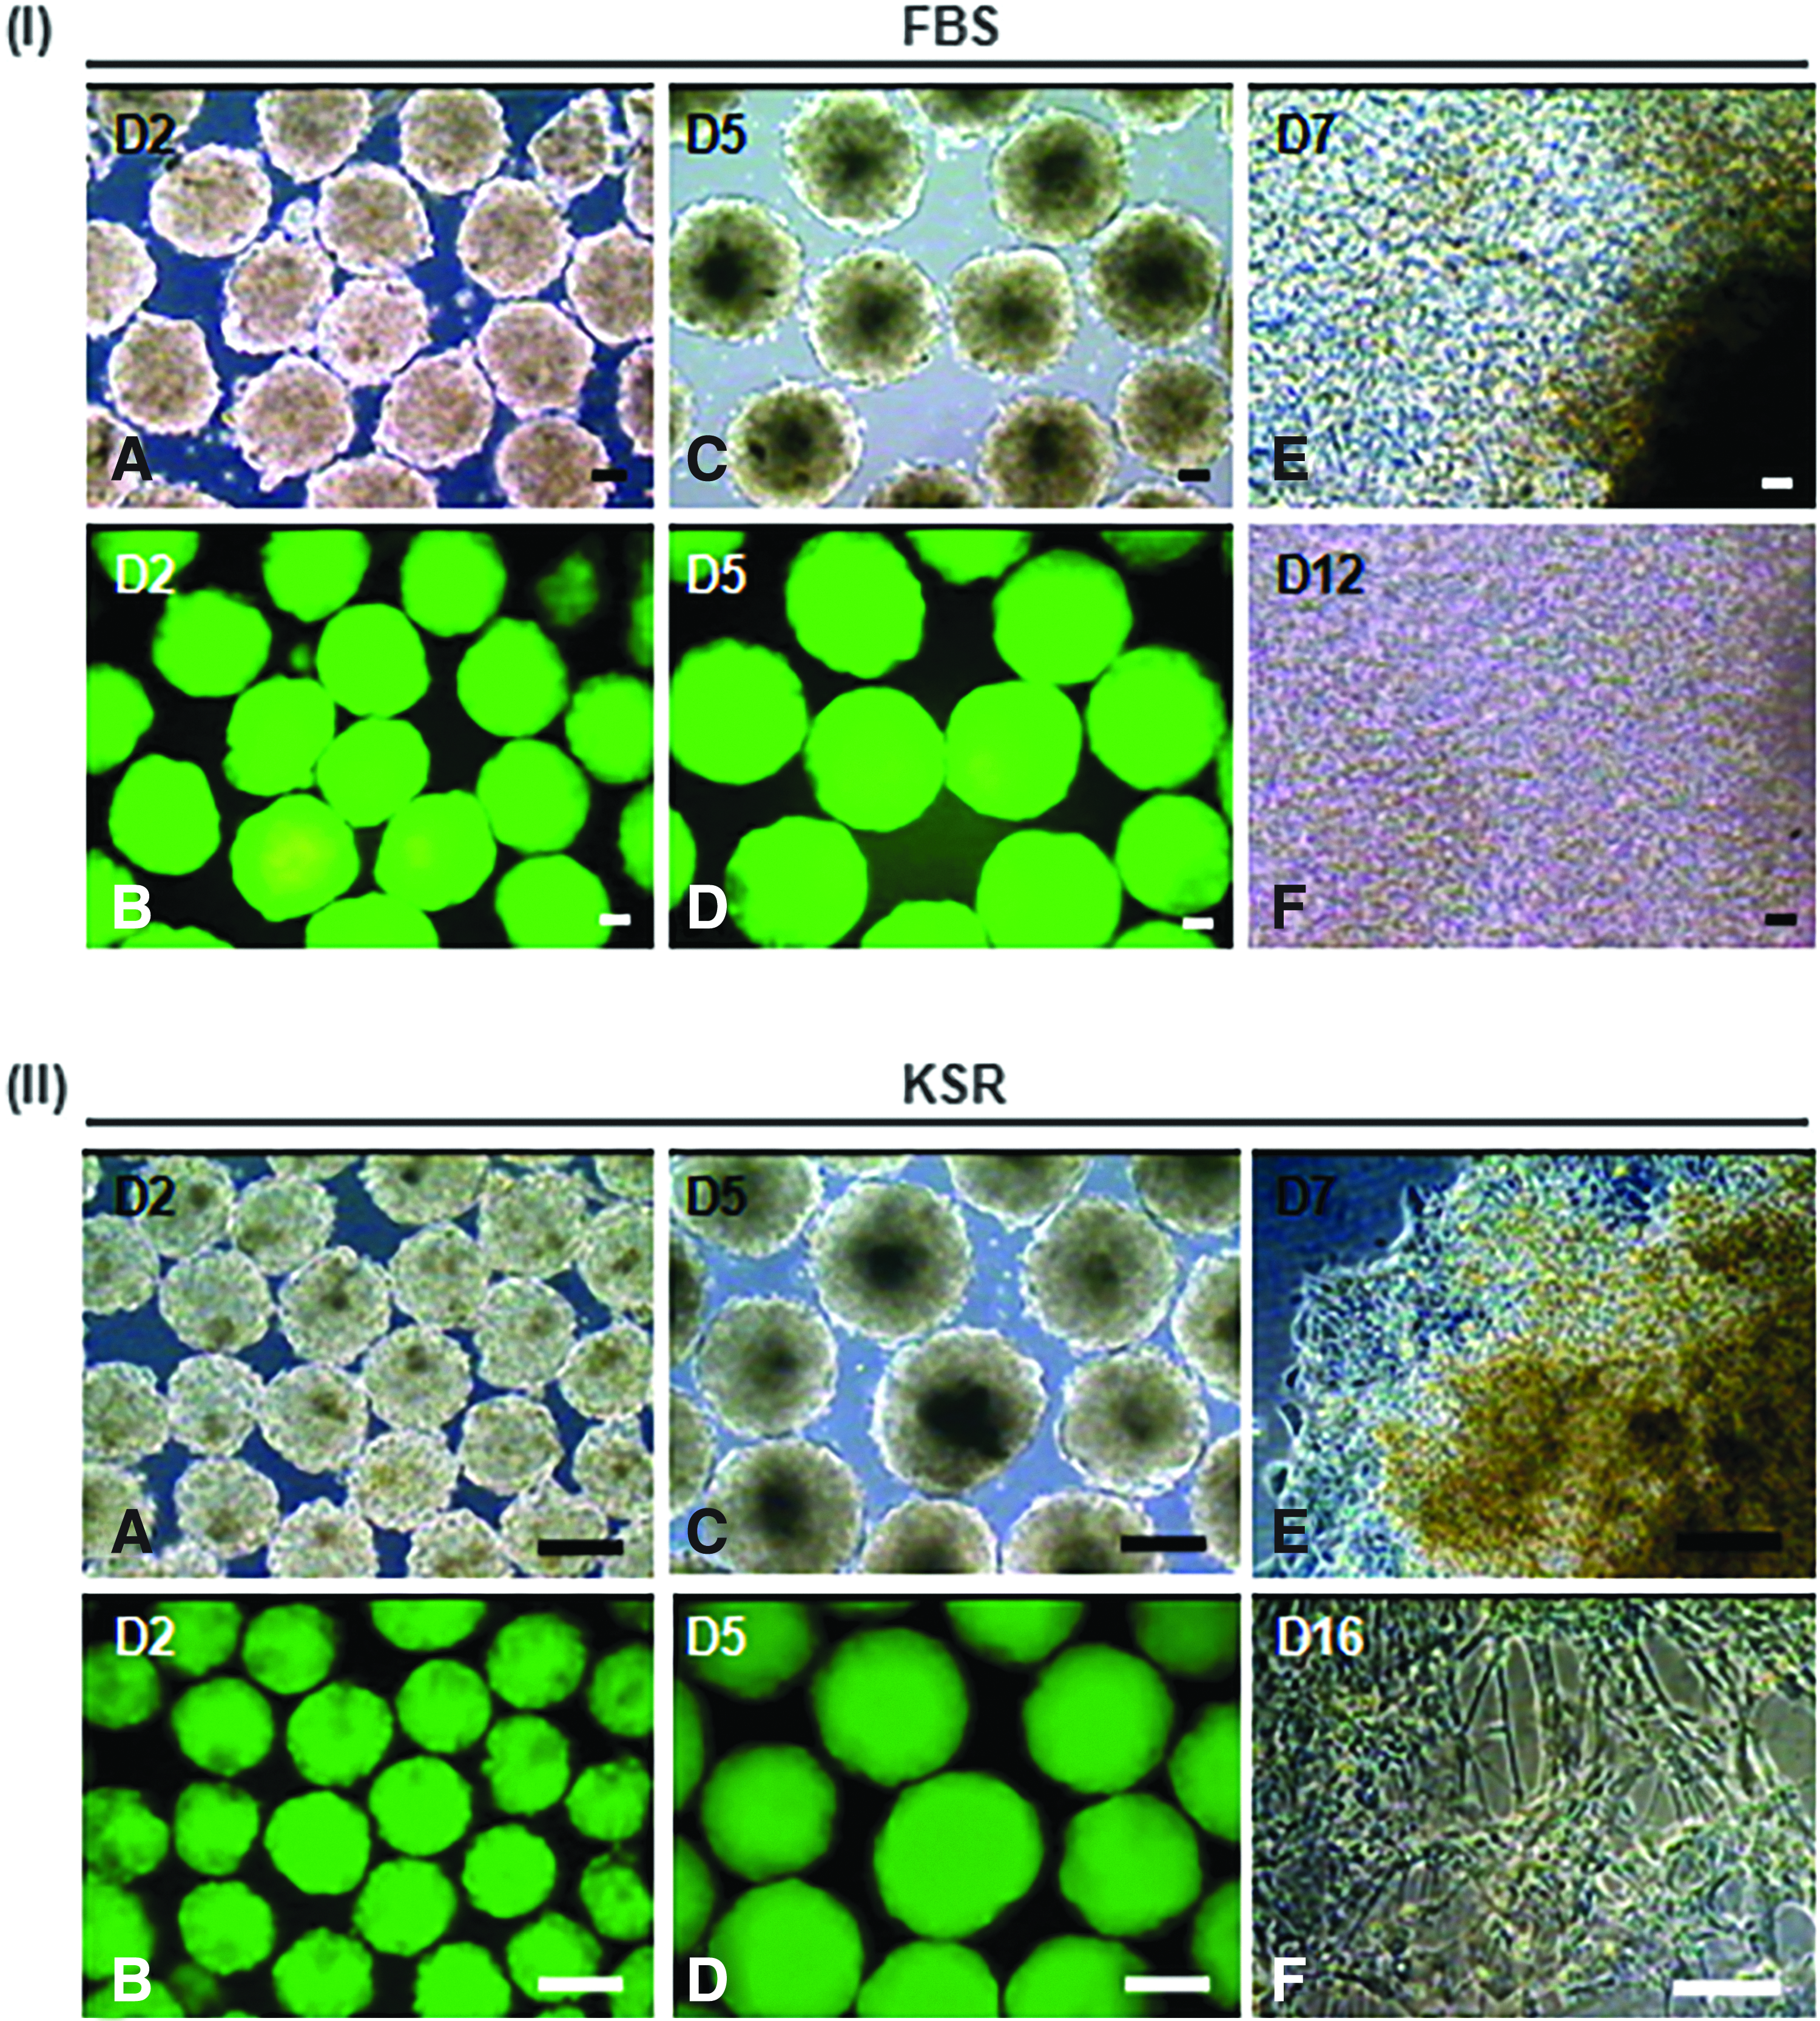
Morphological assessment of N9 iPS cell line-derived EBs and differentiated cells.
Interestingly, in the serum-containing medium, spontaneous differentiation to beating cardiac clusters was observed (Fig. 4, IF and Supplementary Videos S1 and S2). At defined time points of culture, EBs also produced ectodermally derived neural cells, mesodermally derived skeletal muscle tissues and osteoblasts, and endodermally derived hepatic and pancreatic cells (data not shown). On the other hand, in the KSR medium, EBs predominantly generated neural cells without the development of any beating cardiac cluster (Fig. 4, IIF). The morphological images of N9-derived EBs and neural cells shown here (Fig. 4, II) are from a set of experimental replicates that are independent and different from those reported by us earlier (Verma et al., 2017).
In addition, qPCR-based molecular phenotyping was performed during the differentiation of the N9 iPS cell line in the serum-containing medium (Fig. 5, I). In the serum-containing medium, the expression levels of stemness markers Oct4 (Fig. 5, IA), Sox2 (Fig. 5, IB), and Nanog (Fig. 5, IC) were observed to decrease as the culture proceeded from the undifferentiated state at day 0 to day 13 of EB development. On the other hand, the expression of three embryonic germ layer lineage-associated markers, that is, Nes for ectoderm (Fig. 5, ID), MyoD for mesoderm (Fig. 5, IE), and Afp for endoderm (Fig. 5, IF), increased as the culture progressed. Also, the expression of cardiac lineage-associated markers Brachyury (Fig. 5, IG), Gata4 (Fig. 5, IH), and Mlc2v (Fig. 5, II) increased as the days of differentiation progressed.
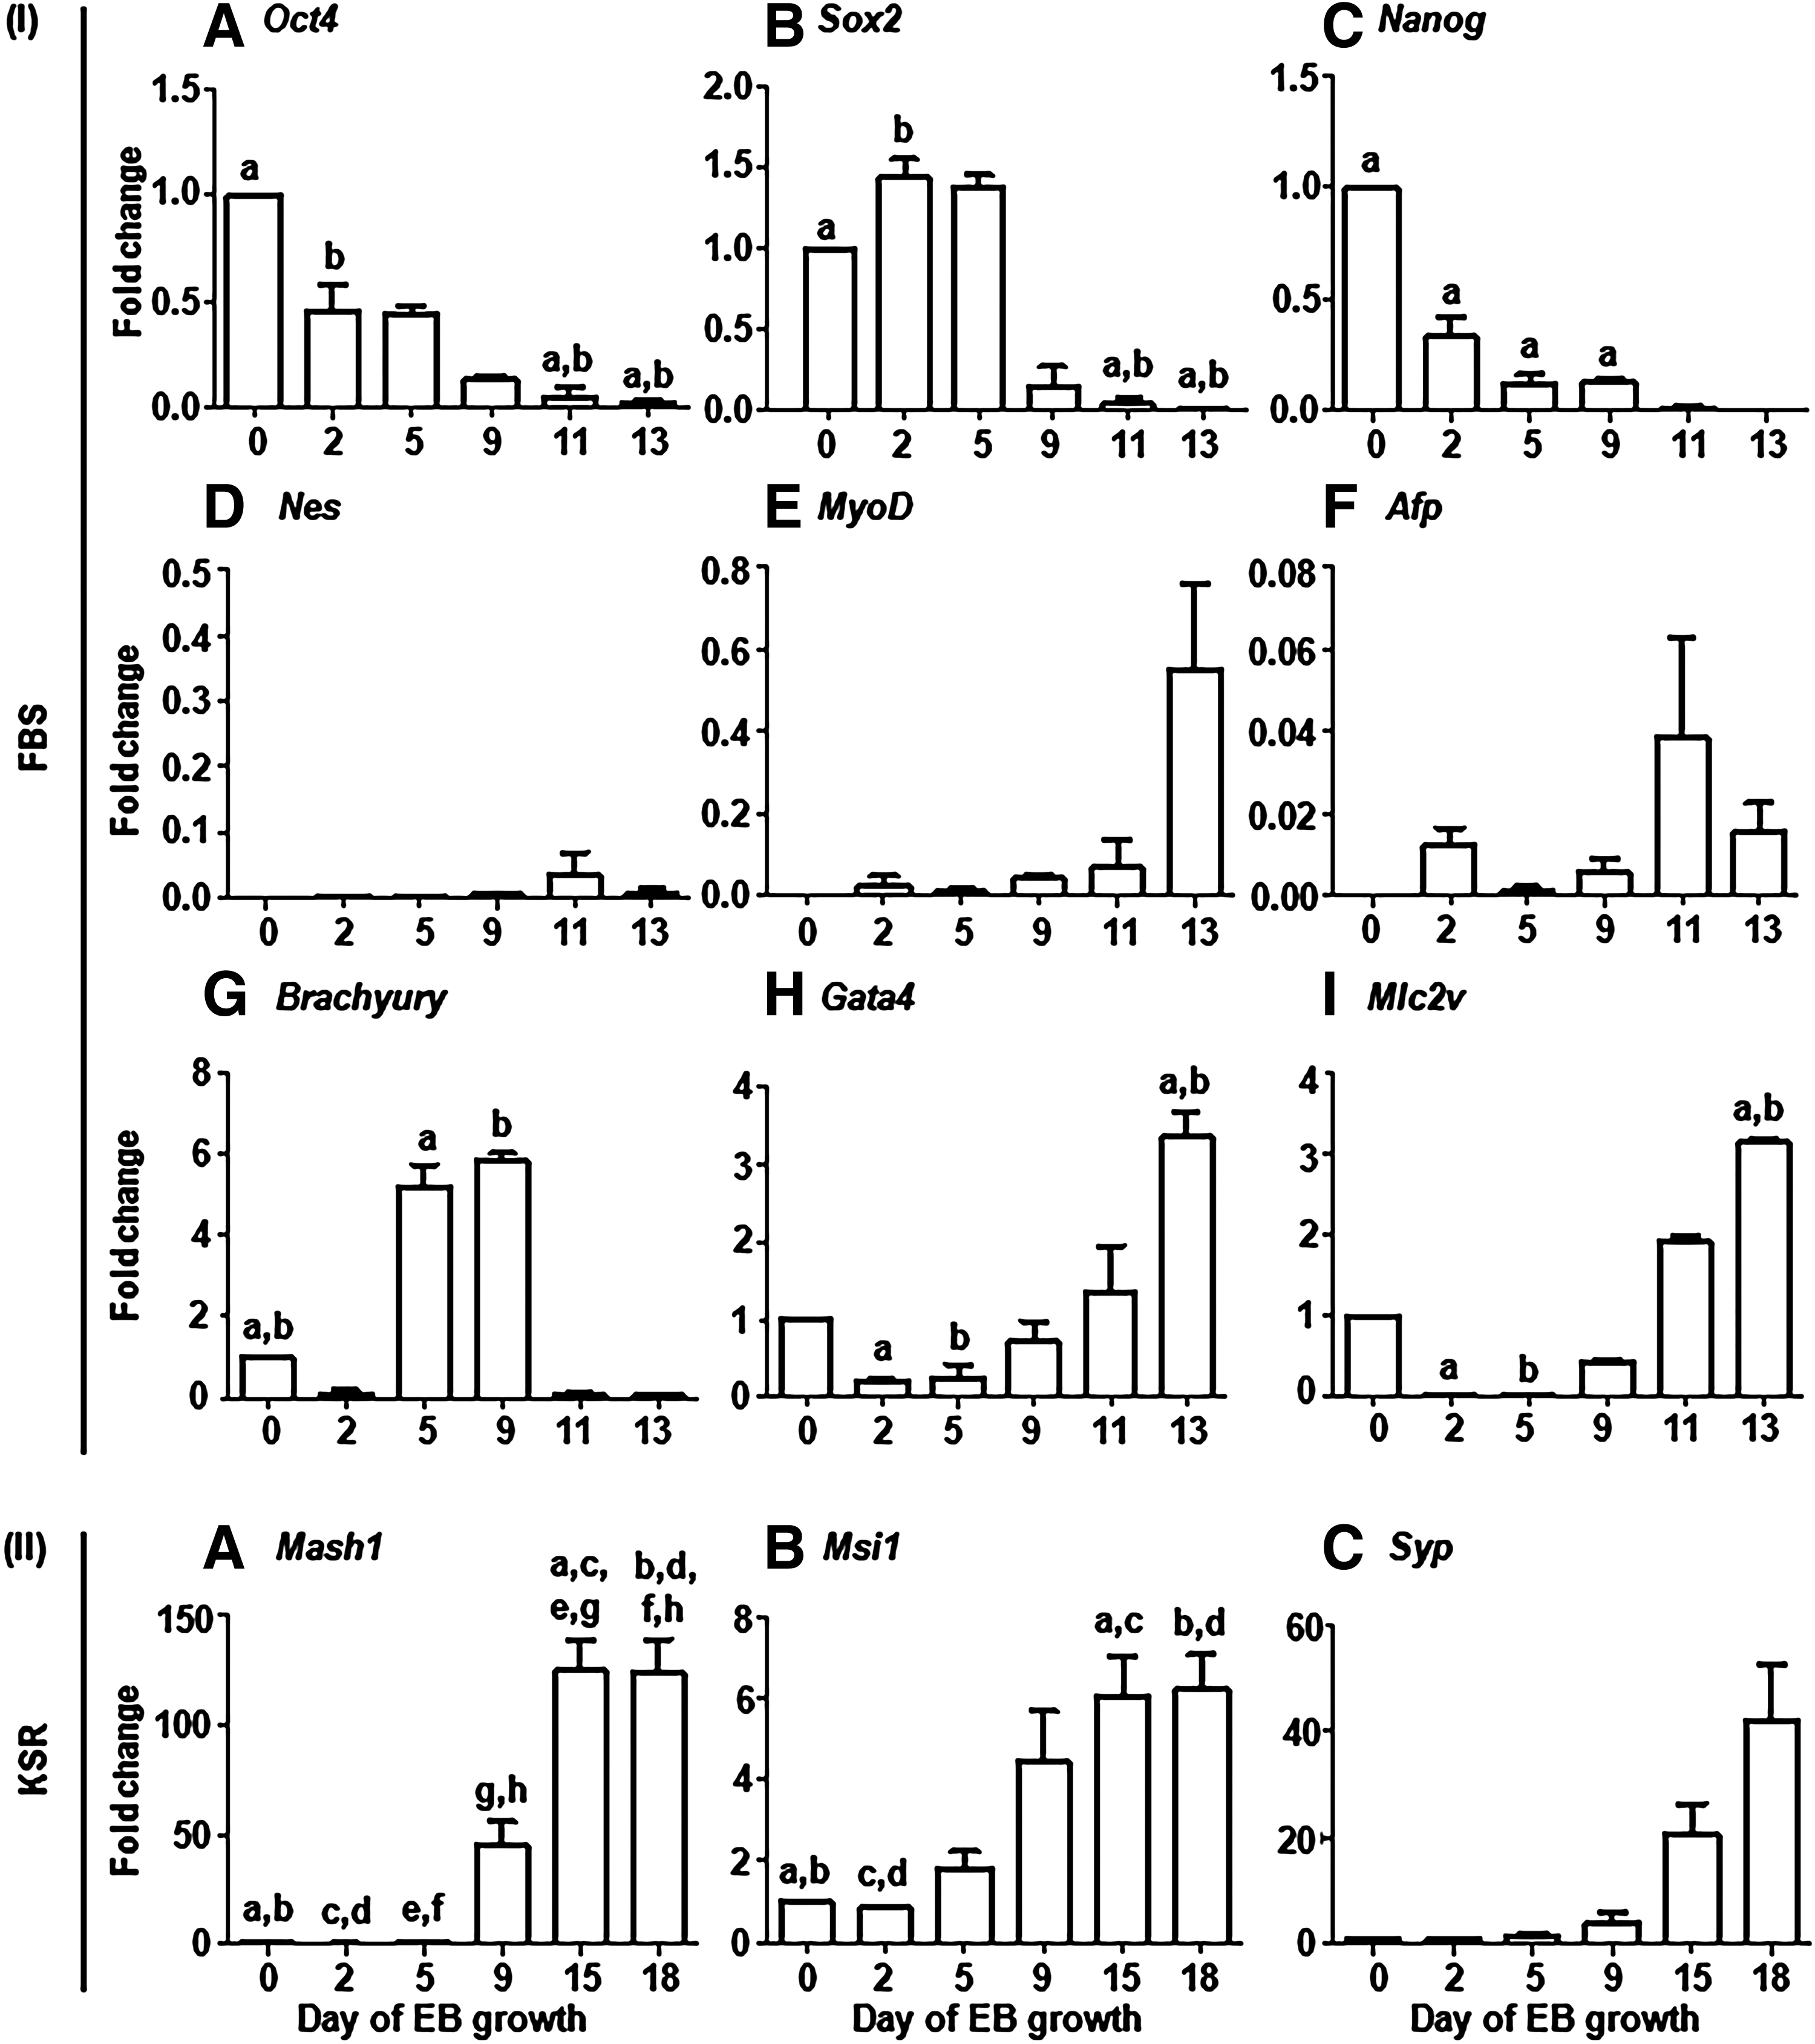
qPCR-based analysis of the expression of markers associated with pluripotency, three embryonic germ layer lineage differentiation, and cardiac and neural differentiation during the culture of N9 iPS cell line-derived EBs.
On the other hand, in the serum-free KSR medium, an increase in the expression of neural lineage-associated markers Mash1 (Fig. 5, IIA), Msi1 (Fig. 5, IIB), and Syp (Fig. 5, IIC) was observed. The generation of cardiomyocytes in the serum-containing medium was confirmed by positive staining for cTNI (Fig. 6, IA–D). In the serum-free KSR medium, staining was observed for NES-positive neural progenitors (Fig. 6, IIA–D), DCX-positive immature neurons (Fig. 6, IIE–H), TAU-positive mature neurons (Fig. 6, III–L), and GAD1-positive GABAergic neurons (Fig. 6, IIM–P). The immunostaining images of N9-derived neural cells shown here (Fig. 6, II) are from a set of experimental replicates that are independent and different from those reported by us earlier (Verma et al., 2017).

Immunocytochemical analysis of various cell types generated during the differentiation of the N9 iPS cell line.
For detailed characterization, spontaneous differentiation potential of the N9 iPS cell line to cardiac and neural lineages was quantitated. Vigorous beating clusters were observed from day 7 of EB culture. These clusters persisted for about a month of EB culture. More than 70% of the EBs consistently showed beating clusters, and the mean number of beating clusters per EB ranged from 1 to 6 with the average beating frequency ranging from 50 to 120 beats per minute (Fig. 7, I and Supplementary Videos S1 and S2).
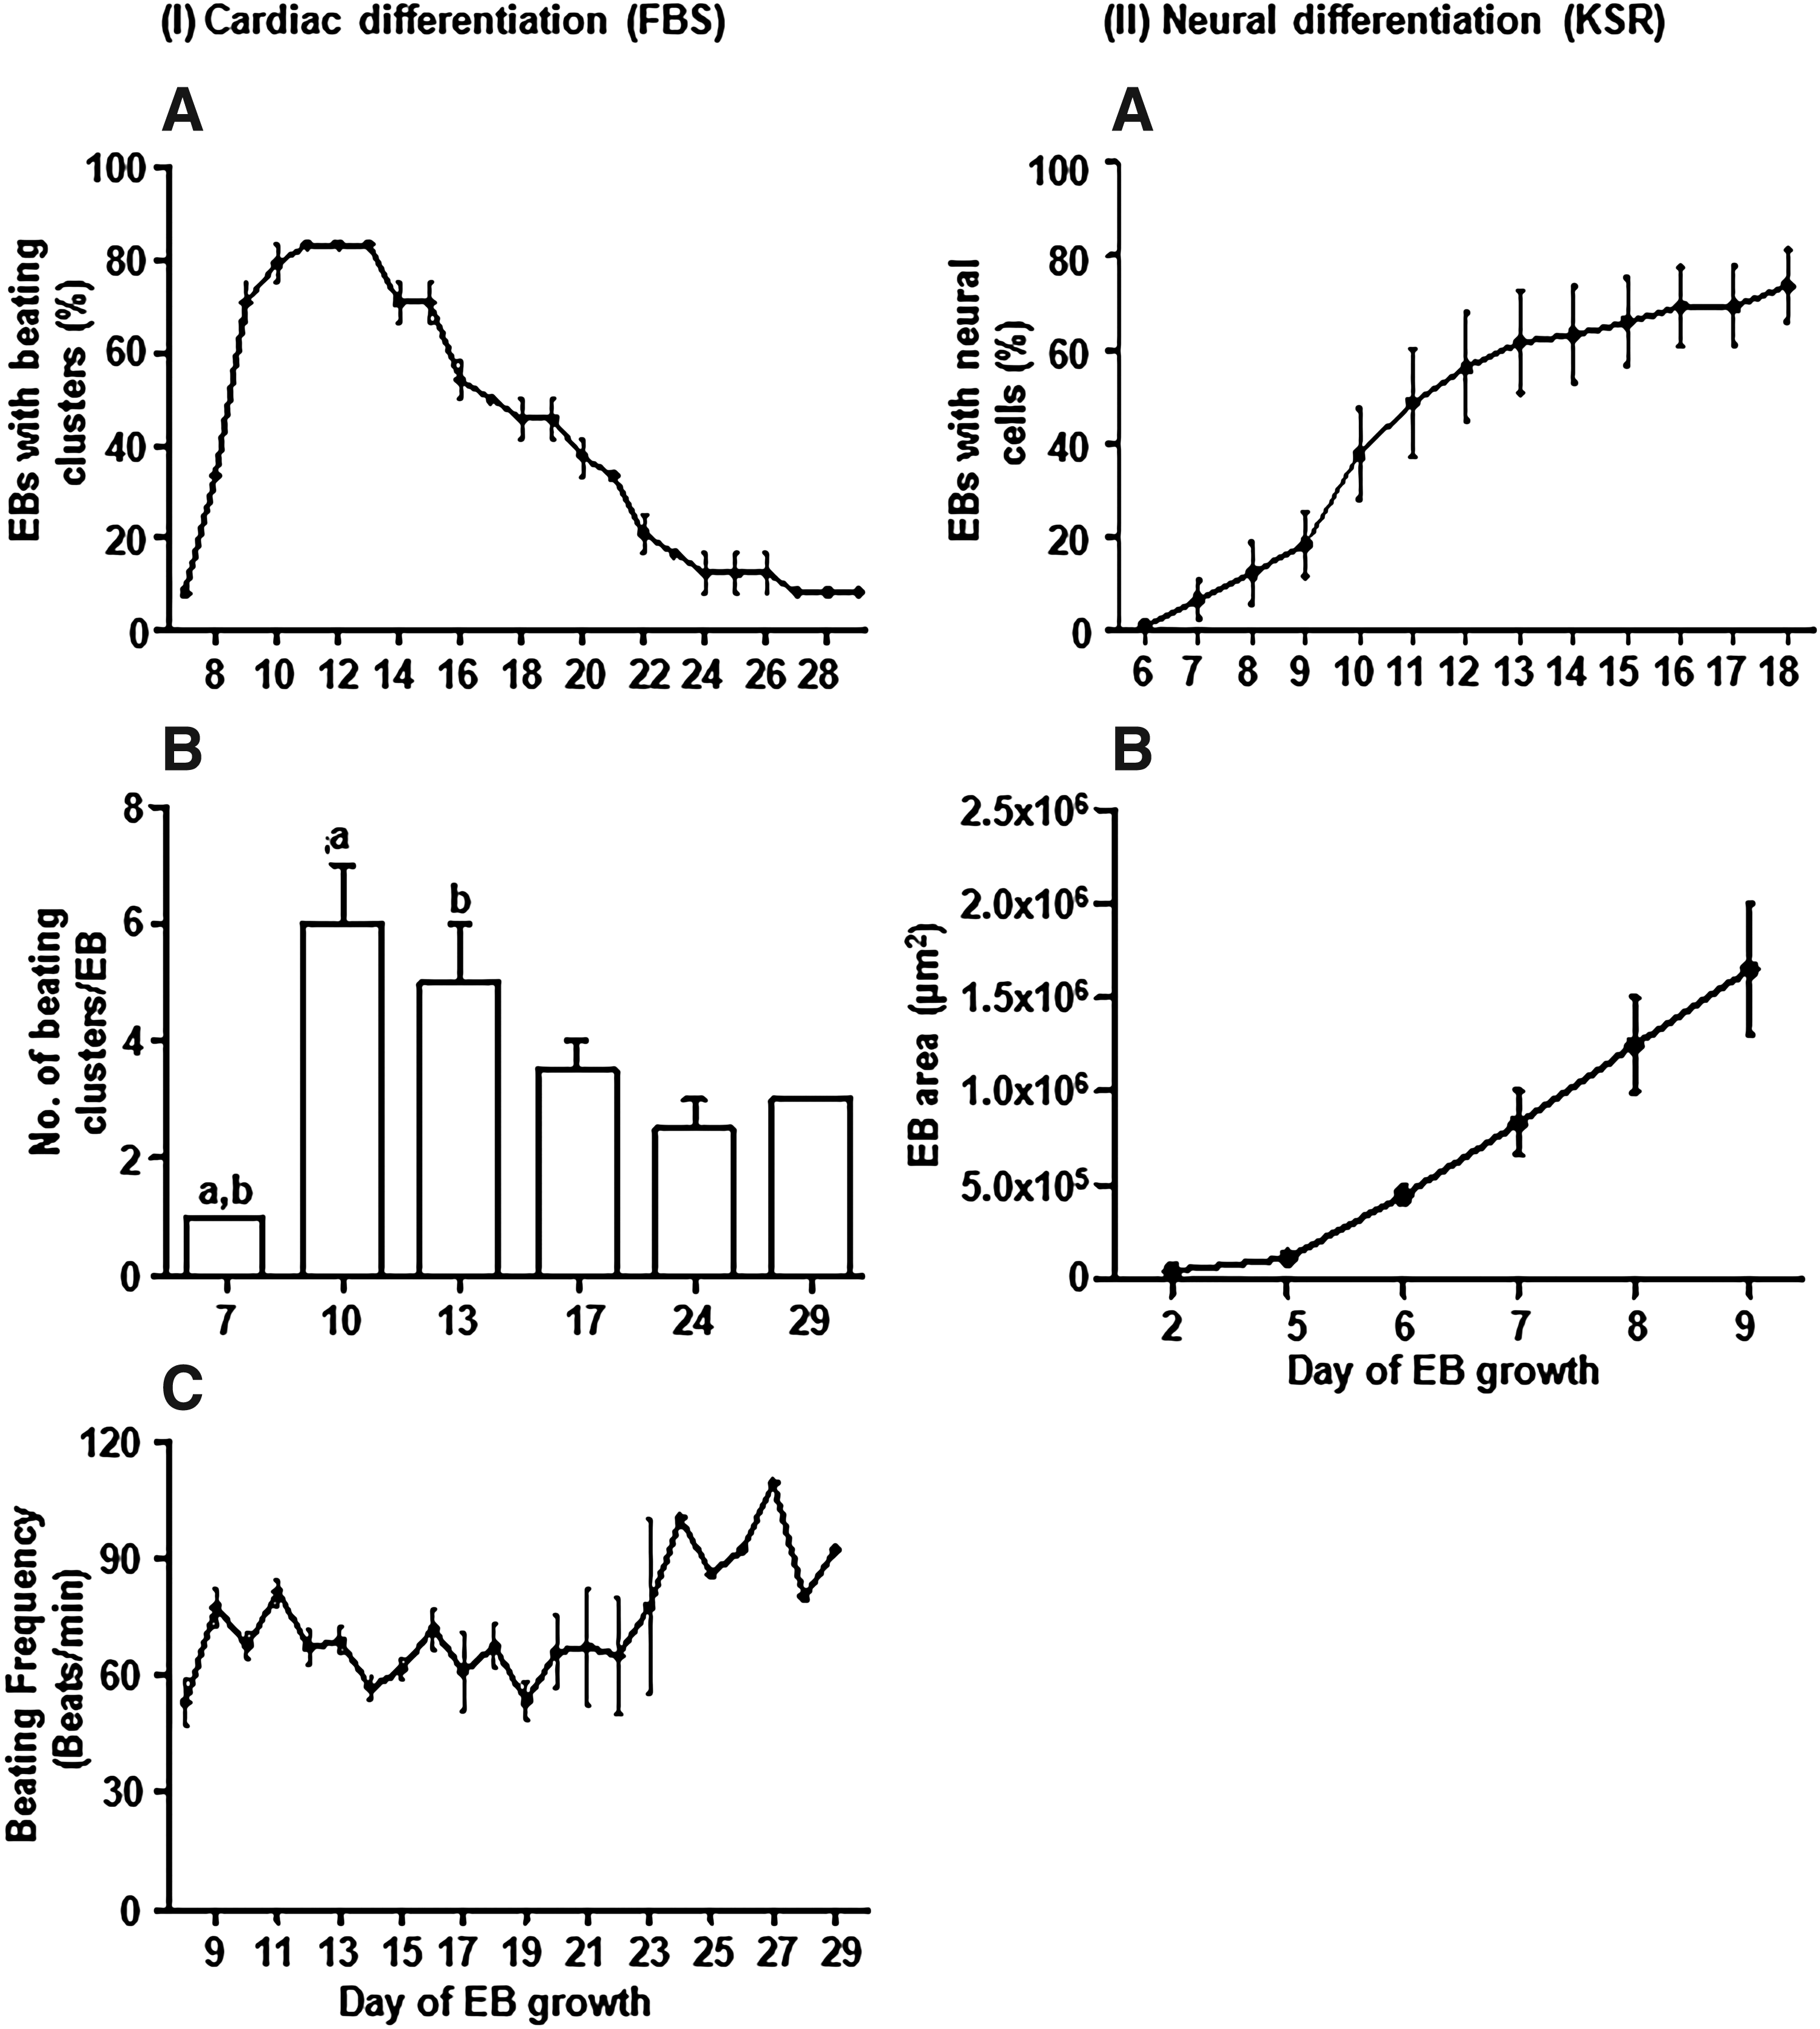
Quantitation of cardiac and neural cell differentiation profiles of the N9 iPS cell line.
In the serum-free KSR medium, neural cells started to appear around day 6 of differentiation and were present in about 74% of the EBs on day 18 of culture. Further, the area of EB outgrowth and the density of neural networks extensively increased with the progression of culture (Fig. 7, II). The neural cell differentiation profiles of the N9 iPS cell line shown here (Fig. 7, II) are from a set of experimental replicates that are independent and different from those reported by us earlier (Verma et al., 2017).
In vivo differentiation analysis of the N9 iPS cell line
Further, evidence of in vivo pluripotency of the N9 iPS cell line was obtained by generating well-formed teratomas after the subcutaneous injection of the N9 iPS cells into the nude mice. The generated teratomas measured about 2.54 × 2.36 cm. The HE staining of teratoma tissue sections revealed ectodermally derived epidermis (Fig. 8, IA) and neural tissue (Fig. 8, IB), mesodermally derived adipose tissue (Fig. 8, IC) and skeletal muscle (Fig. 8, ID), and endodermally derived gut epithelium (Fig. 8, IE) and respiratory ciliated epithelium (Fig. 8, IF).

In vivo developmental potential of the N9 iPS cell line.
The N9 iPS cells readily formed chimeric blastocysts on aggregation with wild-type CD-1 mice-derived noncompacted eight-cell stage embryos (Fig. 8, IIA). About 70% of aggregated embryos developed to generate chimeric blastocysts. The N9 iPS cells were exclusively observed as a part of the inner cell mass of the chimeric blastocysts (Fig. 8, IIB). These chimeric blastocysts were transferred to pseudopregnant CD-1 females. C-section observations on day 19 showed evidence for the presence of EGFP-positive cells at the implantation sites/fetal inclusions in the uterine horns of a few recipient females (data not shown).
Microarray-based gene expression profiling of the N9 iPSC line, GS-2 and D3 ESC lines, and MEFs
Using an oligonucleotide microarray, we compared the gene expression profiles of the N9 iPS cell line with GS-2 and D3 ES cell lines and MEFs. Hierarchical clustering was performed to compare overall transcriptome across different cell lines. The heat map was generated for signature genes of N9, GS-2, and D3 cell lines and MEFs (Fig. 9, I). The N9 iPS cell line showed 50 (18 upregulated, 32 downregulated), 138 (71 upregulated, 67 downregulated), and 636 (425 upregulated, 211 downregulated) DEGs when compared with GS-2 ES cell line, D3 ES cell line, and MEFs, respectively (Fig. 9, II).

Microarray analysis for comparison of the gene expression profiles of N9 iPS cell line with MEFs and D3 and GS-2 ES cell lines. ) and downregulated ( ) genes in the N9 cell line as compared with the GS-2 and D3 cell lines and MEFs
  ), GS-2 (
 ), D3 (
 ), and MEFs (
 ). ES, embryonic stem. Color images are available online.
Therefore, the analysis demonstrated that the whole transcriptome profile of the N9 cell line was more similar, but not identical, to the GS-2 cell line as compared with the D3 cell line and MEFs. The higher similarity between transcriptional profiles of N9 and GS-2 cell lines might be due to their similar genetic backgrounds. The 18 genes that showed upregulation in the N9 cell line as compared with the GS-2 cell line included Nr1h5, U1, Tdpoz3, and Nlrp4a; whereas the 32 genes that showed downregulation in the N9 cell line as compared with the GS-2 cell line included Efhc2, Scml2, Pramel3, Calcoco2, Cubn, Daz1, Zfp951, Mme, Asz1, Slc13a5, and Mael.
The microarray analysis also identified 5 genes, including Cubn, Zfp951, 1700018B24Rik, Slc13a5, and Mael, which were commonly upregulated in GS-2 and D3 ES cell lines as compared with the N9 iPS cell line. Similarly, 18 genes were commonly downregulated in GS-2 and D3 ES cell lines as compared with the N9 iPS cell line; these genes included Nr1h5, U1, Tdpoz3, and Nlrp4a (Supplementary Table S5).
The microarray analysis also demonstrated 211 genes that were commonly upregulated in N9, GS-2, and D3 cell lines as compared with MEFs. These genes included pluripotency-associated genes such as Oct4, Rex1, Nanog, Utf1, and Esg1 (Supplementary Table S5). For further analysis, the average expression values of these genes were compared. The pluripotency-associated genes were expressed at similar levels in N9, GS-2, and D3 cell lines, hence confirming the pluripotent nature of the established N9 iPS cell line (Fig. 9, III). Also, 135 genes, including Mecom, Foxd1, Fabp7, Tgfbi, Tgfb2, Tgfbr2, Igf2, Ngf, Fzd2, Hoxa6, Xist, Col11a1, Fgf7, Igsf10, and Nes, were commonly downregulated in N9, GS-2, and D3 cell lines as compared with MEFs (Supplementary Table S5). Taken together, our data indicated that the iPS and ES cell lines were similar but not identical.
In addition, the genes that were commonly upregulated or downregulated in N9, GS-2, and D3 cell lines as compared with MEFs were categorized into different biological processes. The top biological processes of the genes commonly upregulated in N9, GS-2, and D3 cell lines as compared with MEFs included negative regulation of cell differentiation, regulation of RNA metabolic process, regulation of transcription, and negative regulation of macromolecule metabolic process. On the other hand, the top biological processes of the genes commonly downregulated in N9, GS-2, and D3 cell lines as compared with MEFs included skeletal system development, embryonic morphogenesis, heart development, extracellular matrix organization, chordate embryonic development, and pattern specification process (Supplementary Tables S6 and S7).
Discussion
Using a Yamanaka factors-based approach (Takahashi and Yamanaka, 2006), we derived an EGFP-expressing permanent N9 iPS cell line from the MEFs of the nonpermissive homozygous EGFP-transgenic FVB/N mouse (Devgan et al., 2003). The N9 iPS cell line exhibited all the defining criteria of a typical mouse PSC line. Using the standard ES cell derivation conditions, this cell line (i) was successfully derived from the EGFP-transgenic FVB/N mouse strain, a genotype known to be highly refractory for ES cell derivation (Singh et al., 2012), (ii) expressed EGFP constitutively, and (iii) used human transgenes for reprogramming.
On similar lines, other reported successful derivation of PSC lines from the FVB/N genetic background include our GS-2 ES cell line generated via a hybrid between FVB/N and 129/SvJ strains (Singh et al., 2012), and the iPS cell line generated by reprogramming of FVB/N fibroblasts by using protein-based reprogramming factors (Cho et al., 2010).
Earlier, a transgenic mouse iPS cell line with a Nanog reporter-driven GFP was derived from fibroblasts by using the Yamanaka factors minus c-myc (Nakagawa et al., 2008); however, this cell line expectedly would cease to express GFP after its differentiation. Such GFP-transgenic cell lines are unsuitable for long-term fluorescence-based cell tracking studies (Shao et al., 2009). In view of this, the N9 iPS cell line would be superior to other GFP-expressing iPS cell lines because EGFP is constitutively expressed under the chicken β-actin promoter.
Therefore, our successful derivation of a transgenic iPS cell line by employing Yamanaka factors (Takahashi and Yamanaka, 2006) is a significant achievement as far as the derivation of PSC lines from nonpermissive mouse strains is concerned. In addition, this cell line was derived by using the standard ES cell culture medium in the presence of LIF, without the addition of any pathway inhibitor, serum replacement medium, or RESGRO™ medium (Davies and Fairchild, 2012; Garbutt et al., 2018; Schoonjans et al., 2003; Singh et al., 2012).
In the past couple of years, various viral-free approaches involving plasmids, transposons, and small molecules have been used for reprogramming. But, these approaches have yielded low efficiencies and slow reprogramming kinetics (Huangfu et al., 2008; Kaji et al., 2009; Okita et al., 2008). Depending on the parent cell type and method of reprogramming used, the iPS cell line derivation efficiency has been low (∼0.01%) (Maherali et al., 2008). Also, the reprogramming time has been about a month (Stadtfeld and Hochedlinger, 2010). In this study, the lentiviral transduction-mediated approach and careful selection and picking of proliferating clones that showed properties similar to ES cell colonies attributed to the successful establishment of the N9 iPS cell line.
The N9 iPS cell line exhibited a high proliferation rate and formed thousands of healthy colonies during expansion. We continuously observed robust and excellent in vitro and in vivo differentiation of the N9 iPS cell line to differentiated cell types representative of three embryonic germ lineages. This included the generation of functional and vigorously beating cardiomyocytes that persisted close to a month in the culture. One of the remarkable features of differentiation of the N9 iPS cell line was the predominant generation of neural cells when the EBs were cultured in the serum-free KSR medium. This observation has been previously reported for the N9 as well as GS-2 and D3 cell lines (Singh et al., 2012; Verma et al., 2017).
In addition, the N9 iPS cell line showed a transcriptome profile much more similar to GS-2 and D3 ES cell lines as compared with MEFs. The comparative global gene expression profiles of mouse ES and iPS cell lines are yet to be ascertained for many cell lines. Human ES and iPS cell lines have similar global gene expression profiles. But, it was also found that a set of genes were differentially expressed in iPS cells, akin to the starting fibroblasts (Narsinh et al., 2011). Hence, it is possible that the gene expression profile fingerprints could be PSC line dependent. A similar observation was made in this study, where on performing a detailed comparative global gene expression profiling, a greater overlap was observed between the N9 and GS-2 cell lines as compared with the N9 and D3 cell lines.
Our EGFP-transgenic N9 iPS cell line provides an unlimited source of intrinsically EGFP-labeled progenitors and differentiated cells including cardiac and neural cells. It is envisaged that the N9 iPS cell line will be of enormous application in a variety of developmental studies. In view of its intrinsic green fluorescence, which could be monitored noninvasively in a spatiotemporal manner, the N9 iPS cell line could be an excellent model system to track cell differentiation post-transplantation in the recipient. This will help in understanding the mechanisms of homing and structural and functional integration of differentiated cell types in the recipient. Of significance in this study is the use of human OSKM transgenes for mouse somatic cell reprogramming, thereby facilitating the development of a humanized mouse cell culture model for studying human disease(s) (Friese et al., 2006).
Conclusions
In conclusion, our study, for the first time, documents the successful derivation of an EGFP-transgenic iPS cell line from MEFs of a genetically nonpermissive FVB/N mouse strain by lentiviral transduction using human OSKM transgenes. A similar strategy could be employed for the generation of iPS cell lines from other nonpermissive mouse strains. This cell line could be of immense and versatile use for stem cell-based developmental and differentiation studies, including cardiac and neural differentiation, and experimental cell transplantation studies employing suitable rodent models.
Footnotes
Acknowledgments
The authors thank Life Technologies (Invitrogen) for providing viral transduction reagents for gratis, Prof. P.N. Rangarajan for his help in providing the infrastructure for carrying out lentiviral transduction experiments, Dr. P.W. Andrews for providing the SSEA1 antibody, Dr. A. Wobus for providing the D3 ES cell line, and Dr. J.A. Thomson for interpretation of HE-stained teratoma tissue sections. D.S.C. and K.K.A. are thankful for the support by the Department of IT, BT, and S&T, Govt. of Karnataka.
Authors' Contributions
D.A. and G.S. were involved in the derivation, characterization, and maintenance of the N9 iPS cell line and its cardiac differentiation experiments. I.V. conducted neural differentiation experiments of the N9 iPS cell line. S.D. and U.K. were involved in viral transduction and clonal propagation during the derivation of the N9 iPS cell line. M.C.V. was involved in designing and conducting the microarray experiment. D.S.C. and K.K.A. were involved in bioinformatical analysis of the microarray data. D.A., G.S., I.V., and P.B.S. were involved in the designing of all experimental strategies. D.A. and P.B.S. wrote the original article draft and later, G.S. and I.V. supplemented in the article preparation. All the authors read and approved the final draft of the article for submission.
Author Disclosure Statement
The authors declare that no conflicting financial interests exist.
Funding Information
This work was supported by funds from Department of Biotechnology-Indian Institute of Science partnership program (grant no. 22-0307-0018-05-469), Government of India.
References
Supplementary Material
Please find the following supplemental material available below.
For Open Access articles published under a Creative Commons License, all supplemental material carries the same license as the article it is associated with.
For non-Open Access articles published, all supplemental material carries a non-exclusive license, and permission requests for re-use of supplemental material or any part of supplemental material shall be sent directly to the copyright owner as specified in the copyright notice associated with the article.